Introduction
In the 1920s, the Nobel Prize winner Otto Warburg
observed a marked increase in glycolysis and enhanced lactate
production in tumor cells even when maintained in conditions of
high oxygen tension (termed Warburg effect), leading to widespread
concerns about the metabolic changes in human types of cancer
(1). Either as a consequence or as
a cause, alterations of cancer cell-intrinsic metabolism have been
considered as essential hallmarks of cancer. Among these metabolic
changes, de novo fatty acid biosynthesis was found elevated
in the majority of human types of cancer, such as prostate
(2), colorectal (3), ovarian (4), bladder (5), esophageal (6), gastric (7), lung (8), endometrial (9), breast (10) and soft tissue sarcomas (11). Fatty acid synthase (FASN) is
regarded as a key regulator of de novo fatty acid synthesis
and was widely found upregulated in a wide variety of human
malignancies and their pre-neoplastic lesions. Recent studies also
reveal that FASN is associated with the stage of cancer and
indicate a poor prognosis (12).
Thus, FASN could be considered as a reliable predictor of
recurrence and disease-free survival along with neo-plastic stage
(13). In vivo treatment
with inhibitors of FASN has been proven to lead to markedly
decreased survival in human cancer xenografts (14) and silencing of the FASN gene by
siRNA also inhibits cancer cell growth and ultimately induces
cancer cell apoptosis (15).
Therefore, agents that inhibit FASN and the de novo
fatty-acid synthesis pathways could be considered as novel
antitumor strategies.
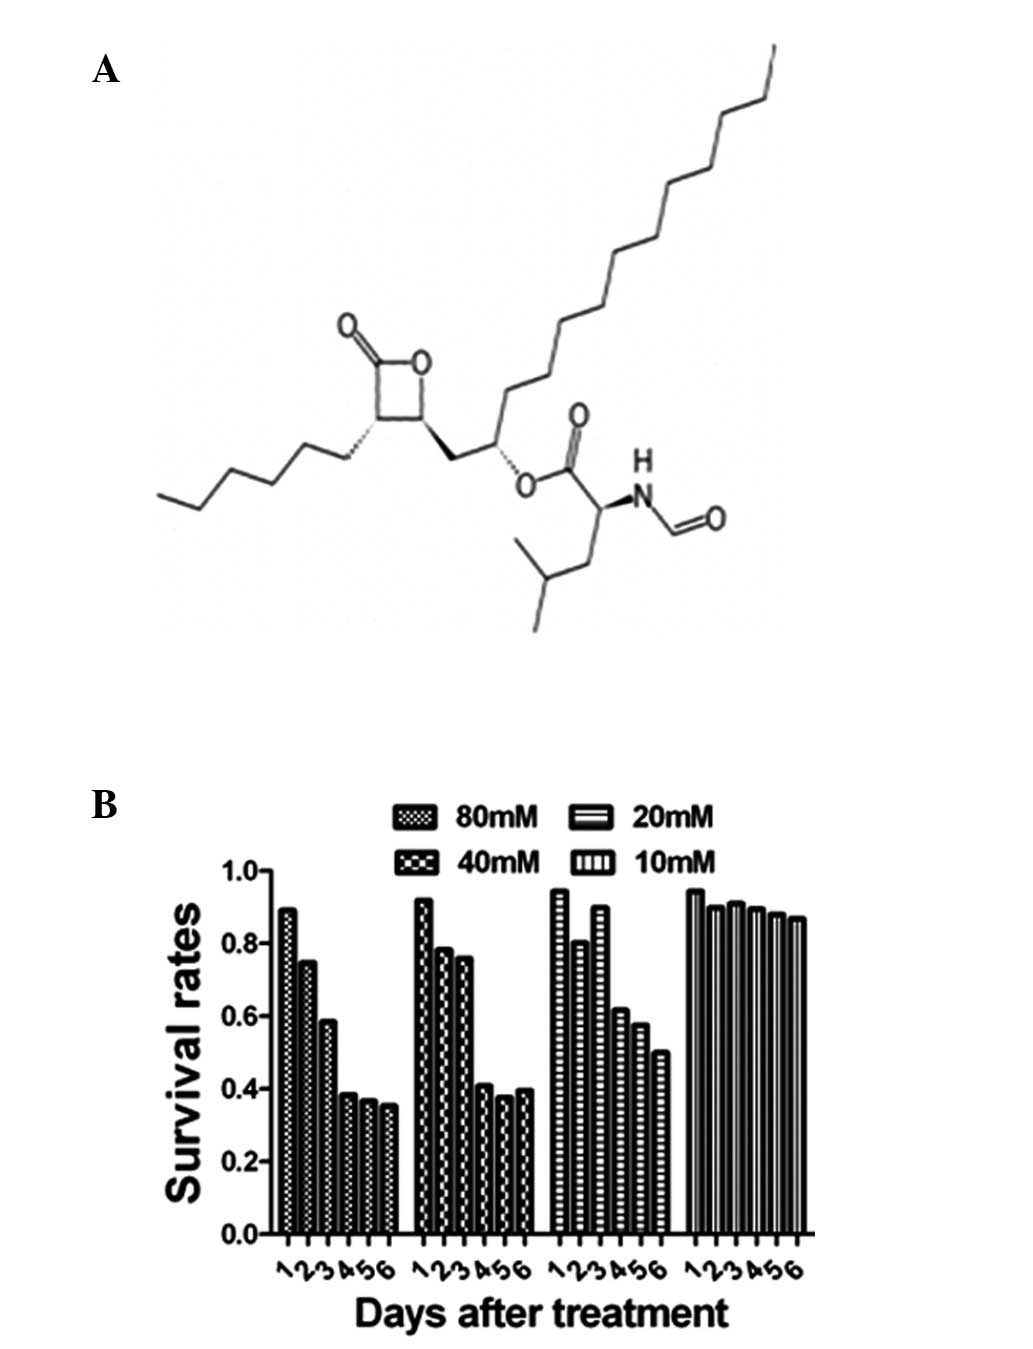
Orlistat, an anti-obesity drug approved by the US
Food and Drug Administration, which possesses extremely low oral
bio-availability (16), exhibits
anti-proliferative and anti-tumor properties against prostate and
breast cancer cells due to its ability to block the lipogenic
activity of FASN (16), by acting
on the 2.3-A-resolution crystal structure of the thioesterase
domain of FASN (17). Orlistat
negatively influences FASN activity and has a significant effect on
the antitumor activity by inducing remarkable diversification such
as a complete G2-M phase loss, S-phase accumulation and the
emerging sub-G1 (apoptotic) cell increase, and repression of the
promoter activity of Her2/neu gene (18).
Ovarian cancer is the most common malignancy of the
female reproductive tract and is the leading cause of death from
gynecologic types of cancer; it is currently the fifth leading
cause of female cancer-related mortality (19). Finding a novel therapeutic approach
is essential since the 5-year survival rate of women with ovarian
cancer is low, despite the fact that significant progress has been
made in the therapy of this disease (20).
2-DE based proteomics has been shown to be a
powerful tool in rapidly profiling differentially expressed
proteins associated with a number of diseases (21–23).
In our study, we aimed to investigate the differential expression
in Orlistat-treated SKOV3 cells using a 2DE-MS-based proteomics
approach, in order to better understand the molecular mechanisms
underlying Orlistat-induced tumor repression. In total, more than
110 differentially expressed proteins were found altered between
Orlistat-treated and untreated SKOV3 cells, and subsequently 71
proteins were identified by MS analysis. Furthermore, we showed
that PKM2 was significantly down-regulated in Orlistat-treated
SKOV3 cells, which confirmed the antitumor properties of Orlistat,
indicating that Orlistat can be used as a novel adjuvant antitumor
agent for ovarian cancer patients.
Materials and methods
Cell culture and treatment
The human epithelial serous cystadenocarcinoma cell
line SKOV3 was obtained from the American Type Culture Collection
(ATCC, Rockville, MD). Cells were grown in Dulbecco’s-modified
Eagle’s medium (DMEM, Gibco, USA) containing 10% fetal calf serum
(Hyclone, USA), penicillin (107 U/l) and streptomycin (10 mg/l) at
37°C in a humidified chamber containing 5% CO2. Orlistat
was dissolved in dimethyl sulphoxide (DMSO). When the cells reached
50–70% confluency, the medium was replaced by a fresh culture
medium containing Orlistat. Control cells were cultured in a medium
containing an equal amount of DMSO instead of Orlistat. For 2-DE
analysis, SKOV3 cells were treated with 20 mM Orlistat for 4 days
and the media were changed every day. Cells were washed twice by
centrifugation in phosphate buffered saline (PBS) and transferred
to sterile plastic tubes for storage at −80°C prior to use.
Cell proliferation assay
Cell growth and viability were assessed using an MTT
cell proliferation kit (Roche Applied Science). The cells were
seeded on 96-well microplates at 2.0x10³/well. At 48, 72
and 96 h, the cells were treated with different concentrations of
Orlistat and incubated at 37°C in 5% CO2. The cells were
subsequently incubated with 10 μl of MTT for 4 h, then the
media were removed and 150 μl DMSO were added. We put the
plate in a shaker before reading absorbance at 490-nm using a
microplate reader (3550-UV, Bio-Rad, USA), after 20 min of
incubation. The procedure was repeated three times with similar
results. The following formula was used to calculate the inhibition
rate of SKOV3 cell proliferation: (1-experimental group OD
value/negative control OD value) x 100%. Media-only treated
(untreated) cells were considered as the negative control
group.
2-DE and image analysis
Cells (1.3x10⁸) were lysed in 1 ml lysis
buffer (7 M urea, 2 M thiourea, 4% CHAPS, 100 mM DTT, 0.2% pH
3.0–10.0 ampholyte, Bio-Rad, USA) containing protease inhibitor
cocktail 8340 (Sigma, St. Louis, MO, USA). Samples were then kept
on ice and sonicated for six cycles of 10 sec, with each cycle
consisting of 5 sec sonication, followed by a 10 sec break. After
centrifugation at 14,000 rpm for 1 h at 4°C, the supernatant was
collected and the protein concentrations determined using the DC
Protein Assay Kit (Bio-Rad). Protein samples (3 mg) were applied to
an immobilized pH gradient (IPG) strip (17 cm, pH 3.0–10.0 NL,
Bio-Rad) using a passive rehydration method. After 12–16 h of
rehydration, the strips were transferred to an isoelectric focusing
(IEF) cell (Bio-Rad) and focused for a total of 60,000 Vh. The
second dimension was performed using 12% equilibration. The gels
were stained using CBB R-250 (Merck, Germany) and scanned with a
Bio-Rad GS-800 scanner. Triplicate samples were analyzed at each
time point of treatment to ensure the reproducibility of analyses.
The maps were analyzed by PDQuest software Version 6.1 (Bio-Rad).
Each gel spot was normalized as a percentage of the total quantity
of all spots in that gel and evaluated in terms of OD. Only those
spots that changed consistently and significantly (>2.0-fold)
were selected for MS analysis.
In-gel digestion
In-gel digestion of proteins was carried out using
MS-grade Trypsin Gold (Promega, Madison, WI, USA), according to the
manufacturer’s instructions. Briefly, spots were cut out of the gel
(1–2 mm diameter) using a razor blade, and destained twice with 100
mM NH4HCO3/50% acetonitrile (ACN) at 37°C for
45 min in each treatment. Following dehydration and drying, the
gels were pre-incubated in 10–20 μl trypsin solution for 1
h. Samples were then added in adequate digestion buffer (40 mM
NH4HCO3/10% ACN) to cover the gels and
incubated overnight at 37°C. Tryptic digests were extracted using
MiliQ water initially, followed by extraction twice with 50% ACN/5%
trifluoroacetic acid (TFA) for 1 h each time. The combined extracts
were dried in a vacuum concentrator at room temperature. The
samples were then subjected to MS analysis.
MALDI-Q-TOF analysis and protein
identification
Mass spectra were acquired using a quadrupole
time-of-flight (Q-TOF) mass spectrometer (Micromass, Manchester,
UK) with a matrix-assisted laser desorption ionization (MALDI)
source (Micromass). Tryptic digests were dissolved in 5 μl
of 70% ACN/0.1% TFA, and then 1 μl of the digestion was
mixed with 1 μl saturated α-cyano-4-hydroxy-cinnamic acid
(CHCA) in 50% ACN/0.5% TFA and spotted onto a 96-well target plate.
MS/MS was performed in a data-dependent mode in which the top ten
most abundant ions for each MS scan were selected for MS/MS
analysis. The MS/MS data were acquired and processed using the
MassLynx software (Micromass) and MASCOT was used to search the
database. Database searches were carried out using the following
parameters: database, Swiss-Prot; taxonomy, Homo sapien;
enzyme, trypsin; and allowance of one missed cleavage.
Carbamidomethylation was selected as a fixed modification and
oxidation of methionine was allowed to be variable. The peptide and
fragment mass tolerance were at 1 and 0.2 Da, respectively. The
data format selected was Micromass PKL and the instrument selected
was MALDI-Q-TOF. Proteins with probability-based MOWSE scores
exceeding their threshold (P<0.05) were considered to be
positively identified.
Western blot analysis
Collected cells were lysed in RIPA buffer (50 mM
Tris-base, 1.0 mM EDTA, 150 mM NaCl, 0.1% SDS, 1% Triton X-100, 1%
sodium deoxycholate, 1 mM PMSF) to extract all the proteins and
quantified by the DC protein assay Kit (Bio-Rad). Samples were
separated by 12% SDS-PAGE and transferred to polyvinylidene
difluoride (PVDF) membranes (Amersham Biosciences). The membranes
were blocked overnight with PBS containing 0.1% Tween 20 in 5%
skimmed milk at 4°C, and subsequently probed by the primary
antibodies: rabbit anti-PKM2 (diluted 1:500, Abcam, UK). Blots were
incubated with secondary antibody conjugated to horseradish
peroxidase for 2 h at room temperature. Target proteins were
detected by enhanced chemiluminescence reagents (Amersham Pharmacia
Biotech, Piscataway, USA), and β-actin was used as an internal
control.
Statistics
All quantitative data are recorded as the means ±
SD. Comparisons between two groups were performed by Student’s
t-test. Differences among multiple groups were assessed by one-way
ANOVA analysis. Relevance analysis of ordinal data was performed by
cross χ2 test. A statistically significant difference
was defined as p<0.05.
Results
Proliferation activity of
Orlistat-treated SKOV3 cells
The proliferation activity of Orlistat-treated SKOV3
cells was examined using the MTT assays. MTT results showed that
the proliferation activity was suppressed by Orlistat in both a
dose- and duration-dependent manner, and the proliferation ratio
was decreased to 60% of the control value 96 h after treatment with
Orlistat when the drug concentration was 20 mM, as shown in
Fig. 1.
Proteomic analysis of Orlistat-treated
SKOV3 cell protein expression compared with the parental SKOV3
cells
To explore the molecular mechanisms underlying the
Orlistat-induced antitumor activity of SKOV3 cells, 2-DE based
proteomics was used to profile differentially expressed proteins in
SKOV3 cells treated with or without Orlistat. Image analysis was
performed using PDQuest 7.1 software. Representative 2-DE maps are
shown in Fig. 2. Approximately
1000–1100 protein spots were detected by CBB R-250 staining in a
single 2-DE gel. Each protein spot was normalized as a percentage
of the total intensity of all spots in the gel. By comparing 2-DE
patterns, differentially expressed proteins were defined as
statistically meaningful (p<0.05) based on both of the following
two criteria: i) intensity alterations of >2.0-fold (t-test,
p<0.05) and ii) observed in at least 3 individual experiments.
According to these criteria, a total of 111 spots were selected and
analyzed using MALDI-Q-TOF tandem mass spectrometry. A total of 71
proteins from the 111 spots were identified (Fig. 2). As different isoforms of a
protein might have distinct functions, each isoform/spot was
considered to be a single protein for analysis in our study.
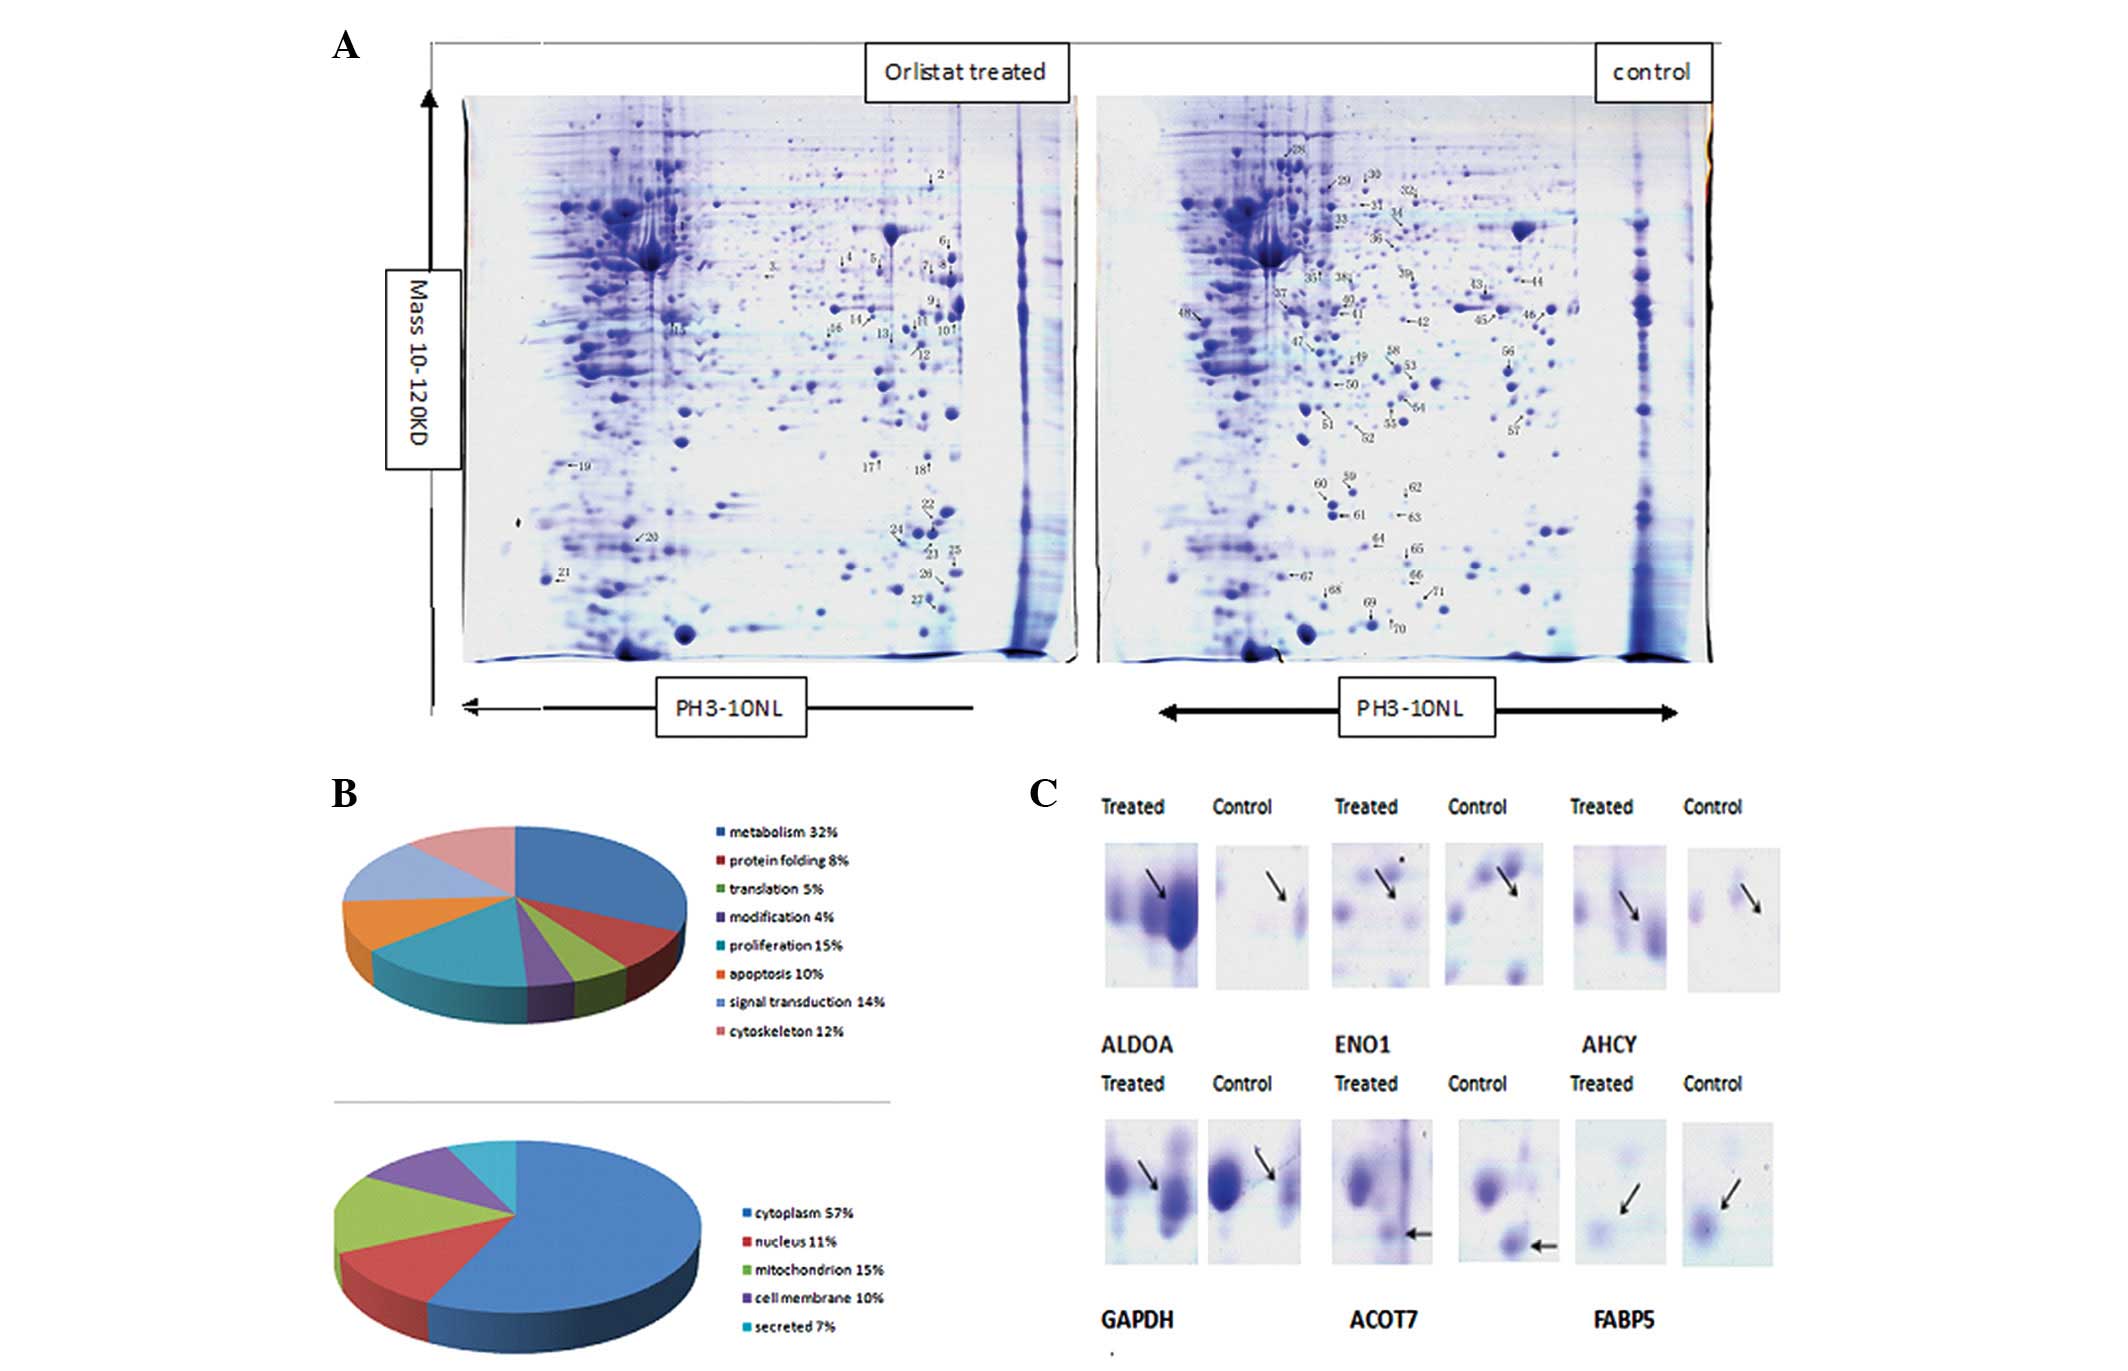 | Figure 2Comparison of the protein expression
patterns between control and Orlistat-treated SKOV3 cells. (A)
Representative 2-D gel images of the human ovarian cancer cell line
SKOV3 treated with or without Orlistat. Total protein extracts were
separated on pH 3.0–10.0 nonlinear IPG strips in the first
dimension followed by 12% SDS-PAGE in the second dimension and
visualized by Coomassie brilliant blue (CBB) staining. Seventy-one
differentially expressed spots (27 upregulated and 44 downregulated
in Orlistat-treated SKOV3 cells) were identified (as numbered).
Details for each numbered spot are reported in Table I. (B) Seventy-one identified
proteins were classified into 8 groups. These included metabolism
(32%), protein folding (8%), translation (5%), protein modification
(4%), cell proliferation (15%), apoptosis (10%), signal
transduction (14%) and cell cytoskeleton (12%). These proteins were
also found to be located in the cytoplasm (57%), nucleus (11%),
mitochondrion (15%), cell membrane (10%) or were secreted (12%).
(C) Enlargement of selected regions. Spots selected are ALDOA (Spot
8), ENO1 (Spot 3), AHCY (Spot 7), GAPDH (Spot 9), ACOT7 (Spot 44),
FABP5 (Spot 65). |
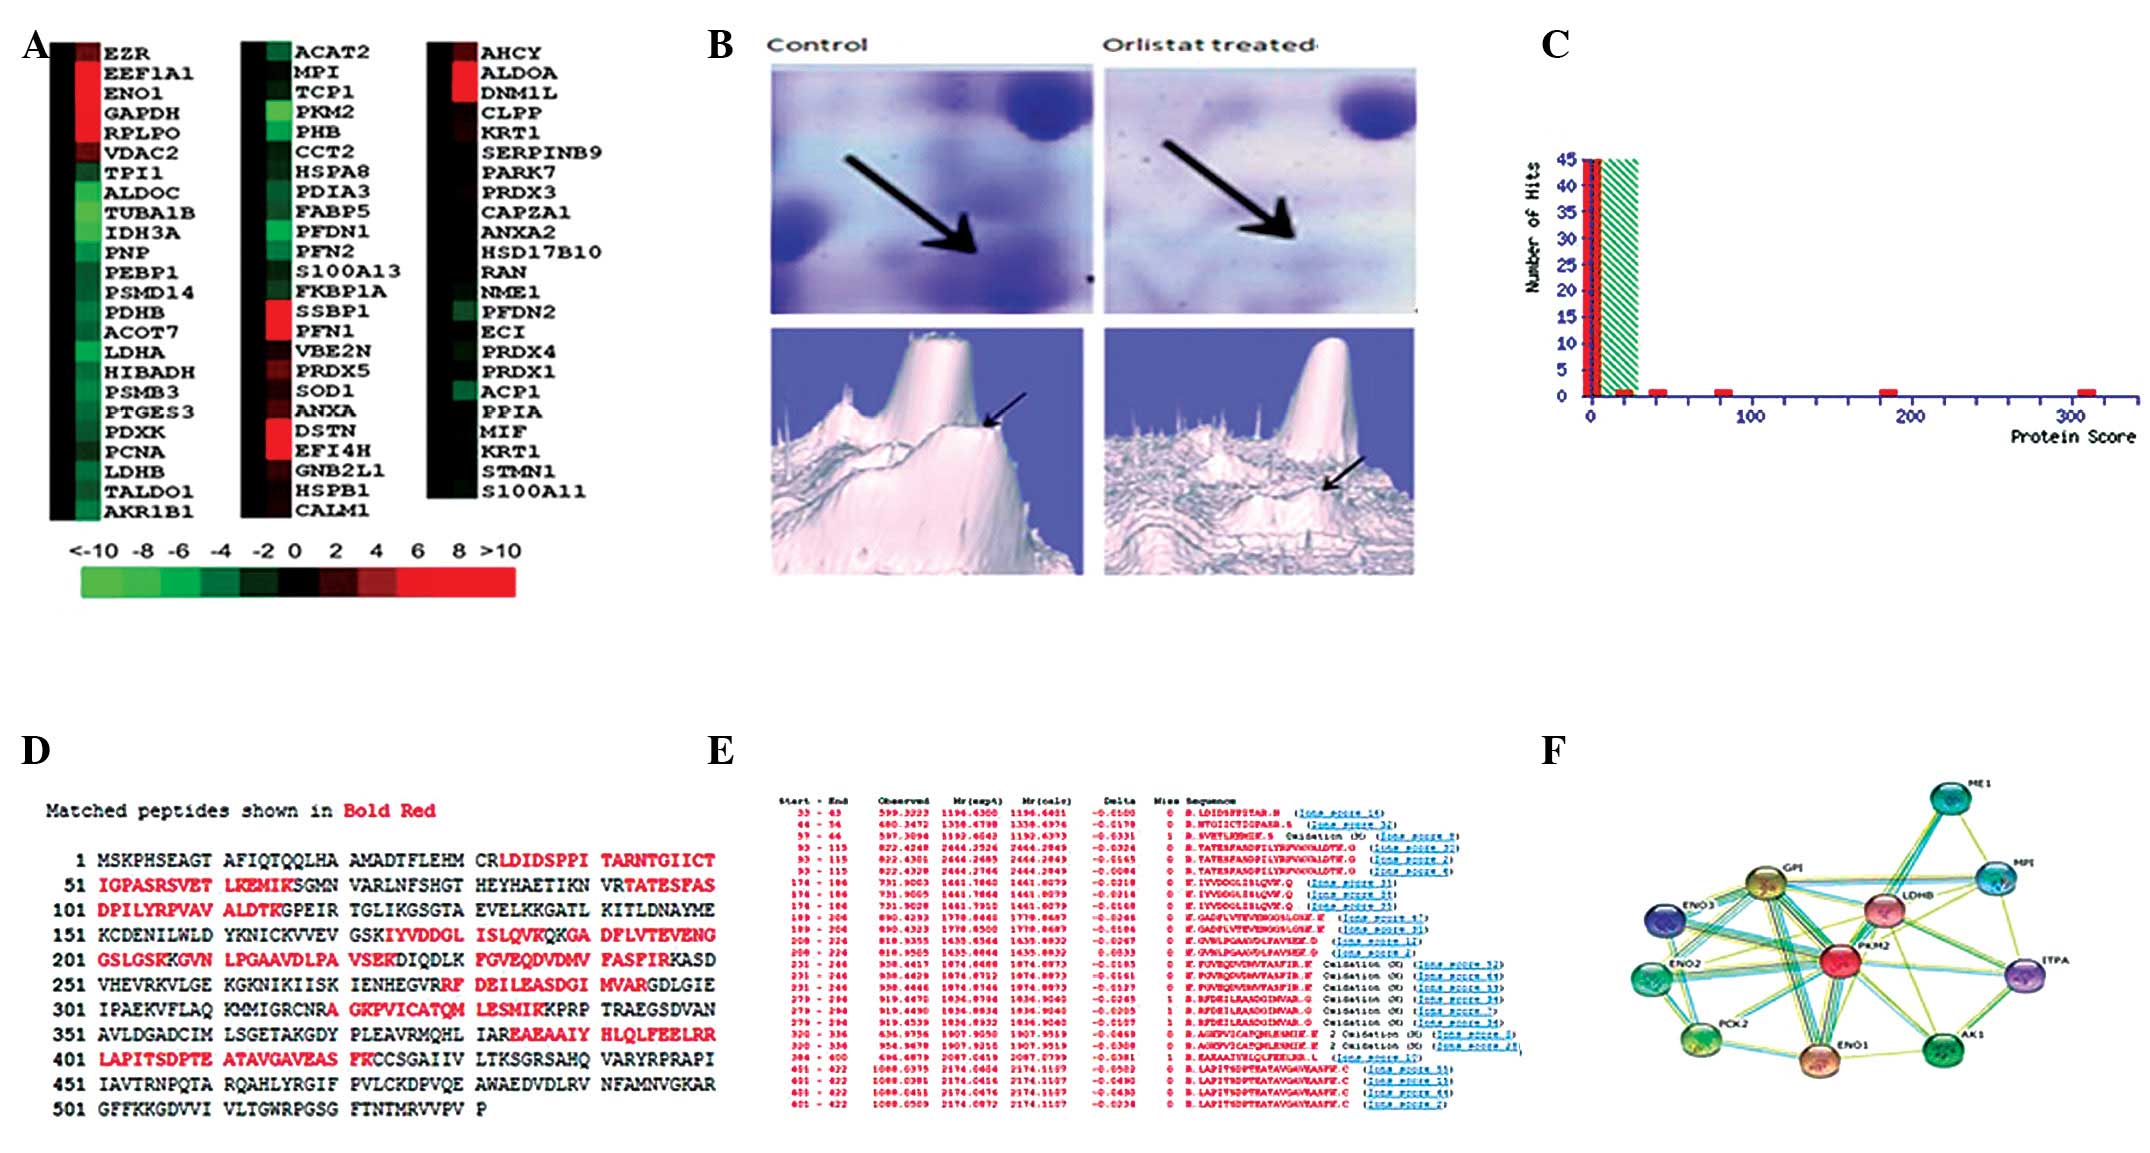
Protein identification and bioinformatics
analysis
In total, 71 spots with differential expression
levels were subjected to MS/MS analysis. The MS/MS data were
queried using the search algorithm MASCOT against the Expasy
protein sequence database. Proteins were identified based on a
number of criteria including PI, MW, the number of matched-peptides
and MOWSE score (Table I and
II).
 | Table IProtein spots identified by
MALDI-Q-TOF. |
Table I
Protein spots identified by
MALDI-Q-TOF.
| Spot no. | Accession
no.b | Protein
namea | Gene name | Mwc | PIc | No. of peptide | Coverage (%) | Scored |
|---|
| Upregulated |
| 1 | P15311 | Ezrin | EZR | 69,484 | 5.94 | 5 | 6 | 133 |
| 2 | P68104 | Elongation factor
1-α 1 | EEF1A1 | 50,451 | 9.10 | 15 | 28 | 179 |
| 3 | P06733 | α-enolas | ENO1 | 47,481 | 7.01 | 8 | 18 | 57 |
| 4 | P04264 | Keratin, type II
cytoskeletal 1 | KRT1 | 66,170 | 8.15 | 3 | 3 | 68 |
| 5 | P50453 | Serpin B9 | SERPINB9 | 43,004 | 5.61 | 27 | 46 | 372 |
| 6 | O00429 | Dynamin-1-like
protein | DNM1L | 82,339 | 6.37 | 3 | 4 | 39 |
| 7 | P23526 |
S-adenosyl-L-homocysteine hydrolase | AHCY | 48,255 | 5.92 | 16 | 24 | 86 |
| 8 | P04075 |
Fructose-bisphosphate aldolase A | ALDOA | 39,851 | 8.30 | 56 | 68 | 723 |
| 9 | P04406 |
Glyceraldehyde-3-phosphate
dehydrogenase | GAPDH | 36,201 | 8.57 | 27 | 55 | 400 |
| 10 | P22626 | 60S acidic
ribosomal protein P0 | RPLP0 | 37,464 | 8.97 | 12 | 41 | 238 |
| 11 | P45880 | Voltage-dependent
anion-selective channel protein 2 | VDAC2 | 32,060 | 7.49 | 10 | 29 | 91 |
| 12 | P63244 | Guanine
nucleotide-binding protein subunit β-2-like 1 | GNB2L1 | 35,511 | 7.60 | 12 | 52 | 101 |
| 13 | Q15056 | Eukaryotic
translation initiation factor 4H | EIF4H | 27,425 | 6.67 | 7 | 28 | 125 |
| 14 | P04083 | Annexin A1 | Annexin I | 38,918 | 6.57 | 7 | 12 | 45 |
| 15 | P52907 | F-actin-capping
protein subunit α-1 | CAPZA1 | 33,073 | 5.45 | 8 | 48 | 176 |
| 16 | Q16740 | Putative
ATP-dependent
Clp protease proteolytic subunit, mitochondrial | CLPP | 30,446 | 8.26 | 2 | 10 | 116 |
| 17 | P07355 | Annexin A2 | ANXA2 | 38,808 | 7.57 | 45 | 54 | 885 |
| 18 | Q99497 | Protein DJ-1 | PARK7 | 20,050 | 6.33 | 13 | 30 | 97 |
| 19 | P30048 |
Thioredoxin-dependent peroxide reductase,
mitochondrial | PRDX3 | 28,017 | 7.67 | 9 | 20 | 115 |
| 20 | P04792 | Heat shock protein
β-1 | HSPB1 | 22,826 | 5.98 | 6 | 37 | 48 |
| 21 | P62158 | Calmodulin | CALM1 | 16,827 | 4.09 | 6 | 30 | 84 |
| 22 | P60981 | Destrin | DSTN | 18,950 | 8.06 | 8 | 33 | 91 |
| 23 | P00441 | Superoxide
dismutase | SOD1 | 16,154 | 5.70 | 14 | 32 | 140 |
| 24 | P30044 | Peroxiredoxin-5,
mitochondrial | PRDX5 | 22,301 | 8.93 | 28 | 56 | 281 |
| 25 | Q04837 | Single-stranded
DNA-binding protein, mitochondrial | SSBP1 | 17,249 | 9.59 | 8 | 32 | 76 |
| 26 | P07737 | Profilin-1 | PFN1 | 15,216 | 8.44 | 9 | 57 | 135 |
| 27 | P61088 |
Ubiquitin-conjugating enzyme E2 N | UBE2N | 17,184 | 6.13 | 7 | 36 | 42 |
| Downregulated |
| 28 | P11142 | Heat shock cognate
71 kDa protein | HSPA8 | 71,082 | 5.37 | 50 | 28 | 562 |
| 29 | P35232 | Prohibitin | PHB | 29,843 | 5.57 | 29 | 51 | 440 |
| 30 | P17987 | T-complex protein 1
subunit α | TCP1 | 60,819 | 5.80 | 28 | 37 | 170 |
| 31 | P30101 | Protein
disulfide-isomerase A3 | PDIA3 | 57,146 | 3.47 | 7 | 12 | 69 |
| 32 | P78371 | T-complex protein 1
subunit β | CCT2 | 57,794 | 6.01 | 36 | 49 | 446 |
| 33 | P14618 | Pyruvate kinase
isozymes M1/M2 | PKM2 | 58,470 | 7.96 | 26 | 36 | 309 |
| 34 | Q9BWD1 | Acetyl-CoA
acetyltransferase | ACAT2 | 41,838 | 6.47 | 12 | 41 | 86 |
| 35 | P34949 | Mannose-6-phosphate
isomerase | MPI | 47,196 | 5.62 | 2 | 7 | 38 |
| 36 | P09972 |
Fructose-bisphosphate aldolase C | ALDOC | 39,830 | 6.41 | 13 | 15 | 205 |
| 37 | P68363 | Tubulin α-1B | TUBA1B | 50,804 | 4.94 | 35 | 41 | 513 |
| 38 | P50213 | Isocitrate
dehydrogenase (NAD) subunit α, mitochondrial | IDH3A | 40,022 | 6.47 | 22 | 49 | 152 |
| 39 | P37837 | Transaldolase | TALDO1 | 37,688 | 6.36 | 23 | 37 | 363 |
| 40 | P07195 | L-lactate
dehydrogenase B chain | LDHB | 36,900 | 5.71 | 12 | 41 | 86 |
| 41 | O00764 | Pyridoxal
kinase | PDXK | 35,308 | 5.75 | 18 | 42 | 175 |
| 42 | O00487 | 26S proteasome
non-ATPase regulatory subunit 14 | PSMD14 | 34,726 | 6.06 | 14 | 62 | 62 |
| 43 | P11177 | Pyruvate
dehydrogenase E1 component subunit β, mitochondrial | PDHB | 39,550 | 6.20 | 14 | 16 | 186 |
| 44 | O00154 | Cytosolic acyl
coenzyme A thioester hydrolase | ACOT7 | 42,454 | 8.85 | 13 | 25 | 177 |
| 45 | P15121 | Aldose
reductase | AKR1B1 | 36,230 | 6.51 | 40 | 11 | 62 |
| 46 | P00338 | L-lactate
dehydrogenase A chain | LDHA | 36,950 | 8.44 | 40 | 52 | 319 |
| 47 | P31937 |
3-hydroxyisobutyrate dehydrogenase,
mitochondrial | HIBADH | 35,705 | 8.38 | 1 | 4 | 39 |
| 48 | P12004 | Proliferating cell
nuclear antigen | PCNA | 29,092 | 4.57 | 45 | 54 | 559 |
| 49 | Q06830 |
Peroxiredoxin-1 | PRDX1 | 22,324 | 8.27 | 2 | 18 | 60 |
| 50 | Q13162 |
Peroxiredoxin-4 | PRDX4 | 30,749 | 5.86 | 3 | 14 | 29 |
| 51 | P00491 | Purine nucleoside
phosphorylase | PNP | 32,325 | 6.45 | 4 | 5 | 35 |
| 52 | P30086 |
Phosphatidylethanolamine-binding protein
1 | PEBP1 | 21,158 | 7.01 | 36 | 62 | 432 |
| 53 | P60174 | Triosephosphate
isomerase | TPI1 | 26,938 | 6.45 | 15 | 57 | 136 |
| 54 | P49720 | Proteasome subunit
β type-3 | PSMB3 | 23,219 | 6.14 | 7 | 30 | 50 |
| 55 | Q15185 | Prostaglandin E
synthase 3 | PTGES3 | 18,971 | 4.35 | 6 | 18 | 90 |
| 56 | Q99714 | 3-hydroxyacyl-CoA
dehydrogenase type-2 | HSD17B10 | 27,134 | 7.66 | 42 | 73 | 632 |
| 57 | P62826 | GTP-binding nuclear
protein Ran | RAN | 24,579 | 7.01 | 4 | 18 | 19 |
| 58 | P42126 | Enoyl-CoA δ
isomerase 1, mitochondrial | ECI1 | 33,080 | 8.80 | 5 | 8 | 60 |
| 59 | P15531 | Nucleoside
diphosphate kinase A | NME1 | 17,309 | 5.83 | 19 | 59 | 192 |
| 60 | P62937 | Peptidyl-prolyl
cis-trans isomerase A | PPIA | 18,229 | 7.68 | 22 | 61 | 327 |
| 61 | P16949 | Stathmin | STMN1 | 17,292 | 5.76 | 18 | 24 | 608 |
| 62 | P24666 | Low molecular
weight phosphotyrosine protein phosphatase | ACP1 | 18,487 | 6.30 | 4 | 22 | 27 |
| 63 | Q9UHV9 | Prefoldin subunit
2 | PFDN2 | 16,695 | 6.20 | 1 | 9 | 46 |
| 64 | P62942 | Peptidyl-prolyl
cis-trans isomerase | FKBP1A | 12,000 | 7.88 | 3 | 27 | 26 |
| 65 | Q01469 | Fatty acid-binding
protein, epidermal | FABP5 | 15,497 | 6.60 | 9 | 37 | 90 |
| 66 | O60925 | Prefoldin subunit
1 | PFDN1 | 14,202 | 6.32 | 2 | 9 | 46 |
| 67 | P35080 | Profilin-2 | PFN2 | 15,378 | 6.55 | 18 | 30 | 179 |
| 68 | Q99584 | Protein
S100-A13 | S100A13 | 11,464 | 5.91 | 2 | 22 | 28 |
| 69 | P04264 | Keratin, type II
cytoskeletal 1 | KRT1 | 66,170 | 8.15 | 8 | 11 | 28 |
| 70 | P31949 | Protein
S100-A11 | S100A11 | 11,847 | 6.56 | 4 | 15 | 36 |
| 71 | P14174 | Macrophage
migration inhibitory factor | MIF | 12,639 | 7.74 | 16 | 17 | 366 |
| Table IIProteins identified to be involved in
the metabolic process. |
Table II
Proteins identified to be involved in
the metabolic process.
| Spot no. | Accession no. | Protein name | Average ratio | Subcellular
location | Main function |
|---|
| 3 | P06733 | α-enolas | 10.54 | Cell membrane | Glycolysis |
| 7 | P23526 |
S-adenosyl-L-homocysteine hydrolase | 8.91 | Cytoplasm | Control of
methylations |
| 8 | P04075 |
Fructose-bisphosphate aldolase A | 23.57 | Cytoplasm | Glycolysis and
gluconeogenesis |
| 9 | P04406 |
Glyceraldehyde-3-phosphate
dehydrogenase | 4.72 | Cytoplasm | Glycolysis |
| 31 | P30101 | Protein
disulfide-isomerase A3 | 0.23 | Cytoplasm | Cysteine-type
endopeptidase activity |
| 33 | P14618 | Pyruvate kinase
isozymes M1/M2 | 0.08 | Cytoplasm | Glycolysis |
| 34 | Q9BWD1 | Acetyl-CoA
acetyltransferase | 0.22 | Cytoplasm | Acetyl-CoA
C-acetyltransferase activity |
| 35 | P34949 | Mannose-6-phosphate
isomerase | 0.73 | Cytoplasm | Mannose-6-phosphate
isomerase activity |
| 36 | P09972 |
Fructose-bisphosphate aldolase C | 0.19 | Cytoplasm | Glycolysis and
gluconeogenesis |
| 38 | P50213 | Isocitrate
dehydrogenase (NAD) subunit α, mitochondrial | 0.17 | Mitochondrion | Tricarboxylic acid
cycle |
| 39 | P37837 | Transaldolase | 0.43 | Cytoplasm | Pentose-phosphate
pathway |
| 40 | P07195 | L-lactate
dehydrogenase B chain | 0.34 | Cytoplasm | (S)-lactate + NAD+=
pyruvate + NADH. |
| 43 | P11177 | Pyruvate
dehydrogenase E1 component subunit β, mitochondrial | 0.32 | Mitochondrion | Pyruvate
dehydrogenase (acetyl-transferring) activity |
| 44 | O00154 | Cytosolic acyl
coenzyme A thioester hydrolase | 0.37 | Mitochondrion | Fatty-acyl-CoA
binding |
| 45 | P15121 | Aldose
reductase | 0.31 | Cytoplasm | Catalytic
efficiencies |
| 46 | P00338 | L-lactate
dehydrogenase A chain | 0.23 | Cytoplasm | L-lactate
dehydrogenase activity |
| 47 | P31937 |
3-hydroxyisobutyrate dehydrogenase,
mitochondrial | 0.33 | Mitochondrion |
3-hydroxyisobutyrate dehydrogenase
activity |
| 51 | P00491 | Purine nucleoside
phosphorylase | 0.27 | Cytoplasm | Immune
response |
| 53 | P60174 | Triosephosphate
isomerase | 0.47 | Cytoplasm | Triose-phosphate
isomerase activity |
| 55 | Q15185 | Prostaglandin E
synthase 3 | 0.35 | Cytoplasm | Molecular
chaperone |
| 56 | Q99714 | 3-hydroxyacyl-CoA
dehydrogenase type-2 | 0.41 | Mitochondrion |
3-hydroxy-2-methylbutyryl-CoA
dehydrogenase activity |
| 58 | P42126 | Enoyl-CoA delta
isomerase 1, mitochondrial | 0.38 | Mitochondrion | Dodecenoyl-CoA
delta-isomerase activity |
| 65 | Q01469 | Fatty acid-binding
protein, epidermal | 0.27 | Cytoplasm | High specificity
for fatty acids |
The identified proteins were divided into various
groups based on their biological functions and subcellular
localization. This implicated roles in metabolism (32%), protein
folding (8%), translation (5%), protein modification (4%), cell
proliferation (15%), apoptosis (10%), signal transduction (14%) and
cell cytoskeleton (12%). The proteins were found to be located in
the cytoplasm (57%), nucleus (11%), mitochondrion (15%), cell
membrane (10%) or were secreted (12%) (Fig. 2). For a macroscopic presentation,
cluster maps and protein interaction and function networks were
generated using Cluster or the KEGG-based software tool Cytoscape,
respectively. Twenty-three proteins, accounting for 32% of the
proteins identified, were found to be associated with metabolism
regulation. The metabolism-regulating proteins were grouped in
different clusters. Pyruvate kinase isozymes M1/M2 were found to
show one of the most significant differences in expression between
SKOV3 cells treated with or without Orlistat. It was downregulated
more than 10-fold in SKOV3 cells treated with Orlistat compared to
those without Orlistat, and MS/MS analysis revealed 15 matched
peptides with 36% sequence coverage and a MOWSE score of 309
(Fig. 3).
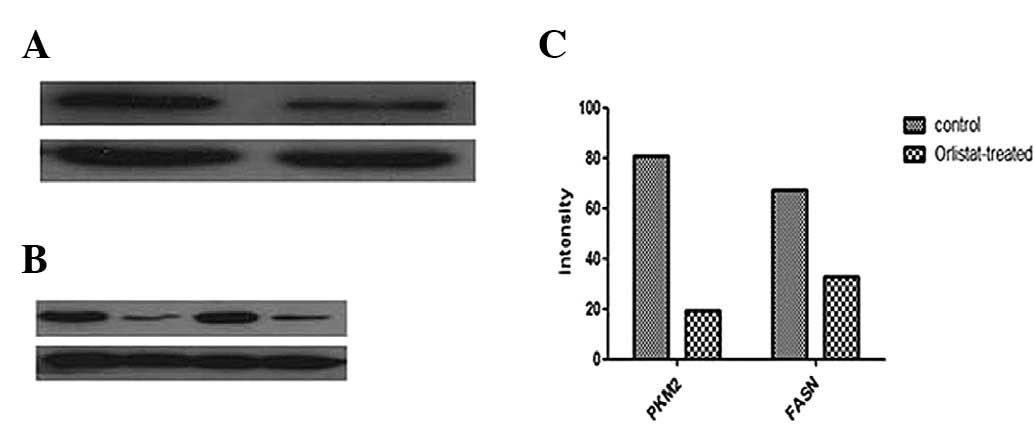
Proteomic validation of identified
proteins
The expression level of PKM2 was further validated
by western blotting. Consistent with the observations in 2-DE
analysis, PKM2 was downregulated in the Orlistat-treated SKOV3
cells compared with the parental SKOV3 cells. A similar change in
the expression level of FASN was detected in SKOV3 cells treated
with Orlistat (Fig. 5).
Discussion
Altered expression of lipid metabolic enzymes is a
feature of various types of cancer, including those that develop in
ovarian tissues (24). Highly
proliferating cancer cells need to synthesize fatty acids de
novo to continually provide lipids for membrane production. The
synthesized fatty acids are also used for energy production through
β-oxidation and lipid modification of proteins (Fig. 4). FASN, one of the key enzymes
involved in de novo fatty-acid synthesis, was found to be
overexpressed in various human types of cancer, including prostate,
ovary, colon, and lung (25). FASN
has been found to be essential for ovarian cancer cell survival and
inhibition of FASN activity has been shown to have potential
chemo-preventive (26) and
therapeutic applications (27).
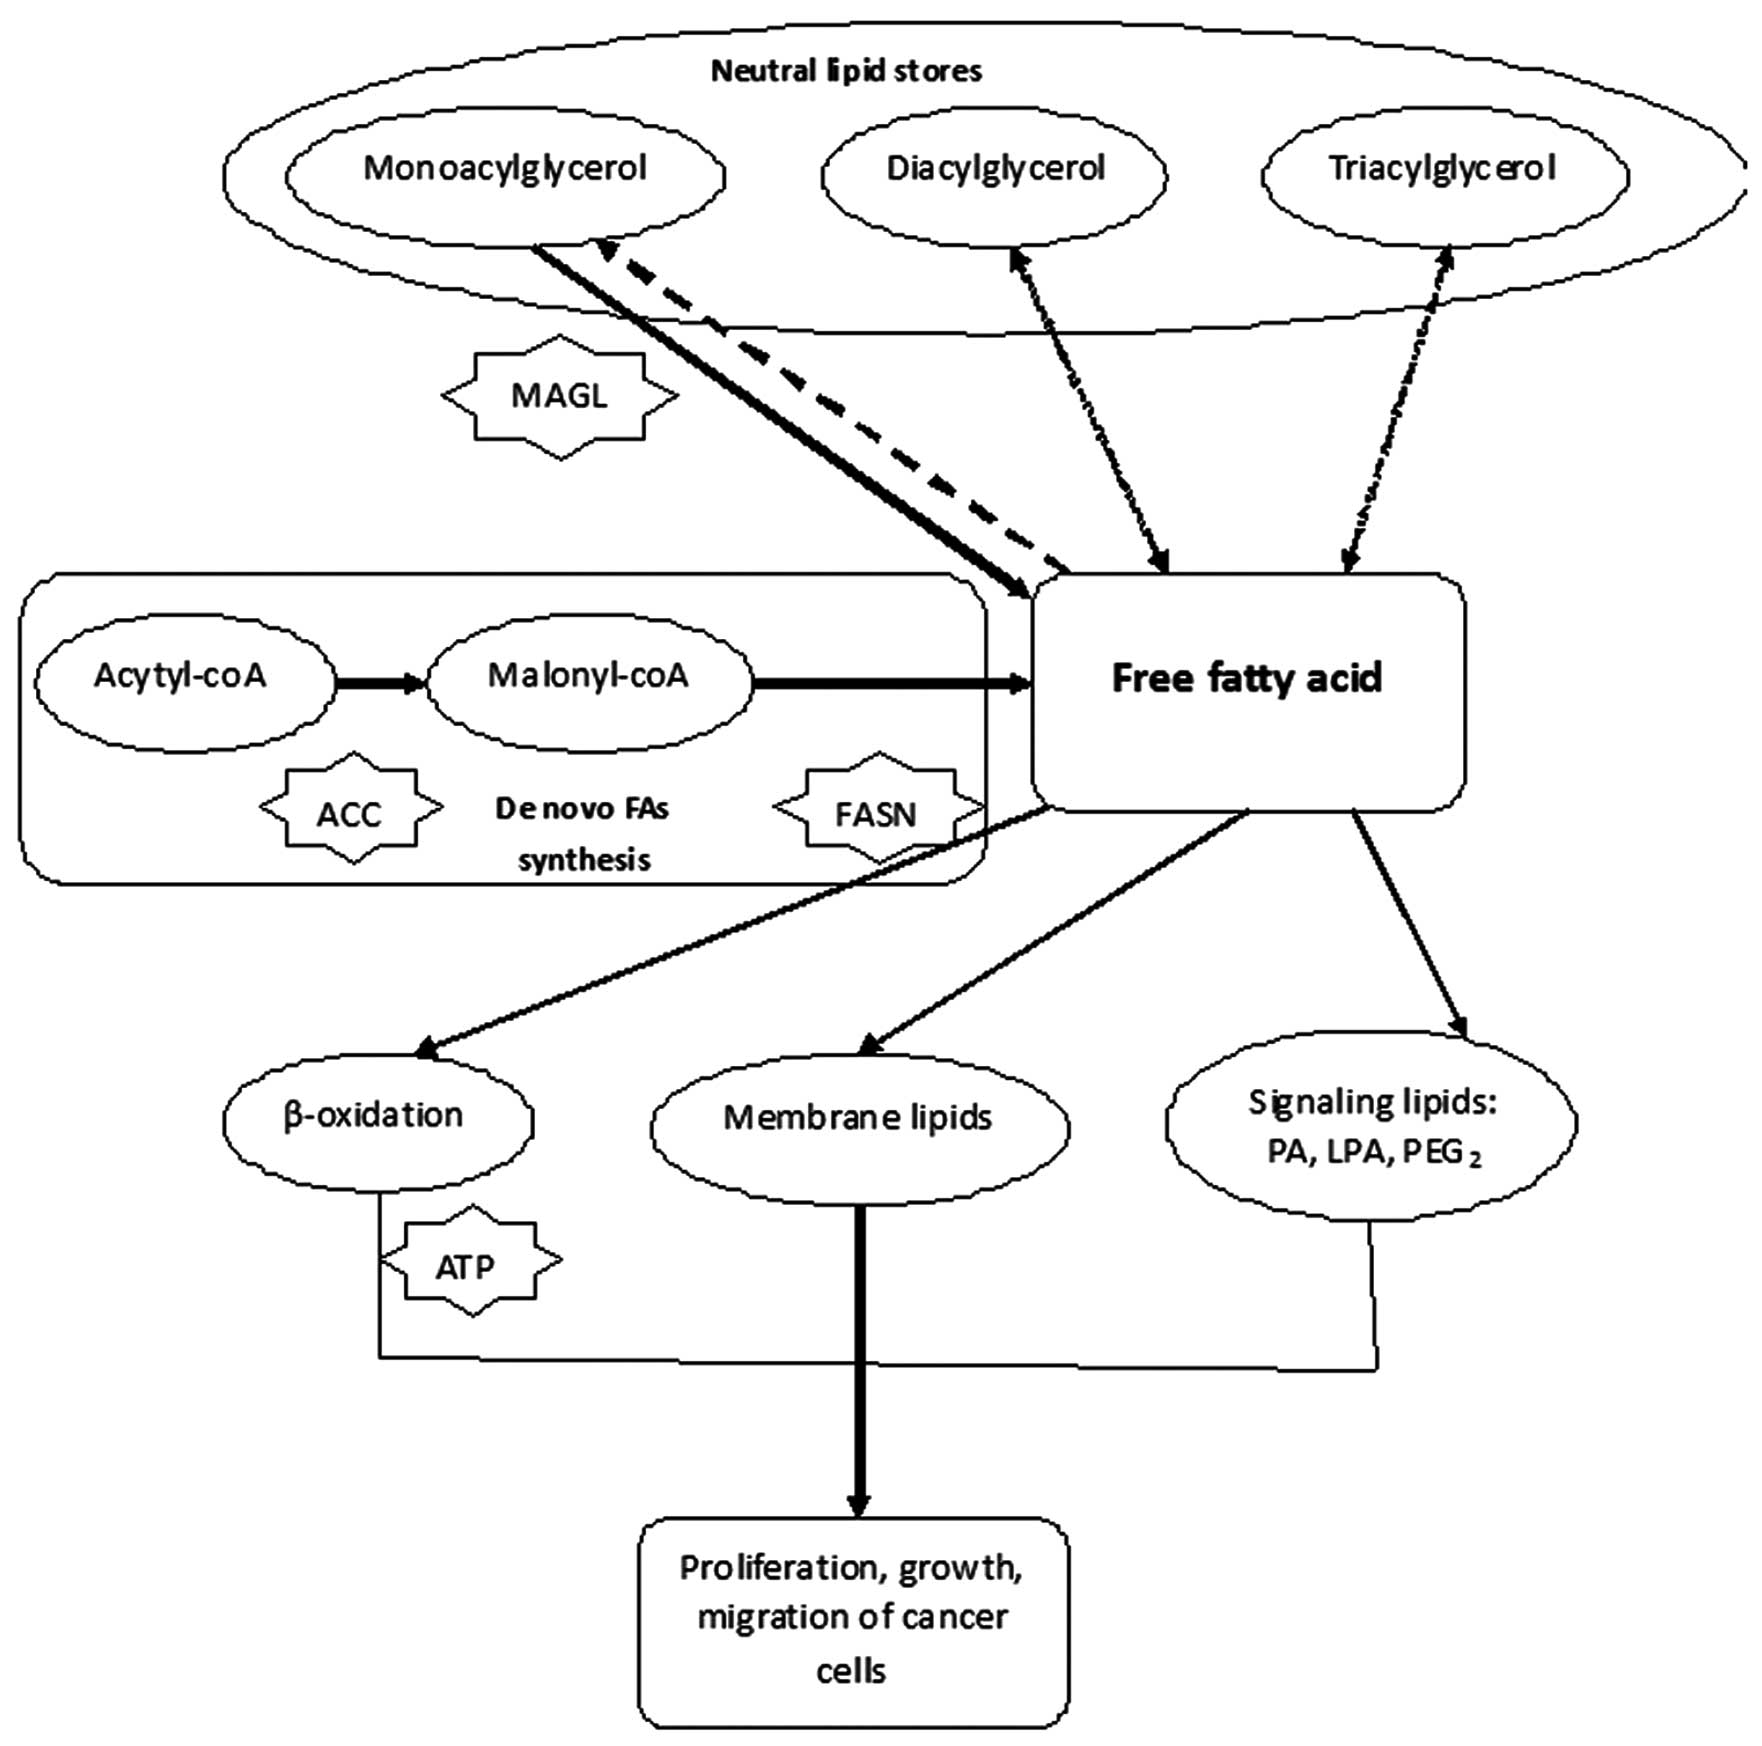 | Figure 4Free fatty acids can promote the
proliferation, growth and migration of cancer cells. FASN plays a
central role in regulation the synthesis of free fatty acids. So
inhibition of FASN and the de novo fatty-acid synthesis
pathways could be considered as novel strategies in antitumor
territory ACC, acetyl-CoA carboxylase; FASN, fatty-acid synthase;
MAGL, monoacylglycerol lipase; PA, phosphatidic acid; LPA,
lysophosphatidic acid, and PGE2, prostaglandin E2, ATP, adenosine
5′-triphosphate. |
In this study, we found that treatment with
Orlistat, an inhibitor of FASN, promoted the apoptosis of SKOV3
cells (Fig. 1). We confirm the
inhibitory effect of Orlistat on FASN by western blot analysis
using the ovarian cancer cells (SKOV3) as a model, and we found
that FASN was 2-fold downregulated after treatment with Orlistat.
As shown in Fig. 5, we employed a
2-DE-based proteomics approach to annotate the altered proteins in
the SKOV3 cells prior to and following treatment with Orlistat. Our
proteomic analysis revealed a total of 71 differentially expressed
proteins, which were associated with cell metabolism, proliferation
and/or apoptosis.
Among them, Profilin 1, a member of the profilin
family, also known as PFN1, was ubiquitous and upregulated more
than 10-fold in SKOV3 cells after treatment with Orlistat. PFN1 was
found to be involved in multiple cell behaviors, such as cell
adhesion, growth, proliferation and signal transduction (34,35).
Moreover, 23 proteins were found differentially expressed related
to metabolism. Among them, pyruvate kinase (PK), a rate-limiting
enzyme during glycolysis, catalyzes the production of pyruvate and
adenosine 5′-triphosphate (ATP) from phosphoenolpyruvate (PEP) and
adenosine 5′-diphosphate (ADP) (28). Four mammalian PK isoenzymes (M1,
M2, L and R) were found in normal adult cells. By contrast, PKM2 is
found predominantly in the fetus as well as in tumor cells, where
the abundance of other isoforms of PK is low. PKM2 can exist in
either active tetramers or inactive dimers, but in tumor cells it
predominantly occurs in dimers with low activity (29). Cancer cells universally express the
M2 isoform of the glycolytic enzyme pyruvate kinase (PKM2), and
previous studies have demonstrated that PKM2 expression is
necessary for aerobic glycolysis and cell proliferation in
vivo (28,30). Knockdown of PKM2 using RNA
interference significantly impairs cell growth in tissue culture,
inhibition of PKM2 with peptide aptamers inhibits cell
proliferation, and PKM2 expression is necessary for both aerobic
glycolysis and tumor growth in vivo (31,32).
It has been proven that the downregulation of PKM2 activity in
cancer cells aids in shunting key glycolytic intermediates toward
pathways where they, in turn, are utilized as precursors for lipid,
amino acid and nucleic acid synthesis. Therefore, the
downregulation of PKM2 activity provides a purposeful divergence
from catabolic metabolism aimed at energy production toward an
anabolic state aimed at providing the needed resources for rapid
cellular construction (33).
Research has also shown that PKM2 plays a general role in caspase-
and Bcl-independent apoptosis, thereby validating PKM2 as a
promising, generally relevant target for the development of
anticancer therapies with broad efficacy (34). In our study, PKM was downregulated
more than 10-fold, confirming our hypothesis that Orlistat has
antitumor abilities. Furthermore, significant downregulation of
PKM2 after treatment with Orlistat was confirmed in the ovarian
cancer cell line SKOV3 cells by western blot analysis.
In conclusion, using proteomic tools, we identified
71 differentially expressed proteins following Orlistat treatment
of ovarian cancer cells. The functions of the differentially
expressed proteins were correlated to apoptosis and/ or
anti-proliferation cellular processes. These results support the
hypothesis that Orlistat is a potential inhibitor of ovarian cancer
and can be used as a novel assistant antitumor agent, combined with
conventional surgical resection and chemotherapy.
Abbreviations:
|
2-DE
|
two-dimensional polyacrylamide gel
electrophoresis;
|
|
MALDI-Q-TOF
|
matrix-assisted laser desorption
ionization quadrupole time-of-flight;
|
|
MOWSE
|
molecular weight search;
|
|
ALODA
|
aldolase A;
|
|
LDHA
|
L-lactate dehydrogenase A chain;
|
|
KPYM
|
pyruvate kinase muscle isozyme;
|
|
MS
|
mass spectrometry;
|
|
MTT
|
3-(4,5-dimethylthiazol-2-yl)-2,5-diphenyl tetrazolium bromide;
|
|
PI
|
propidium iodide;
|
|
CAPS
|
calcyphosine;
|
|
FAS
|
fatty-acid synthase
|
Acknowledgements
This work was supported by the
National Key Basic Research Program (973 Program) of China
(2011CB910703).
References
|
1
|
Clemens MJ: Targets and mechanisms for the
regulation of translation in malignant transformation. Oncogene.
23:3180–3188. 2004. View Article : Google Scholar : PubMed/NCBI
|
|
2
|
Bull JH, Ellison G, Patel A, et al:
Identification of potential diagnostic markers of prostate cancer
and prostatic intraepithelial neoplasia using cDNA microarray. Br J
Cancer. 84:1512–1519. 2001. View Article : Google Scholar : PubMed/NCBI
|
|
3
|
Rashid A, Pizer ES, Moga M, et al:
Elevated expression of fatty acid synthase and fatty acid synthetic
activity in colorectal neoplasia. Am J Pathol. 150:201–208.
1997.PubMed/NCBI
|
|
4
|
Gansler TS, Hardman W III, Hunt DA, et al:
Increased expression of fatty acid synthase (OA-159) in ovarian
neoplasms predicts shorter survival. Hum Pathol. 18:686–692. 1997.
View Article : Google Scholar : PubMed/NCBI
|
|
5
|
Gansler TS, Hardman W III, Hunt DA, et al:
Immunohistochemical expression and prognostic significance of FAS
and GLUT1 in bladder carcinoma. Anticancer Res. 23:335–339.
2003.PubMed/NCBI
|
|
6
|
Nemoto T, Terashima S, Kogure M, et al:
Overexpression of fatty acid synthase in oesophageal squamous cell
dysplasia and carcinoma. Pathobiology. 69:297–303. 2001. View Article : Google Scholar : PubMed/NCBI
|
|
7
|
Kusakabe T, Nashimoto A, Honma K and
Suzuki T: Fatty acid synthase is highly expressed in carcinoma,
adenoma and in regenerative epithelium and intestinal metaplasia of
the stomach. Histopathology. 40:71–79. 2002. View Article : Google Scholar : PubMed/NCBI
|
|
8
|
Piyathilake CJ, Frost AR, Manne U, et al:
The expression of fatty acid synthase (FAS) is an early event in
the development and progression of squamous cell carcinoma of the
lung. Hum Pathol. 31:1068–1073. 2000. View Article : Google Scholar : PubMed/NCBI
|
|
9
|
Pizer ES, Lax SF, Kuhajda FP, Pasternack
GR and Kurman RJ: Fatty acid synthase expression in endometrial
carcinoma: correlation with cell proliferation and hormone
receptors. Cancer. 83:528–537. 1998. View Article : Google Scholar : PubMed/NCBI
|
|
10
|
Alò PL, Visca P, Marci A, Mangoni A, Botti
C and Di Tondo U: Expression of fatty acid synthase (FAS) as a
predictor of recurrence in stage I breast carcinoma patients.
Cancer. 77:474–482. 1996.PubMed/NCBI
|
|
11
|
Pizer ES, Wood FD, Heine HS, Romantsev FE,
Pasternack GR and Kuhajda FP: Inhibition of fatty acid synthase
delays disease progression in a xenograft model of ovarian cancer.
Cancer Res. 56:189–193. 1996.PubMed/NCBI
|
|
12
|
Alò PL, Visca P, Botti C, et al:
Immunohistochemical expression of human erythrocyte glucose
transporter and fatty acid synthase in infiltrating breast
carcinomas and adjacent typical/ atypical hyperplastic or normal
breast tissue. Am J Clin Pathol. 116:129–134. 2001.PubMed/NCBI
|
|
13
|
Alò PL, Visca P, Framarino ML, et al:
Immunohistochemical study of fatty acid synthase in ovarian
neoplasms. Oncol Rep. 7:1383–1388. 2000.PubMed/NCBI
|
|
14
|
Costello LC and Franklin RB: ‘Why do
tumour cells glycolyse?’: from glycolysis through citrate to
lipogenesis. Mol Cell Biochem. 280:1–8. 2005.
|
|
15
|
De Schrijver E, Brusselmans K, Heyns W,
Verhoeven G and Swinnen JV: RNA interference-mediated silencing of
the fatty acid synthase gene attenuates growth and induces
morphological changes and apoptosis of LNCaP prostate cancer cells.
Cancer Res. 63:3799–3804. 2003.PubMed/NCBI
|
|
16
|
Menendez JA, Vellon L and Lupu R:
Orlistat: From antiobesity drug to anticancer agent in Her-2/neu
(erbB-2)-overexpressing gastrointestinal tumors? Exp Biol Med
(Maywood). 230:151–154. 2005.PubMed/NCBI
|
|
17
|
Pemble CW IV, Johnson LC, Kridel SJ and
Lowther WT: Crystal structure of the thioesterase domain of human
fatty acid synthase inhibited by Orlistat. Nat Struct Mol Biol.
14:704–709. 2007. View
Article : Google Scholar : PubMed/NCBI
|
|
18
|
Knowles LM, Axelrod F, Browne CD and Smith
JW: A fatty acid synthase blockade induces tumor cell-cycle arrest
by down-regulating Skp2. J Biol Chem. 279:30540–30545. 2004.
View Article : Google Scholar : PubMed/NCBI
|
|
19
|
Jemal A, Siegel R, Ward E, Hao Y, Xu J,
Murray T and Thun MJ: Cancer statistics. CA Cancer J Clin.
58:71–96. 2008.
|
|
20
|
Raki M, Rein DT, Kanerva A and Hemminki A:
Gene transfer approaches for gynecological diseases. Mol Ther.
14:154–163. 2006. View Article : Google Scholar : PubMed/NCBI
|
|
21
|
Liu R, Li Z, Bai S, et al: Mechanism of
cancer cell adaptation to metabolic stress: proteomics
identification of a novel thyroid hormone-mediated gastric
carcinogenic signaling pathway. Mol Cell Proteomics. 8:70–85. 2009.
View Article : Google Scholar
|
|
22
|
Tong A, Wu L, Lin Q, et al: Proteomics
analysis of cellular protein alterations using a hepatitis B
virus-producing cellular model. Proteomics. 8:2012–2023. 2008.
View Article : Google Scholar : PubMed/NCBI
|
|
23
|
Liu R, Wang K, Yuan K, et al: Integrative
oncoproteomics strategies for anticancer drug discovery. Expert Rev
Proteomics. 7:411–429. 2009. View Article : Google Scholar : PubMed/NCBI
|
|
24
|
Medes G, Thomas A and Weinhouse S:
Metabolism of neoplastic tissue. IV: A study of lipid synthesis in
neoplastic tissue slices in vitro. Cancer Res. 13:27–29.
1953.PubMed/NCBI
|
|
25
|
Witkowski A, Joshi AK and Smith S:
Coupling of the de novo fatty acid biosynthesis and lipoylation
pathways in mammalian mitochondria. J Biol Chem. 282:14178–14185.
2007. View Article : Google Scholar : PubMed/NCBI
|
|
26
|
Chirala SS and Wakil SJ: Structure and
function of animal fatty acid synthase. Lipids. 39:1045–1053. 2004.
View Article : Google Scholar : PubMed/NCBI
|
|
27
|
Kuhajda FP, Jenner K, Wood FD, Hennigar
RA, Jacobs LB, Dick JD and Pasternack GR: Fatty acid synthesis: a
potential selective target for antineoplastic therapy. Proc Natl
Acad Sci USA. 91:6379–6383. 1994. View Article : Google Scholar : PubMed/NCBI
|
|
28
|
Christofk HR, Vander Heiden MG, Harris MH,
et al: The M2 splice isoform of pyruvate kinase is important for
cancer metabolism and tumour growth. Nature. 452:230–233. 2008.
View Article : Google Scholar : PubMed/NCBI
|
|
29
|
Guminska M, Ignacak J, Kedryna T and
Stachurska MB: Tumor-specific pyruvate kinase isoenzyme M2 involved
in biochemical strategy of energy generation in neoplastic cells.
Acta Biochim Pol. 44:711–724. 1997.PubMed/NCBI
|
|
30
|
Mazurek S, Boschek CB, Hugo F and
Eigenbrodt E: Pyruvate kinase type M2 and its role in tumor growth
and spreading. Semin Cancer Biol. 15:300–308. 2005. View Article : Google Scholar : PubMed/NCBI
|
|
31
|
Dombrauckas JD, Santarsiero BD and Mesecar
AD: Structural basis for tumor pyruvate kinase M2 allosteric
regulation and catalysis. Biochemistry. 44:9417–9429. 2005.
View Article : Google Scholar : PubMed/NCBI
|
|
32
|
Spoden GA, Mazurek S, Morandell D, et al:
Isotype-specific inhibitors of the glycolytic key regulator
pyruvate kinase subtype M2 moderately decelerate tumor cell
proliferation. Int J Cancer. 123:312–321. 2008. View Article : Google Scholar : PubMed/NCBI
|
|
33
|
Steták A, Veress R, Ovádi J, Csermely P,
Kéri G and Ullrich A: Nuclear translocation of the tumor marker
pyruvate kinase M2 induces programmed cell death. Cancer Res.
67:1602–1608. 2007.PubMed/NCBI
|
|
34
|
Janke J, Schlüter K, Jandrig B, et al:
Suppression of tumorigenicity in breast cancer cells by the
microfilament protein profilin 1. J Exp Med. 191:1675–1686. 2000.
View Article : Google Scholar : PubMed/NCBI
|
|
35
|
Wu N, Zhang W, Yang Y, et al: Profilin 1
obtained by proteomic analysis in all-trans retinoic acid-treated
hepatocarcinoma cell lines is involved in inhibition of cell
proliferation and migration. Proteomics. 6:6095–6106. 2006.
View Article : Google Scholar : PubMed/NCBI
|