Introduction
Multiple myeloma (MM) is a B-cell neoplasia,
characterized by the clonal expansion of malignant plasma cells in
the bone marrow. During normal B-cell development, cells acquire
expression of CD138, also known as syndecan-1 (SDC1), a marker
highly specific for terminally differentiated normal plasma cells
(1). CD138 is a heparin sulphate
proteoglycan that controls tumor cell survival, growth, adhesion
and bone cell differentiation in MM (2). Since CD138 is a specific surface
antigen for MM cells and plasma cells in the bone marrow (3), it has been used for the purification
of MM cells from clinical samples (4) and in the classification of MM cells
in gene expression profiling analyses (5). In addition, the use of specific
antibodies targeting CD138 are also considered as a novel treatment
strategy for MM (6).
However, several studies have also reported
decreased expression of CD138 in MM (7,8).
Matsui et al, reported the existence of highly clonogenic MM
cells lacking CD138 expression, and suggested that these cells may
represent MM ‘stem cells’ (9).
Furthermore, a decrease in CD138 expression has been observed
during the course of clinical treatment in some patients. While
high expression of CD138 is not consistently observed in myeloma
cells, the significance of decreased CD138 expression in MM cells
remains unclear.
In the present study, we investigated the expression
of CD138 in primary MM cells by flow cytometry using the CD38
gating method (10), and analyzed
the association between CD138 decrease and patient survival,
retrospectively. To investigate the effects of decreased CD138 in
MM, we utilized two MM cell lines with heterogeneous expression of
CD138 (KYMM-1, CD138 low and KYMM-2, CD138 high). These cell lines
were simultaneously established from the pleural effusion of an MM
patient, who displayed a gradual reduction in CD138 expression
during disease progression.
Materials and methods
MM patients and flow cytometric
analysis
Flow cytometry data were obtained from 90 newly
diagnosed and 15 relapsed or progressive MM patients, admitted to
Kumamoto University Hospital, Kumamoto City Hospital and Hiroshima
University Hospital. Written, informed consent was obtained
according to the Declaration of Helsinki. Flow cytometry was
performed by the commercially available CD38 multi-analysis (SRL
Laboratories, Tokyo, Japan) by gating CD38 strong positive (++)
fractions as previously described (10). To rule out the possibility of
B-cell contamination, patients with CD19 positive cells and without
cytoplasmic light chain restriction, were excluded from the
analysis. Patients with greater than 20% CD138 negative cells in
CD38++ fraction were termed ‘CD138 low’ patients, while
patients with less than 20% of CD138 negative cells were termed
‘CD138 high’. The characteristics of the patients are summarized in
Table I.
 | Table IPatient characteristics. |
Table I
Patient characteristics.
| CD138 high | CD138 low |
|---|
| Median
CD138− (%) (Range) | 4.7 (0.1–18.6) | 30(20.6–91.8) |
| Median age
(Range) | 65 (44–85) | 65(44–82) |
| Gender | | |
| Male | 37 | 13 |
| Female | 31 | 9 |
| Total | 68 | 22 |
Establishment of two MM cell lines from a
single MM patient
Case report
A 75-year-old Japanese female was admitted to
hospital with lumbago. Magnetic resonance imaging (MRI) examination
revealed a plasmacytoma in the lumbar vertebra, accompanying lumbar
fractures. Laboratory tests indicated the presence of the IgG-k
type M-protein in the serum (IgG 3,849 mg/dl). Pathological
examination of bone marrow aspirates revealed that 30.8% of the
cells were plasma cells and she was diagnosed with symptomatic
myeloma. A treatment regimen including melphalan, prednisolone and
thalidomide therapy, combined with radiation against the
plasmacytoma was initiated. Although transient regression of the
disease was obtained, enlargement of the plasmacytoma was observed
and pleural effusion contained almost 100% of plasma cells. Despite
treatment with lenalidomide, the patient died 16 months after
admission.
Establishment of cell lines
Mononuclear cells were separated from the pleural
effusion fluid by Ficoll-Paque Plus (GE Healthcare, Uppsala,
Sweden). Separated cells were collected and divided in 12-well
plates and cultured in RPMI-1640 medium containing 10% fetal bovine
serum at 37°C under 5% CO2. Media were replaced every 3
days. Two cell lines, referred to as KYMM-1 and KYMM-2, were
obtained from different wells. These cells had been maintained for
more than 450 days in culture and their viability was retained
following repeated freeze/thaw cycles. The clonality of these two
cell lines and primary samples was confirmed by Southern blot
analysis using a DNA probe recognizing the immunoglobulin
heavy-chain joining (Ig-JH) region (SRL Laboratories). Genomic DNA
obtained from the patient’s pleural effusion fluid, KYMM-1 and
KYMM-2 cell lines, was further analyzed using the Cell ID™ System
(Promega, Madison, WI, USA), which identifies 9 short tandem repeat
(STR)-loci and Amelogenin, to confirm the origin of cell lines.
Epstein-Barr (EB) virus genome detection was performed by PCR using
BamW region primers (SRL Laboratories) as previously reported
(11).
Cell lines and cell culture
Human myeloma cell lines, KMM-1 (12), KMS-11 (13), KMS-12-BM (14), KMS-12-PE (14), U266 (15), KYMM-1, KYMM-2 and the human
leukemia cell line, HL-60 (16),
were cultured in RPMI-1640 medium containing 10% fetal bovine serum
at 37°C under 5% CO2. KMM-1, KMS-12-BM and KMS-12-PE
were kindly provided by Dr Ohtsuki (Kawasaki Medical School,
Kurashiki, Japan).
Flow cytometric analysis of MM cell
lines
MM cell lines were stained with fluorescent-labeled
antibodies, PE-CD19 (clone HIB19), PE-CD20 (clone L27), FITC-CD38
(clone HIT2), PE-CD44 (clone 515), PE-CD45 (clone HI30), PE-CD138
(clone MI15) (BD Biosciences, Franklin Lakes, NJ, USA), PE-CD27
(clone O323), PE-CD54 (clone HCD54), FITC-CD56 (clone HCD56)
(Biolegend, San Diego, CA, USA), PE-CD34 (clone 581) (Beckman
Coulter, Brea, CA, USA) and FITC-κ light chain (Dako, Glostrup,
Denmark). Flow cytometric analysis was performed using an EPICS
MCL/XL flow cytometer (Beckman Coulter).
cDNA synthesis and reverse
transcription-polymerase chain reaction (RT-PCR)
RNA was extracted from purified myeloma cells using
TRIzol reagent (Invitrogen, Carlsbad, CA, USA). cDNA synthesis was
performed using the SuperScript III First-Strand Synthesis System
for RT-PCR (Invitrogen) according to the manufacturer’s
protocol.
The expression of SDC1 (CD138),
BCL6 and PAX5 was determined by RT-PCR. GAPDH
was used as a normalization control. Primers for
PAX5(17) and
GAPDH(18) were previously
described. Primers for SDC1 and BCL6 were as follows:
SDC1 (forward 5′-GCCGCAAATTGTGGCTACT-3′, reverse
5′-GCTGCGTGTCCTTCCAAGT-3′), BCL6 (forward 5′-GAG
AAGCCCTATCCCTGTGA-3′, reverse 5′-TGCACCTTGGTGTTGGTGAT-3′).
Quantitative real-time RT-PCR was performed using
Assay-on-Demand primers and Taqman Universal PCR Master mix reagent
(Applied Biosystems, Foster City, NJ, USA). Samples were analyzed
using the ECO™ Real-Time PCR System (Illumina, San Diego, CA, USA).
The ΔΔCt method was utilized to analyze the relative changes in
gene expression as previously described (19) using β-actin (ACTB) as
a normalization control. The following primers and probes were
used: SDC1 (Hs00896423_m1), IRF4 (Hs01056534_m1),
PRDM1 (Hs00153357_m1), XBP1 (Hs00964360_m1),
BCL6 (Hs00277037_m1) and ACTB (Hs99999903_m1).
Detection of methylation
DNA methylation was analyzed by bisulfite
sequencing. CpG islands spanning the transcription initiation site
of the SDC1 gene were identified by Methyl Primer Express
v1.0 software (Applied Biosystems). A 362 bp DNA fragment of the
region of SDC1 containing CpG islands was amplified using
the following primers: forward 5′-AGTATTTTGTGGAGTGTAGGAAGAA-3′,
reverse 5′-CCTTTCAACTCRACTACTCCCT-3′. Genomic DNA was treated with
sodium bisulfite as previously described (20) and subjected to 35 cycles of PCR.
PCR products were directly sequenced for evaluation of methylation
status.
Cell viability assay and detection of
apoptosis
Cell viability was determined by WST-8 assay using
the Cell Counting Kit-8 (Dojindo, Kumamoto, Japan). Briefly, cells
were seeded in 96-well plates and treated with bortezomib (Janssen
Pharmaceutical, Tokyo, Japan) or lenalidomide (Santa Cruz
Biotechnology, Santa Cruz, CA, USA) for 24 or 72 h, respectively.
Following treatment with each compound, cells were incubated with
WST-8 reagent for 5 h. The absorbance of each well was measured at
450 nm using a VMax absorbance microplate reader (Molecular
Devices, Sunnyvale, CA, USA). Apoptosis and cell death were
evaluated using the Annexin V-FITC Apoptosis Detection Kit (MBL,
Nagoya, Japan), according to the manufacturer’s instructions.
Western blot analysis
Antibodies against IRF4 (clone M-17) and actin
(clone C-2) were purchased from Santa Cruz Biotechnology. Cell
lysates were prepared using M-PER mammalian protein extraction
reagent (Pierce Biotechnology Inc., Rockford, IL, USA) after
addition of Halt EDTA-free phosphatase inhibitor cocktail and Halt
protease inhibitor cocktail (Pierce Biotechnology Inc.). Cell
lysates were separated in NuPAGE Bis-Tris precast gels (Invitrogen)
and transferred to PVDF membranes using an iBlot Dry Blotting
system (Invitrogen). Membranes were blocked with 5% non-fat dry
milk for 1 h at room temperature, followed by incubation with a
primary antibody at 4°C for 12 h. Membranes were then incubated
with horseradish peroxidase conjugated rabbit anti-goat (Bethyl
Laboratories, Inc., Montgomery, TX, USA) or sheep anti-mouse
secondary antibodies (GE Healthcare, Little Chalfont, UK) for 1 h
at room temperature. Antibody-bound proteins were visualized using
ECL prime western blotting detection reagent (GE Healthcare) and a
bio-image analyzer LAS-1000 (GE Healthcare). The density ratio of
the protein bands was calculated using Image J software (National
Institutes of Health, Bethesda, MD, USA).
Immunohistochemistry
Immunohistochemistry was performed on
paraffin-embedded bone marrow aspirated tissue sections, using
anti-CD138 (clone MI15, Dako) and anti-IRF4 (clone MUM1p, Dako)
antibodies, according to the manufacturer’s instructions.
CD138 magnetic cell sorting
CD138+ and CD138− fractions of
KYMM-2 cells were separated using CD138-immunomagnetic beads
(Miltenyi Biotech, Paris, France) according to the manufacturer’s
protocol. The magnetic cell sorting was conducted twice to increase
the purity of each fraction. The purity of each fraction was
determined as approximately 90%, by flow cytometry.
Statistical analysis
The number of CD138− cells in the
CD38++ fraction was compared using the Mann-Whitney U
test. Patient survival was calculated by the Kaplan-Meier method.
For comparisons of survival curves, the log-rank test was used.
Gene expression levels were compared by the Student’s t-test.
Correlation between the expression of two genes was analyzed by
Spearman’s rank correlation coefficient. Statistical analyses were
performed by Graphpad prism version 5.0 (GraphPad Software, La
Jolla, CA, USA). P-values <0.05 were considered statistically
significant.
Results
Decreased expression of CD138 is an
indicator of poor prognosis
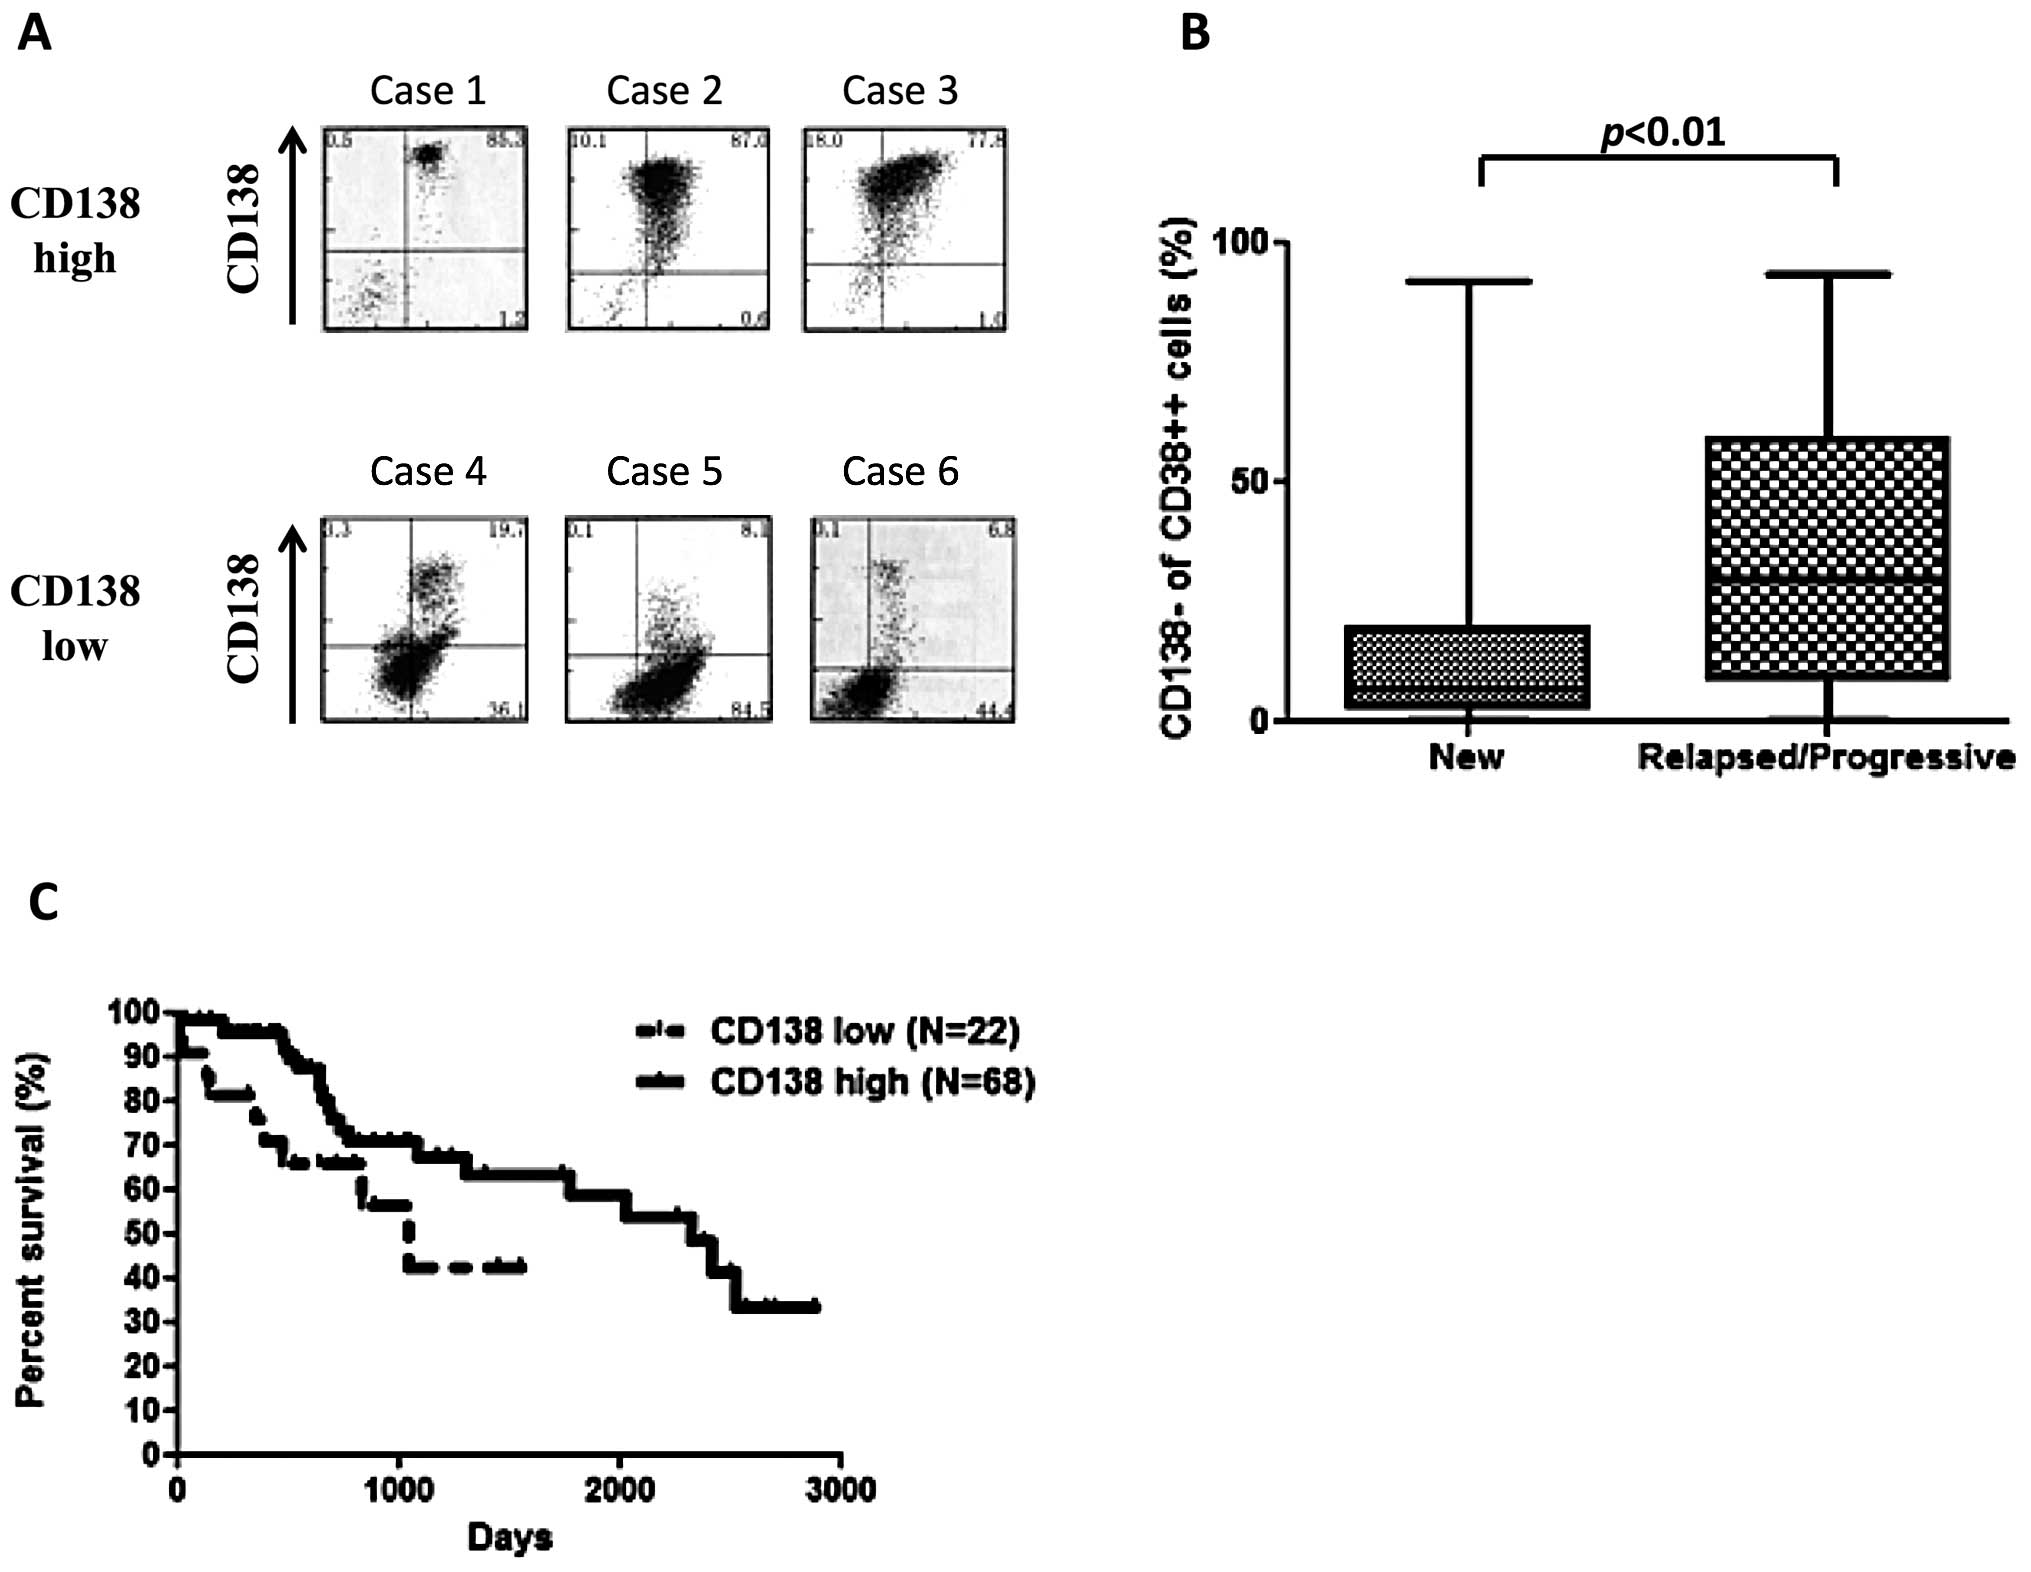
Flow cytometric analysis of CD138 expression in MM
patients, revealed highly variable expression (Fig. 1A). The number of CD138−
cells in the CD38++ fraction of the bone marrow from 90
newly diagnosed patients ranged from 0.1% to 91.8% (median, 6.6%),
with majority of patients (54%) having less than 10% of
CD138− cells. We observed a significant increase in
CD138− cells in relapsed or progressive patients
(median, 29.8%), compared with the newly diagnosed patients
(Fig. 1B. p<0.05, Mann-Whitney
U test). CD138 low patients, defined as those patients with greater
than 20% CD138− cells, had a worse over overall survival
(OS) compared with CD138 high patients (Fig. 1C. p<0.05, log-rank). Survival
analysis of patients receiving high-dose chemotherapy followed by
autologous stem-cell transplantation also revealed that CD138 low
patients had a worse prognosis than that of CD138 high cases (data
not shown, p<0.05).
Establishment of KYMM-1 and KYMM-2 MM
cell lines
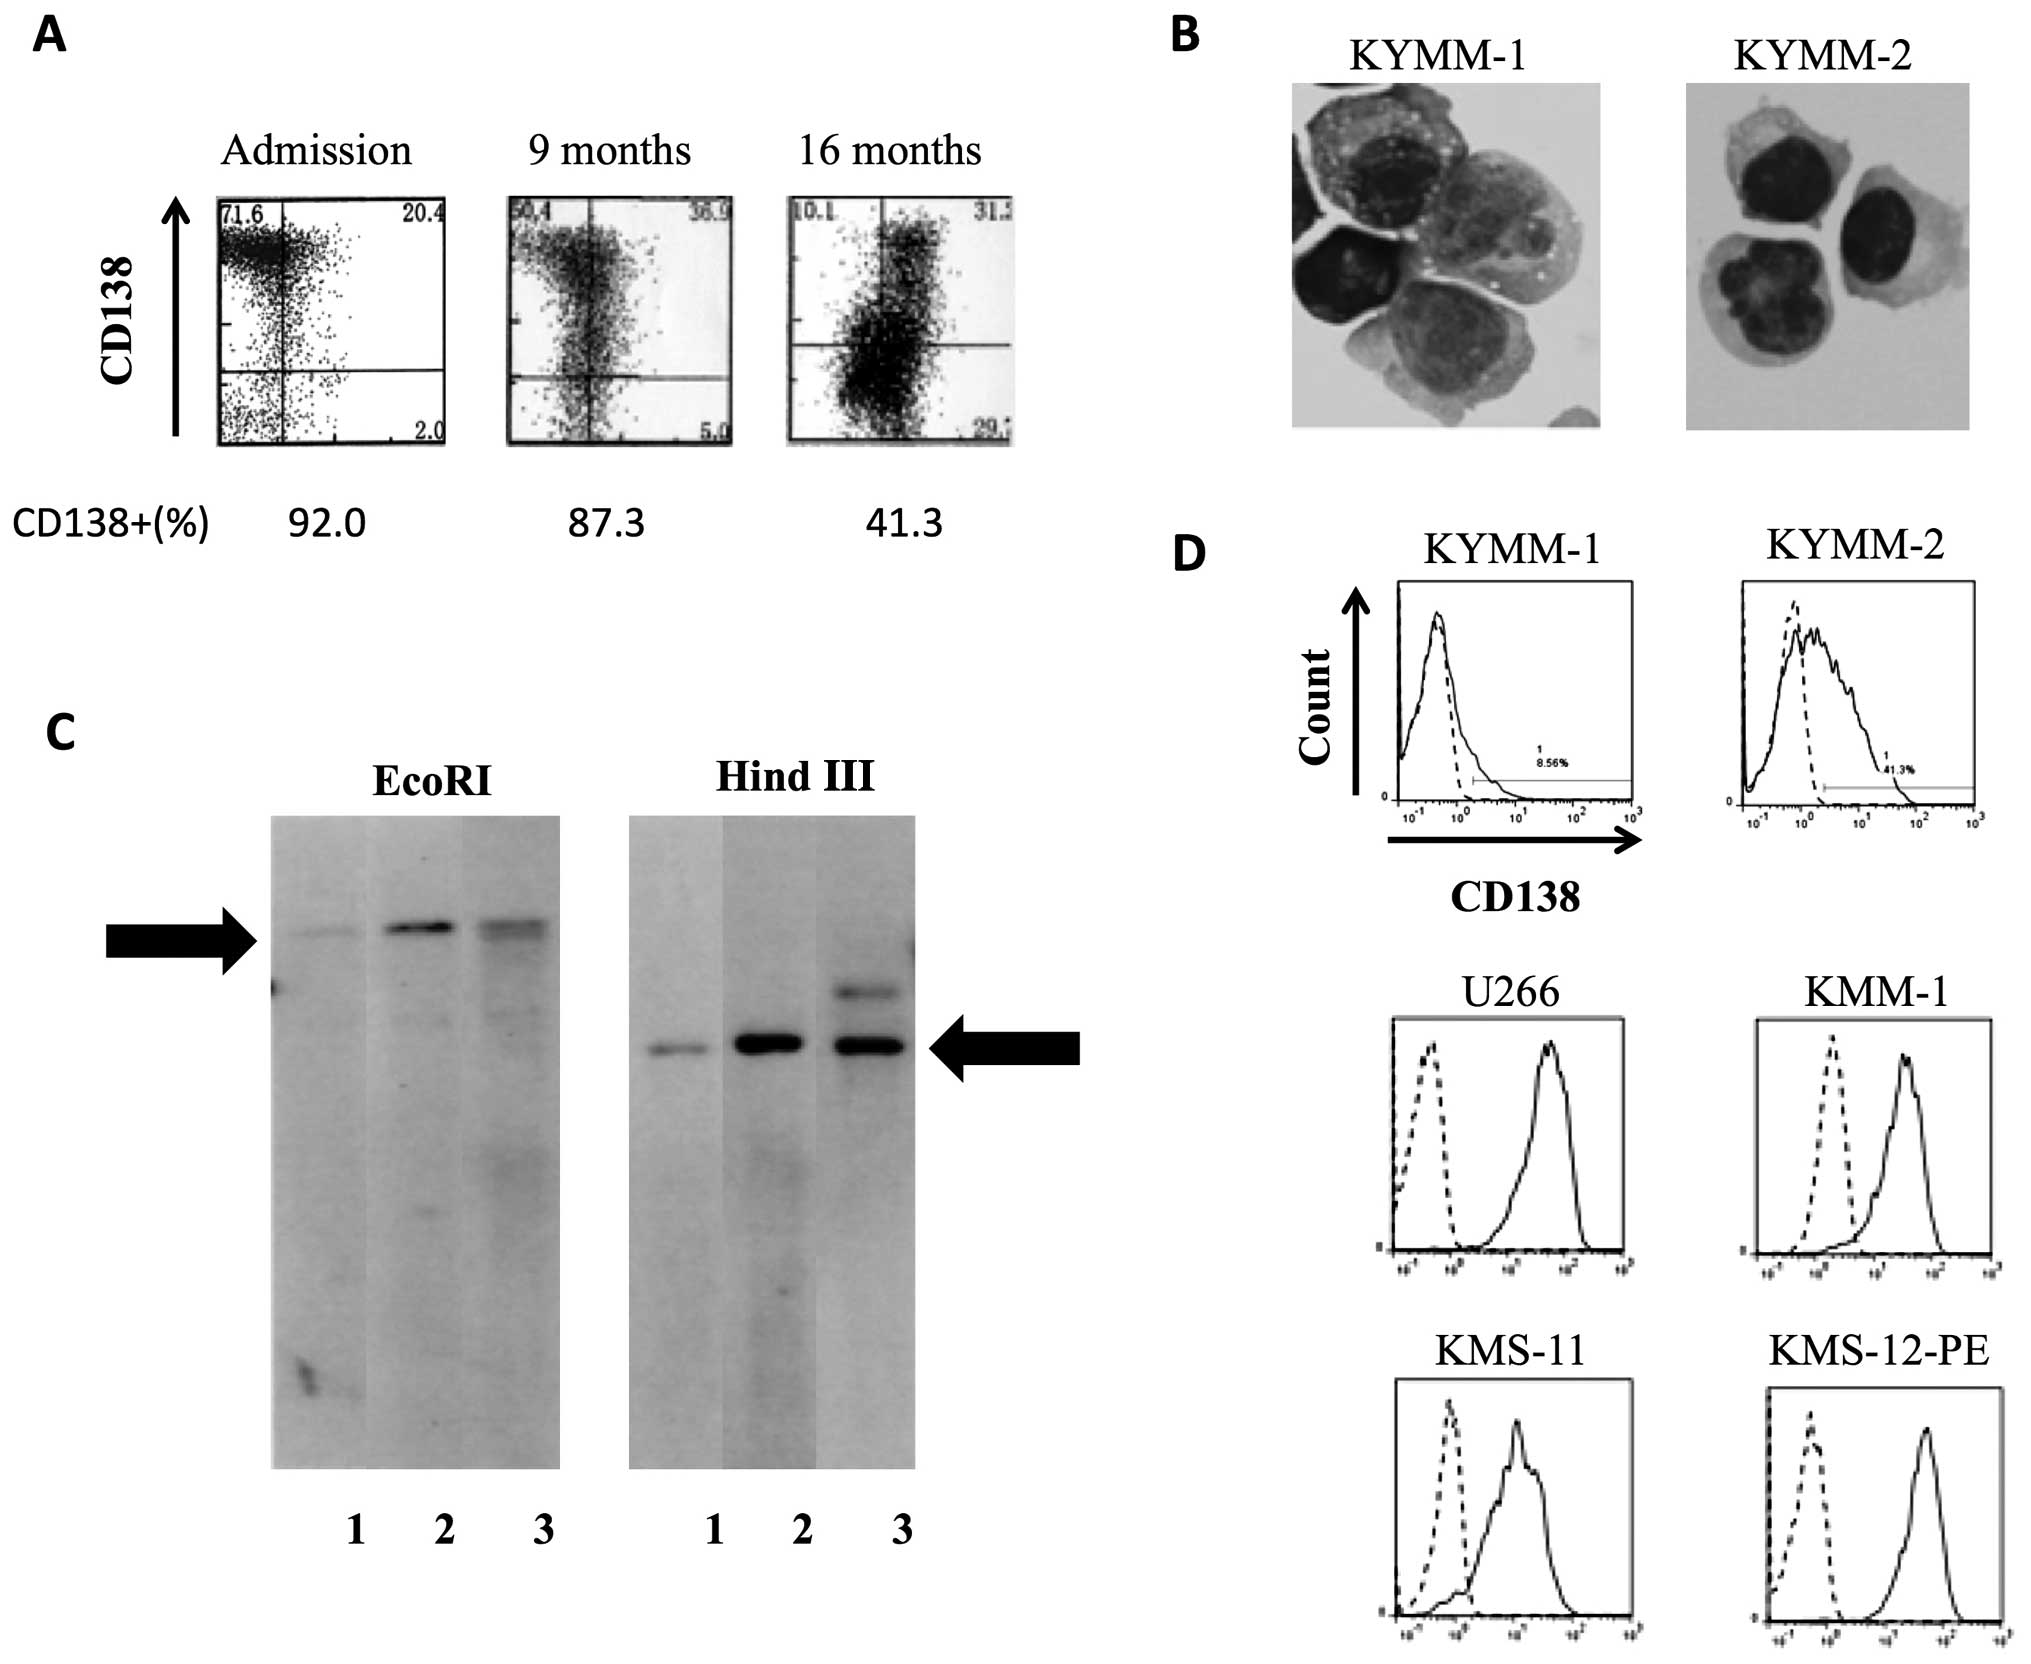
KYMM-1 and KYMM-2 cell lines were established from
cells obtained from the pleural effusion of a single MM patient,
whose CD138 expression decreased during the clinical course
(Fig. 2A). KYMM-1 displayed a
plasmablastic morphology with cytoplasmic vacuoles, while KYMM-2
exhibited a more mature morphology (Fig. 2B). Southern blot analysis revealed
that KYMM-1, KYMM-2 and cells from patient’s pleural effusion
shared the same immunoglobulin rearrangement, indicating clonality
between these cell lines and primary patient cells (Fig. 2C). DNA profiles of 9 STR-loci and
amelogenin were identical among KYMM-1, KYMM-2 and the patient’s
pleural effusion cells (data not shown), further confirming that
these two cell lines are derived from the same individual. No EB
virus genome was detected in the two cell lines.
Despite being established from a single patient, we
observed differential expression of CD138 in KYMM-1 (8.6%) and
KYMM-2 (41.3%) cell lines (Fig.
2D). In comparison, CD138 was expressed at higher levels in
U266, KMM-1, KMS-11 and KMS-12-PE MM cell lines. Flow cytometric
analysis of other antigens revealed that both KYMM-1 and KYMM-2
expressed high levels of CD38 and cytoplasmic κ light chain (Cy-κ),
while CD45 was highly expressed in KYMM-1 and CD56 was expressed
only in KYMM-2 (Table II). CD19
and CD20 were absent in both cell lines.
| Table IISurface antigen expression of KYMM-1
and KYMM-2. |
Table II
Surface antigen expression of KYMM-1
and KYMM-2.
| KYMM-1 | KYMM-2 |
|---|
| CD19 | 0 | 0 |
| CD20 | 0 | 0 |
| CD27 | 0 | 0 |
| CD34 | 0 | 0 |
| CD38 | 92.7 | 98.2 |
| CD44 | 99.5 | 98.3 |
| CD45 | 92.1 | 35.9 |
| CD54 | 93.1 | 98.4 |
| CD56 | 0 | 43 |
| CD138 | 8.6 | 41.3 |
| Cy-κ | 95.7 | 97.2 |
Analysis of gene expression in KYMM-1
and KYMM-2 cells
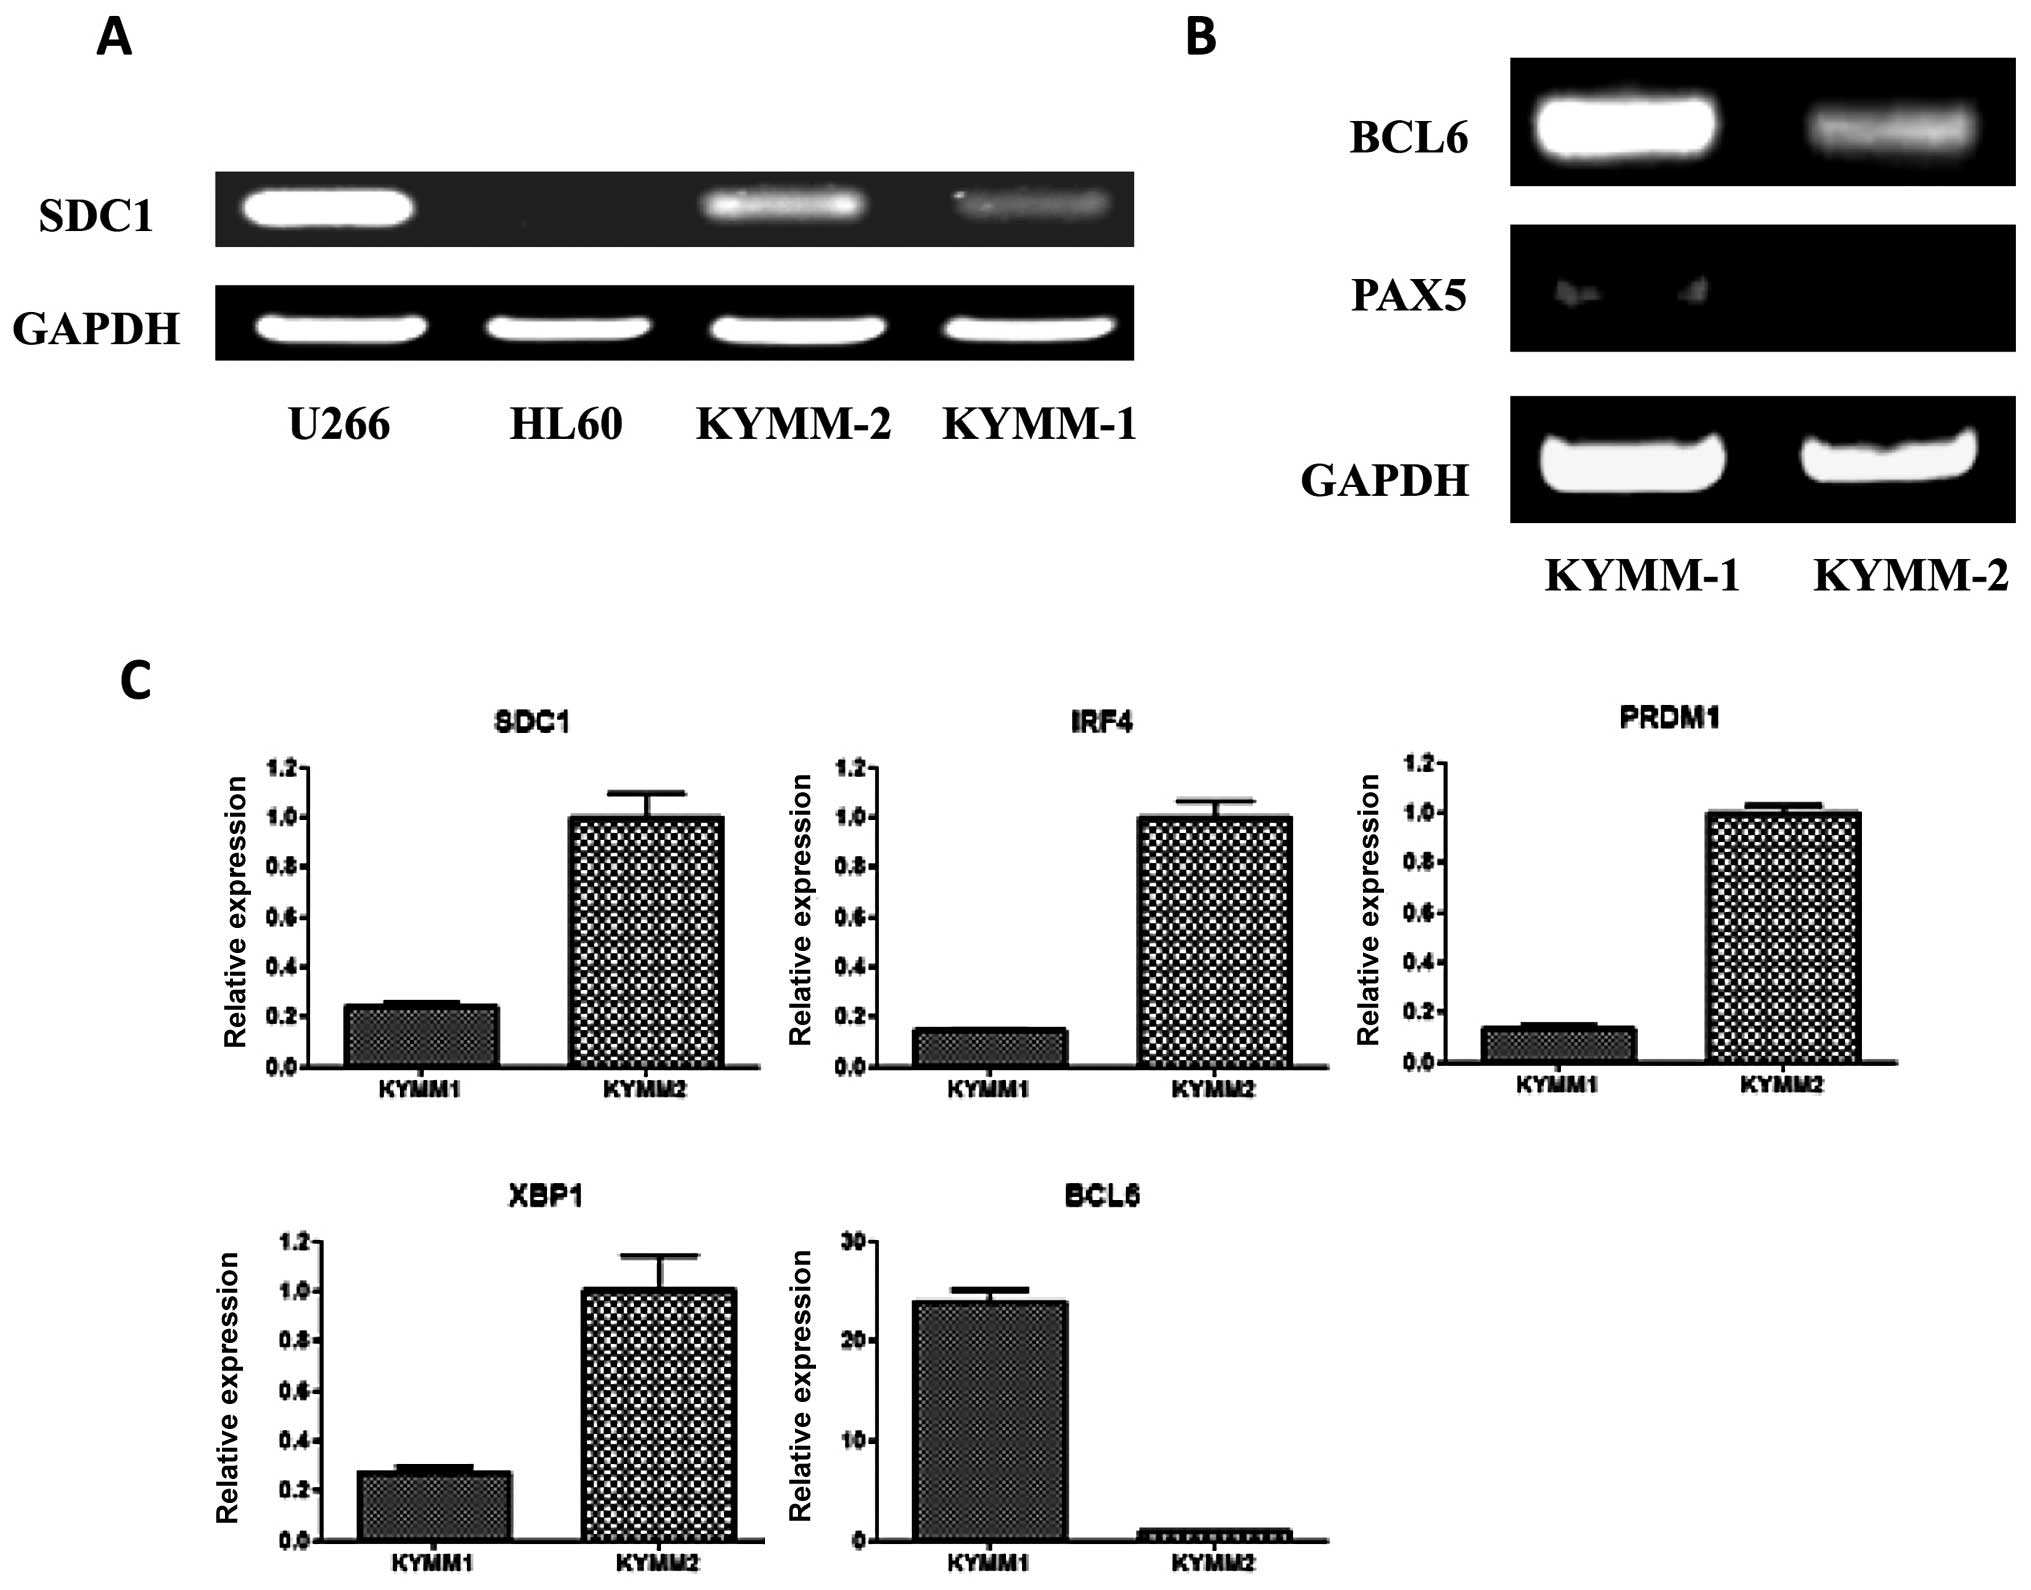
Given the difference in surface antigen expression
of CD138 between KYMM-1 and KYMM-2 cells, we examined the
expression of SDC1 mRNA in the two cell lines by RT-PCR
(Fig. 3A). In accordance with the
observed cell surface expression of CD138, SDC1 expression
was decreased in KYMM-1 compared with KYMM-2. No methylation in the
SDC1 promoter region of KYMM-1 and KYMM-2 was observed by
bisulfite sequencing, indicating that the decrease in SDC1
expression was not related to promoter methylation (data not
shown).
Because CD138 expression is highly specific for
terminally differentiated plasma cells (1), we hypothesized that KYMM-1 may have a
less mature phenotype compared with KYMM-2. To investigate this, we
assessed the expression of BCL6 and PAX5
transcription factors, which play a role in B-cell differentiation
and are downregulated in mature plasma cells (21), by RT-PCR in KYMM-1 and KYMM-2
cells. BCL6 and PAX5 expression was clearly detected
in KYMM-1 cells, while expression was decreased or absent in KYMM-2
cells (Fig. 3B). Gene expression
of IRF4, PRDM1 and XBP1, which are also plasma
cell specific transcription factors (21), was analyzed by real-time RT-PCR. In
accordance with the downregulation of SDC1 in KYMM-1 cells,
IRF4, PRDM1 and XBP1 levels were also
decreased in KYMM-1 compared with KYMM-2 cells (Fig. 3C). Taken together, these results
indicate that the CD138 low cell line, KYMM-1 has an immature gene
expression profile, compared with KYMM-2.
KYMM-1 cells are less sensitive to
lenalidomide treatment than KYMM-2
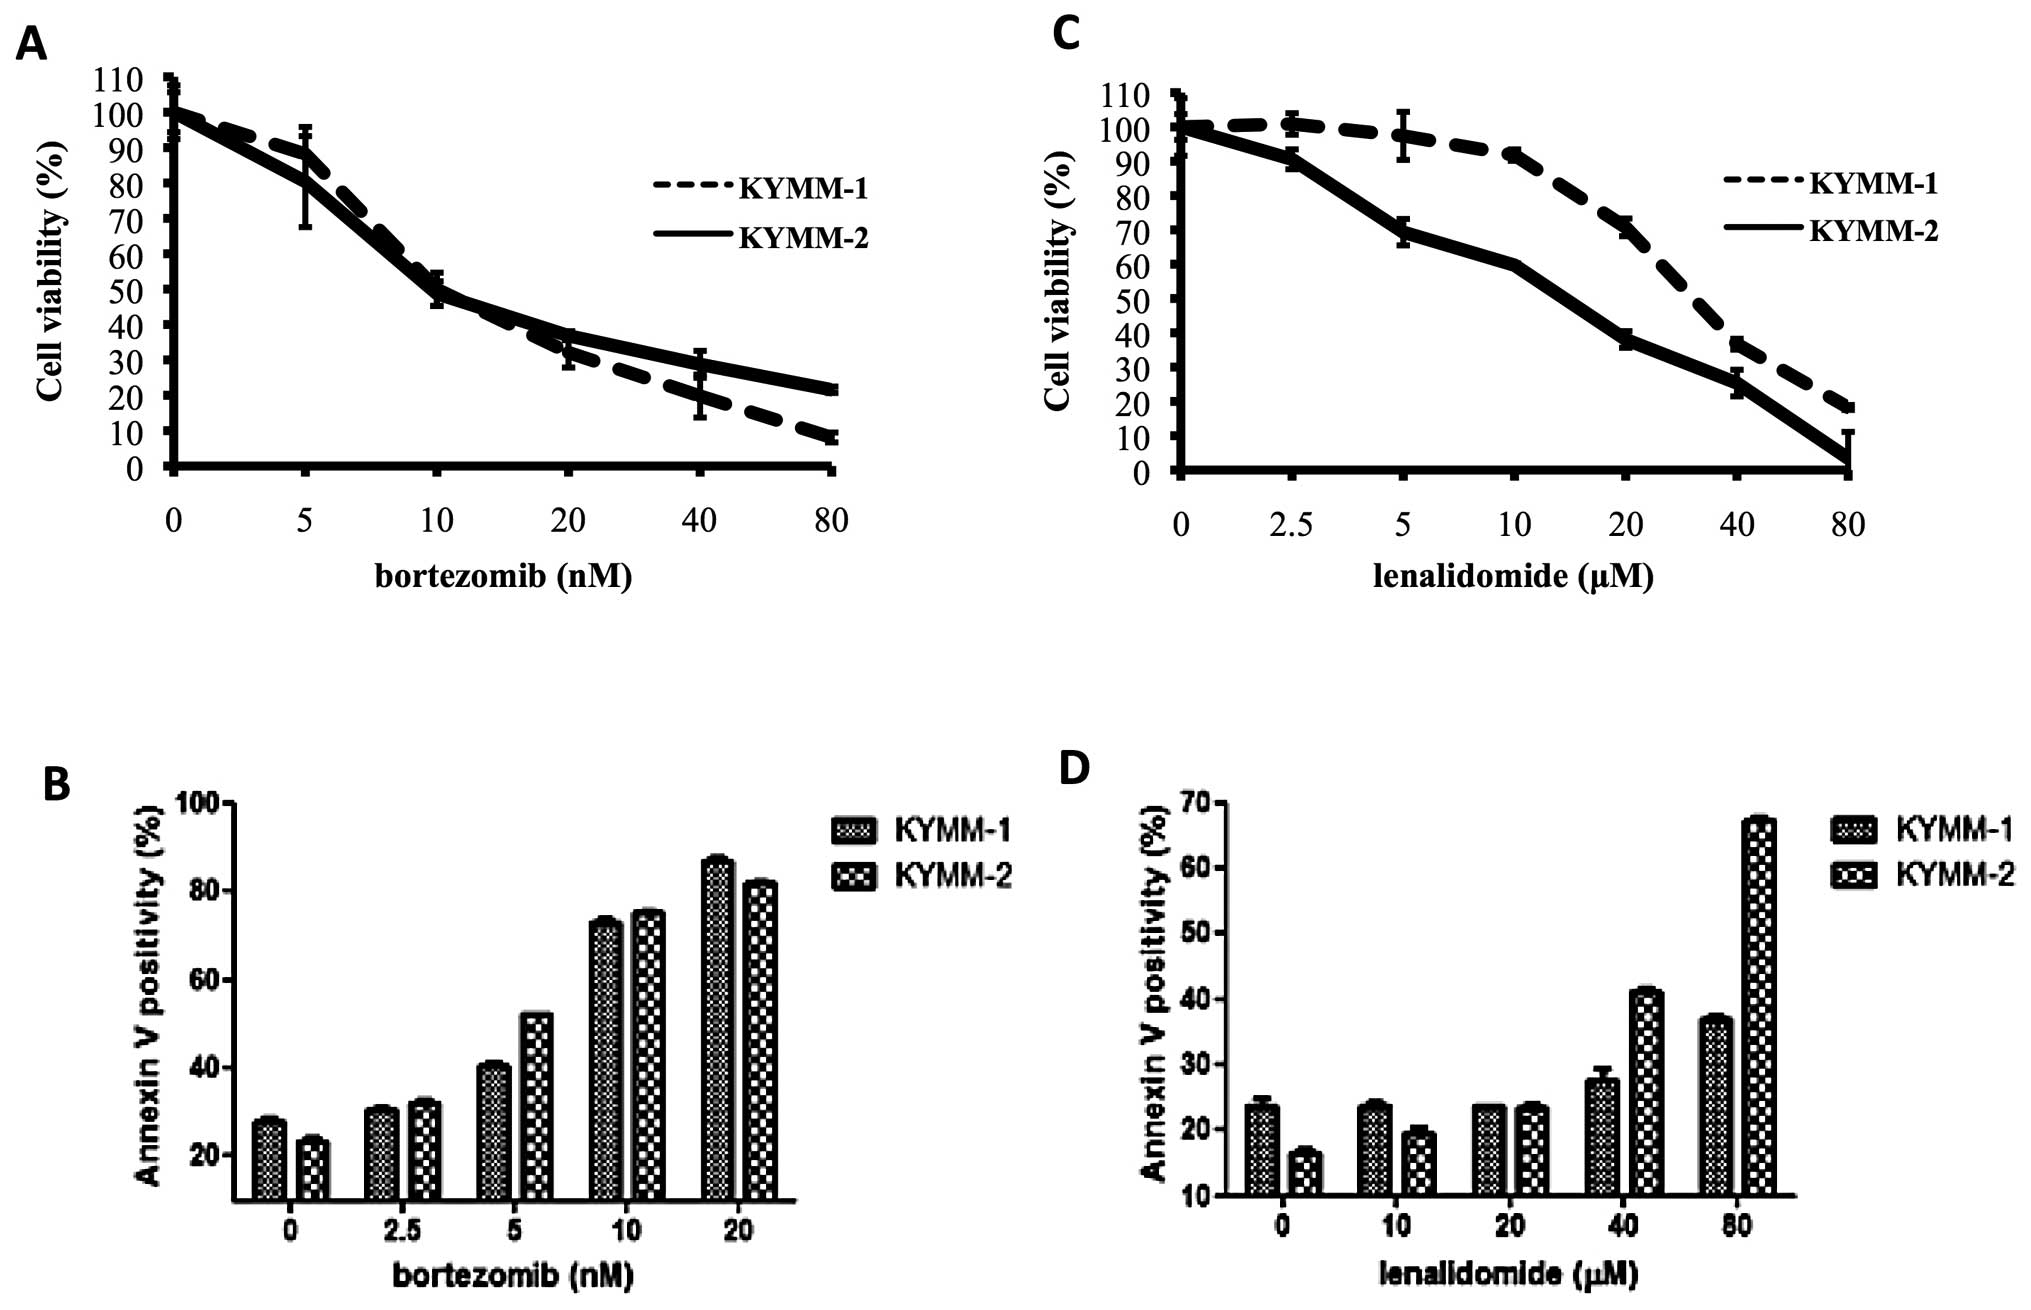
We next assessed the sensitivity of KYMM-1 and
KYMM-2 cells to bortezomib and lenalidomide, to investigate whether
their phenotype influenced drug sensitivity. While no significant
difference in bortezomib sensitivity was observed between the two
cell lines (Fig. 4A and B), KYMM-1
cells were more refractory to lenalidomide compared with KYMM-2
(Fig. 4C). Indeed, we observed a
marked increase in Annexin V positive KYMM-2 cells compared with
KYMM-1 cells following treatment with 40 and 80 μM of
lenalidomide (Fig. 4D). These
results indicate that cells expressing decreased levels of CD138
may be resistant to lenalidomide, while bortezomib treatment is
equally effective.
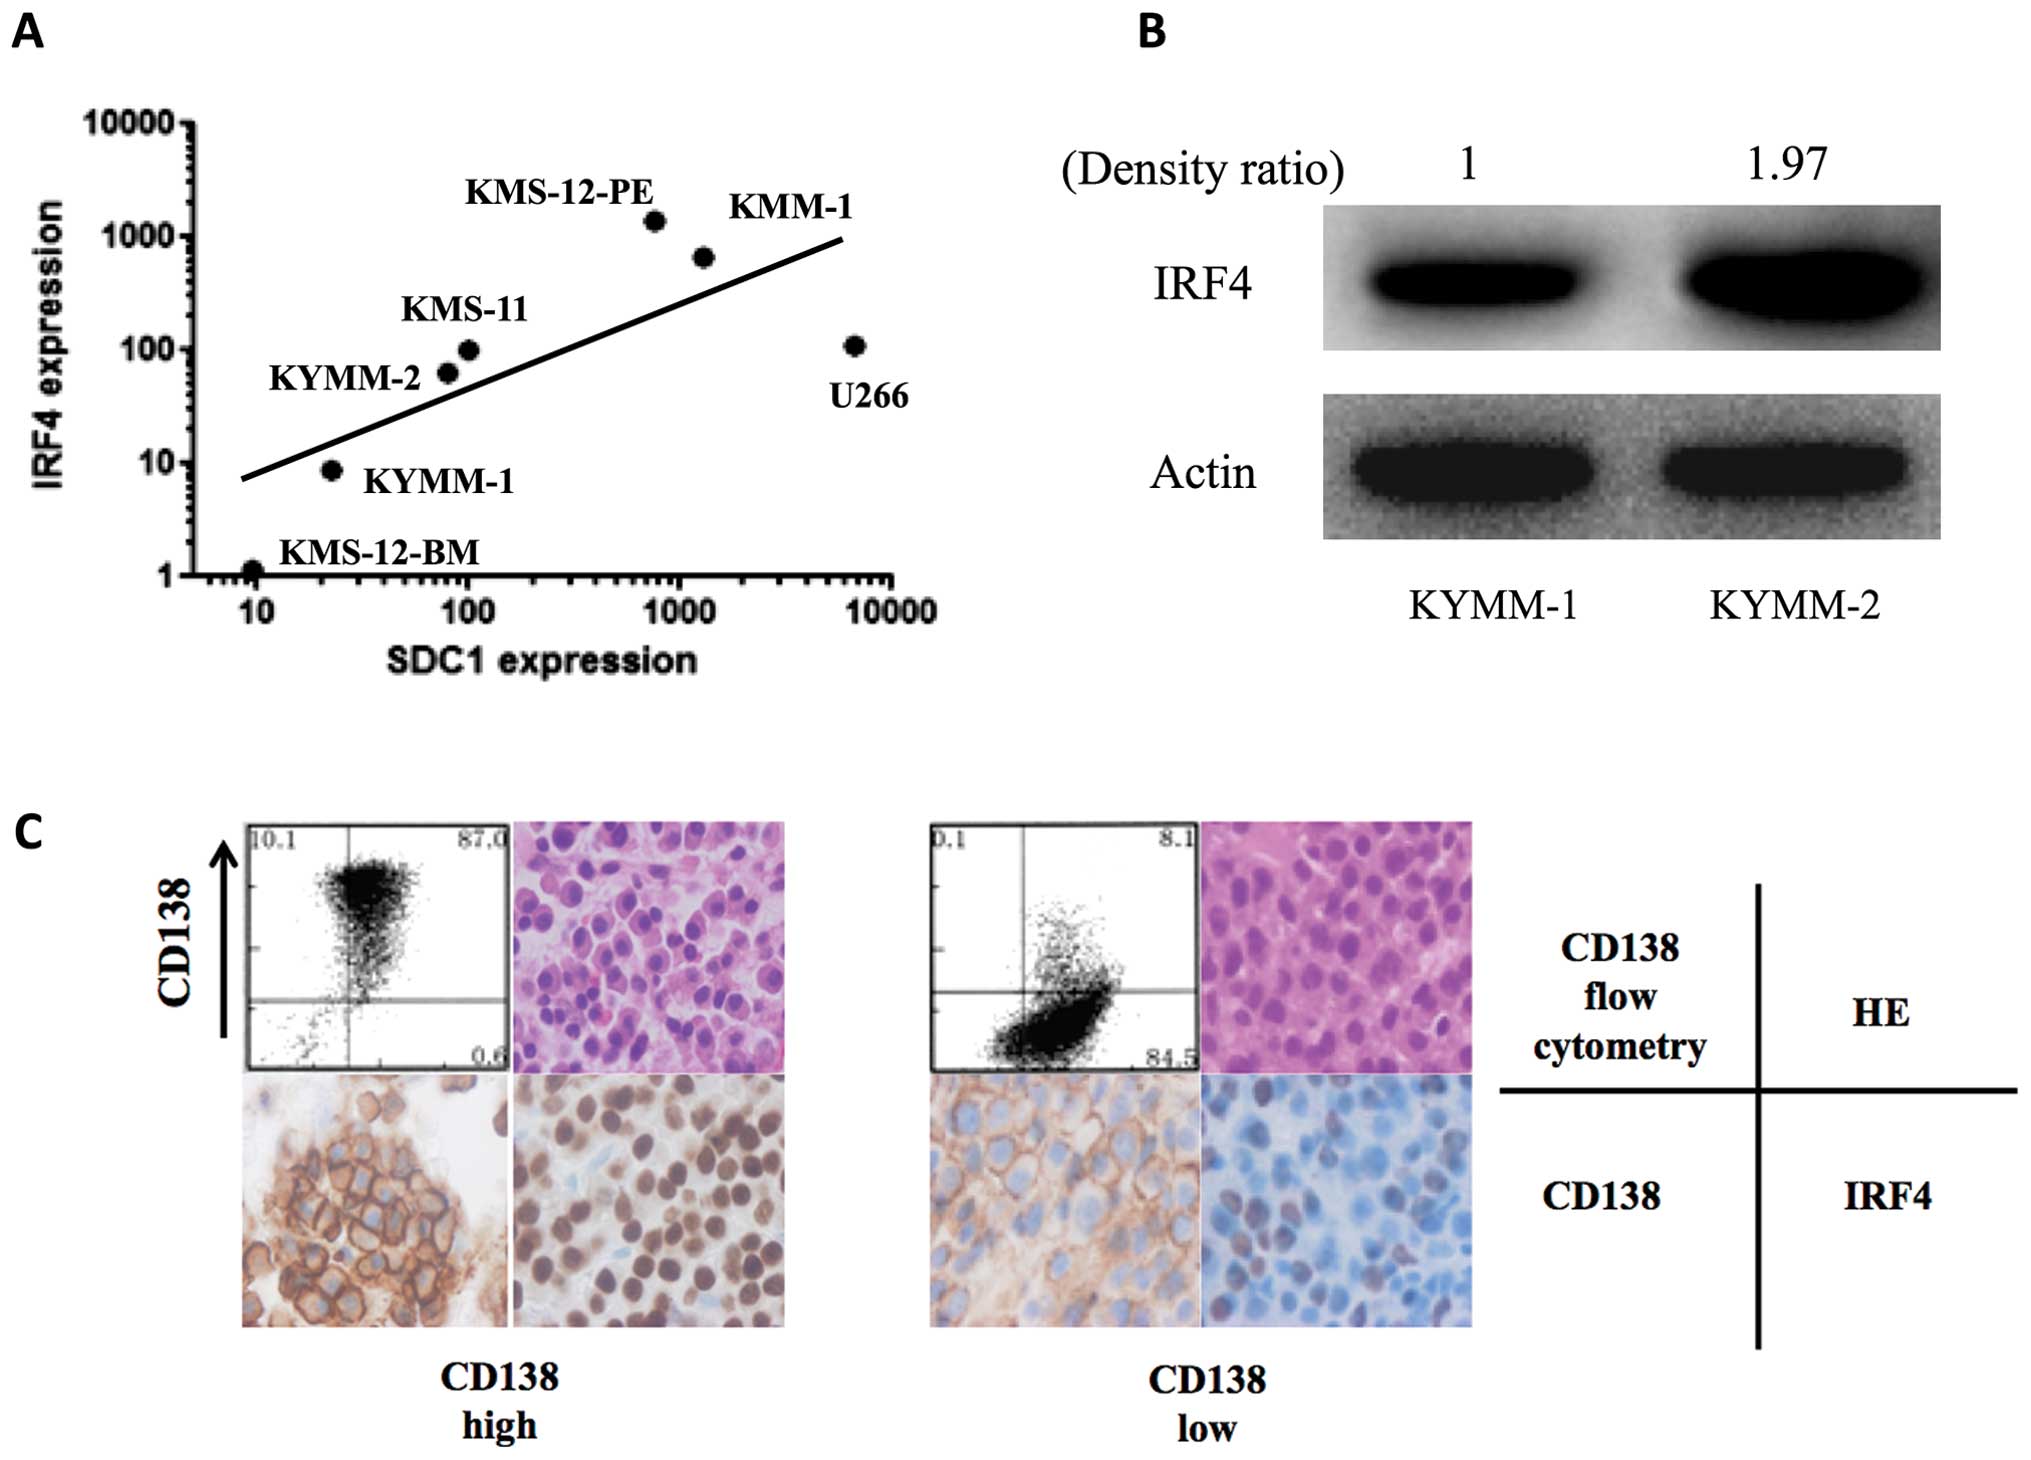
Correlation of CD138 and IRF4
expression
Recent studies demonstrate that IRF4 is a key target
of lenalidomide, and high IRF4 levels have been correlated with
increased lenalidomide sensitivity (22,23).
Since the CD138 low MM cell line, KYMM-1, displayed decreased
IRF4 expression and low sensitivity to lenalidomide, we
examined the correlation between SDC1 and IRF4
expression by real-time RT-PCR in 7 MM cell lines, including KYMM-1
and KYMM-2. We observed a positive correlation between SDC1
and IRF4 gene expression (Fig.
5A, r=0.86, p=0.024, Spearman’s rank correlation coefficient).
Analysis of IRF4 protein levels by western blot, revealed decreased
expression in KYMM-1 compared with KYMM-2 cells (Fig. 5B), which was compatible with the
RNA analysis. This tendency was also observed in primary MM cells,
since IRF4 downregulation was observed in MM cells with decreased
CD138 expression (Fig. 5C). These
results indicate that the decrease in CD138 in MM cells accompanies
IRF4 downregulation, which may lead to decreased sensitivity to
lenalidomide.
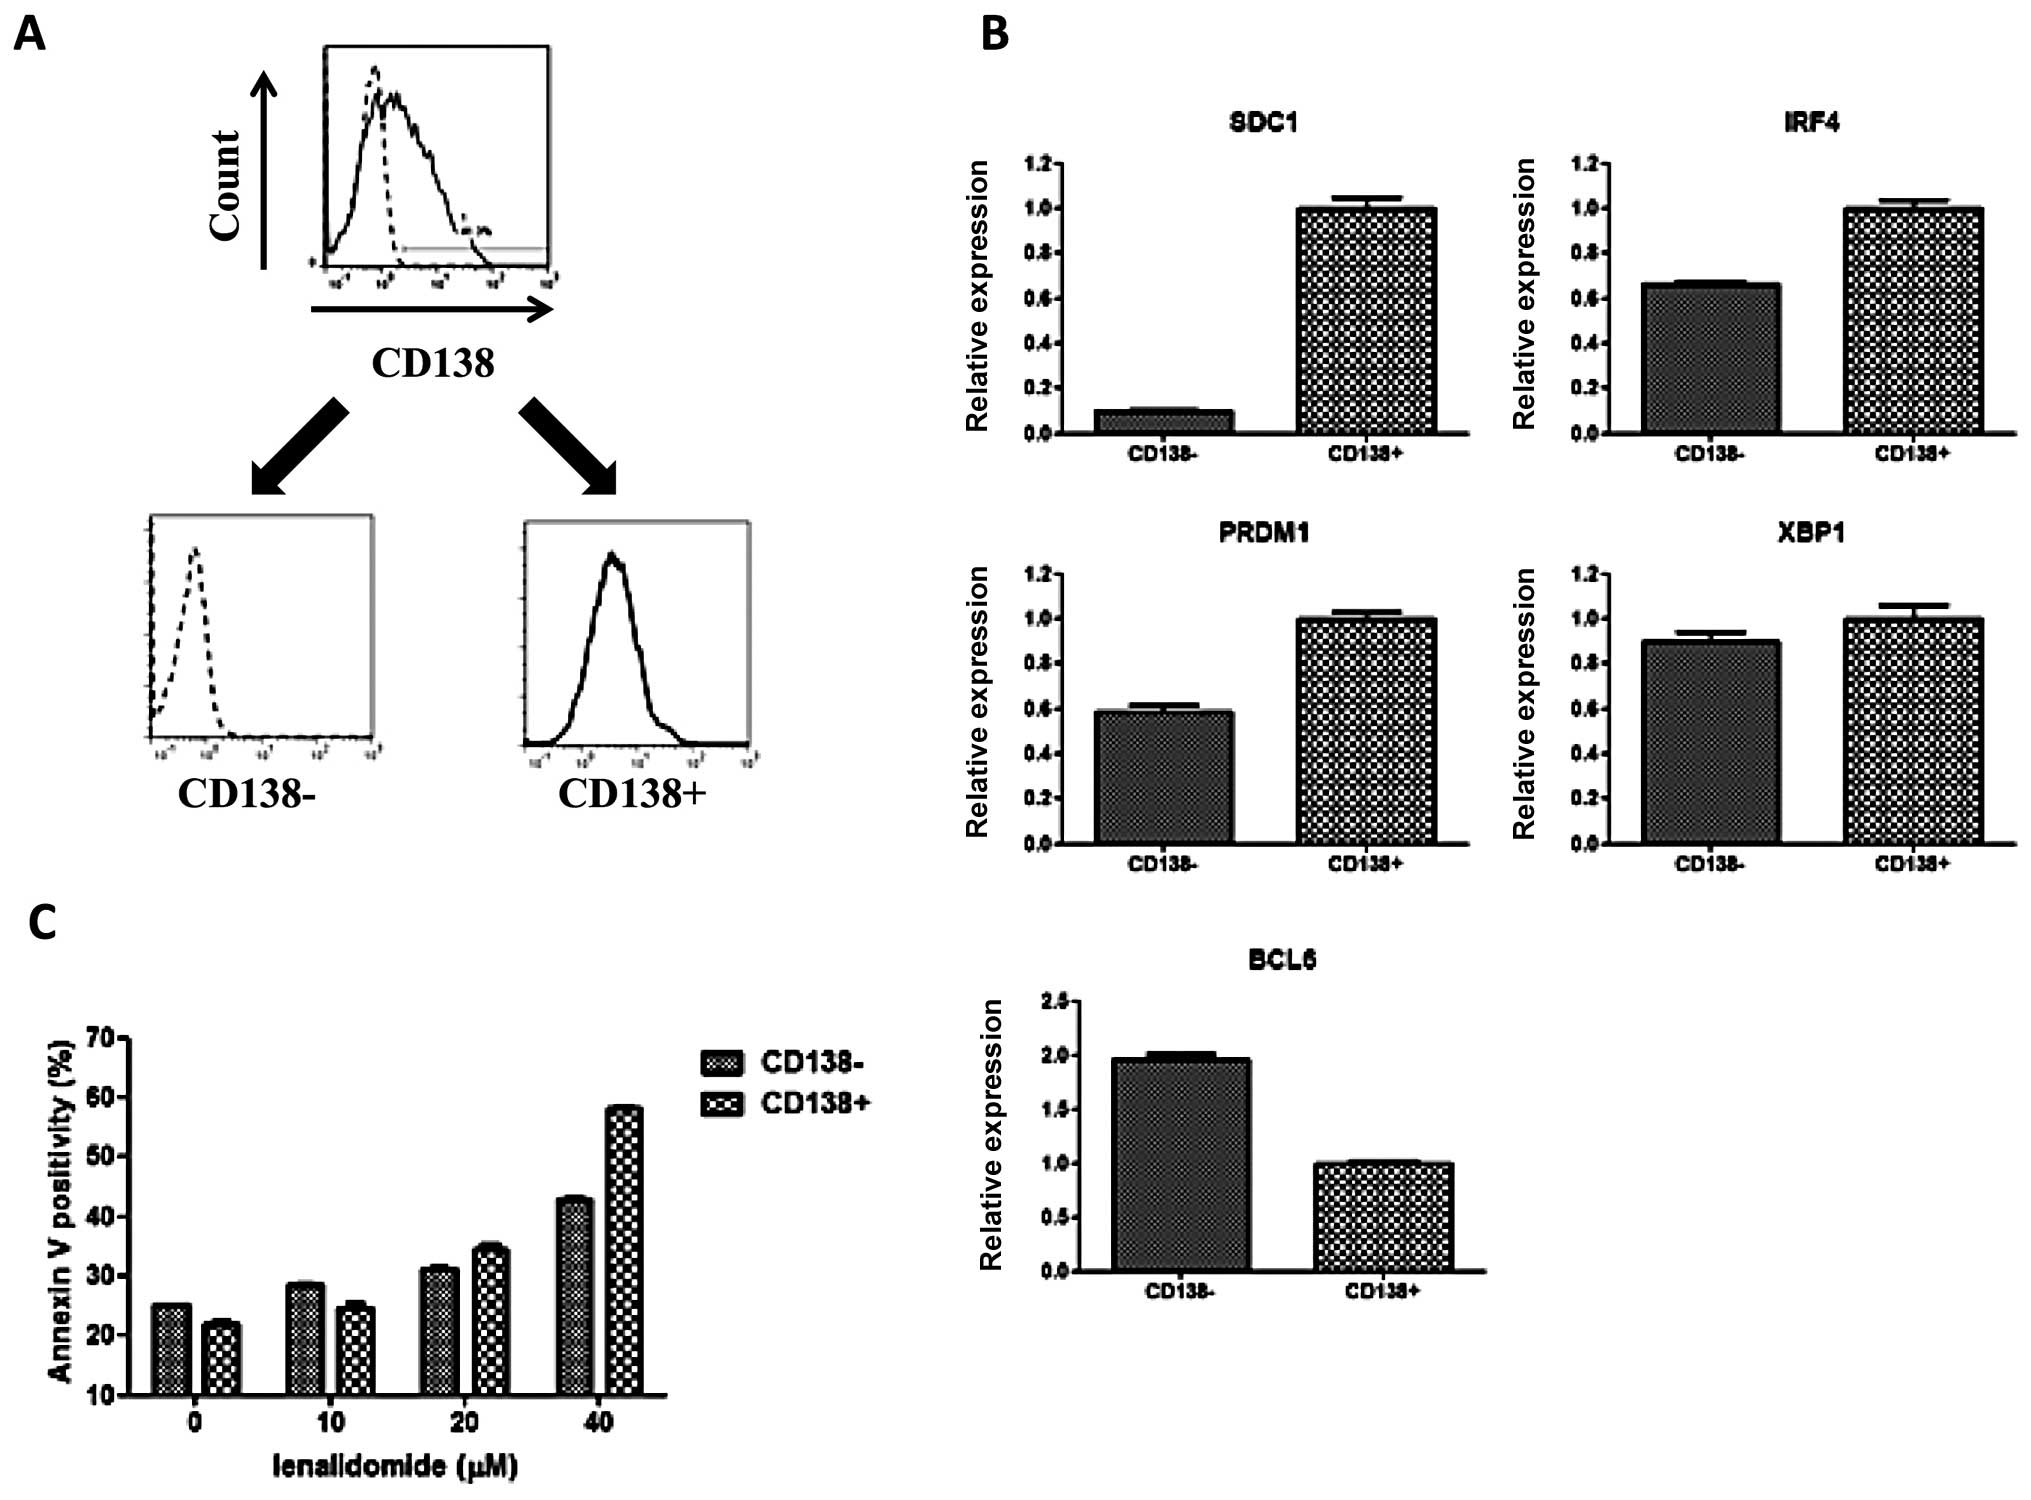
Fractionation of KYMM-2
To further analyze the phenotype related to CD138
expression, we sorted KYMM-2 cells into CD138+ and
CD138− fractions using CD138 magnetic beads (Fig. 6A). As observed in our previous
comparison, we also found that both IRF4 and PRDM1
gene expression was elevated in the CD138+ fraction,
while BCL6 expression was highest in the CD138−
fraction (Fig. 6B). Furthermore,
an increase in Annexin V positive cells was observed at 40
μM of lenalidomide in the CD138+ fraction
compared with CD138− fraction, suggesting reduced
sensitivity of CD138− cells to lenalidomide (Fig. 6C). These data demonstrate that
CD138− and CD138+ fractions obtained from
KYMM-2 have similar phenotypes as identified in KYMM-1 and KYMM-2,
although the differences were not as large as those observed
between KYMM-1 and KYMM-2.
Discussion
The aim of this study was to determine the
characteristics and the clinical significance of CD138−
MM cells. In the present study, variability in CD138 expression in
MM cells was observed as previously reported (7,8).
Importantly, we observed an increase in CD138− cells in
relapsed or progressive patients (median, 29.8%) compared with
newly diagnosed patients (median, 6.6%). Therefore, population of
refractory disease status should influence the outcome of CD138
expression analysis. For example, the higher frequency of
CD138− MM cells reported by Reid et al(8) may be attributed to the significant
number of refractory cases in this patient cohort.
Previous studies have reported that the mean
fluorescence intensity (MFI) of CD138 significantly decreases in MM
cells compared with normal plasma cells (24), suggesting that CD138+ MM
cells are more closely related to normal plasma cells compared with
their CD138− counterparts. This hypothesis may be
compatible with our results focusing on untreated cases, which
showed that CD138 low patients had poor prognosis compared with
CD138 high patients. Interestingly, even patients receiving
high-dose chemotherapy showed similar results (data not shown). To
our knowledge, this is the first report demonstrating a correlation
between CD138 expression and MM prognosis. Since our study is a
retrospective analysis in a heterogeneous group of patients, the
data should be investigated further in a prospective randomized
study. However, CD138 low cells exist in a subset of MM patients
and should be evaluated carefully, since CD138 expression has
previously been considered as a hallmark of MM cells (5). Identification of MM cells using CD138
expression as a sole identifying factor, may fail to identify
CD138− MM cells.
We have established two MM cell lines, KYMM-1 and
KYMM-2, from a patient expressing declining levels of CD138. To our
knowledge, the KYMM-1 cell line is one of the lowest
CD138-expressing MM cell lines, compared with the previously
established cell lines (25).
While KYMM-1 expresses low levels of CD138, it is still considered
a myeloma cell line, since it expresses high levels of CD38 and the
cytoplasmic kappa light chain, and lacks CD19 expression and the EB
virus genome. CD45, which is also highly expressed on KYMM-1 cells,
is considered to be associated with a more primitive plasma cell
phenotype (26), indicating that
KYMM-1 is less mature than KYMM-2. Furthermore, our analysis of
transcription factors revealed preferential expression of genes
expressed at the immature B-cell stage compared with terminally
differentiated plasma cells, such as BCL6 and PAX5,
and lower expression of genes associated with mature plasma cells,
including IRF4, PRDM1 and XBP1 in KYMM-1
compared with KYMM-2. A similar pattern of gene expression was also
identified in the CD138− fraction of KYMM-2 cells. These
findings are not surprising, since previous reports have shown that
B-cell transcription factors such as BCL6 and PAX5, are expressed
in a subset of MM cells (5,27,28).
Another report showed that the expression of SDC1 in MM cells
decreased following adhesion to stromal cells, which was
accompanied by an increase in the ratio of BCL6 to PRDM1 expression
(29). This indicates that CD138
is not always overexpressed in MM cells, and is dynamically
regulated in accordance with transcription factors related to
B-cell maturation. In this study, we hypothesize that CD138
down-regulation may require immature transcription status.
CD138 negative cells have recently been proposed as
myeloma stem cells. Based on previous studies by Matsui et
al, which reported that MM stem cells express CD138−
CD20+ CD27+(30), we assessed the surface expression
of CD20 and CD27 in KYMM-1 and KYMM-2 cell lines. This analysis
revealed that neither KYMM-1 nor KYMM-2 expressed CD20 or CD27.
Analysis of ALDH activity, which is a characteristic of MM stem
cells (30,31), revealed no difference between
KYMM-1 and KYMM-2 cells (data not shown). Thus, while KYMM-1 cells
displayed an immature gene expression profile, there is no evidence
thus far that it exhibits MM stem cell-like features.
In this study, we found that low expression of CD138
was an adverse prognostic factor, even in patients treated with
high-dose chemotherapy. Interestingly, while no difference in
sensitivity to bortezomib was observed between the two MM cell
lines, KYMM-1 was more resistant to lenalidomide compared with
KYMM-2. This tendency was also observed in a subset of KYMM-2 cells
with low CD138 expression. Recent reports show that high IRF4
expression correlates with increased lenalidomide sensitivity
(22,23). Our analysis revealed that
downregulation of IRF4 in KYMM-1 may provide a mechanism for the
observed lower sensitivity of KYMM-1 to lenalidomide. Our finding
showing the correlation between IRF4 and SDC1
expression in MM cell lines may also explain the poor response of
CD138 low patients to lenalidomide, which may contribute to poor
prognosis, although only a small number of heterogeneously treated
cases were analyzed. Additional detailed, prospective
investigations in a homogenously treated cohort are required to
draw a definitive conclusion.
Taken together, our observations suggest that low
CD138 expression is associated with i) poor prognosis, ii) immature
phenotype and iii) refractoriness to lenalidomide. The observed,
distinct characteristics of CD138 low MM cells, suggest that this
should be recognized as a new clinical entity. Establishment of a
treatment strategy for patients with CD138 low MM cells is
necessary to improve their poor outcome.
Acknowledgements
This study was supported by
Grant-in-Aid for Cancer Research from the Ministry of Health,
Labour and Welfare, Japan.
References
|
1
|
Calame KL: Plasma cells: finding new light
at the end of B cell development. Nat Immunol. 2:1103–1108. 2001.
View Article : Google Scholar : PubMed/NCBI
|
|
2
|
Dhodapkar MV, Abe E, Theus A, et al:
Syndecan-1 is a multi-functional regulator of myeloma pathobiology:
control of tumor cell survival, growth, and bone cell
differentiation. Blood. 91:2679–2688. 1998.PubMed/NCBI
|
|
3
|
Ridley RC, Xiao H, Hata H, Woodliff J,
Epstein J and Sanderson RD: Expression of syndecan regulates human
myeloma plasma cell adhesion to type I collagen. Blood. 81:767–774.
1993.PubMed/NCBI
|
|
4
|
Wijdenes J, Vooijs WC, Clement C, et al: A
plasmocyte selective monoclonal antibody (B-B4) recognizes
syndecan-1. Br J Haematol. 94:318–323. 1996. View Article : Google Scholar : PubMed/NCBI
|
|
5
|
Zhan F, Huang Y, Colla S, et al: The
molecular classification of multiple myeloma. Blood. 108:2020–2028.
2006. View Article : Google Scholar : PubMed/NCBI
|
|
6
|
Ikeda H, Hideshima T, Fulciniti M, et al:
The monoclonal antibody nBT062 conjugated to cytotoxic
Maytansinoids has selective cytotoxicity against CD138-positive
multiple myeloma cells in vitro and in vivo. Clin Cancer Res.
15:4028–4037. 2009. View Article : Google Scholar
|
|
7
|
Witzig TE, Kimlinger T, Stenson M and
Therneau T: Syndecan-1 expression on malignant cells from the blood
and marrow of patients with plasma cell proliferative disorders and
B-cell chronic lymphocytic leukemia. Leuk Lymphoma. 31:167–175.
1998. View Article : Google Scholar : PubMed/NCBI
|
|
8
|
Reid S, Yang S, Brown R, et al:
Characterisation and relevance of CD138-negative plasma cells in
plasma cell myeloma. Int J Lab Hematol. 32:e190–e196. 2010.
View Article : Google Scholar : PubMed/NCBI
|
|
9
|
Matsui W, Huff CA, Wang Q, et al:
Characterization of clonogenic multiple myeloma cells. Blood.
103:2332–2336. 2004. View Article : Google Scholar : PubMed/NCBI
|
|
10
|
Harada H, Kawano MM, Huang N, et al:
Phenotypic difference of normal plasma cells from mature myeloma
cells. Blood. 81:2658–2663. 1993.PubMed/NCBI
|
|
11
|
Ohmori M, Nagai M, Fujita M, et al: A
novel mature B-cell line (DOBIL-6) producing both parathyroid
hormone-related protein and interleukin-6 from a myeloma patient
presenting with hypercalcaemia. Br J Haematol. 101:688–693. 1998.
View Article : Google Scholar : PubMed/NCBI
|
|
12
|
Togawa A, Inoue N, Miyamoto K, Hyodo H and
Namba M: Establishment and characterization of a human myeloma cell
line (KMM-1). Int J Cancer. 29:495–500. 1982. View Article : Google Scholar : PubMed/NCBI
|
|
13
|
Namba M, Ohtsuki T, Mori M, et al:
Establishment of five human myeloma cell lines. In Vitro Cell Dev
Biol. 25:723–729. 1989. View Article : Google Scholar : PubMed/NCBI
|
|
14
|
Ohtsuki T, Yawata Y, Wada H, Sugihara T,
Mori M and Namba M: Two human myeloma cell lines, amylase-producing
KMS-12-PE and amylase-non-producing KMS-12-BM, were established
from a patient, having the same chromosome marker,
t(11;14)(q13;q32). Br J Haematol. 73:199–204. 1989. View Article : Google Scholar
|
|
15
|
Nilsson K, Bennich H, Johansson SG and
Ponten J: Established immunoglobulin producing myeloma (IgE) and
lymphoblastoid (IgG) cell lines from an IgE myeloma patient. Clin
Exp Immunol. 7:477–489. 1970.PubMed/NCBI
|
|
16
|
Birnie GD: The HL60 cell line: a model
system for studying human myeloid cell differentiation. Br J
Cancer. (Suppl)9:41–45. 1988.PubMed/NCBI
|
|
17
|
Mahmoud MS, Huang N, Nobuyoshi M, Lisukov
IA, Tanaka H and Kawano MM: Altered expression of Pax-5 gene in
human myeloma cells. Blood. 87:4311–4315. 1996.PubMed/NCBI
|
|
18
|
Tatetsu H, Ueno S, Hata H, et al:
Down-regulation of PU.1 by methylation of distal regulatory
elements and the promoter is required for myeloma cell growth.
Cancer Res. 67:5328–5336. 2007. View Article : Google Scholar : PubMed/NCBI
|
|
19
|
Livak KJ and Schmittgen TD: Analysis of
relative gene expression data using real-time quantitative PCR and
the 2(−Delta Delta C(T)) method. Methods. 25:402–408. 2001.
|
|
20
|
Matsuno N, Hoshino K, Nanri T, et al: p15
mRNA expression detected by real-time quantitative reverse
transcriptase-polymerase chain reaction correlates with the
methylation density of the gene in adult acute leukemia. Leuk Res.
29:557–564. 2005. View Article : Google Scholar
|
|
21
|
Shapiro-Shelef M and Calame K: Regulation
of plasma-cell development. Nat Rev Immunol. 5:230–242. 2005.
View Article : Google Scholar
|
|
22
|
Lopez-Girona A, Heintel D, Zhang LH, et
al: Lenalidomide downregulates the cell survival factor, interferon
regulatory factor-4, providing a potential mechanistic link for
predicting response. Br J Haematol. 154:325–336. 2011. View Article : Google Scholar
|
|
23
|
Li S, Pal R, Monaghan SA, et al: IMiD
immunomodulatory compounds block C/EBP{beta} translation through
eIF4E down-regulation resulting in inhibition of MM. Blood.
117:5157–5165. 2009.PubMed/NCBI
|
|
24
|
Peceliunas V, Janiulioniene A,
Matuzeviciene R and Griskevicius L: Six color flow cytometry
detects plasma cells expressing aberrant immunophenotype in bone
marrow of healthy donors. Cytometry B Clin Cytom. 80:318–323. 2011.
View Article : Google Scholar : PubMed/NCBI
|
|
25
|
Bataille R, Jego G, Robillard N, et al:
The phenotype of normal, reactive and malignant plasma cells.
Identification of ‘many and multiple myelomas’ and of new targets
for myeloma therapy. Haematologica. 91:1234–1240. 2006.PubMed/NCBI
|
|
26
|
Pope B, Brown RD, Gibson J, Yuen E and
Joshua D: B7-2-positive myeloma: incidence, clinical
characteristics, prognostic significance, and implications for
tumor immunotherapy. Blood. 96:1274–1279. 2000.PubMed/NCBI
|
|
27
|
Lin P, Mahdavy M, Zhan F, Zhang HZ, Katz
RL and Shaughnessy JD: Expression of PAX5 in CD20-positive multiple
myeloma assessed by immunohistochemistry and oligonucleotide
microarray. Mod Pathol. 17:1217–1222. 2004. View Article : Google Scholar : PubMed/NCBI
|
|
28
|
Hideshima T, Mitsiades C, Ikeda H, et al:
A proto-oncogene BCL6 is up-regulated in the bone marrow
microenvironment in multiple myeloma cells. Blood. 115:3772–3775.
2010. View Article : Google Scholar : PubMed/NCBI
|
|
29
|
Fuhler GM, Baanstra M, Chesik D, et al:
Bone marrow stromal cell interaction reduces syndecan-1 expression
and induces kinomic changes in myeloma cells. Exp Cell Res.
316:1816–1828. 2010. View Article : Google Scholar : PubMed/NCBI
|
|
30
|
Matsui W, Wang Q, Barber JP, et al:
Clonogenic multiple myeloma progenitors, stem cell properties, and
drug resistance. Cancer Res. 68:190–197. 2008. View Article : Google Scholar : PubMed/NCBI
|
|
31
|
Brennan SK, Wang Q, Tressler R, et al:
Telomerase inhibition targets clonogenic multiple myeloma cells
through telomere length-dependent and independent mechanisms. PLoS
One. 5:e124872010. View Article : Google Scholar
|