Introduction
Tumor hypoxia is prognostic for poor response to
cancer therapy. The prognostic value of tumor hypoxia has been
demonstrated in radiotherapy studies of human head and neck
(1,2) and uterine cervix (3) tumors, which show that patients with
less hypoxic tumors had a better chance of overall or disease-free
survival than did patients with more hypoxic tumors. Furthermore,
some chemotherapeutic agents such as bleomycin and doxorubicin
exhibit a cytotoxicity that is strongly oxygen dependent,
suggesting that hypoxia may be a prognostic factor for
chemotherapeutic response as well (4–6).
Therefore, development of methods allowing measurement of hypoxia
in human patients may allow physicians to better manage tumors that
exhibit considerable hypoxia.
Ilangovan et al demonstrated in tumor-bearing
mice that carbogen breathing increased the oxygenation in the
tumor, and that this increased oxygenation was related to a
decreased rate of nitroxide reduction (7). Magnetic resonance imaging (MRI) can
accurately measure nitroxide reduction rates (8,9),
suggesting that nitroxide contrast agents could serve as an
MRI-based assessment of tumor oxygenation. Although the study by
Ilangovan showed that nitroxides were sensitive to oxygenation
changes during carbogen breathing, another use of nitroxides would
be to detect hypoxia in tumors (7). In this case, it is expected that
hypoxia will have the opposite effect of carbogen on the rate of
nitroxide reduction. Namely, it is expected that greater hypoxia
will be associated with a greater rate of nitroxide reduction.
The purpose of this study was to test if there is a
relationship between the reduction rate of Tempol as measured with
MRI and the hypoxic fraction of a tumor. The hypoxic fraction of
the tumor was measured using electron paramagnetic resonance (EPR)
imaging and the triarylmethyl (TAM) spin probe Oxo63 and the
reduction rate of Tempol was measured with a 7T small animal MRI
scanner.
Materials and methods
Chemicals
The triarylmethyl (TAM) radical Oxo63 was obtained
from GE healthcare. Tempol
(4-hydroxy-2,2,6,6,-tetramethyl-1-piperidynyloxyl) was purchased
from Sigma-Aldrich (St. Louis, MO, USA).
Animals
C3HHenCrMTV- mice were obtained from the Frederick
Cancer Research Center, Animal Production (Frederick, MD, USA).
Mice were housed in a climate controlled circadian rhythm adjusted
room and were allowed access to food and water ad libitum.
The body weight of the mice at the time of imaging was 22–30 g.
SCCVII (murine squamous cell carcinoma) cells (2–3×10⁵)
were injected 7–15 days before imaging. Experiments were carried
out in compliance with the Guide for the Care and Use of Laboratory
Animal Resources (National Research Council, 1996) and approved by
the National Cancer Institute Animal Care and Use Committee.
Animal experiment protocol
Starting 7 days after injection of SCCVII cells,
mice were imaged every 1–2 days. For anesthesia during imaging, a
mixture of isofluorane (4% to induce, 1–2% to maintain) and medical
air (750 ml/min) was blown into a nose-cone fitted to the animal’s
head. For EPR measurements, the mouse was placed on a platform with
its legs hanging downward into a vertical coil. For MRI
measurements, the mouse was placed on a cradle, which was then
placed inside the horizontal bore of the magnet. For both EPR and
MRI experiments, a pressure transducer (SA Instruments Inc.) was
used to monitor the breathing rate, and a rectal thermocouple was
used to monitor the core body temperature. Warm air was blown over
the mouse to maintain its temperature. The breathing rate was kept
at 60±10 breaths per min and the body temperature was maintained at
37±1°C. To enable injection of contrast agents during imaging, a
catheter was made by inserting a 30.5-gauge needle tip into
polyethylene (PE-10) tubing. Using this catheter, the tail vein of
the mouse was cannulated. Oxo63 (10 μl/g body weight of 75
mM solution) or Tempol (5 μl/g body weight of 150 mM
solution) was manually injected through the catheter.
Magnetic resonance imaging
Magnetic Resonance Imaging was performed using a 4.7
Tesla small animal scanner (Bruker Bio-Spin MRI GmbH). After a
survey scan, T2-weighted images were obtained using multi-slice
multi-echo (MSME) sequence with a 10-echo train and an echo time of
15 min. SPGR (also referred as gradient echo fast imaging, GEFI)
(TR=75 ms, TE=3 ms, FA=45°, NEX=2) was employed to observe T1
effect. The scan time for 6 slices with the SPGR sequence was 20
sec. Other common image parameters are as follows; image resolution
was 256 x 256, FOV was 3.2 x 3.2 cm, slice thickness was 2.0 mm.
Number of slices was 6.
EPR oximetry
A pulsed (time domain) EPR imaging scanner was used
to measure tissue pO2. Details of this method are
described elsewhere (10).
Briefly, Oxo63 is injected into the mouse via tail vein catheter.
Imaging was initiated once the EPR signal intensity reached a
steady state value, indicating that the Oxo63 radical had reached a
steady state concentration in the tissue. pO2 mapping
relies on the linear relationship between the pO2 of the
tissue and linewidth of the TAM radical (Oxo63.) To quantify the
linewidth in a voxel, several images with increasing readout delay
are obtained. As the readout delay increases, the signal decreases
in a manner that depends on the linewidth of the voxel. From the
images with successively increasing readout delay, the linewidth of
oxo63 is mapped over the tissue region. Finally, using the
linewidth map, the pO2 is calculated from a calibration
curve calculated in vitro. EPR imaging was performed in a
300 MHz single point-imaging scanner. The imaging parameters were
as follows: excitation pulse, 80 ns, 80 W; TR, 5.5 μs; flip
angle, 70°C; field gradient, 0.8 Gauss/cm, 1.0 Gauss/cm, 1.2
Gauss/cm; no. of gradient steps, 21 x 21, number of averages,
100,000.
Statistical analyses
The statistical differences were estimated with
TTEST function in the Microsoft Excel XP. The suitable ‘type’ for
the test was selected according to the correspondence and variance
of the data. Significances were estimated when p-value was less
than 0.05.
Results
The growth of the SCCVII tumor as a
function of time after implantation (Fig. 1A)
Between days 7 and 15, the volume of the tumor
increased linearly with time from 500 to 3,500 mm3.
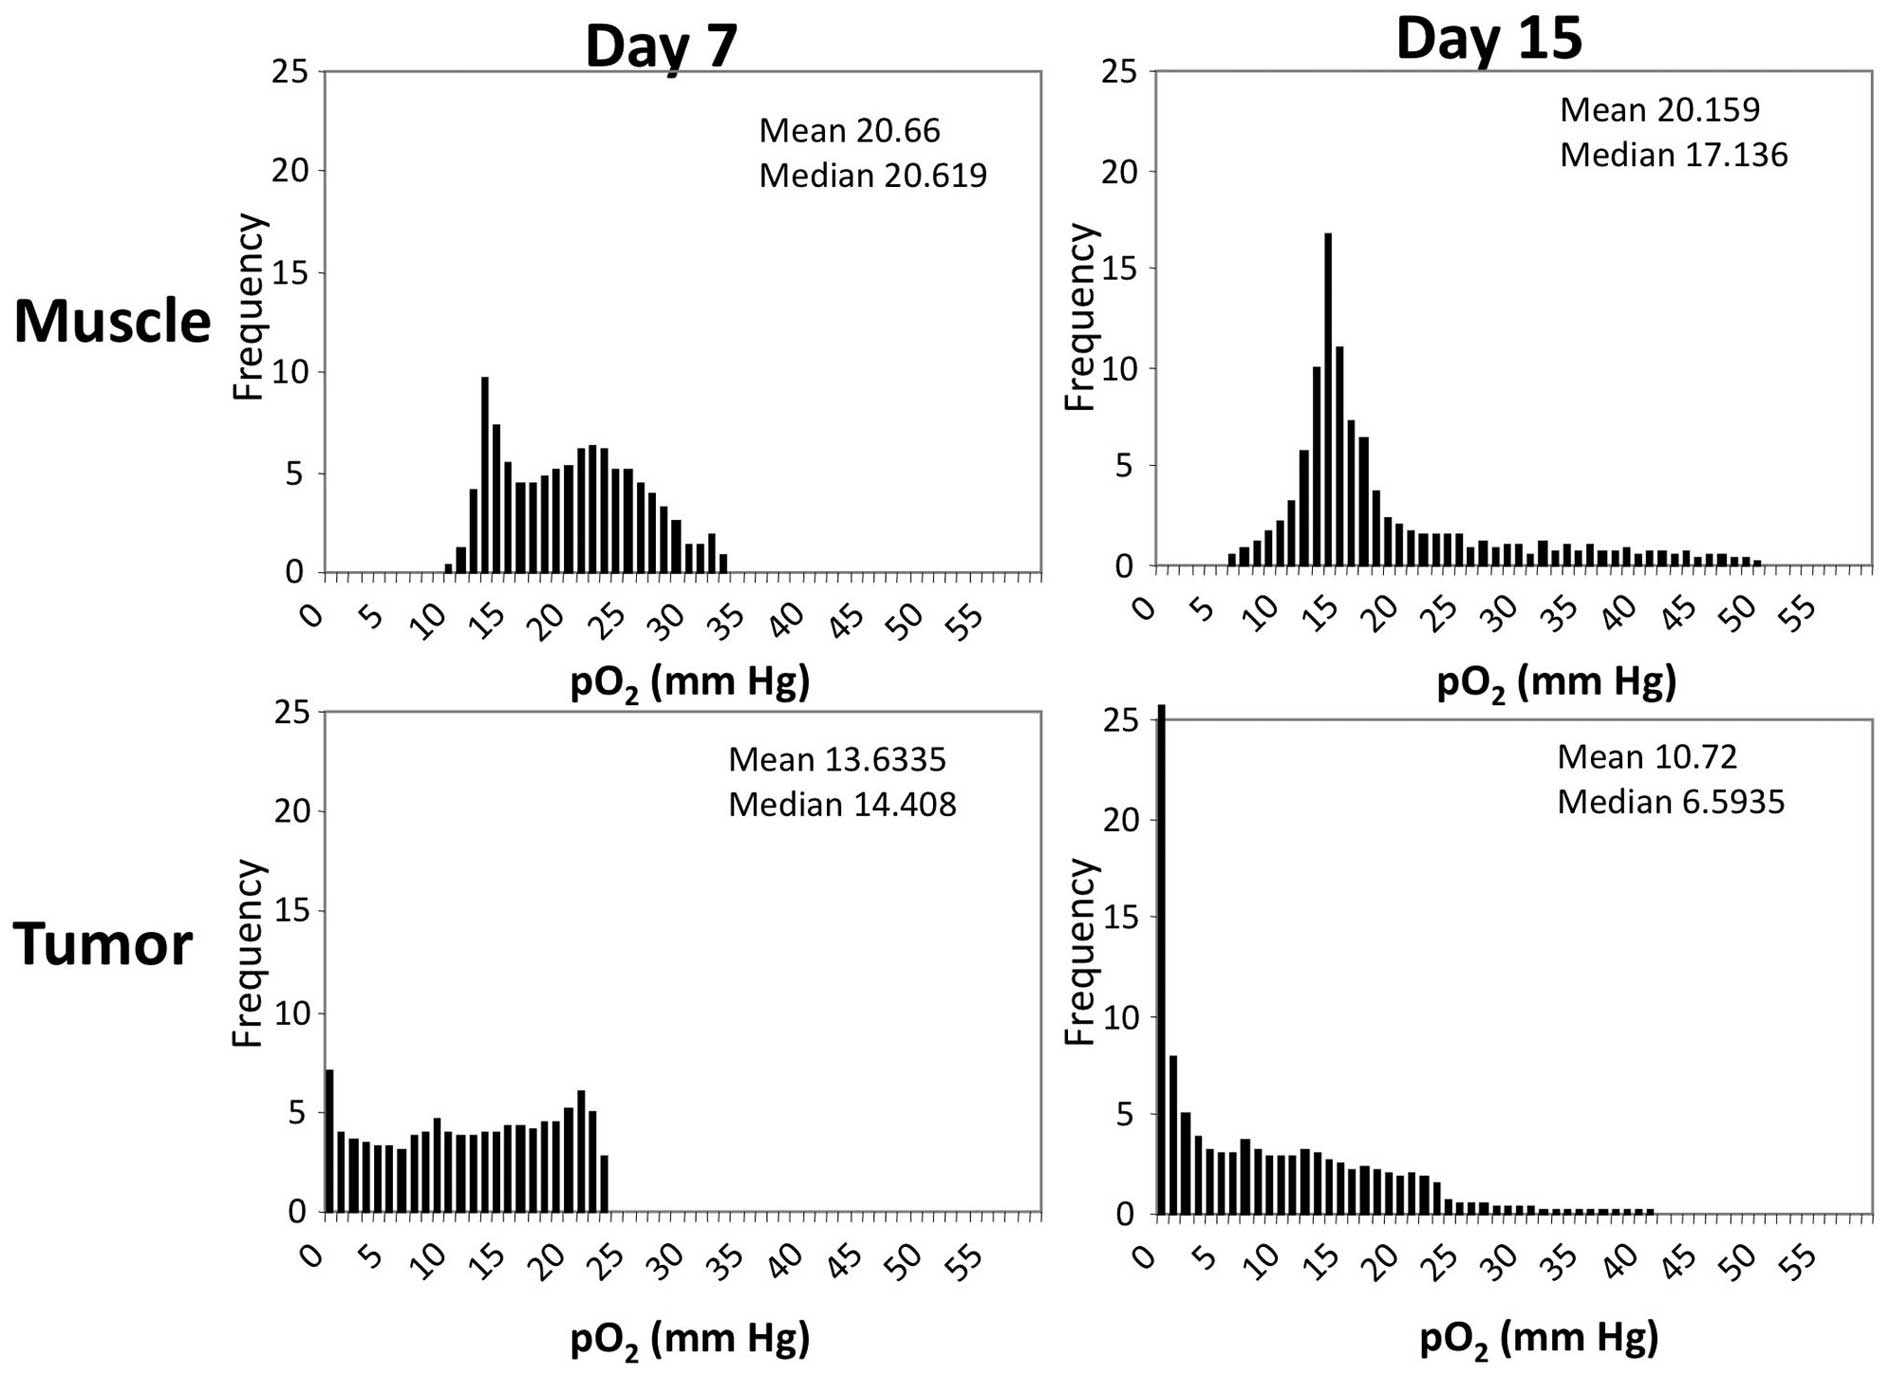
Fig. 1B shows representative
EPR-based pO2 maps (bottom panels) obtained at 8 and 12
days after tumor implantation. Comparison of the MRI T2-weighted
images (top panels) at day 8 and day 12 clearly shows increase in
tumor size with time. The pO2 maps overlaid with the MRI
scans show significant hypoxia regions (black and blue areas on the
images) within the tumor by day 12. The pO2 maps as
shown in Fig. 1B were converted
into histograms and representative histograms for a representative
mouse on days 7 and 15 are displayed in Fig. 2. These histograms show that over
the course of the study, a slight 3 mmHg decrease in median
pO2 was observed in the muscle, while a marked 8 mmHg
decrease in median pO2 was observed in the tumor. To
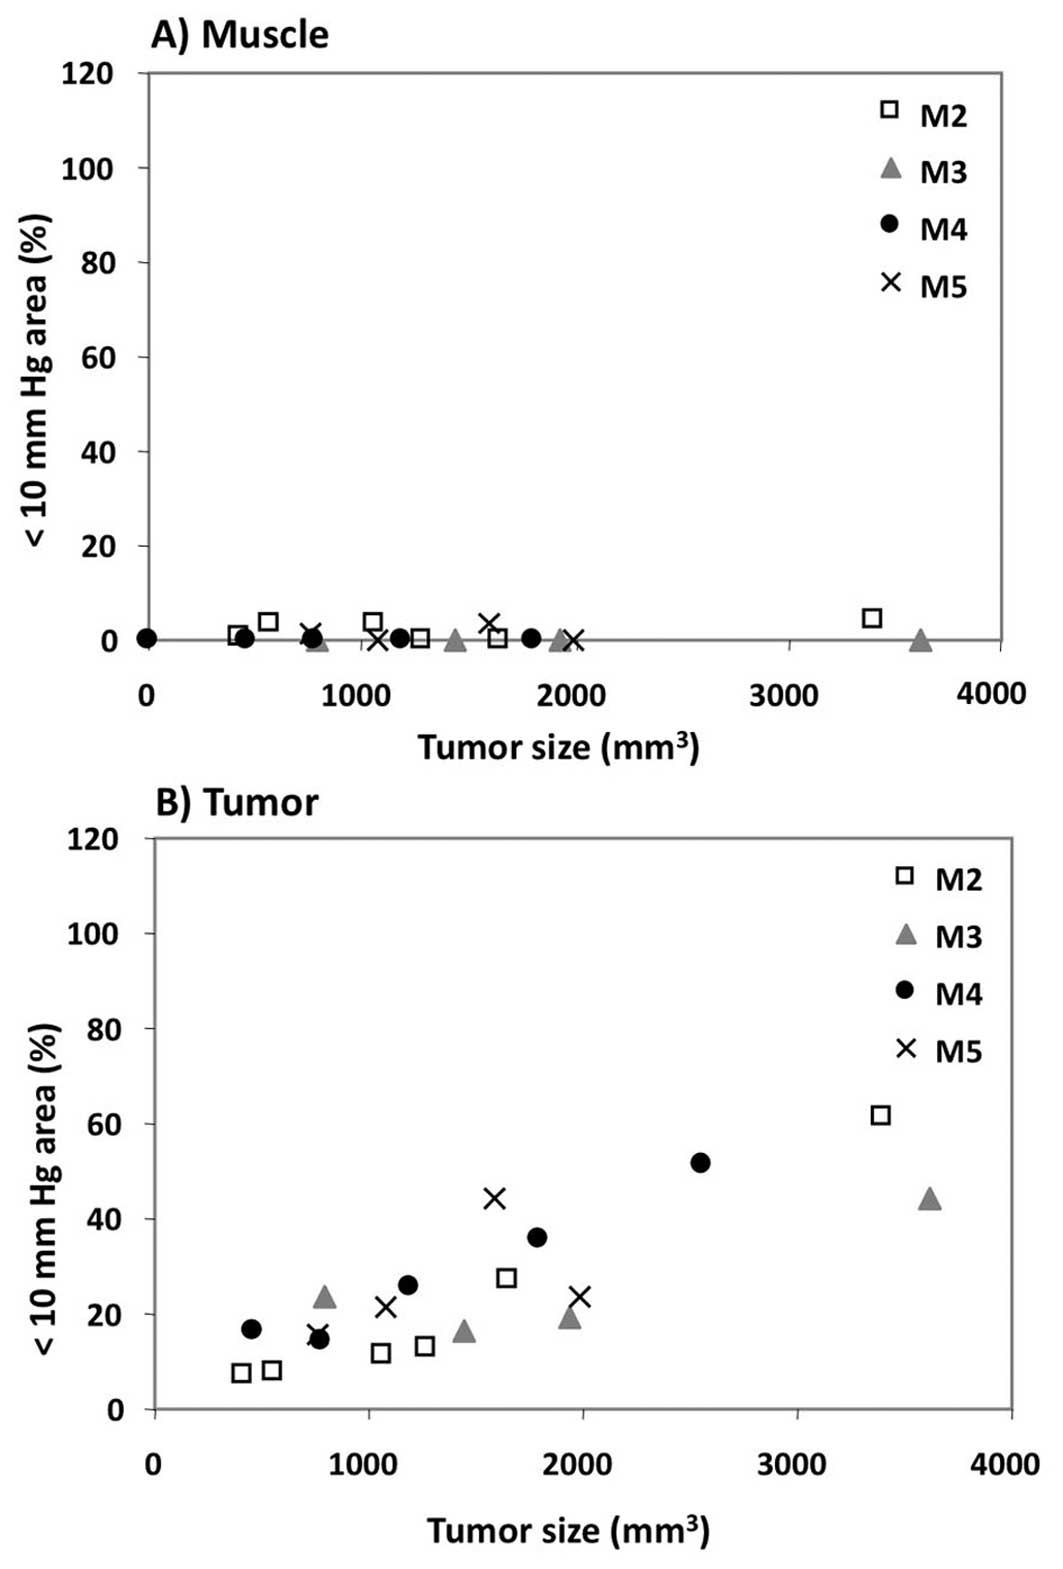
test if the hypoxic fraction of the tumor changed as the tumor
grew, the percentage of tumor volume with pO2 less than
10 mmHg (i.e., the hypoxic fraction) was plotted as a function of
tumor size (Fig. 3). Between days
7 and 15 of the study, the hypoxic fraction of the muscle remained
well below 5%. In contrast, the hypoxic fraction of the tumor
increased linearly as the tumor progressed, reaching approximately
50% by the end of the study. Taken together with the data from
Figs. 1 and 2, these results strongly suggest that
growth of the SCCVII tumor correlates with the development of
hypoxic regions within the tumor.
The redox status of the tissue was
monitored using Tempol as a redox-sensitive magnetic resonance
imaging contrast agent
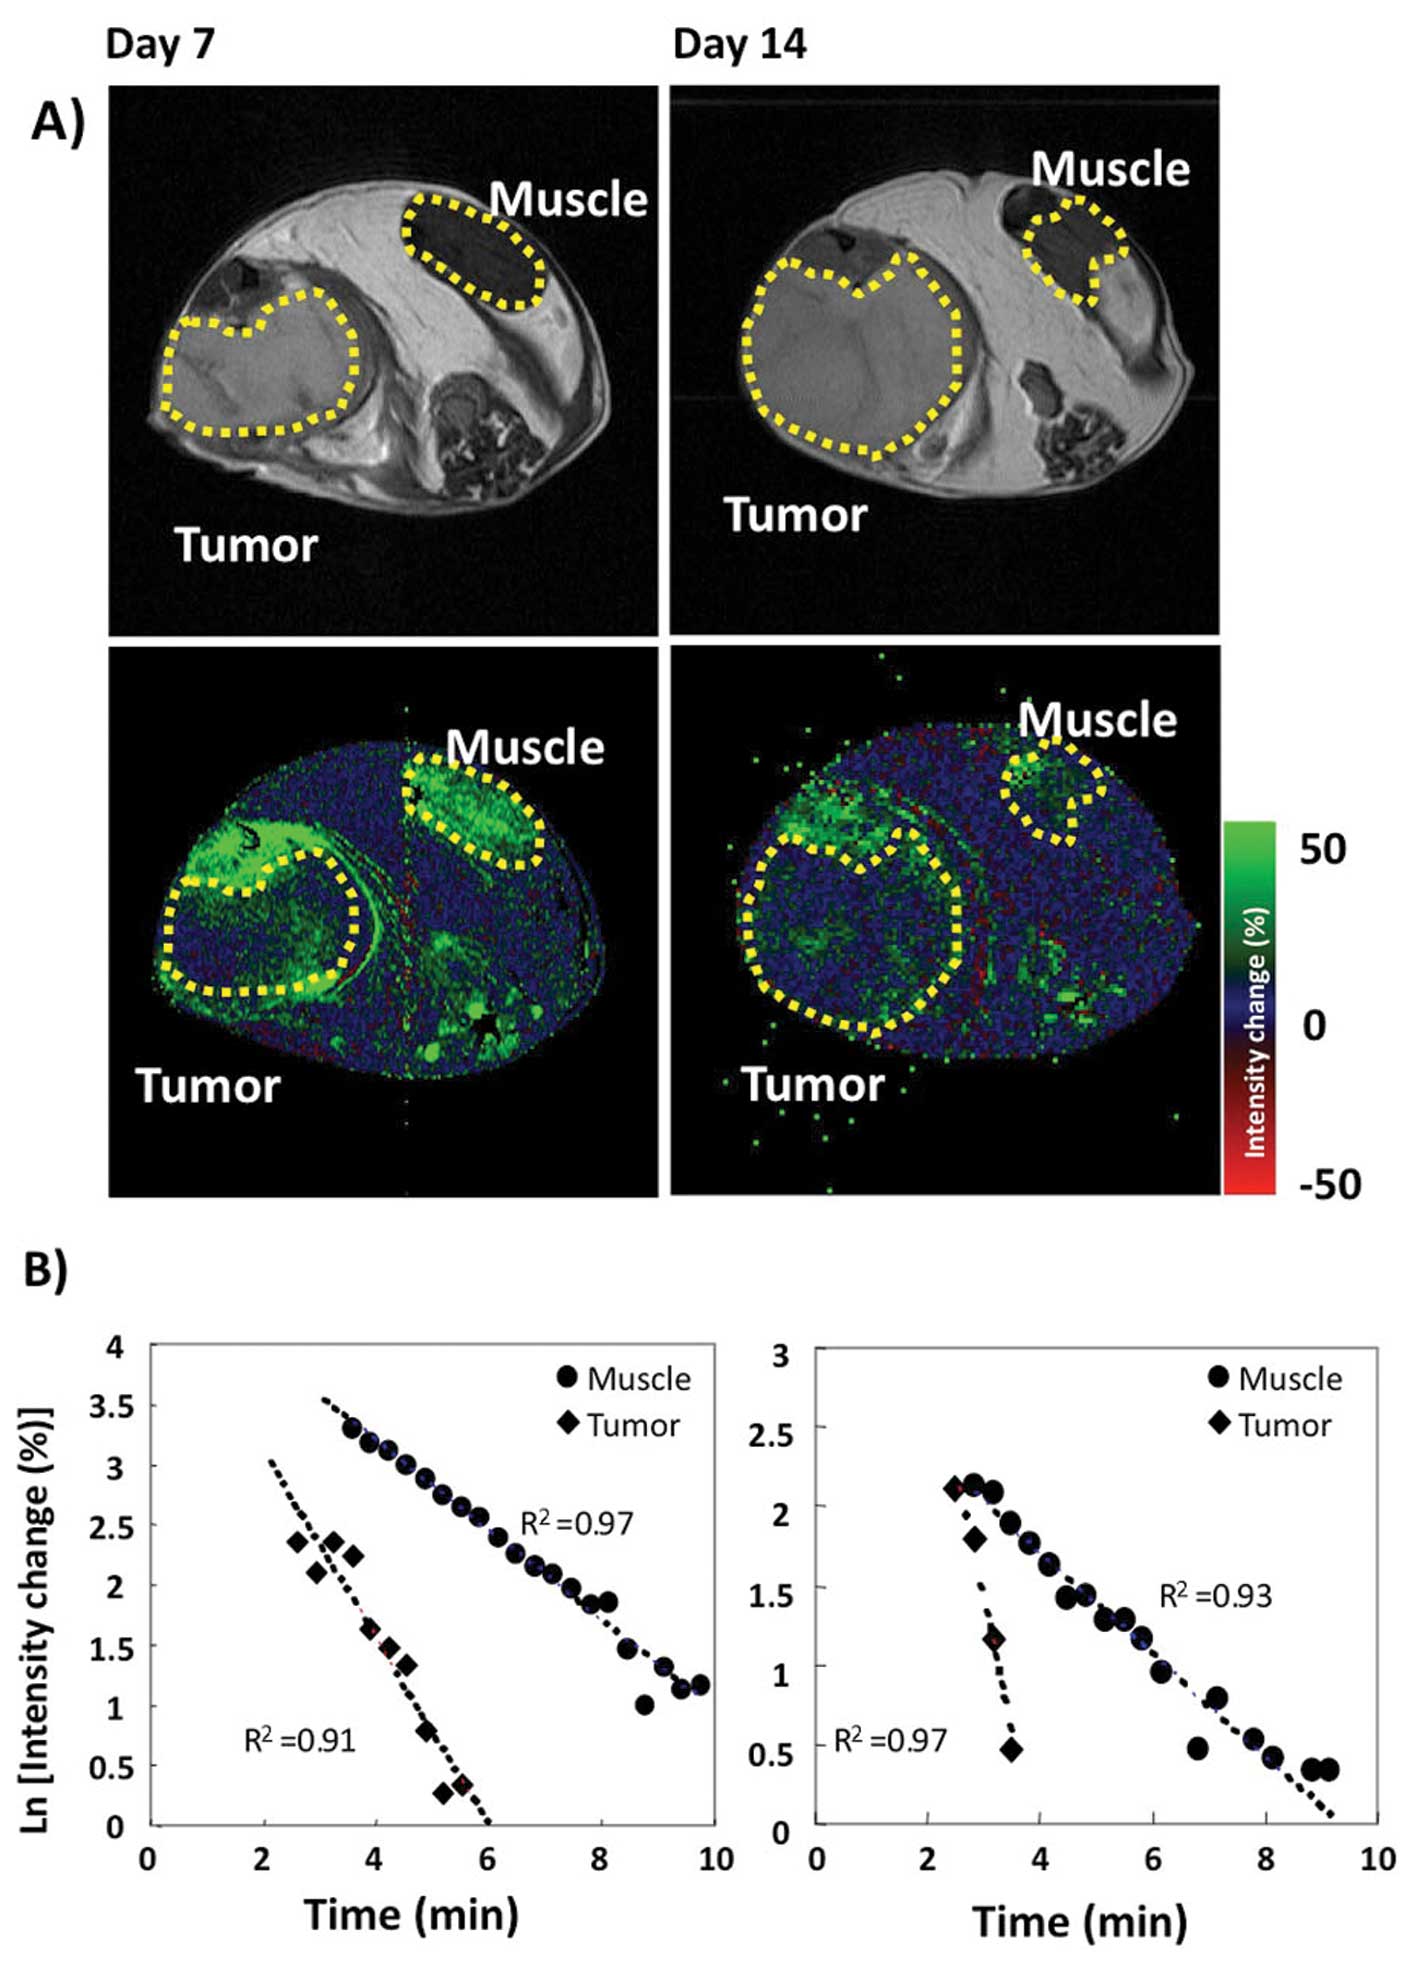
Fig. 4 shows a
representative redox data set for a mouse taken at days 7 and 14
after tumor implantation. Fig. 4A
shows T2-weighted images of the tumor region, with regions of
interest (ROI) outlined with yellow lines for muscle and tumor.
ROIs were used to calculate the rate of Tempol reduction. Fig. 4B shows the observed signal
enhancement 40 sec after Tempol injection. On both days 7 and 14,
the rate of Tempol reduction was greater in tumor tissue than in
muscle. As the tumor grew in size, the rate at which muscle reduced
Tempol did not appreciably change, while the rate at which the
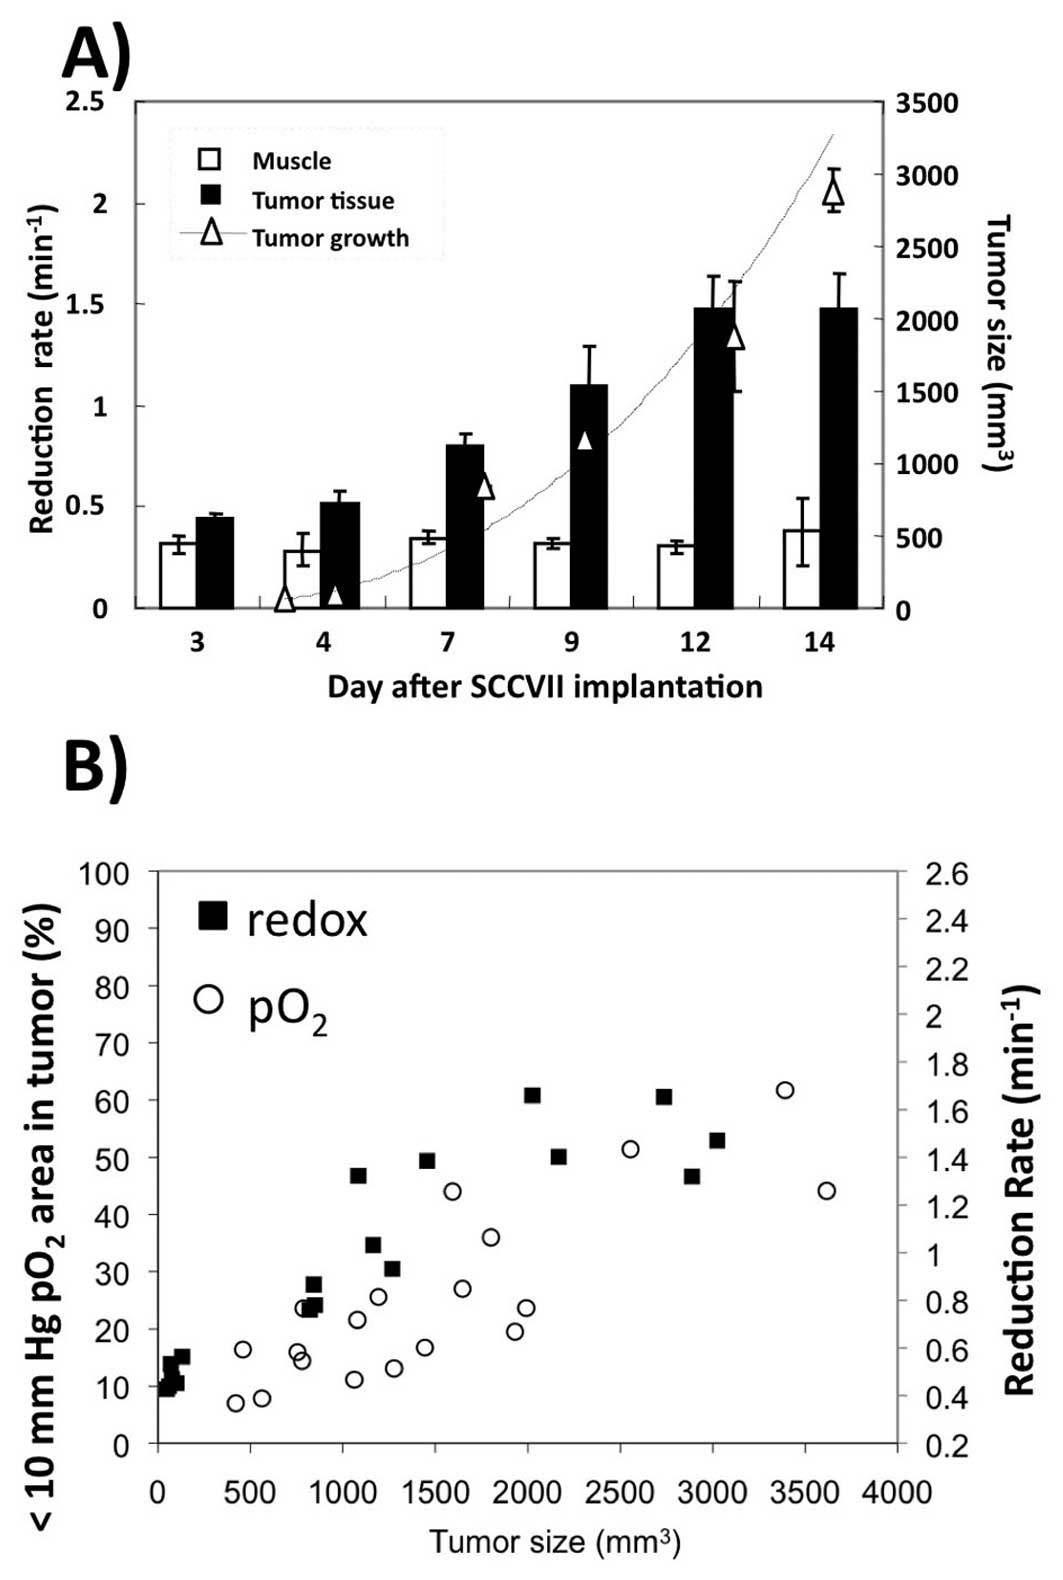
tumor reduced Tempol more than doubled. Fig. 5A summarizes the changes in tumor
volume and Tempol reduction rates for 4 mice. As the tumor volume
increased, the rate at which the tumor reduced Tempol also
increased. As for muscle, Tempol reduction essentially the same
over the 14 days. Finally, the rate of Tempol reduction and the
hypoxic fraction of a SCCVII tumor were plotted as a function of
tumor size as shown on Fig. 5B.
This graph shows that larger tumors have hypoxic fractions ranging
from 40%–60% and reduction rates varying from 1.2–1.6
min−1, while smaller tumors have hypoxic fractions of
only 5–20% and reduction rates of only 0.4–0.6 min−1.
This comparison suggests that the rate of Tempol reduction and the
hypoxic fraction of a tumor were positively correlated.
Discussion
The purpose of this study was to determine if the
hypoxic fraction of a SCCVII tumor correlated with the rate of
Tempol reduction in the tumor. It was found that both the rate of
Tempol reduction as well as the hypoxic fraction (the fraction of
voxels with less than 10 mmHg) increased as the tumor grew
(Fig. 5B). This implies a
correlation between the rate of Tempol reduction and the hypoxic
fraction. Because high tumor hypoxia predicts a decreased
likelihood of survival during clinical cancer therapy (1–3), the
data from the current study suggest that rapid Tempol reduction may
be indicative of a poor prognosis for cancer therapy.
In this study, it was noted that the tumor hypoxic
fraction generally increased as the tumor size increased, in
agreement with other published studies (11,12).
Early studies showing a relationship between tumor size and hypoxic
fraction used a radiobiological assay of hypoxia (11). One of the most common
radiobiological assays of hypoxia involves performing an in
vivo/in vitro colony-forming assay on two experimental
groups: mice breathing ambient air, and mice asphyxiated with
nitrogen gas. The hypoxic fraction is calculated from the
difference in cell survival between the air breathing group and the
asphyxiated hypoxic group. Using assays such as these, it was
generally found that in a variety of tumors weighing less than a
gram, larger tumors exhibited more hypoxia than smaller tumors
(11,13–15).
In the case of KHT sarcomas, it was noted that tumors larger than
0.7 g did not show a further increase in hypoxic fraction,
indicating that some tumors may reach a plateau in their hypoxic
fraction (14). In contrast with
these studies, studies with both a rhabdosarcoma (16) and in a 9L line (17) were not able to show a dependence of
hypoxic fraction on tumor size. Later studies used an invasive
polargraphic needle electrode to assess the dependence of hypoxic
fraction on tumor size. These studies found that in OCa-I, MCa-r,
KHT, C3H mammary carcinoma and SCCVII tumors with weights ranging
from 0.15 to 1.5 g, the hypoxic fraction increased as the tumor
grew (18–20). In the case of SCCVII (also used in
this study), polarographic oxygen measurements showed that the
hypoxic fraction (defined in that study as % volume with
pO2 <5 mmHg) ranged from approximately 50 to 100% as
the tumor grew from 150 mm3 to 1,500
mm3(20). These
measurements report hypoxia fractions greater than observed in the
present study, where the hypoxic fraction (defined in this study as
% volume with pO2 <10 mmHg) was found to increase
from 10 to 50% as the tumor grew from 500 mm3 to 3,500
mm3. In summary, most of the literature is consistent
with the current finding that implanted animal tumors weighing less
than a few grams exhibit an increased hypoxic fraction as the
tumors grow.
Although most murine tumors exhibit a dependence of
hypoxic fraction on tumor size, there are data suggesting that in
the case of human tumors, the situation is more complex. Using
F-MISO PET, hypoxia was measured in tumors of 12 patients with
non-small cell lung cancer, where the tumor size ranged from 50
cm3 to 350 cm3(21). In this study, no dependence of
hypoxic fraction on tumor size was observed. In other studies in
human uterine cervix cancers (22)
and squamous cell carcinoma metastasis (23), hypoxia was measured using a
polarographic needle. Again, no dependence of hypoxic fraction on
tumor size was observed in either of these studies. Although these
data are limited, they suggest that tumor size is not a valid
single surrogate marker for hypoxia in the clinical setting. It is
not completely clear why animal tumors exhibit a size-dependent
hypoxia relationship and human tumors do not, but the difference
may be related to the relative volume of murine versus human
tumors. In general, the human tumors were at least 5 g (assuming
water density) (11,13,14),
indicating that by the time human tumors are observed in the
clinic, they may have surpassed a threshold for size-hypoxia
dependence. Indeed, the hypoxic fraction cannot increase
indefinitely, and murine KHT sarcomas exhibited a plateau in
hypoxia above a weight of 0.7 g (14). Because tumor size, which is
commonly measured during routine clinical scans, is apparently a
poor marker for tumor hypoxia, novel biological imaging techniques
must be developed in order to assess tumor hypoxia in humans.
During this study, it was observed that tumor
hypoxia and the rate of Tempol reduction both increased as the
tumor grew. The question remains if the increasing hypoxia observed
during tumor growth actually caused Tempol to be reduced more
quickly. In theory, it is possible that low oxygen levels in a
tumor will result in a more reductive tumor microenvironment, and
an important example involves the NADPH/NADP+ redox pair
(24). NADPH is an endogenous
antioxidant, and its oxidation is catalyzed by an enzyme called
NADPH oxidase (NOX) in a reaction that requires molecular oxygen.
Furthermore, NADPH oxidase is overexpressed in some cancers
(25), including SCC (26) (used in this study), implying that
NOX activity may have affected NADPH levels in the tumor models
used during this study. NADPH, in turn, is coupled to the reduction
of GSSG to glutathione, which is the most abundant endogenous
anti-oxidant. Thus, oxygen levels directly and indirectly may
affect the intracellular levels of NADPH and GSH, both of which in
turn affect the rate of Tempol reduction (7,27–30).
Hypoxia may therefore cause the cellular milieu to become more
reduced, which would result in a high rate constant for Tempol
reduction.
Although increasing hypoxia may cause the
intracellular environment to become more reduced through the
mechanisms described above, those effects alone cannot account for
the large increase in tumor redox observed in the current study. To
put in perspective the findings of this study, it is useful to cite
in vitro studies showing that compared to tumor cells
exposed to 160 mmHg oxygen, cells exposed to 0 mmHg oxygen exhibit
a 20–160% greater reduction rate constant (31,32).
Furthermore, in a RIF-1 tumor, it was found that the tumor
pO2 varied between 2.5–15 mmHg, but that the correlation
between the nitroxide reduction rate constant and pO2
was weak (r=0.357) (33). It
therefore seems unlikely that a small change in median
pO2 of 5 mmHg would result in a 100% increase in the
reduction rate constant due only to the mechanisms described in the
previous paragraph. These considerations suggest that the rapid
Tempol reduction observed during this study may be due to factors
more complex than simple accumulation of oxygen-dependent
antioxidants due to low levels of molecular oxygen.
An alternative explanation of the apparent
correlation between the hypoxic fraction and the rate of Tempol
reduction observed in the current study could be a hypoxia-induced
shift to glycolytic metabolism. Under conditions of hypoxia,
signaling molecules such as hypoxia inducible factors (HIFs) become
relatively abundant in the cellular milieu. The most commonly
studied hypoxia inducible factor, HIF-1, is known to activate
glycolytic enzymes and genes, thereby increasing glycolytic
metabolism (34–36). Recently, glycolytic metabolism has
been shown to provide resistance to H2O2
toxicity, decrease production of reactive oxygen species, and
decrease the extent of oxidized DNA fragments. In other words,
glycolytic metabolism has been shown to evoke an antioxidant
response (34–36). Although the mechanism for this
antioxidant response is not yet fully understood, it may also
contribute to the more reductive tumor environment that was
observed in this study.
In this study, it is observed that both hypoxia and
the rate of nitroxide reduction increased as the tumor grew,
suggesting that hypoxia and the rate of nitroxide reduction are
correlated. Due to the prognostic value of hypoxia, this suggests
that rapid nitroxide reduction may indicate poor response to cancer
therapy. In conclusion, nitroxides such as Tempol may provide a
clinically feasible magnetic resonance imaging based assay of
hypoxia.
Acknowledgements
This study was supported by the
Intramural Research Program of the Center for Cancer Research,
National Cancer Institute, NIH.
References
|
1.
|
M NordsmarkSM BentzenV RudatD BrizelE
LartigauP StadlerA BeckerM AdamM MollsJ DunstDJ TerrisJ
OvergaardPrognostic value of tumor oxygenation in 397 head and neck
tumors after primary radiation therapy. An international
multi-center studyRadiother
Oncol771824200510.1016/j.radonc.2005.06.03816098619
|
|
2.
|
DM BrizelRK DodgeRW CloughMW
DewhirstOxygenation of head and neck cancer: changes during
radiotherapy and impact on treatment outcomeRadiother
Oncol53113117199910.1016/S0167-8140(99)00102-410665787
|
|
3.
|
M HockelC KnoopK SchlengerB VorndranE
BaussmannM MitzePG KnapsteinP VaupelIntratumoral pO2
predicts survival in advanced cancer of the uterine cervixRadiother
Oncol2645501993
|
|
4.
|
L Roizin-TowleEJ HallStudies with
bleomycin and misonidazole on aerated and hypoxic cellsBr J
Cancer37254260197810.1038/bjc.1978.3475740
|
|
5.
|
BA TeicherJS LazoAC
SartorelliClassification of anti-neoplastic agents by their
selective toxicities toward oxygenated and hypoxic tumor
cellsCancer Res41738119817448778
|
|
6.
|
BA TeicherSA HoldenA al-AchiTS
HermanClassification of antineoplastic treatments by their
differential toxicity toward putative oxygenated and hypoxic tumor
subpopulations in vivo in the FSaIIC murine fibrosarcomaCancer
Res50333933441990
|
|
7.
|
G IlangovanH LiJL ZweierMC KrishnaJB
MitchellP KuppusamyIn vivo measurement of regional oxygenation and
imaging of redox status in RIF-1 murine tumor: effect of
carbogen-breathingMagn Reson
Med48723730200210.1002/mrm.1025412353291
|
|
8.
|
F HyodoBP SouleK MatsumotoS MatusmotoJA
CookE HyodoAL SowersMC KrishnaJB MitchellAssessment of tissue redox
status using metabolic responsive contrast agents and magnetic
resonance imagingJ Pharm
Pharmacol6010491060200810.1211/jpp.60.8.001118644197
|
|
9.
|
F HyodoK MatsumotoA MatsumotoJB MitchellMC
KrishnaProbing the intracellular redox status of tumors with
magnetic resonance imaging and redox-sensitive contrast
agentsCancer
Res6699219928200610.1158/0008-5472.CAN-06-087917047054
|
|
10.
|
K MatsumotoS SubramanianN DevasahayamT
AravalluvanR MurugesanJA CookJB MitchellMC KrishnaElectron
paramagnetic resonance imaging of tumor hypoxia: enhanced spatial
and temporal resolution for in vivo pO2
determinationMagn Reson
Med5511571163200610.1002/mrm.2087216596636
|
|
11.
|
WU ShipleyJA StanleyGG SteelTumor size
dependency in the radiation response of the Lewis lung
carcinomaCancer Res352488249319751149047
|
|
12.
|
JA StanleyWU ShipleyGG SteelInfluence of
tumour size on hypoxic fraction and therapeutic sensitivity of
Lewis lung tumourBr J
Cancer36105113197710.1038/bjc.1977.160889677
|
|
13.
|
R JirtleKH CliftonThe effect of tumor size
and host anemia on tumor cell survival after irradiationInt J
Radiat Oncol Biol
Phys4395400197810.1016/0360-3016(78)90068-8689941
|
|
14.
|
RP HillAn appraisal of in vivo assays of
excised tumoursBr J Cancer (Suppl)423023919806932930
|
|
15.
|
DW SiemannTumour size: a factor
influencing the isoeffect analysis of tumour response to combined
modalitiesBr J Cancer (Suppl)429429819806932939
|
|
16.
|
HS ReinholdC De BreeTumour cure rate and
cell survival of a transplantable rat rhabdomyosarcoma following
x-irradiationEur J
Cancer4367374196810.1016/0014-2964(68)90026-15760725
|
|
17.
|
CA WallenSM MichaelsonKT WheelerEvidence
for an unconventional radiosensitivity of rat 9L subcutaneous
tumorsRadiat Res84529541198010.2307/35754917454994
|
|
18.
|
K De JaegerFM MerloMC KavanaghAW FylesD
HedleyRP HillHeterogeneity of tumor oxygenation: relationship to
tumor necrosis, tumor size, and metastasisInt J Radiat Oncol Biol
Phys4271772119989845083
|
|
19.
|
AA KhalilMR HorsmanJ OvergaardThe
importance of determining necrotic fraction when studying the
effect of tumour volume on tissue oxygenationActa
Oncol3429730019957779412
|
|
20.
|
CG MilrossSL TuckerKA MasonNR HunterLJ
PetersL MilasThe effect of tumor size on necrosis and
polarographically measured pO2Acta
Oncol36183189199710.3109/028418697091092289140436
|
|
21.
|
JS RaseyWJ KohML EvansLM PetersonTK
LewellenMM GrahamKA KrohnQuantifying regional hypoxia in human
tumors with positron emission tomography of
[18F]fluoromisonidazole: a pretherapy study of 37 patientsInt J
Radiat Oncol Biol Phys3641742819968892467
|
|
22.
|
HD WeitmannB GustorffP VaupelTH KnockeR
PotterOxygenation status of cervical carcinomas before and during
spinal anesthesia for application of brachytherapyStrahlenther
Onkol179633640200310.1007/s00066-003-1060-x14628130
|
|
23.
|
RA GatenbyHB KesslerJS RosenblumLR CoiaPJ
MoldofskyWH HartzGJ BroderOxygen distribution in squamous cell
carcinoma metastases and its relationship to outcome of radiation
therapyInt J Radiat Oncol Biol
Phys14831838198810.1016/0360-3016(88)90002-83360652
|
|
24.
|
FQ SchaferGR BuettnerRedox environment of
the cell as viewed through the redox state of the glutathione
disulfide/glutathione coupleFree Radic Biol
Med3011911212200110.1016/S0891-5849(01)00480-411368918
|
|
25.
|
IK IlonenJV RasanenEI SihvoA KnuuttilaKM
SalmenkiviMO AhotupaVL KinnulaJA SaloOxidative stress in non-small
cell lung cancer: role of nicotinamide adenine dinucleotide
phosphate oxidase and glutathioneActa
Oncol4810541061200910.1080/0284186090282490919308756
|
|
26.
|
M Czesnikiewicz-GuzikB LorkowskaJ ZapalaM
CzajkaM SzutaB LosterTJ GuzikR KorbutNADPH oxidase and uncoupled
nitric oxide synthase are major sources of reactive oxygen species
in oral squamous cell carcinoma. Potential implications for immune
regulation in high oxidative stress conditionsJ Physiol
Pharmacol591391522008
|
|
27.
|
A IannoneA TomasiV VanniniHM
SwartzMetabolism of nitroxide spin labels in subcellular fractions
of rat liver. II. Reduction by microsomesBiochimica Biophysica
Acta1034285289199010.1016/0304-4165(90)90052-X
|
|
28.
|
E FinkelsteinGM RosenEJ
RauckmanSuperoxide-dependent reduction of nitroxides by
thiolsBiochim Biophys
Acta8029098198410.1016/0304-4165(84)90038-2
|
|
29.
|
KI YamadaP KuppusamyS EnglishJ YooA IrieS
SubramanianJB MitchellMC KrishnaFeasibility and assessment of
non-invasive in vivo redox status using electron paramagnetic
resonance imagingActa
Radiol43433440200210.1034/j.1600-0455.2002.430418.x12225490
|
|
30.
|
P KuppusamyH LiG IlangovanAJ CardounelJL
ZweierK YamadaMC KrishnaJB MitchellNoninvasive imaging of tumor
redox status and its modification by tissue glutathione
levelsCancer Res62307312200211782393
|
|
31.
|
RM DavisS MatsumotoM BernardoA SowersK
MatsumotoMC KrishnaJB MitchellMagnetic resonance imaging of organic
contrast agents in mice: capturing the whole-body redox
landscapeFree Radic Biol
Med50459468201110.1016/j.freeradbiomed.2010.11.02821130158
|
|
32.
|
Y SamuniJ GamsonA SamuniK YamadaA RussoMC
KrishnaJB MitchellFactors influencing nitroxide reduction and
cytotoxicity in vitroAntioxid Redox
Signal6587595200410.1089/15230860477393434115130285
|
|
33.
|
K TakeshitaK KawaguchiK Fujii-AikawaM
UenoS OkazakiM OnoMC KrishnaP KuppusamyT OzawaN IkotaHeterogeneity
of regional redox status and relation of the redox status to
oxygenation in a tumor model, evaluated using electron paramagnetic
resonance imagingCancer
Res7041334140201010.1158/0008-5472.CAN-09-4369
|
|
34.
|
H KondohME LleonartD BernardJ
GilProtection from oxidative stress by enhanced glycolysis; a
possible mechanism of cellular immortalizationHistol
Histopathol228590200717128414
|
|
35.
|
H KondohME LleonartJ GilJ WangP DeganG
PetersD MartinezA CarneroD BeachGlycolytic enzymes can modulate
cellular life spanCancer Res65177185200515665293
|
|
36.
|
F LuoX LiuN YanS LiG CaoQ ChengQ XiaH
WangHypoxia-inducible transcription factor-1alpha promotes
hypoxia-induced A549 apoptosis via a mechanism that involves the
glycolysis pathwayBMC
Cancer626200610.1186/1471-2407-6-2616438736
|