Introduction
Esophageal cancer is now the eighth most common
cancer and the sixth-leading cause of cancer-related mortality
worldwide. The disease often remains undiagnosed until the late
stages, and advanced esophageal cancer is associated with a poor
outcome and is one of the most refractory of cancers. Apart from
potentially curative surgery, chemotherapy and radiochemotherapy
may be applied at advanced stages, but neither can cure the disease
in such cases, and even after these treatments the prognosis
remains poor (1). Thus, there is a
strong demand for new curative approaches to advanced esophageal
cancer.
Metformin is an oral biguanide drug introduced into
clinical practice in the 1950s for the treatment of type 2 diabetes
(2). It lowers hyperglycemia by
inhibiting hepatic glucose production. Recently, another function
of metformin was found. According to a large number of recent
observational studies, diabetic patients treated with metformin
show a reduced incidence of neoplastic disease. In addition, in
numerous basic investigations, including our own, metformin
inhibited the proliferation of various human cancer cell types,
such as prostate (3), breast
(4), colon (5,6),
glial (3,5,7,8) and
gastric cancer (9). However, there
have been no reports on the effects of metformin on esophageal
cancers. In addition, the mechanism underlying the suppression of
cancer growth by metformin remains relatively unknown. Here we
studied whether metformin would be effective against ESCC, and also
investigated the expression of cell cycle-related molecules and
receptor tyrosine kinase, and the angiogenic profiles, in order to
explore the mechanisms underlying the general antitumor effects of
metformin. We also attempted to identify microRNAs (miRNAs)
associated with the antitumor effects of metformin.
Materials and methods
Chemicals
Metformin (1,1-dimethylbiguanide) was purchased from
Astellas Pharma (Tokyo, Japan). The Cell Counting Kit (CCK-8) was
purchased from Dojindo Laboratories (Kumamoto, Japan) and all other
chemicals were obtained from Sigma Chemical (Tokyo, Japan).
Antibodies
In this study, the antibodies used were as follows:
anti-β-actin monoclonal antibody (A5441, used at 1:3,000;
Sigma-Aldrich), cyclin D1 (RB-9041, used at 1:1,000; Thermo Fisher
Scientific, Waltham, MA), cyclin E (used at 1:1,000; BD
Biosciences, Franklin Lakes, NJ), Cdk6 (sc-177, used at 1:1,000;
Santa Cruz Biotechnology, Santa Cruz, CA), Cdk4 (no. 2906, used at
1:1,000; Cell Signaling Technology, Danvers, MA), Cdk2 (sc-163,
used at 1:2,000; Santa Cruz Biotechnology), and phosphorylated Rb
(pRb) (no. 9309, used at 1:1,000; Cell Signaling Technology).
Secondary horseradish peroxidase-linked anti-mouse and anti-rabbit
IgG antibodies (used at 1:2,000; GE Healthcare, Buckinghamshire,
UK) were also used.
Cell lines and culture
The human ESCC cell lines KYSE30, KYSE70 and T.T
were obtained from the Japanese Cancer Research Resources Bank
(Tokyo, Japan). KYSE30 and KYSE70 cells were grown in Ham’s F12
(Wako, Osaka, Japan)/RPMI-1640 (Gibco Invitrogen, Carlsbad, CA)
supplemented with 20% fetal bovine serum (533–69545; Wako),
penicillin-streptomycin (100 mg/l; Invitrogen) in a humidified
atmosphere of 5% CO2 at 37°C. T.T cells were grown in
DMEM/Ham’s F12 medium (Wako) with 10% fetal bovine serum,
penicillin-streptomycin (100 mg/l) in a humidified atmosphere of 5%
CO2 at 37°C.
Cell proliferation assay
Cell proliferation assays were performed using the
CCK-8 according to the manufacturer’s instructions. Each cell type
(1×10⁴) was seeded into a well of a 96-well plate and
cultured in 100 μl of each culture medium. After 24 h,
seeding cells were treated by addition of 1, 5 or 10 mM metformin
into the culture medium or left untreated. At the indicated time
points, the medium was exchanged for 110 μl of each culture
medium with CCK-8 reagent (10 μl CCK-8 and 100 μl
each culture medium), and the cells were incubated for 2 h.
Absorbance was measured at a wavelength of 450 nm using an
auto-microplate reader.
Preparation of cell lysate
The lysate was performed according to the methods
described in our previous reports (10,11).
All steps were carried out at 4°C. Protein concentrations were
measured using a dye-binding protein assay based on the Bradford
method (12).
Gel electrophoresis and western blot
analysis
Sodium dodecyl sulfate-polyacrylamide gel
electrophoresis (SDS-PAGE) was performed according to the method of
Laemmli (13), and western blot
analysis was performed as described by Towbin et al(14) using primary antibodies and
HRP-conjugated secondary antibodies. Immunoreactive proteins were
visualized with an enhanced chemiluminescence detection system
(Perkin Elmer Co., Waltham, MA) on X-ray film.
Flow cytometry analysis
To evaluate the mechanism of growth inhibition by
metformin, the cell cycle profile was analyzed after treatment with
metformin. KYSE30 cells (1.0×10⁶ cells in a 6-well plate
dish) were treated with 10 mM metformin or left untreated for 24–72
h. After treatment, the cells were harvested and fixed in 80%
ethanol. The fixed cells were washed with PBS and then stored at
−20°C until flow cytometric analysis was performed. On the day of
analysis, cells were washed and centrifuged using cold PBS,
suspended in 100 μl PBS and 10 μl RNase A solution
(250 μg/ml), and incubated for 30 min at 37°C. Then, 110
μl propidium iodide (PI) stain (100 μg/ml) was added
to each tube, which was then incubated at 4°C for at least 30 min
prior to analysis. Flow cytometric analysis was performed using a
Cytomics FC 500 flow cytometer (Beckman Coulter, Brea, CA) equipped
with an argon laser (488 nm). The percentages of cells in different
phases of the cell cycle were analyzed by using FlowJo software
(Tree Star, Ashland, OR). All experiments were performed in
triplicate to assess for consistency of response.
Antibody arrays of phosphorylated
receptor tyrosine kinase (p-RTK)
The RayBio™ Human Phospho Array Kit (catalog no. ARY
001) was purchased from RayBiotech Inc. (Norcross, GA). The assay
for p-RTK array was performed according to the manufacturer’s
instructions. Briefly, p-RTK array membranes were blocked with 5%
BSA/TBS (0.01 M Tris-HCl, pH 7.6) for 1 h. Membranes were then
incubated with 2 ml of lysate prepared from cell lines or tumorous
tissues after normalization with equal amounts of protein. After
extensive washing with TBS including 0.1% v/v Tween-20 (3 washings
for 10 min each) and with TBS alone (2 washings for 10 min each) to
remove unbound materials, the membranes were incubated with
anti-phospho-tyrosine-HRP antibody for 2 h at room temperature. The
unbound HRP antibody was washed out with TBS including 0.1%
Tween-20. Finally, each array membrane was exposed to X-ray film
using a chemiluminescence detection system (Perkin Elmer Co.). The
density of the immunoreactive band obtained on the p-RTK array was
analyzed by densitometric scanning (Tlc scanner; Shimizu Co. Ltd.,
Kyoto, Japan).
Angiogenic profile analysis using an
antibody array
The RayBio™ Human Angiogenesis Antibody Array 1 kit
(catalog no. AAH-ANG-1) was purchased from RayBiotech Inc. The
assay for array was performed according to the manufacturer’s
instructions. Briefly, the angiogenesis antibody membranes were
blocked with blocking buffer for 30 min. The membranes were then
incubated with 1 ml of lysate prepared from cell lines after
normalization with equal amounts of protein. After extensive
washing with TBS including 0.1% v/v Tween-20, 3 times for 10 min,
and TBS alone, 2 times for 10 min, to remove unbound materials, the
membranes were then incubated with anti-phospho-tyrosine-HRP
antibody for 2 h at room temperature. The unbound HRP antibody was
washed out with TBS including 0.1% Tween-20. Finally, each array
membrane was exposed to X-ray film using a chemiluminescence
detection system (Perkin Elmer Co.). The density of the
immunoreactive band obtained on this array was analyzed by
densitometric scanning (Tlc scanner; Shimizu Co. Ltd.).
Analysis of the miRNA array
The samples of cancer cell lines were processed for
total-RNA extraction with a miRNeasy mini kit (Qiagen, Hilden,
Germany) according to the manufacturer’s instructions. RNA samples
typically showed A260/280 ratios of between 1.9 and 2.1, as
determined using an Agilent 2100 Bioanalyzer (Agilent Technologies,
Santa Clara, CA).
After RNA measurement with an RNA 6000 Nano kit
(Agilent Technologies), the samples were labeled using a miRCURY
Hy3/Hy5 Power labeling kit and were hybridized on a human miRNA
Oligo chip (v.14.0; Toray Industries, Tokyo, Japan). Scanning was
performed with a 3D-Gene Scanner 3000 (Toray Industries). 3D-Gene
extraction version 1.2 software (Toray Industries) was used to read
the raw intensity of the image. To determine the change in miRNA
expression between metformin-treated and control samples, the raw
data were analyzed via GeneSpringGX v10.0 (Agilent Technologies).
Samples were first normalized relative to 28sRNA and
baseline-corrected to the median of all samples.
Replicate data were consolidated into two groups:
those from metformin-treated cells and those from control cells,
and were organized by using the hierarchical clustering and
analysis of variance (ANOVA) functions in the GeneSpring software.
Hierarchical clustering was done by using the clustering function
(condition tree) and Euclidean correlation as a distance metric.
Two-way ANOVA analysis and asymptotic p-value computation without
any error correction on the samples were performed to search for
the miRNAs that varied most prominently across the different
groups. The p-value cutoff was set to 0.05. Only changes >50% in
at least one of the time points for each sample were considered
significant. All the analyzed data were scaled by global
normalization. The statistical significance of differentially
expressed miRNAs was analyzed by Student’s t-test.
Statistical analysis
All analyses were performed using the
computer-assisted JMP8.0 (SAS Institute, Cary, NC). Paired analysis
between the groups was performed using Student’s t-test. A p-value
of 0.05 was considered to indicate a significant difference between
groups.
Results
Effect of metformin on the proliferation
of human ESCC cells
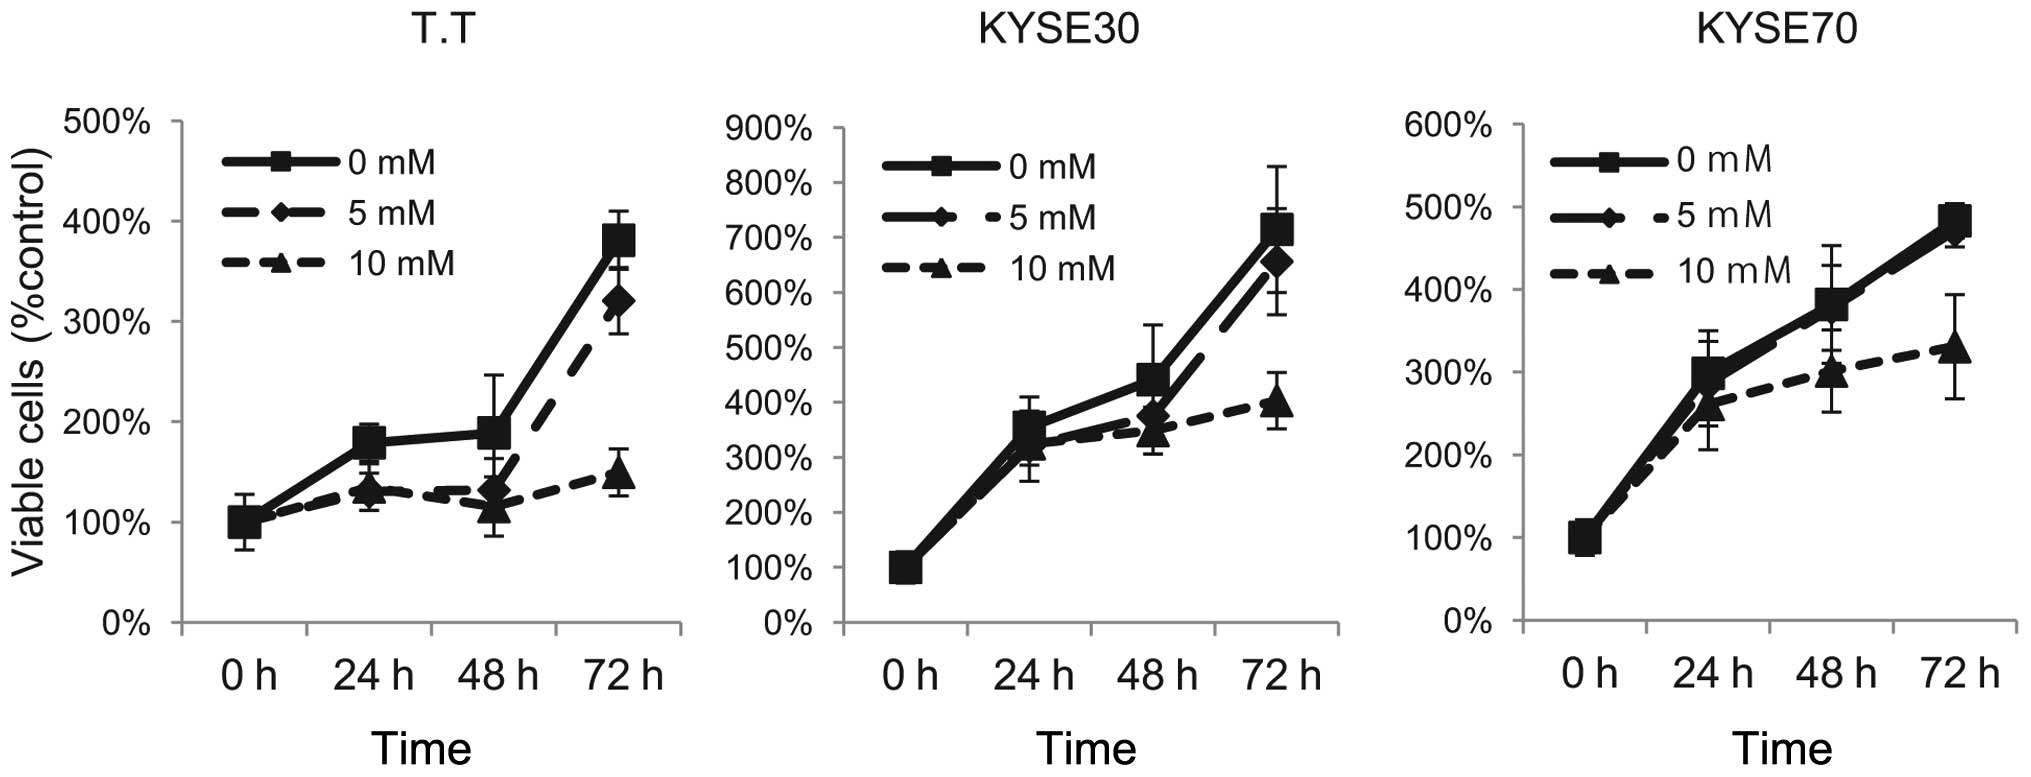
To evaluate the effect of the growth activity of
metformin on human ESCC cells in vitro, we examined
metformin’s effect on the proliferation of three esophageal
squamous cell carcinoma cell lines: T.T, KYSE30 and KYSE70. To
discern the direct relationship between the decrease in cell
viability and the inhibition of cell proliferation, we followed the
course of proliferation over 3 days after the addition of
metformin. Cells were grown in culture medium and treated with 5 or
10 mM metformin or, as a control, without metformin. As shown in
Fig. 1, metformin led to a
dose-dependent and strong inhibition of cell proliferation in the
ESCC cell lines T.T and KYSE30. In KYSE70 cells, although 5 mM
metformin did not effect the proliferation of cancer cells,
treatment with 10 mM metformin inhibited the proliferation of
cells. These results suggest that metformin inhibits ESCC
proliferation.
Effects of metformin on cell cycle
regulatory proteins in KYSE30
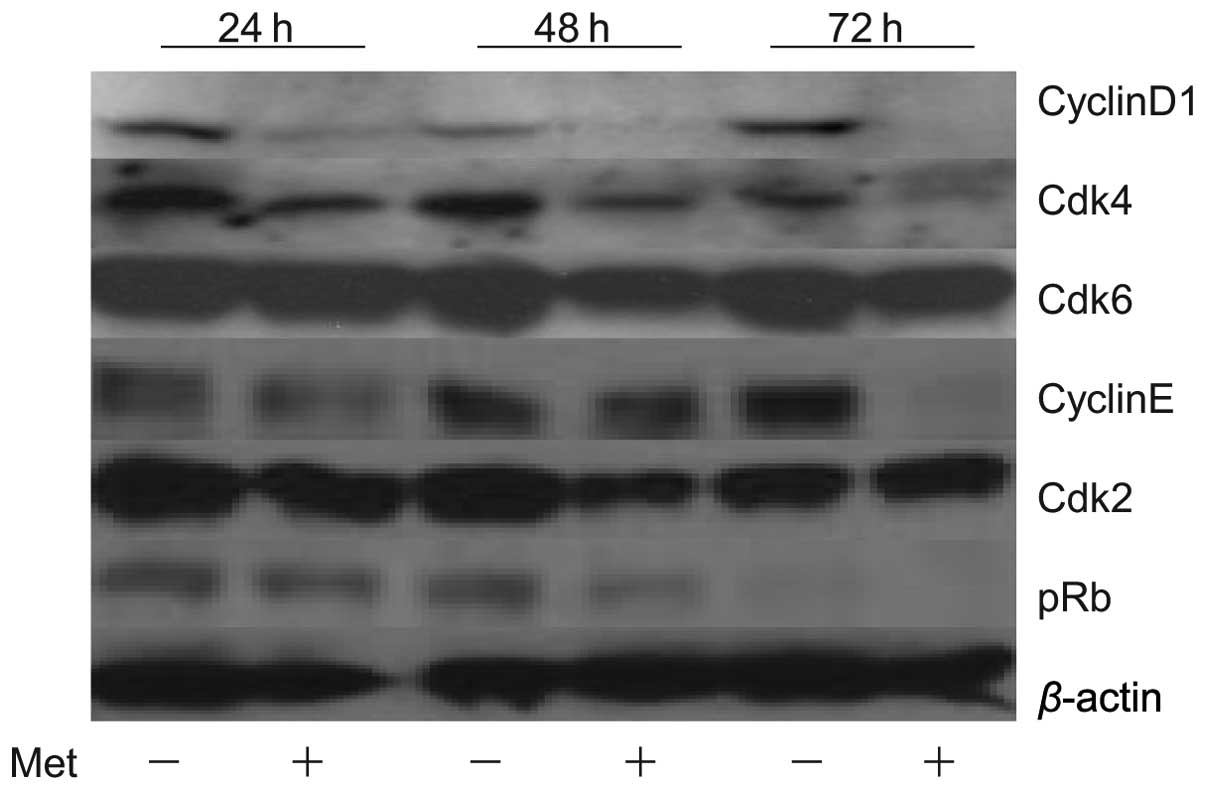
To study whether or not metformin affects the cell
cycle in KYSE30 cells, western blot analysis was used to examine
the expression of various cell cycle-related molecules in KYSE30
with and without metformin treatment. Cells were treated with 10 mM
metformin or left untreated for 24–72 h. The most remarkable change
was the loss of cyclin D1, a key protein implicated in the
transition of the G0/G1 phase. In short, the cyclin D1 level was
already reduced at 24 h after the addition of metformin and was no
longer detectable at 48 and 72 h (Fig.
2). We then studied the expression of other cell cycle-related
proteins (Cdk4, Cdk6, cyclin E and Cdk2) implicated in the G0/G1
transition. Cdk4 and Cdk6, the catalytic subunit of cyclin D1, was
slightly decreased at 48 and 72 h after the addition of metformin.
Cyclin E was decreased at 72 h after the addition of metformin. The
catalytic subunit of cyclin E, Cdk2, was also slightly decreased at
48 and 72 h after the addition of metformin. The level of pRb also
decreased progressively in metformin-treated cells. These events
were also detected in the two other cancer cell lines, i.e., T.T
and KYSE70 (data not shown). The amount of β-actin (an internal
control for protein loading) was almost the same in each lane in
sodium dodecyl sulfate polyacrylamide gel electrophoresis (Fig. 2).
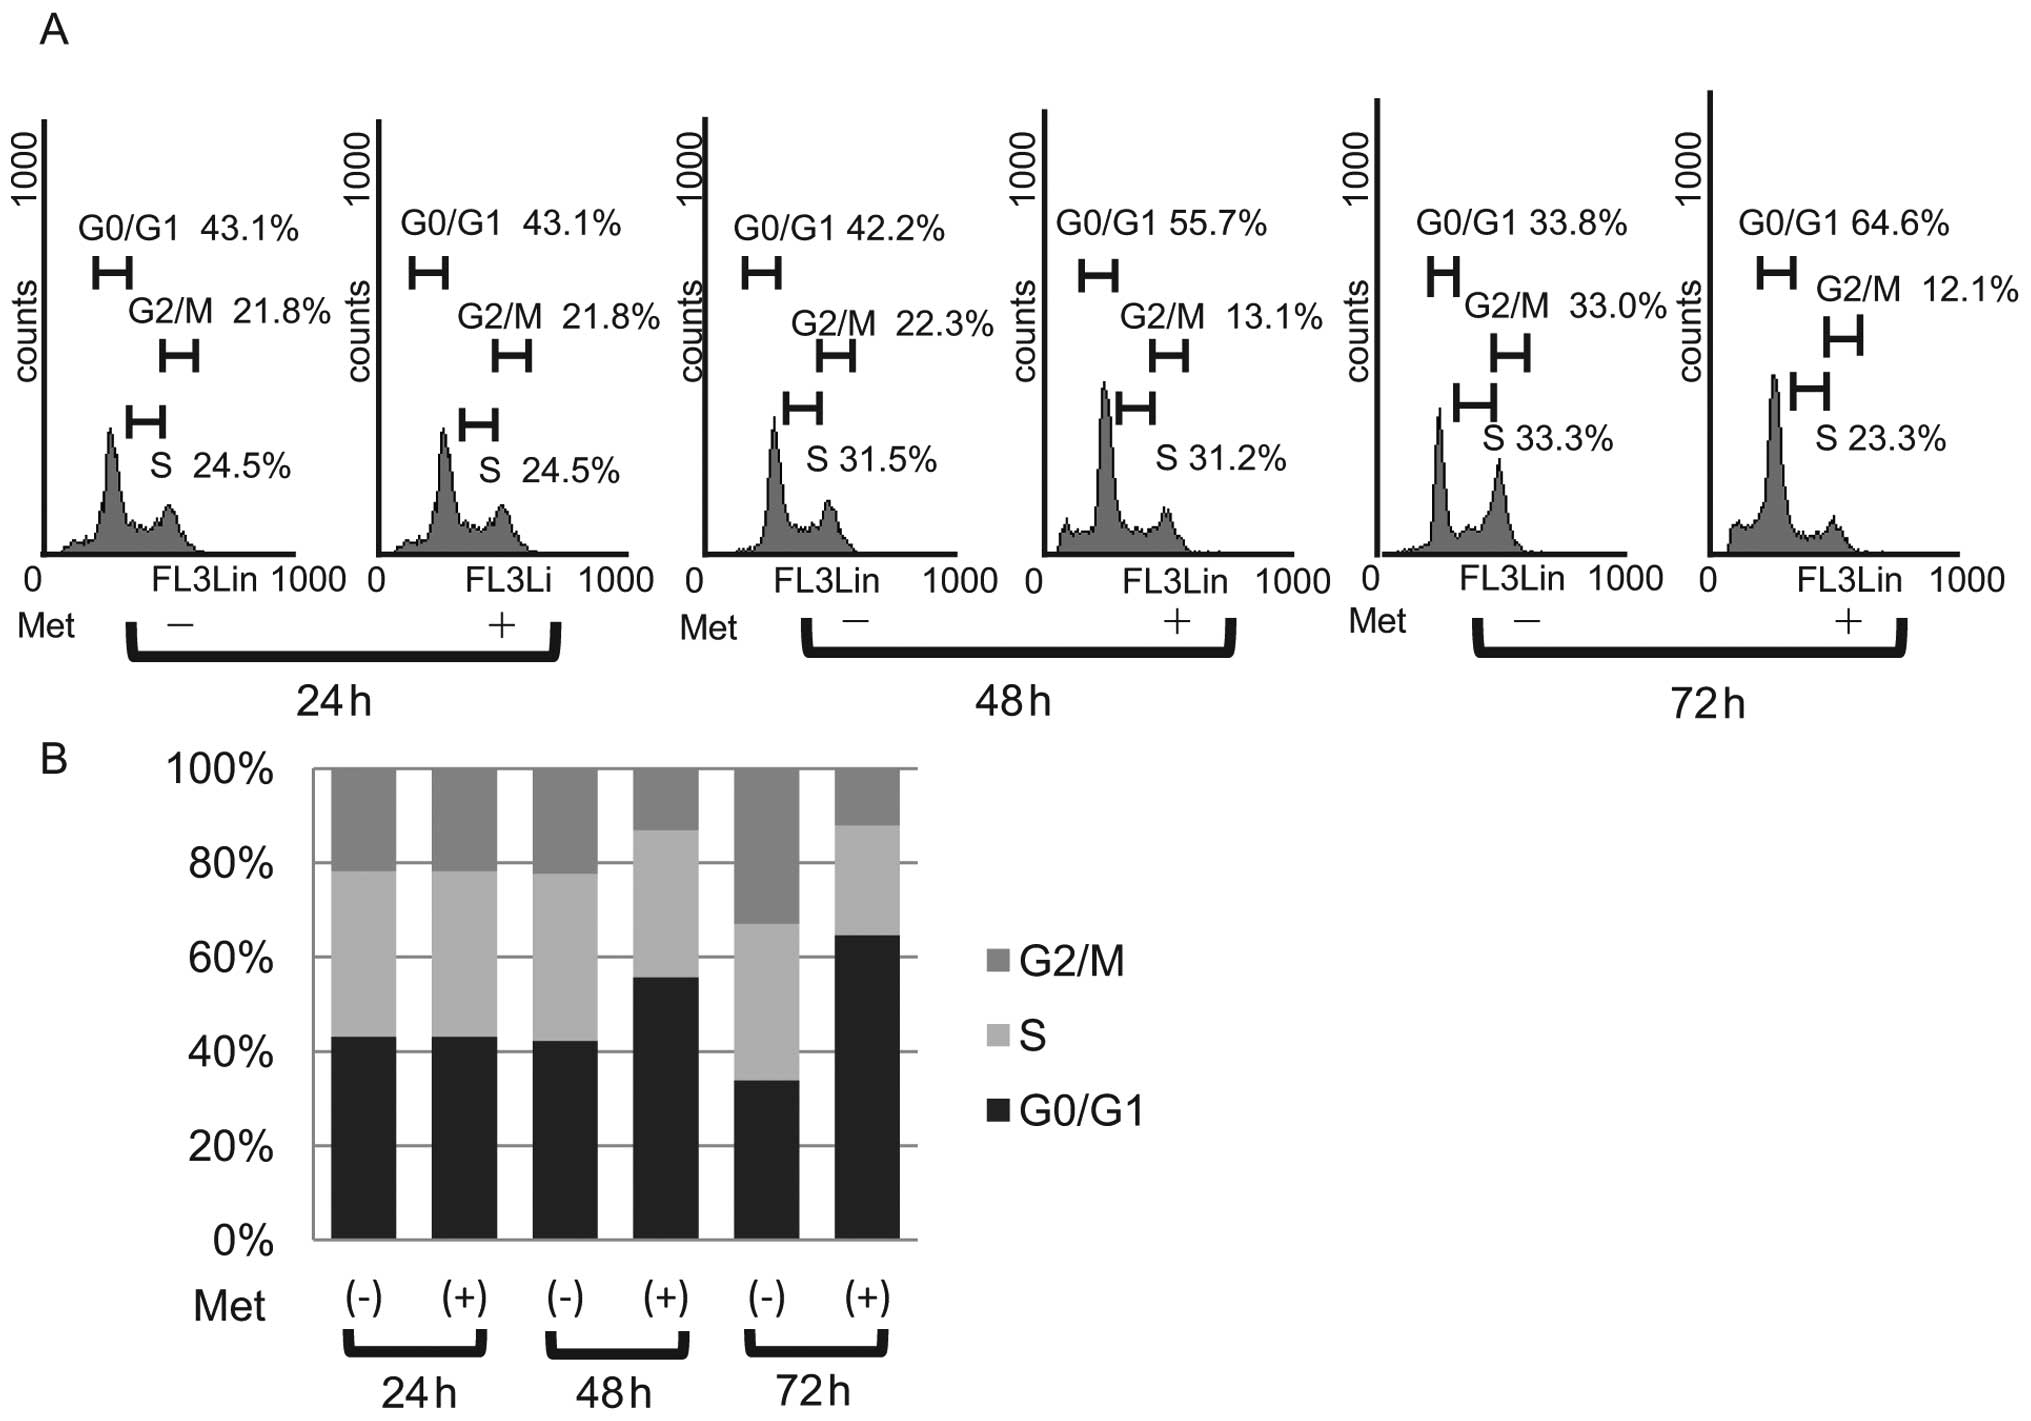
To further investigate the inhibition of KYSE30 cell
proliferation in the presence of metformin, the cell cycle
progression was examined by flow cytometry. We treated
proliferating KYSE30 cells with 10 mM metformin for different
durations. After the addition of 10 mM metformin, an increasing
number of cells started to accumulate in G0/G1, 55.7% after 48 h
and 64.6% by 72 h (Fig. 3A). In
parallel, we observed reductions in the percentage of cells in the
S phase and G2/M phase (Fig. 3B).
These data suggest that metformin inhibits the cell cycle
progression from G0/G1 into S phase, resulting in G1 cell cycle
arrest.
Differences in phosphorylated-receptor
tyrosine kinases p-(RTKs) in KYSE30 cells with or without metformin
treatment in vitro
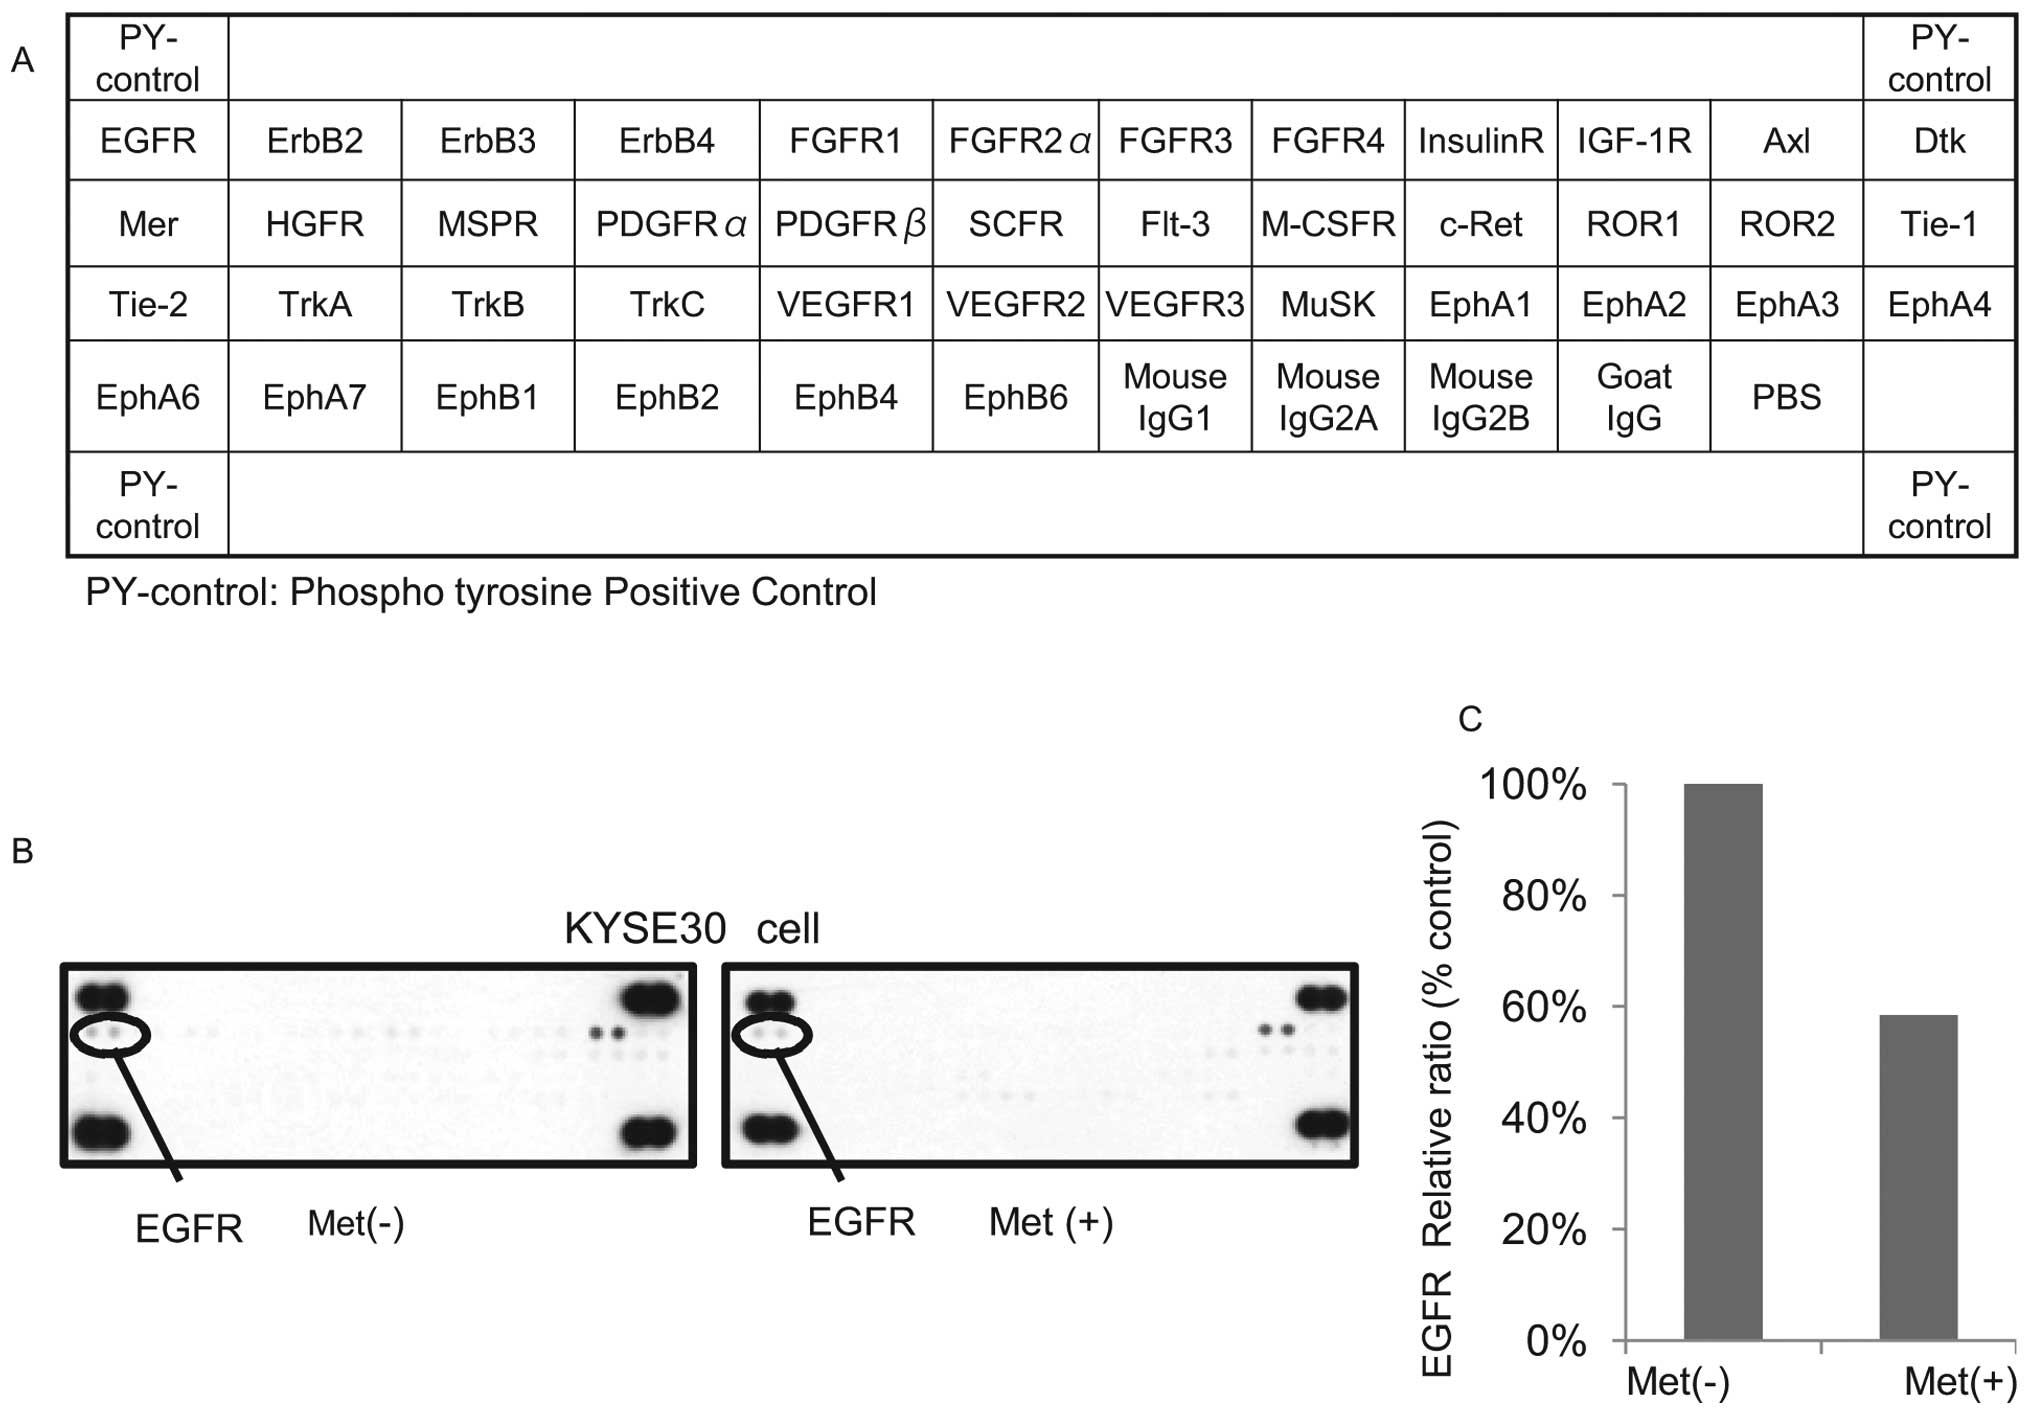
Having established the antitumor effects of
metformin in the ESCC cell lines, we next used a phosphorylated-RTK
array system to identify the ‘key’ RTKs in terms of these antitumor
effects. By using an antibody array (Fig. 4A), we simultaneously screened the
expression of 42 different RTKs in KYSE30 cells with or without
metformin. The results showed that the expression of
phosphorylated-epidermal growth factor (p-EGFR) (Fig. 4B) was reduced by the treatment of
metformin.
The density of the p-EGFR obtained from the membrane
array was analyzed by means of a Kodak Image Station (Eastman
Kodak, Rochester, NY). The densitometric ratio of the p-EGFR spots
of the metformin-treated cell lines to the p-EGFR spots of the cell
lines not treated with metformin was reduced to 58.4% (Fig. 4C).
Differences in angiogenesis-related
protein expression in KYSE30 cells with or without metformin
treatment in vitro
We used an angiogenesis antibody array system to
identify the ‘key’ angiogenesis-related protein in terms of the
antitumor effect of metformin.
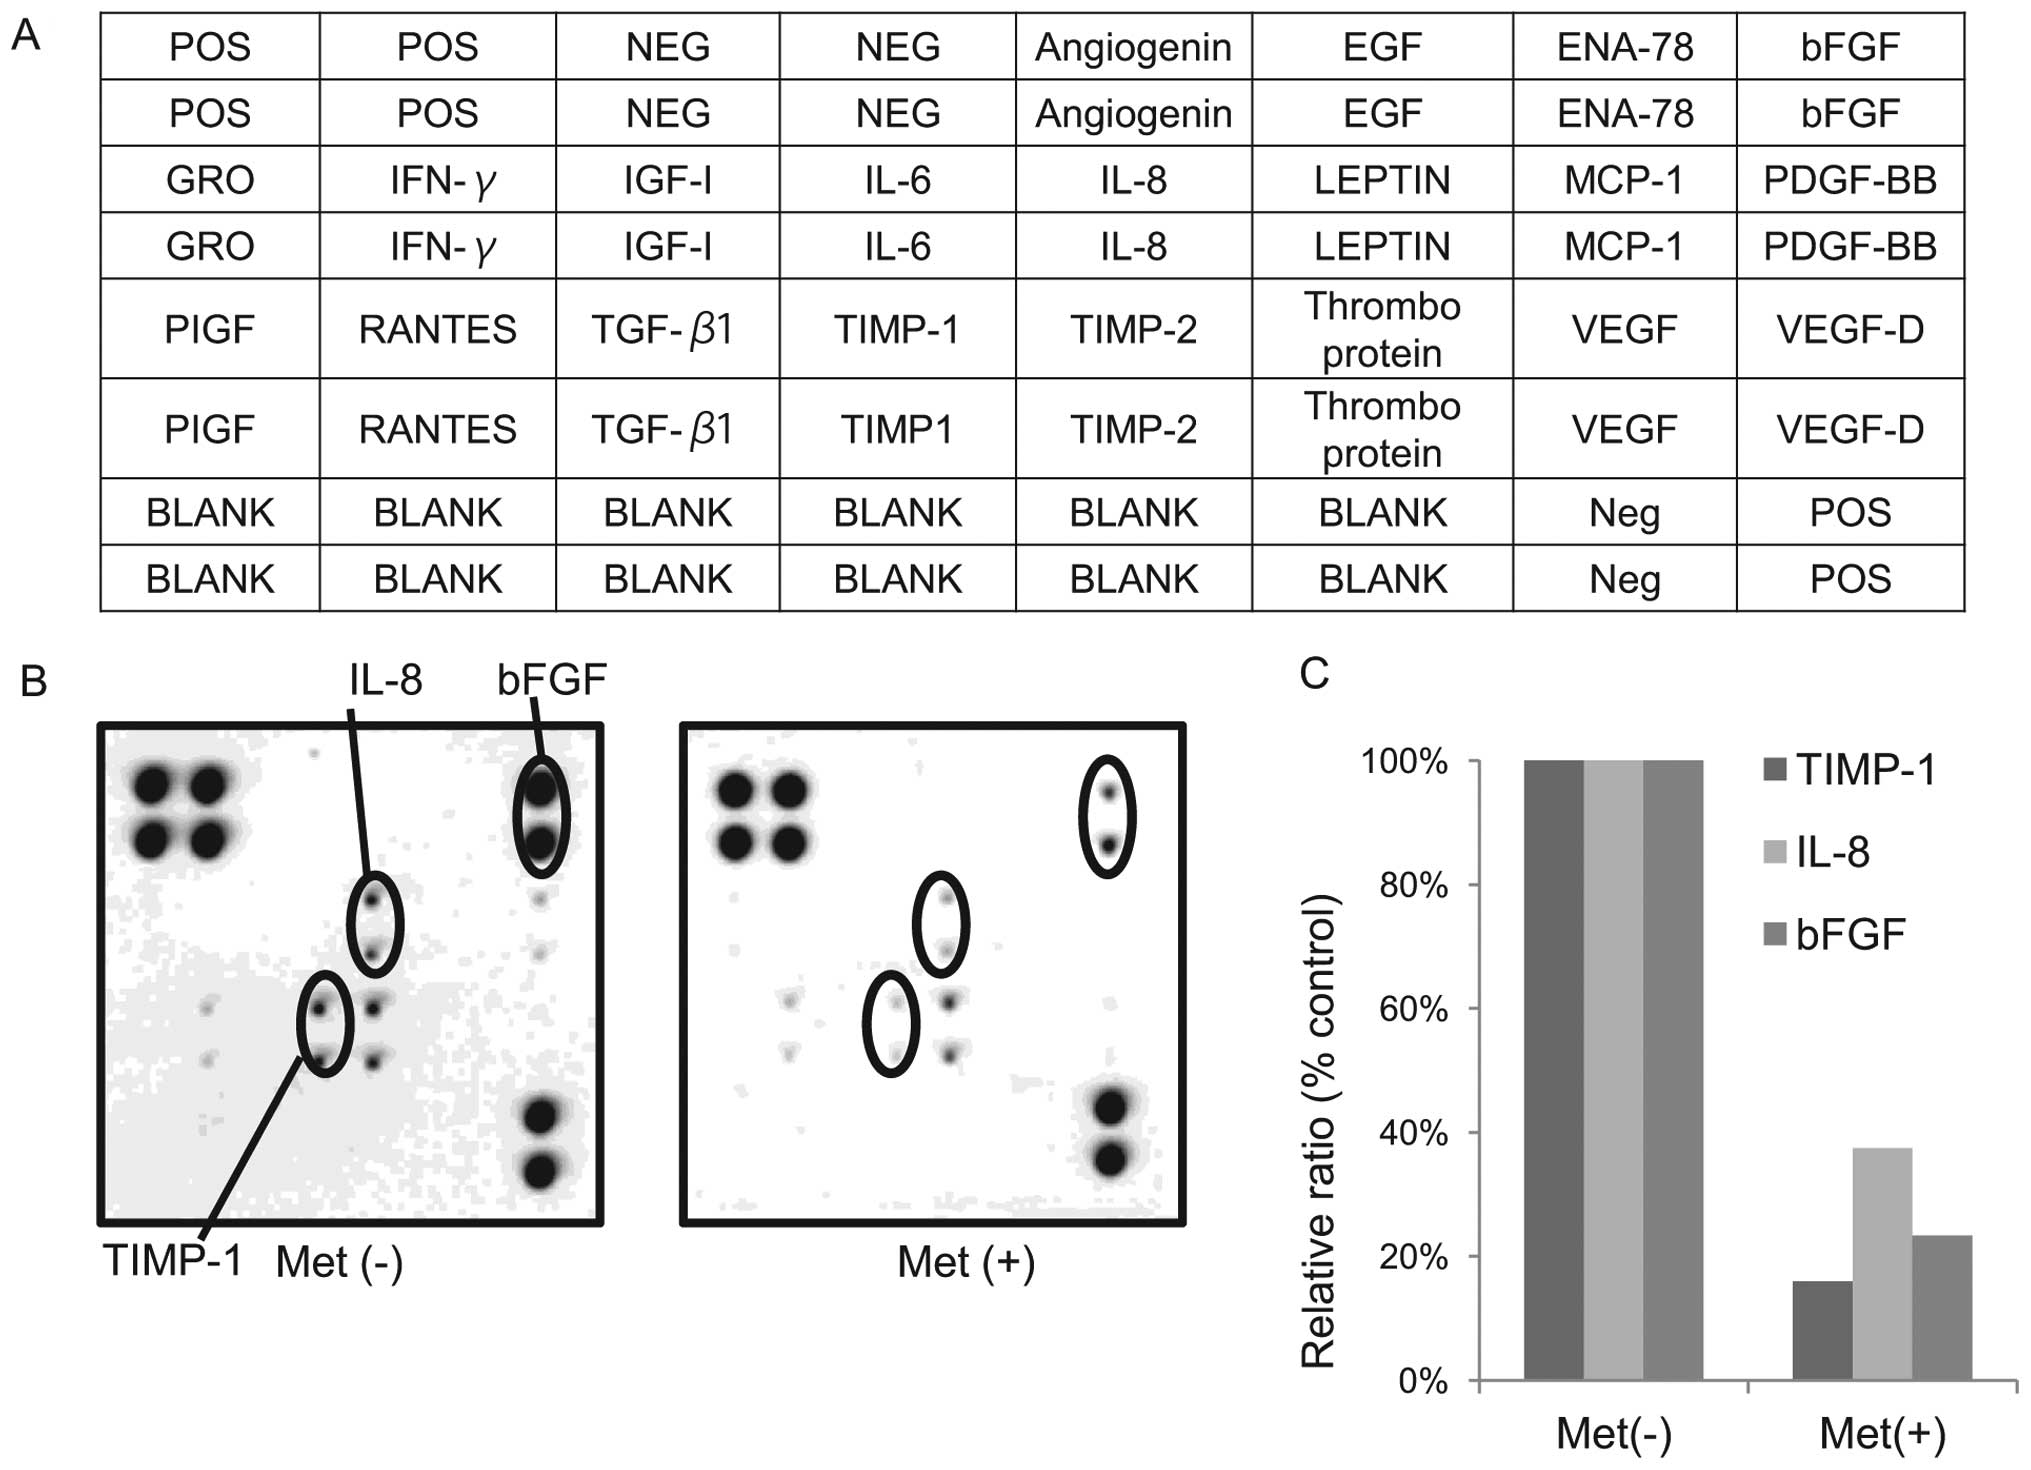
By using the antibody array (Fig. 5A), we simultaneously screened the
expression of 20 different angiogenesis antibodies in KYSE30 cells
with or without metformin. The expression of interleukin-8 (IL-8),
tissue inhibitor of metalloproteinases-1 (TIMP-1) and basic
fibroblast growth factor (bFGF) (Fig.
5B) were reduced by the treatment with metformin as detected by
the protein array.
The density of the IL-8, TIMP-1 and bFGF obtained
from the membrane array was analyzed using the Kodak Image Station
(Eastman Kodak). The densitometric ratio of the TIMP-1, IL-8 and
bFGF spots from metformin-treated cells to those of cells not
treated with metformin were 15.9, 37.4 and 23.3%, respectively
(Fig. 5C).
Differences in miRNA in KYSE30 cells with
or without metformin treatment in vitro
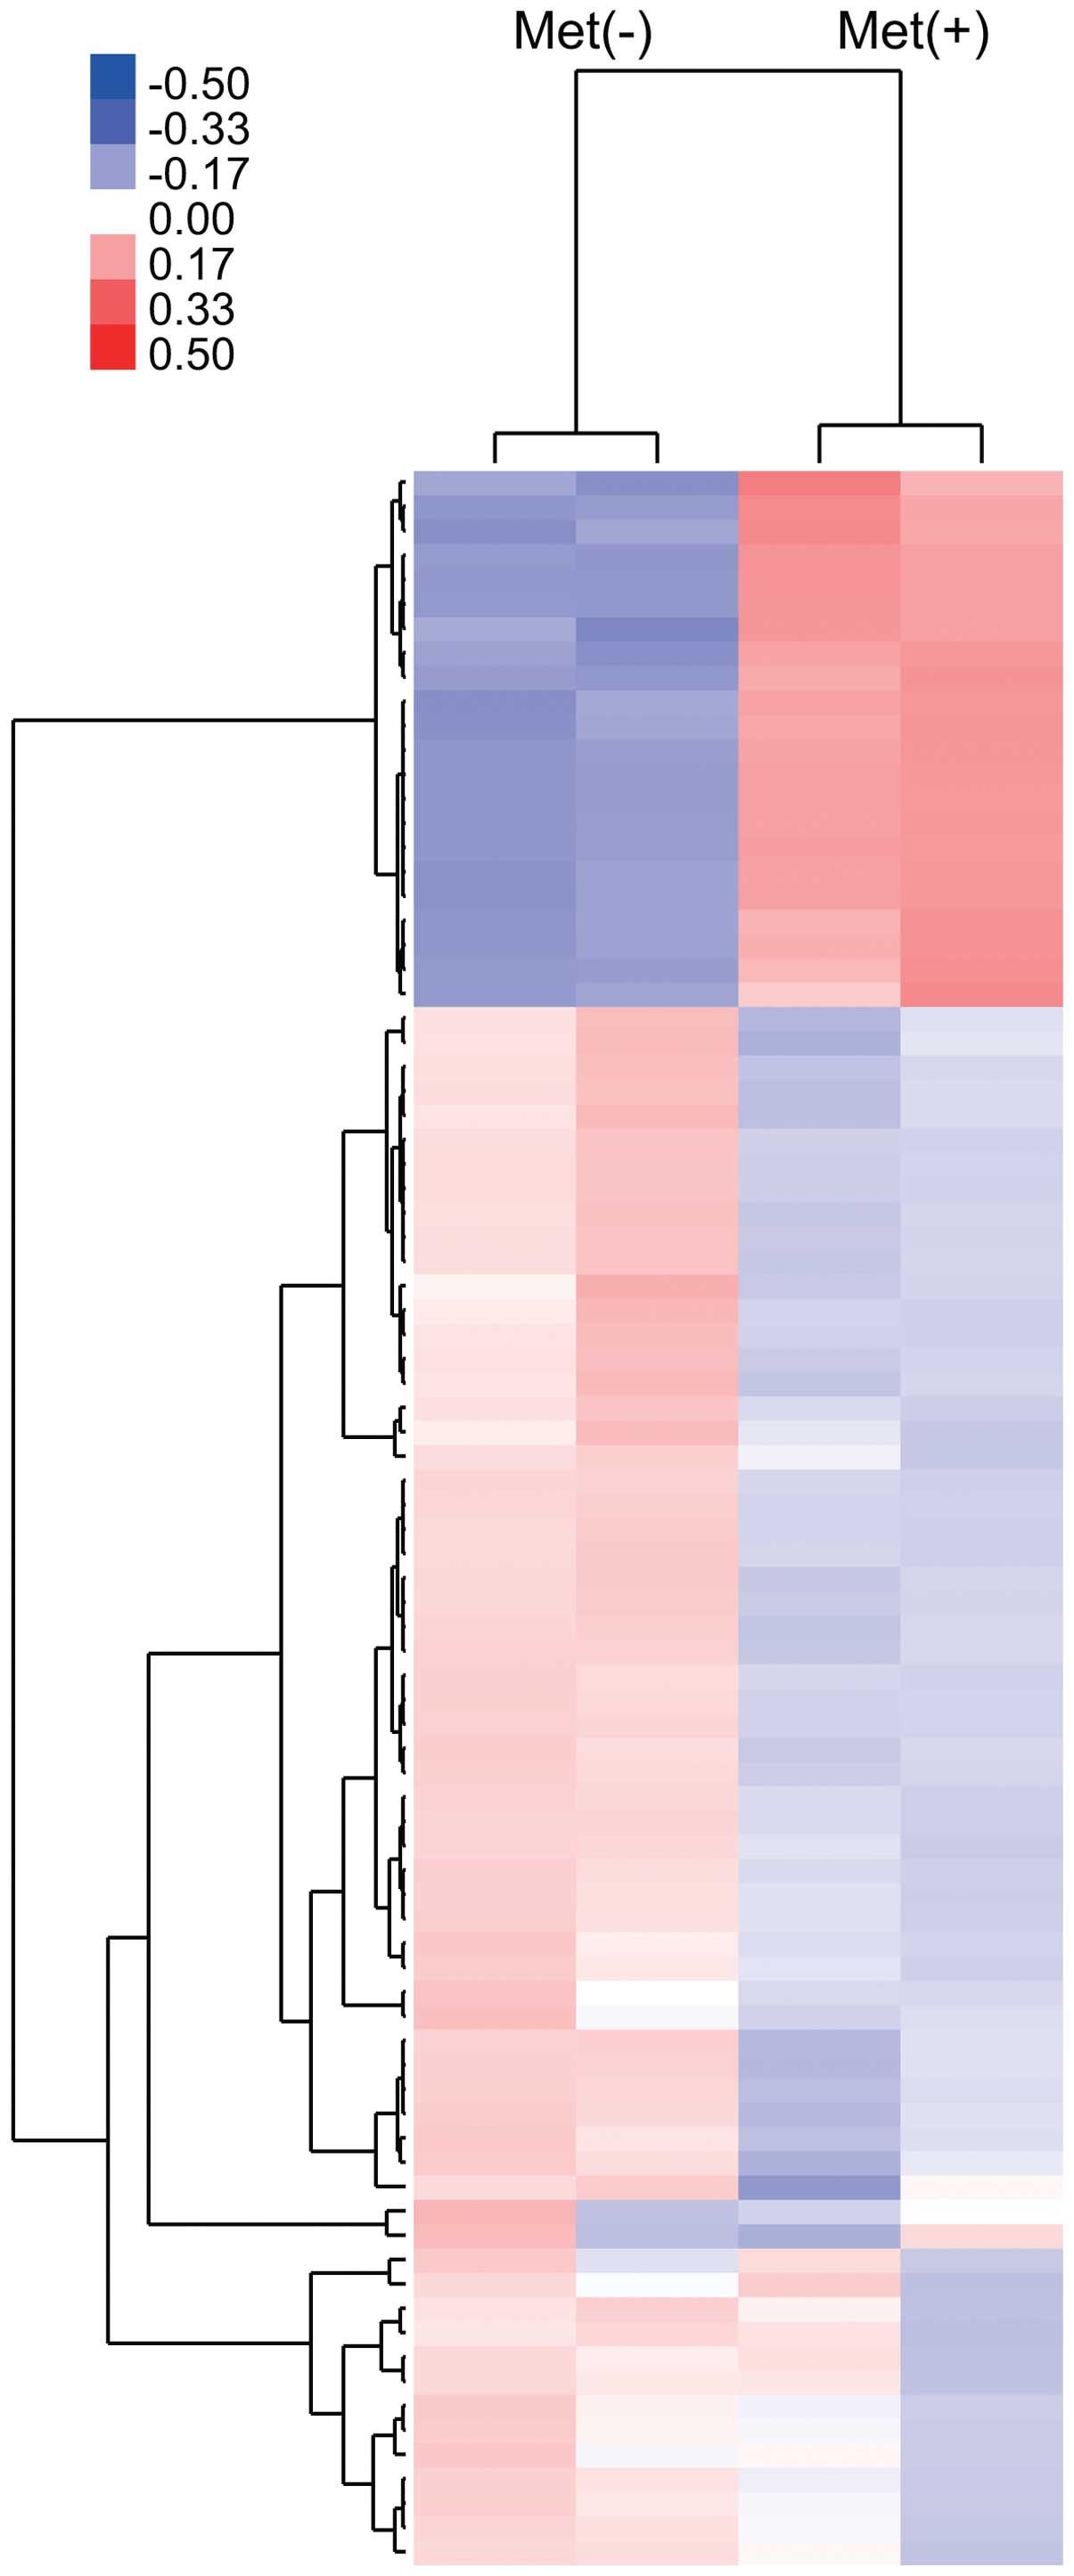
Using a custom microarray platform, we analyzed the
expression levels of 985 human miRNA probes in KYSE30 cells with or
without metformin treatment in vitro. As shown in Fig. 6 and Table I, when the expression of miRNAs was
studied in KYSE30 cells treated with 10 mM metformin and without
metformin in vitro, 17 miRNAs were significantly upregulated
(Fig. 6 and Table I) in KYSE30 cells after 72 h of
metformin treatment, while 45 miRNAs were downregulated (Fig. 6 and Table I) of the 985 miRNAs.
 | Table I.Statistical results and chromosomal
locations of miRNAs in KYSE30 cells treated with metformin,
compared with non-treated cells. |
Table I.
Statistical results and chromosomal
locations of miRNAs in KYSE30 cells treated with metformin,
compared with non-treated cells.
| Fold
(treated/non-treated)
| Fold
(treated/non-treated)
|
|---|
| Upregulated
miRNA | Mean ± SD | P-value | Chromosomal
localization | Downregulated
miRNA | Mean ± SD | P-value | Chromosomal
localization |
|---|
| hsa-miR-1246 | 2.16±0.115 | 0.011827 | 2q31.1 | hsa-miR-22 | 0.75±0.005 | 0.00571 | 17p13.3 |
| hsa-miR-638 | 1.88±0.021 | 0.01019 | 19p13.2 |
hsa-miR-125a-3p | 0.77±0.006 | 0.006262 | 19q13.41 |
|
hsa-miR-149* | 1.84±0.086 | 0.024371 | 2q37.3 | hsa-miR-30e | 0.8±0.012 | 0.011198 | 1p34.2 |
| hsa-miR-663 | 1.68±0.051 | 0.003587 | 20p11.1 | hsa-miR-31 | 0.82±0.008 | 0.001852 | 9q21.3 |
| hsa-miR-1908 | 1.61±0.08 | 0.018783 | 11q12.2 | hsa-miR-19a | 0.83±0.028 | 0.006905 | 13q31.3 |
| hsa-miR-1268 | 1.6±0.005 | 0.011672 | 15q11.2 | hsa-miR-1260 | 0.85±0.003 | 0.00294 | 14q24.3 |
| hsa-miR-3196 | 1.55±0.056 | 0.024353 | 20q13.33 | hsa-miR-301a | 0.85±0.003 | 0.003951 | 17q22 |
| hsa-miR-2861 | 1.53±0.056 | 0.02555 | 9q34.11 | hsa-let-7f | 0.87±0.005 | 1.22E-06 | 9q22.32 |
| hsa-miR-3665 | 1.43±0.031 | 0.018788 | 13q22.3 | hsa-let-7c | 0.87±0.006 | 0.002223 | 21q21.1 |
| hsa-miR-3656 | 1.42±0.021 | 0.020642 | 11q23.3 | hsa-let-7d | 0.87±0.009 | 0.003382 | 9q22.32 |
| hsa-miR-762 | 1.42±0.052 | 0.03006 | 16p11.2 | hsa-miR-19b | 0.88±0.006 | 0.003734 | 13q31.3 |
| hsa-miR-3621 | 1.39±0.079 | 0.047853 | 9q34.3 | hsa-miR-17 | 0.88±0.007 | 0.005864 | 13q31.3 |
| hsa-miR-3648 | 1.37±0.073 | 0.049042 | 21p11.2 | hsa-miR-221 | 0.88±0.003 | 0.011279 | Xq11.3 |
| hsa-miR-664 | 1.35±0.027 | 0.017668 | 1q41 | hsa-miR-20a | 0.88±0.011 | 0.012623 | 13q31.3 |
| hsa-miR-4284 | 1.18±0.012 | 0.013386 | 7q11.23 | hsa-miR-4286 | 0.89±0.006 | 0.009008 | 8p23.1 |
| hsa-miR-3175 | 1.16±0.039 | 0.048742 | 15q26.1 | hsa-miR-23b | 0.91±0.003 | 0.000424 | 9q22.32 |
| hsa-miR-3651 | 1.12±0.004 | 0.012559 | 9q22.31 | hsa-miR-26b | 0.91±0.001 | 0.005239 | 2q35 |
| | | | hsa-let-7a | 0.86±0.003 | 0.013342 | 9q22.32 |
| | | | hsa-miR-141 | 0.91±0.007 | 0.013575 | 12p13.31 |
| | | | hsa-miR-30a | 0.91±0.008 | 0.013823 | 6q13 |
| | | | hsa-miR-151-5p | 0.79±0.024 | 0.017194 | 8q24.3 |
| | | | hsa-miR-103 | 0.88±0.013 | 0.019115 | 5q34 |
| | | | hsa-miR-200a | 0.91±0.009 | 0.020473 | 1p36.33 |
| | | | hsa-miR-93 | 0.87±0.016 | 0.020961 | 7q22.1 |
| | | | hsa-miR-1260b | 0.91±0.009 | 0.022633 | 11q21 |
| | | | hsa-miR-1274b | 0.88±0.014 | 0.024406 | |
| | | | hsa-miR-106a | 0.89±0.016 | 0.024855 | Xq26.2 |
| | | | hsa-miR-16 | 0.88±0.008 | 0.026064 | 13q14.2 |
| | | | hsa-miR-1280 | 0.91±0.011 | 0.026495 | 3q21.3 |
| | | | hsa-miR-15b | 0.88±0.016 | 0.027129 | 3q25.33 |
| | | | hsa-miR-18a | 0.85±0.012 | 0.027439 | 13q31.3 |
| | | | hsa-miR-15a | 0.82±0.022 | 0.027525 | 13q14.2 |
| | | | hsa-miR-200c | 0.9±0.014 | 0.027716 | 12p13.31 |
| | | | hsa-miR-107 | 0.88±0.018 | 0.028234 | 10q23.31 |
| | | | hsa-miR-200b | 0.94±0.009 | 0.028265 | 1p36.33 |
| | | | hsa-miR-92a | 0.76±0.038 | 0.02887 | 13q31.3 |
| | | | hsa-miR-7 | 0.71±0.025 | 0.031884 | 9q21.32 |
| | | | hsa-miR-29a | 0.88±0.02 | 0.032697 | 7q32.3 |
| | | | hsa-miR-24 | 0.96±0.005 | 0.032934 | 9q22.32 |
| | | | hsa-miR-1274a | 0.84±0.029 | 0.038101 | |
| | | | hsa-miR-181a | 0.77±0.039 | 0.039589 | 1q32.1 |
| | | | hsa-miR-720 | 0.85±0.027 | 0.040428 | 3q23.1 |
| | | | hsa-miR-26a | 0.86±0.021 | 0.040936 | 3p22.2 |
| | | | hsa-miR-20b | 0.9±0.023 | 0.046995 | Xq26.2 |
| | | | hsa-miR-191 | 0.89±0.021 | 0.049584 | 3p21.31 |
Unsupervised hierarchical clustering analysis, using
Pearson’s correlation, showed that KYSE30 cells treated with
metformin clustered together and separately from the untreated
cells (Fig. 6).
Discussion
Recent studies from our group and those of other
authors have suggested that metformin is able to inhibit
proliferation in various cancer cell lines, such as breast cancer
(15), glial cancer (7) and prostate cancer (3) and gastric cancer (9). However, it has remained uncertain
whether metformin would exert antitumor effects against ESCC. In
the present study, we have shown that metformin is indeed a very
potent inhibitor of human ESCC cell growth via G1 arrest of the
cell cycle in vitro. In addition, the expression of miRNAs
was markedly altered with the treatment of metformin in
vitro.
Specific cyclin/cyclin-dependent kinase (Cdk)
complexes are activated at different intervals during the cell
cycle. Complexes of Cdk4 and Cdk6 with cyclin D1 are required for
G1 phase progression, whereas complexes of Cdk2 with cyclin E are
required for the G1/S transition (16).
In previous reports, including our own,
downregulation of cyclin D1 in response to metformin has been
demonstrated in various cancer cell lines, such as colon cancer
(17), breast cancer (17), prostate cancer (3) and gastric cancer (9). However, the antitumor effects of
metformin on catalytic subunits of cyclin D1, Cdk4 and Cdk6, remain
unknown. In the present study, the major cell cycle regulators
(cyclin D1, Cdk4, Cdk6, cyclin E, Cdk2, phosphorylated Rb) could be
intracellular targets of the metformin-mediated anti-proliferative
effect in human ESCC in vitro. In addition, flow cytometry
demonstrated that metformin arrested ESCC cells at the G0/G1 phase
in vitro. These data suggest that the antitumor effect of
metformin for various cancers, including ESCC, may be related to
the reduction of various cell cycle-related proteins, especially
cyclin D1.
Metformin leads to changes in various protein
phosphorylations. To date, changes in the phosphorylation of
various molecules, such as, Akt, β-catenin, CREB, Chk2 (18) and c-Src (19) has been detected in cell lines
treated with metformin. We also detected a reduction of p-EGFR in
ESCC by metformin treatment using a protein array. These data
suggest that the expression of p-EGFR is reduced with the treatment
of metformin in ESCC. Some studies have also reported that
metformin reduces the expression of p-EGFR and p-IGF-1R in breast
(19) and pancreas cancer
(20). Collectively, these results
suggest that metformin might reduce the expression of p-EGFR and
p-IGF in many cancer types, including ESCC. Therefore, the aberrant
EGFR activation (enhanced p-EGFR) may lead to carcinogenesis
(21). Our current data, together
with those of the previous reports, indicate that the blocking of
the cell cycle in G0/G1 may be due to the inhibition of EGFR
activation (22).
In the present study, metformin was found to reduce
some angiogenesis-related proteins, such as interleukin-8 (IL-8),
tissue inhibitor of metalloproteinases-1 (TIMP-1) and basic
fibroblast growth factor (bFGF). TIMP-1 is not only related to
angiogenesis, but also possesses the ability of cell growth
promotion. In addition, a previous report has shown that the
enhanced expressions of b-FGF and IL-8 are associated with the
development of advanced esophageal cancer (23). These data suggest that the
antitumor effect of metformin may be due to the reduction of
TIMP-1, IL-8 and b-FGF.
Using microRNA (miRNA) expression arrays, we have
determined variations in miRNA profiles in ESCC cell lines in
culture treated with metformin compared to those not treated with
metformin. The cluster analysis clearly demonstrated that metformin
treatment affects the expression of numerous miRNAs in cultured
cells. In the analyses, we selected sets of miRNAs that altered
their expression levels significantly with and without metformin
treatment. We identified 62 miRNAs differentially expressed (17
upregulated and 45 downregulated) in cell culture. These data
suggest that miRNAs may be meaningful candidates to gauge the
effectiveness of metformin treatment and to provide clues to the
molecular basis of the anticancer effects of metformin.
We found that the most changed miRNA in ESCC cells
treated with metformin was miR-1246, which was upregulated
2.16-fold in cells treated with metformin, as compared with the
control. Recently, Zhang et al(24) reported that miR-1246 is induced by
p53 activation, and plays a role in the induction of apoptosis in
cancer cells. In previous reports (20,25),
metformin was also demonstrated to possess antitumor effects
through the induction of apoptosis in various cancer cells. In
agreement with these studies, our data also suggest that miR-1246
may be associated with the antitumor effects of metformin in ESCC
cells.
In conclusion, our results revealed that metformin
inhibits human ESCC cell proliferation, possibly by suppressing
cell cycle-related molecules via activation of EGFR, induction of
TIMP1, IL-8 and alteration of miRNAs. Therefore, metformin may
become a novel and effective therapeutic agent for the treatment
and long-term management of ESCC providing additional benefits at
low cost. Further studies are necessary, however, to resolve many
remaining problems.
References
|
1.
|
Sant M, Aareleid T, Berrino F, et al:
EUROCARE-3: survival of cancer patients diagnosed 1990–94 - results
and commentary. Ann Oncol. 14(Suppl 5): v61–v118. 2003.
|
|
2.
|
Witters LA: The blooming of the French
lilac. J Clin Invest. 108:1105–1107. 2001. View Article : Google Scholar : PubMed/NCBI
|
|
3.
|
Ben Sahra I, Laurent K, Loubat A, et al:
The antidiabetic drug metformin exerts an antitumoral effect in
vitro and in vivo through a decrease of cyclin D1 level. Oncogene.
27:3576–3586. 2008.PubMed/NCBI
|
|
4.
|
Brown KA, Hunger NI, Docanto M and Simpson
ER: Metformin inhibits aromatase expression in human breast adipose
stromal cells via stimulation of AMP-activated protein kinase.
Breast Cancer Res Treat. 123:591–596. 2010. View Article : Google Scholar : PubMed/NCBI
|
|
5.
|
Zhou XZ, Xue YM, Zhu B and Sha JP: Effects
of metformin on proliferation of human colon carcinoma cell line
SW-480. Nan Fang Yi Ke Da Xue Xue Bao. 30:1935–1942. 2010.(In
Chinese).
|
|
6.
|
Hosono K, Endo H, Takahashi H, et al:
Metformin suppresses azoxymethane-induced colorectal aberrant crypt
foci by activating AMP-activated protein kinase. Mol Carcinog.
49:662–671. 2010. View
Article : Google Scholar : PubMed/NCBI
|
|
7.
|
Isakovic A, Harhaji L, Stevanovic D, et
al: Dual antiglioma action of metformin: cell cycle arrest and
mitochondria-dependent apoptosis. Cell Mol Life Sci. 64:1290–1302.
2007. View Article : Google Scholar : PubMed/NCBI
|
|
8.
|
Zakikhani M, Dowling R, Fantus IG,
Sonenberg N and Pollak M: Metformin is an AMP kinase-dependent
growth inhibitor for breast cancer cells. Cancer Res.
66:10269–10273. 2006. View Article : Google Scholar : PubMed/NCBI
|
|
9.
|
Kato K, Gong J, Iwama H, et al: The
antidiabetic drug metformin inhibits gastric cancer cell
proliferation in vitro and in vivo. Mol Cancer Ther. 11:549–560.
2012. View Article : Google Scholar : PubMed/NCBI
|
|
10.
|
Masaki T, Tokuda M, Yoshida S, et al:
Comparison study of the expressions of myristoylated alanine-rich C
kinase substrate in hepatocellular carcinoma, liver cirrhosis,
chronic hepatitis and normal liver. Int J Oncol. 26:661–671.
2005.
|
|
11.
|
Yukimasa S, Masaki T, Yoshida S, et al:
Enhanced expression of p46 Shc in the nucleus and p52 Shc in the
cytoplasm of human gastric cancer. Int J Oncol. 26:905–911.
2005.PubMed/NCBI
|
|
12.
|
Bradford MM: A rapid and sensitive method
for the quantitation of microgram quantities of protein utilizing
the principle of protein-dye binding. Anal Biochem. 72:248–254.
1976. View Article : Google Scholar : PubMed/NCBI
|
|
13.
|
Laemmli UK: Cleavage of structural
proteins during the assembly of the head of bacteriophage T4.
Nature. 227:680–685. 1970. View
Article : Google Scholar : PubMed/NCBI
|
|
14.
|
Towbin H, Staehelin T and Gordon J:
Electrophoretic transfer of proteins from polyacrylamide gels to
nitrocellulose sheets: procedure and some applications. Proc Natl
Acad Sci USA. 76:4350–4354. 1979. View Article : Google Scholar : PubMed/NCBI
|
|
15.
|
Anisimov VN, Berstein LM, Egormin PA, et
al: Effect of metformin on life span and on the development of
spontaneous mammary tumors in HER-2/neu transgenic mice. Exp
Gerontol. 40:685–693. 2005. View Article : Google Scholar : PubMed/NCBI
|
|
16.
|
Masaki T, Shiratori Y, Rengifo W, et al:
Cyclins and cyclin-dependent kinases: comparative study of
hepatocellular carcinoma versus cirrhosis. Hepatology. 37:534–543.
2003. View Article : Google Scholar : PubMed/NCBI
|
|
17.
|
Zhuang Y and Miskimins WK: Cell cycle
arrest in metformin treated breast cancer cells involves activation
of AMPK, down-regulation of cyclin D1, and requires p27Kip1 or
p21Cip1. J Mol Signal. 3:182008. View Article : Google Scholar : PubMed/NCBI
|
|
18.
|
Vazquez-Martin A, Oliveras-Ferraros C,
Cufi S, Martin-Castillo B and Menendez JA: Metformin activates an
ataxia telangiectasia mutated (ATM)/Chk2-regulated DNA damage-like
response. Cell Cycle. 10:1499–1501. 2011. View Article : Google Scholar : PubMed/NCBI
|
|
19.
|
Liu B, Fan Z, Edgerton SM, et al:
Metformin induces unique biological and molecular responses in
triple negative breast cancer cells. Cell Cycle. 8:2031–2040. 2009.
View Article : Google Scholar : PubMed/NCBI
|
|
20.
|
Wang LW, Li ZS, Zou DW, Jin ZD, Gao J and
Xu GM: Metformin induces apoptosis of pancreatic cancer cells.
World J Gastroenterol. 14:7192–7198. 2008. View Article : Google Scholar : PubMed/NCBI
|
|
21.
|
Yang YL, Xu KL, Zhou Y, Gao X and Chen LR:
Correlation of epidermal growth factor receptor overexpression with
increased epidermal growth factor receptor gene copy number in
esophageal squamous cell carcinomas. Chin Med J (Engl).
125:450–454. 2012.PubMed/NCBI
|
|
22.
|
Perry JE, Grossmann ME and Tindall DJ:
Epidermal growth factor induces cyclin D1 in a human prostate
cancer cell line. Prostate. 35:117–124. 1998. View Article : Google Scholar : PubMed/NCBI
|
|
23.
|
Kitadai Y, Onogawa S, Kuwai T, et al:
Angiogenic switch occurs during the precancerous stage of human
esophageal squamous cell carcinoma. Oncol Rep. 11:315–319.
2004.PubMed/NCBI
|
|
24.
|
Zhang Y, Liao JM, Zeng SX and Lu H: p53
downregulates Down syndrome-associated DYRK1A through miR-1246.
EMBO Rep. 12:811–817. 2011. View Article : Google Scholar : PubMed/NCBI
|
|
25.
|
Colquhoun AJ, Venier NA, Vandersluis AD,
et al: Metformin enhances the antiproliferative and apoptotic
effect of bicalutamide in prostate cancer. Prostate Cancer
Prostatic Dis. May 22–2012.(Epub ahead of print).
|