Introduction
Recent years have seen an increased incidence of
oral squamous cell carcinoma (OSCC) cases in Japan, coinciding with
population aging. OSCC accounts for 1–2% of all cancers, and
approximately 40% of head and neck cancers. The ratio between men
and women for OSCC is 3:2. Globally, the prevalence of OSCC is high
in nations with high levels of alcohol and tobacco use (1–3).
Pathologically, 80% of oral cancers are squamous cell carcinoma
(4,5).
Like many other cancers, the occurrence of OSCC is
thought to be intricately associated with both genetic and
environmental factors. As the entry of the gastrointestinal system,
the oral cavity is exposed to various environmental insults such as
chemical stimuli from alcohol and tobacco (6,7),
food, and physical stimuli from dental caries and faulty dental
prostheses. All such insults are considered carcinogenic risk
factors for the oral mucosal membranes (8–11).
A review of chromosomal aberrations in oral or head
and neck squamous cell carcinoma concluded that the most
significant findings are chromosomal changes, suggesting the
involvement of tumor suppressor genes (TSGs) (12). In studying the relationship between
OSCC metastasis and chromosomal aberration, we found frequent
deletion of a probe on chromosome 3 by array-based comparative
genomic hybridization (CGH) analysis of OSCC tissues. The deletion
was not related to metastasis (13). The present study further examined
how the identified chromosomal deletion relates to OSCC.
Materials and methods
Samples
Twenty tumor tissue samples were used for extraction
of DNA for array-based CGH analysis and also for real-time PCR. DNA
for real-time PCR was also collected from another 11 tumor tissues,
31 marginal tissues around the tumors, and 31 peripheral blood
samples from healthy volunteers. A total of 54 and 60 peripheral
blood samples were further obtained from different OSCC patients
and healthy volunteers, respectively. All OSCC patients underwent
surgical resection at Tokyo Dental College, Chiba, Japan, between
April 2007 and July 2010. Healthy volunteers were selected from
workers at the same college. Written informed consent was obtained
from all participants in accordance with the Ethical Guidelines on
the Use of Human Tissues. The Ethics Committee of Tokyo Dental
College approved the study (approval no. 205). The 54 OSCC patients
were aged from 43 to 89 years, and the 60 healthy volunteers were
aged from 24 to 48 years. Table I
summarizes the clinical characteristics of the study
participants.
 | Table I.Clinical characteristics of OSCC
patients and healthy volunteers. |
Table I.
Clinical characteristics of OSCC
patients and healthy volunteers.
| OSCC patients
(n=54) |
|
| Age (years; means ±
SD) | 66±11.67 |
| Gender | |
| Male | 27 |
| Female | 27 |
| Tobacco
consumption | |
| Negative | 22 |
| Positive | 32 |
| Alcohol
consumption | |
| Negative | 32 |
| Positive | 22 |
| Site | |
| Tongue | 28 |
| Gingiva | 16 |
| Palate | 1 |
| Buccal mucosa | 5 |
| Oral floor | 4 |
| T classification | |
| T1 | 18 |
| T2 | 23 |
| T3 | 5 |
| T4 | 8 |
| Stage
classification | |
| I | 16 |
| II | 16 |
| III | 9 |
| IV | 13 |
|
| Healthy volunteers
(n=60) |
|
| Age (years; means ±
SD) | 29±4.57 |
| Gender | |
| Male | 46 |
| Female | 14 |
| Tobacco
consumption | |
| Negative | 41 |
| Positive | 19 |
| Alcohol
consumption | |
| Negative | 1 |
| Positive | 59 |
DNA extraction
Sample for DNA extraction were stored at −20°C until
use. Genomic DNA was extracted from peripheral blood using a QIAamp
DNA blood midi kit (Qiagen, Valencia, CA) and from tissues using a
QIAamp DNA Maxi kit (Qiagen) according to the instructions supplied
by the manufacturer. The DNA was quantified using a Nano
drop® (ND-1000 Spectrophotometer, Thermo Fisher
Scientific, Waltham, MA).
Array-based CGH analysis
Array-based CGH analysis was performed on primary
tumor tissues using a Human Genome CGH Microarray Kit 44K (Agilent
Technologies, Santa Clara, CA), containing in
situ-synthesized 60-mer oligonucleotides representing 42,494
unique probes for human genes. Labeling and hybridization were
performed essentially as described previously with the following
modifications. We amplified 100 ng each of reference (male or
female human genomic DNA; Promega, Madison, WI) and tumor DNA with
Phi29 DNA polymerase according to the protocols provided by the
supplier (Qiagen). DNA was then digested with AluI (50
units) and RsaI (50 units; Promega) for 2 h at 37°C. Digests
were filtered using the QIAprep Spin Miniprep kit (Qiagen) and then
verified on a Bioanalyzer (Agilent Technologies). Fluorescent
labeling reactions to make hybridization probes were performed with
7 μg of purified restricted DNA using a BioPrime array-based
CGH genomic labeling kit (Invitrogen), according to the
instructions provided by the manufacturer, in a volume of 50
μl with a modified dUTP pool containing 120 μM each
of dATP, dGTP, and dCTP; 60 μM dTTP; and 60 μM
Cy5-dUTP or Cy3-dUTP (Perkin-Elmer, Waltham, MA). Labeled reference
and tumor DNA probes were subsequently mixed and filtered through a
Microcon YM-30 column (Millipore, Billerica, MA) then verified on a
Bioanalyzer (Agilent Technologies). To the mixtures were added 50
μg of Human Cot-1 DNA (Invitrogen)/Agilent 10X Blocking
Agent/Agilent 2 Hybridization Buffer. Before hybridization to the
array, the hybridization mixtures were denatured at 95°C for 3 min,
and then incubated at 37°C for 30 min. The mixtures were
centrifuged at 17,900 × g for 1 min to remove any precipitate, and
then applied to the array using an Agilent microarray hybridization
chamber. Hybridization was carried out for 40 h at 65°C in a
rotating oven (Robbins Scientific, Mountain View, CA) at 20 rpm.
The arrays were then disassembled in 0.5X SSC/0.005% Triton X-102
at room temperature, washed for 5 min at room temperature in wash
1, and then incubated for 1 min at 37°C in 0.1X SSC/0.005% Triton
X-102 (wash 2). Slides were dried and scanned using an Agilent
G2565B DNA microarray scanner (14,15).
Real-time PCR
Real-time PCR was performed using tumor, marginal
tissue, and blood samples with SYBR Green I fluorescence detection
on a Light Cycler 480 (Roche Diagnostics, Basel, Switzerland).
Oligonucleotide primers for real-time PCR were designed using
Primer software (Whitehead Institute for Biomedical Research), and
uniqueness in the human genome was checked by a BLAST search.
Nucleotide sequences of oligonucleotide primers were: F,
5′-CGGGGAGTTTGATTTTCACT-3′ and R, 5′-CGCTGTATGGTTGTCTTGTTG-3′. The
20-μl reaction mixture consisted of 10 μl 2X IQ SYBR
Green Supermix (Bio-Rad Laboratories, Hercules, CA), 2.5 ng genomic
DNA, and 800 nM of each PCR primer. The reaction mixtures were
heated at 95°C for 10 min and then subjected to 40 rounds of
two-step temperature cycling (95°C for 15 sec and 65°C for 60 sec)
(16). The crossing point for each
amplification curve was determined by the second derivative maximum
method. The standard curve method using separate reaction wells was
applied for relative quantification. We used NAGK (N-acetyl
glucosamine kinase, NAGK) as internal reference loci (17).
Detection method for comparison and
typing of polymorphic regions
Table II details
the PCR primer sequences used for amplifying the regions around the
hybridized probe sequence by array-based CGH and the PCR target
sequences. PCR amplification was performed in a 30-μl
mixture containing 10 ng genomic DNA, 10 mM Tris-HCl at pH 8.3, 50
mM KCl, 2.5 mM MgCl2, 0.02% gelatin, 200 μM dNTP,
400 nM of each primer, and 1.25 U AmpliTaq Gold (Applied
Biosystems). A two-step PCR amplification process was used: 95°C
for 11 min, followed by 28 cycles of denaturation at 95°C for 40
sec, and annealing and extension at 59°C for 105 sec. After the
28th cycles, a final extension step was performed at an
annealing/extension temperature at 60°C for 10 min. PCR products
were separated on 8% polyacrylamide gels, and all products were
visualized by silver staining (18).
| Table II.Gene polymorphism at chromosome 3q26.1
between healthy volunteers and OSCC patients by real-time PCR. |
Table II.
Gene polymorphism at chromosome 3q26.1
between healthy volunteers and OSCC patients by real-time PCR.
| Healthy
volunteers | OSCC patients | P-value |
|---|
| Normal | 27 | 10 | <0.05 |
| Loss | 4 | 21 | |
Sequence analysis
PCR for sequencing was performed using the BigDye™
Terminator v1.1 Cycle Sequencing Ready Reaction Kit (Applied
Biosystems), and the products were purified using a PCR
purification kit (Invitrogen). Excess dye was removed using
Performa DTR gel filtration cartridges (EdgeBio, www.edgebio.com). Sequence analysis was performed on
an ABI 3100 DNA sequencer.
Statistical analysis
The χ2 test was used for comparisons
between the presence and absence of deleted regions, using a 2×2
contingency table. The homogeneity test for gene frequencies was
performed according to Samaneh et al(2010)(19).
Results
Array-based CGH analysis
The array-based CGH analysis was performed on 20
OSCC tumor tissue samples using Feature Extraction software
(version 8.5.1.1, Agilent Technologies) and the linear
normalization method for background subtraction. Datasets created
from the dye-swap experiments were averaged and then further
analyzed using CGH Analytics software (version 3.4, Agilent
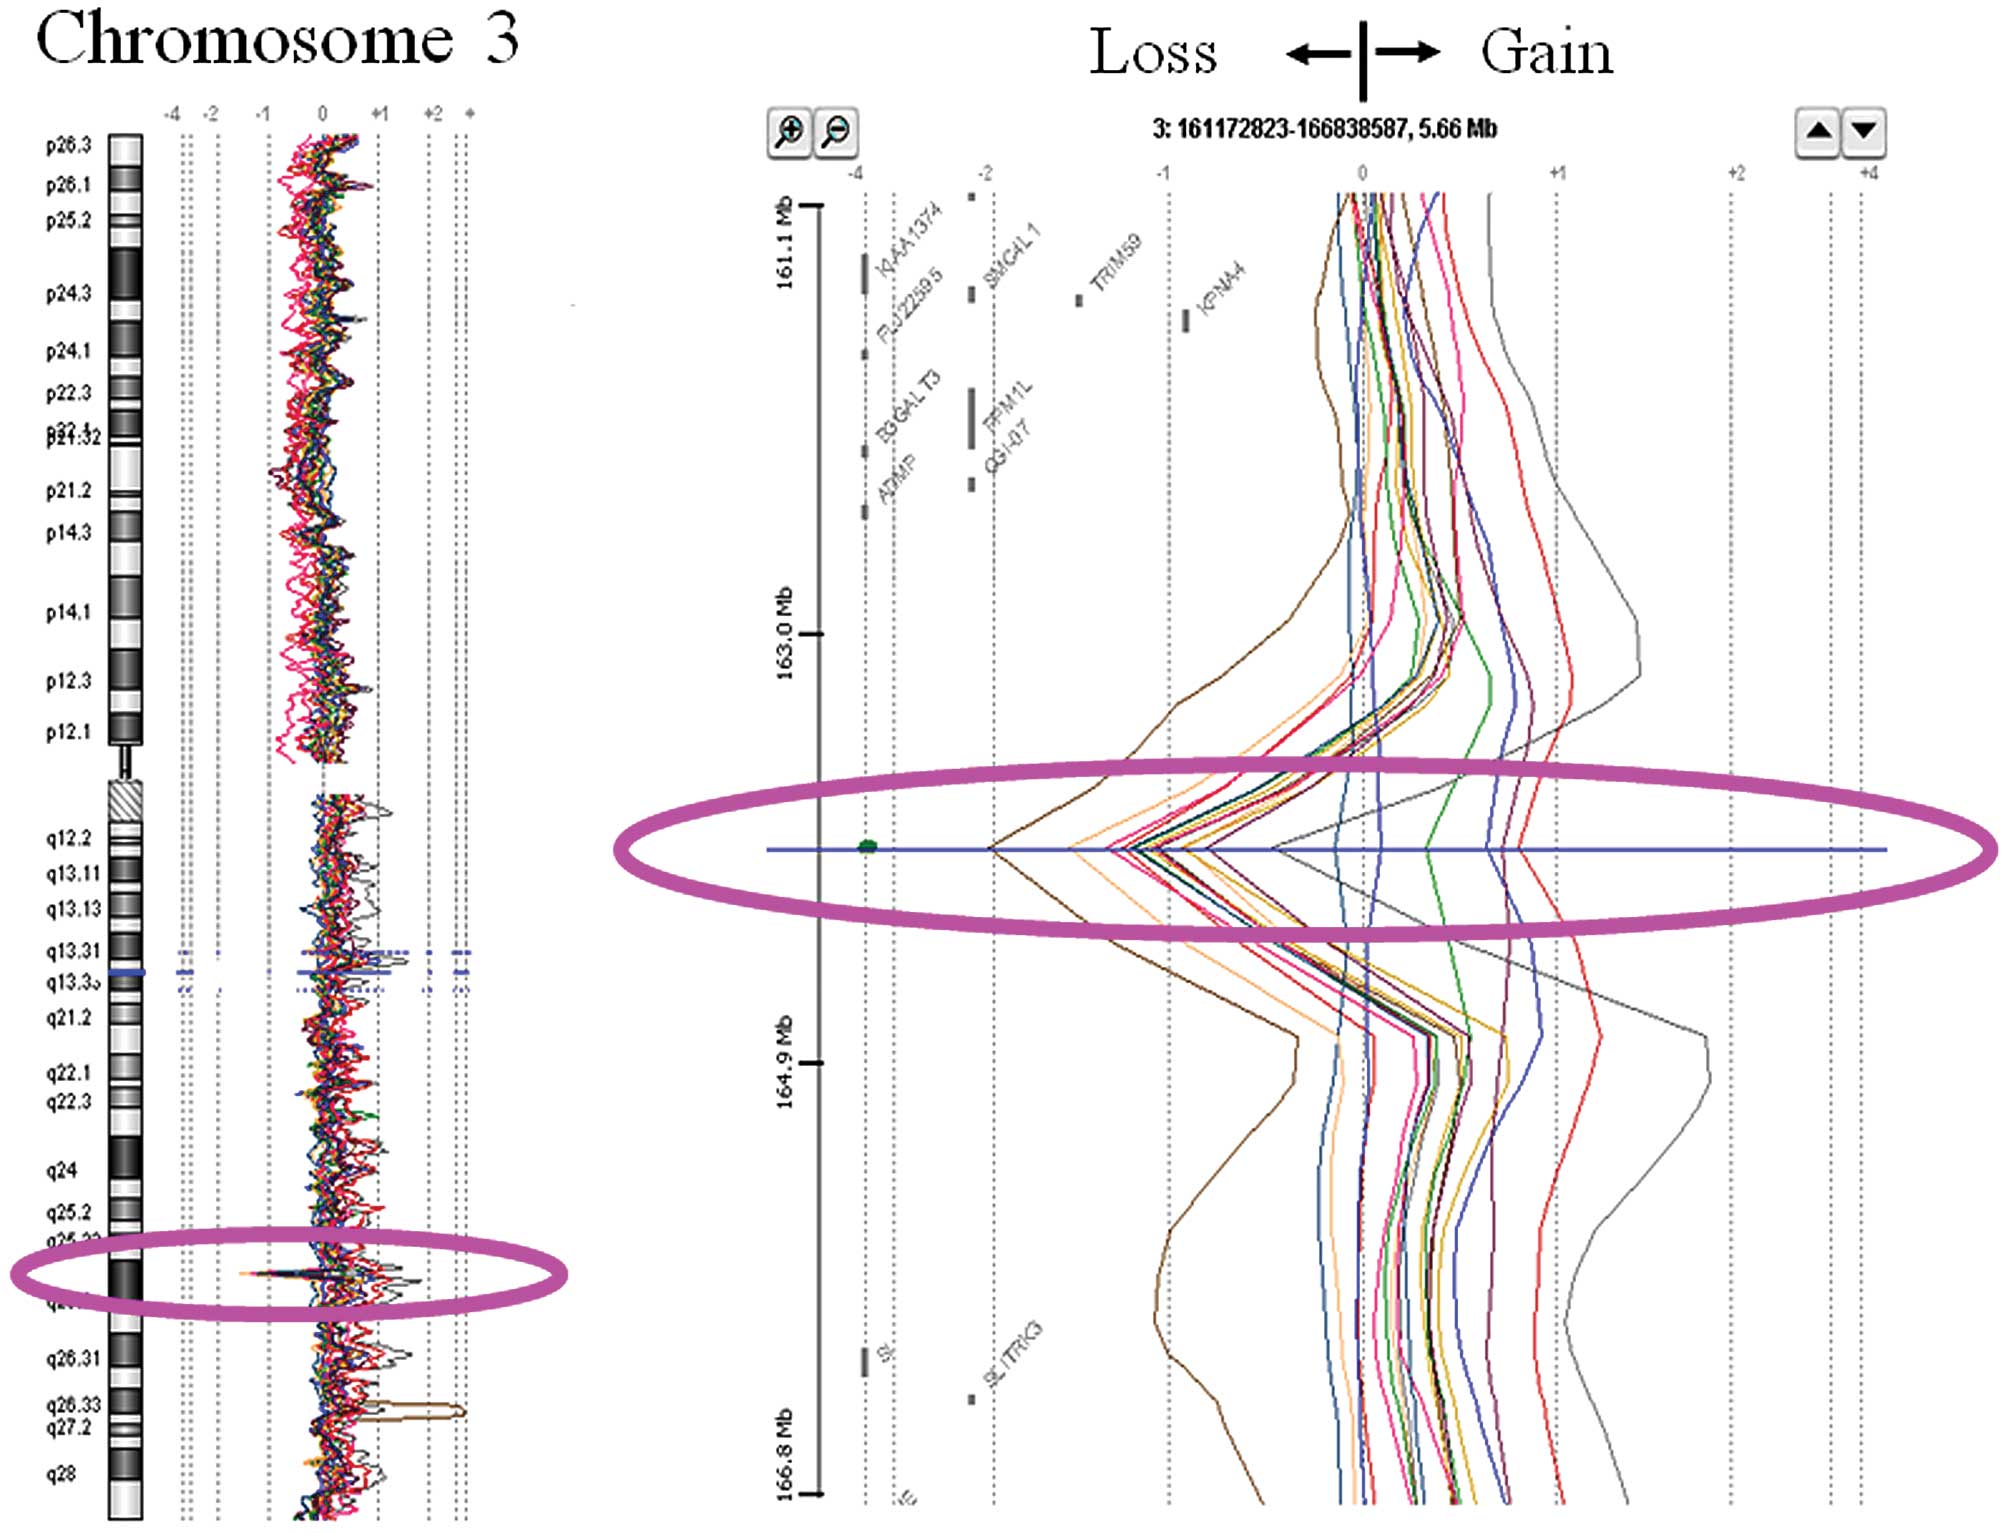
Technologies). Although we were originally investigating the
relationship between metastasis and chromosomal aberration, a
frequent deletion on chromosome 3 showing up on the array-based CGH
analysis was not associated with any clinical features of
metastasis (13). This deletion
was found in 70% (14/20) of DNA extracts from OSCC tissues samples
on the long arm of chromosome 3 (Fig.
1). Detailed analysis mapped the region to chromosome 3q26.1.
Because the deletion frequency was so high in OSCC tissues, we next
studied its relationship to other clinical features.
Examination of the deleted region by
real-time PCR
We next applied real-time PCR to further study the
deleted region at chromosome 3q26.1 identified by array-based CGH
(array-based CGH probe sequence = 3q26.1-pro-seq). Real-time PCR
primers were initially constructed to amplify the probe region,
5′-flanking region, and 3′-flanking region of the probe. However,
because the most similar results to those on array-based CGH
analysis were obtained using primers for the 5′-flanking region, we
used these primers for further studies. DNA samples were isolated
from another 11 OSCC tissues and from marginal tissues around the
tumor in the 31 OSCC patients. When real-time PCR was conducted for
DNA isolated from tumor and marginal tissues, the same tendency for
quantification was obtained from both sample types. Assuming that
marginal tissues contained mainly normal tissue, the real-time PCR
suggested that the deletion of 3q26.1-pro-seq is not due to
chromosomal aberration resulting from carcinogenesis, but instead
occurs through inherent genetic variation.
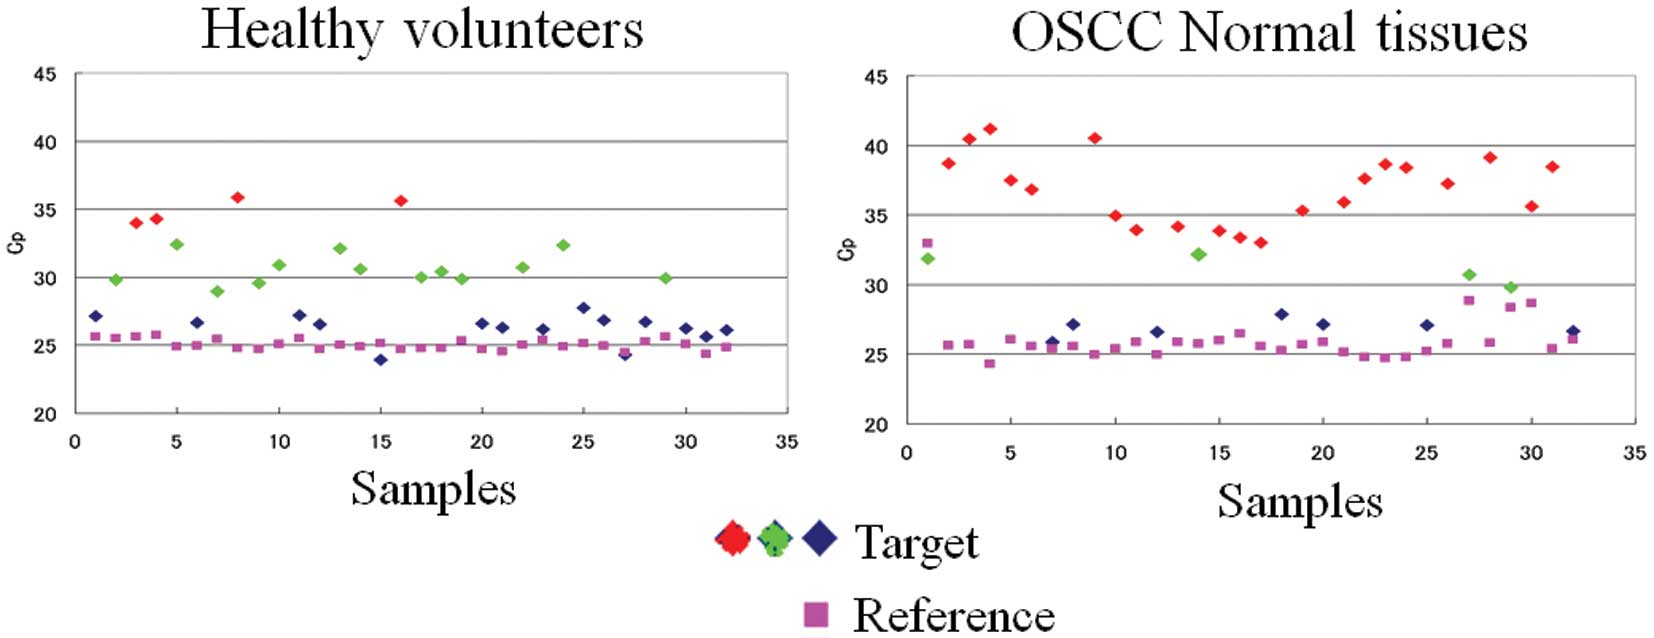
To explore if the deletion around 3q26.1-pro-seq is
genetically restricted to OSCC patients, we collected DNA samples
from 31 healthy volunteers as controls and performed real-time PCR
for the 5′-flanking region of 3q26.1-pro-seq (Fig. 2). If the deletion was indeed
genetic variation, the real-time PCR results must be classified
into three types: complete deletion, hemizygote, and non-deletion
homozygote. Although the distribution of Cp values could not be
clearly divided, we classified them into three groups using
tentative threshold values. The average Cp values for these groups
were 26.5±2, 30.5±2, and 34.5±2, respectively. The first type
corresponded to homozygotes for 3q26.1-pro-seq (+), the second type
to heterozygotes for 3q26.1-pro-seq, and the third type to
3q26.1-pro-seq (−) homozygotes. Because the boundary lines of these
values were not clear-cut, we classified them into
3q26.1-pro-seq-positive type (+) (non-deletion homozygote and
heterozygote) and 3q26.1-pro-seq-loss type (−), to compare
frequencies between healthy and OSCC patient groups by the
χ2 test (Table II). A
statistically significant difference was observed regarding
presence and loss of 3q26.1-pro-seq between the OSCC patients and
healthy volunteers (P=8.1×E−06; Table II). Loss of 3q26.1-pro-seq was more
common in OSCC patients.
Detection and evaluation of genetic
variation
Although significant association was observed in the
distribution of 3q26.1-pro-seq-positive and -negative individuals,
the total number of samples was small (31 per group). In addition,
the real-time PCR typing results were ambiguous because the
boundaries between genotypes were unclear. We therefore sought to
establish reliable typing methods and increase the number of
samples to confirm if the suspected association was conserved in
new population samples.
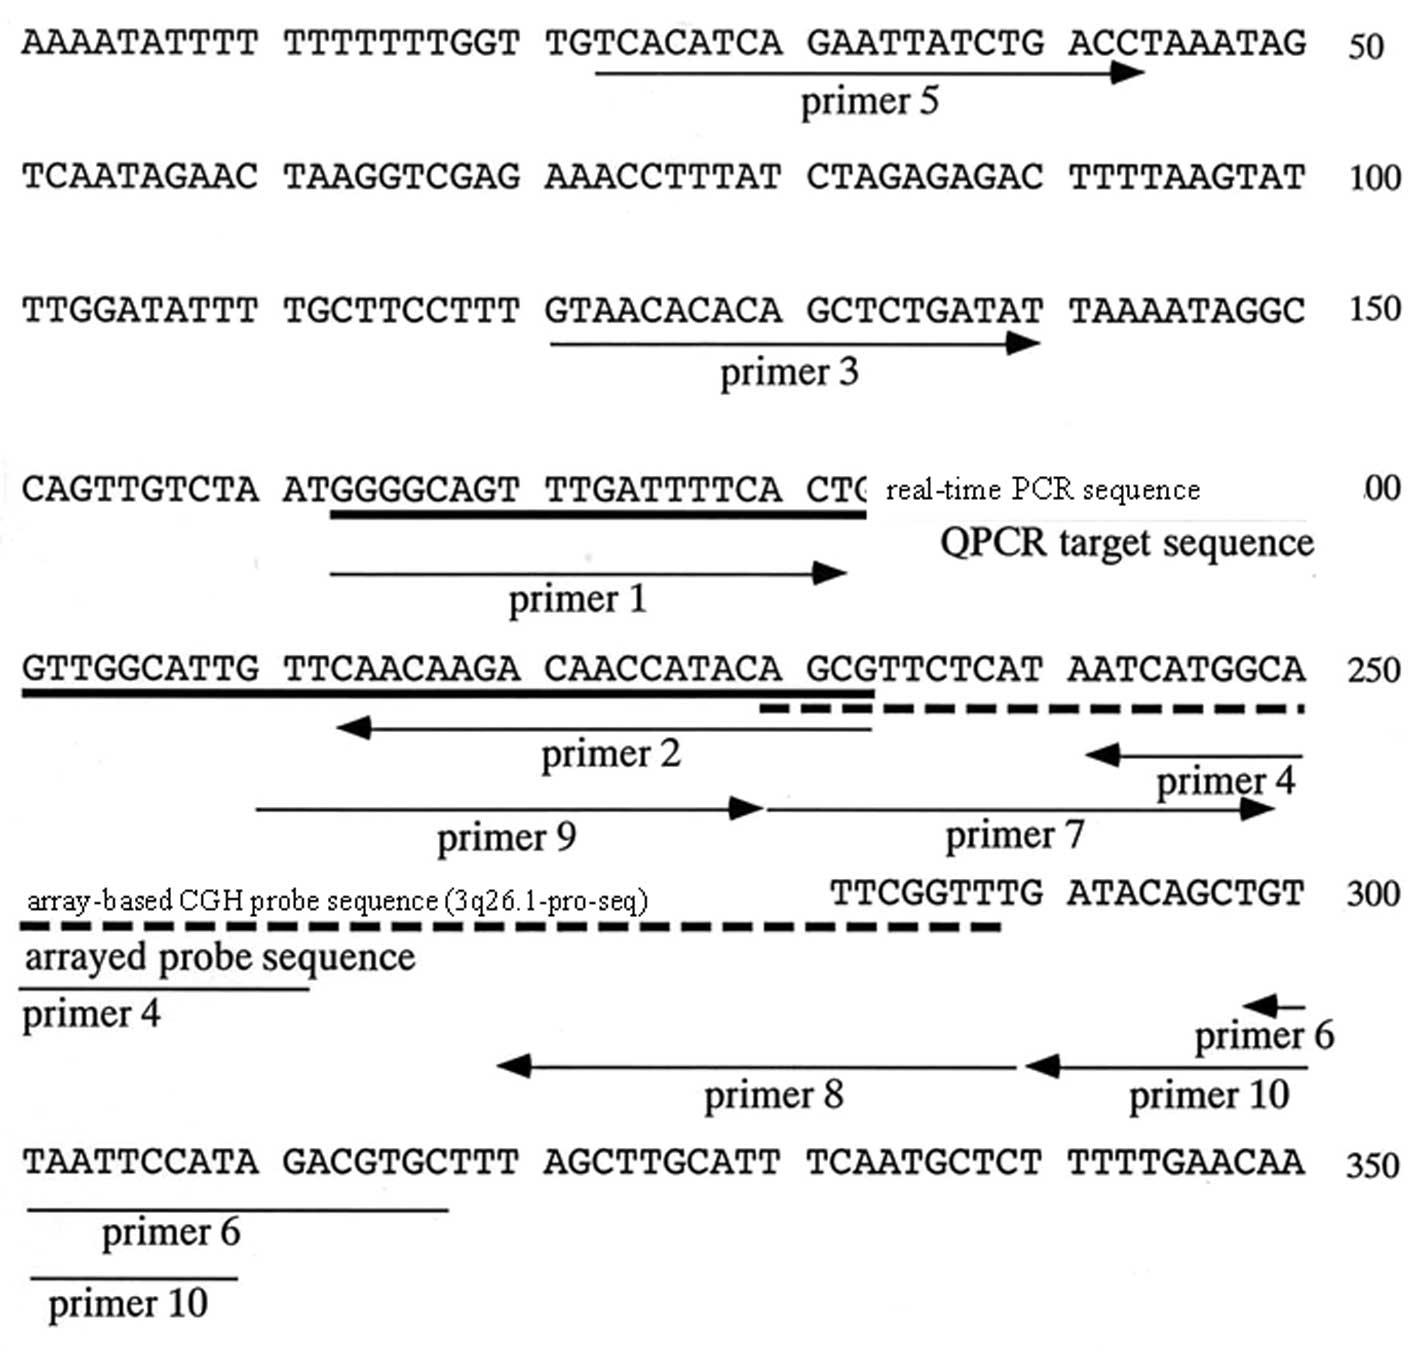
We first compared the presence and absence of the
3q26.1-pro-seq sequence using simple PCR amplification followed by
native polyacrylamide gel electrophoresis (Fig. 3). First, we constructed primers
(Fig. 3, primer 3–4) to amplify
the fragment (141-bp fragment) that included the target region for
real-time PCR (71-bp fragment amplifiable by primer 1 and 2)
(Fig. 3). When a 141-bp fragment
was amplified by PCR in 35 cycles of amplification including 2.5 U
of AmpliTaq Gold, strong positive bands or faint bands
corresponding to the same migration position as the target PCR
product appeared in many samples, and negative samples were rare.
Sequencing of the faint band and the intensified band determined
that the amplified fragments were identical. National Center for
Biotechnology Information (NCBI) blast searching using primers 3
and 4 revealed no similar sequences to the 141-bp fragment on
chromosome 3. This suggested that the faint band was not amplified
from different similar sequences in the genome, and contamination
with foreign DNA occurred in the course of DNA collection and
experiments. All reagents used for the PCR amplification were
subsequently replaced to identify the possible source of
contamination. Indeed, we employed a different company to
synthesize the oligonucleotide primers used to amplify the 141-bp
products. However, similar results were obtained, suggesting that
the contamination did not occur during PCR amplification.
Next, we constructed primers to amplify a large
fragment (294-bp) including the 141-bp fragment and 3q26.1-pro-seq
to ascertain whether the unstable amplification among samples was
due to sequence heterogeneity around the 141-bp fragment (Fig. 3). PCR amplification was then
performed using three different sets of primers that each amplified
the 141-bp fragment, the real-time PCR fragment (designated as a
71-bp fragment amplified by primer 1–2 in the following
explanation), and the 294-bp fragment (Fig. 3 and Table III). The amplified products were
not always present depending on the samples examined. Therefore, we
could not determine a reliable sample genotype at this stage.
| Table III.Oligonucleotide sequences used for
PCR. |
Table III.
Oligonucleotide sequences used for
PCR.
| Primer name | Type | Oligonucleotide
sequence |
|---|
| 1 | Forward |
5′-CGGGGAGTTTGATTTTCACT-3′ |
| 2 | Reverse |
5′-CGCTGTATGGTTGTCTTGTTG-3′ |
| 3 | Forward |
5′-GTAACACACAGCTCTGATAT-3′ |
| 4 | Reverse |
5′-GCCACTATAAATGCCATGAT-3′ |
| 5 | Forward |
5′-TCACATCAGAATTATCTGACC-3′ |
| 6 | Reverse |
5′-CACGTCTATGGAATTAACA-3′ |
| 7 | Forward |
5′-AGCGTTCTCATAATCATGGC-3′ |
| 8 | Reverse |
5′-AAACCGAAGTTAAGGAAAGT-3′ |
| 9 | Forward |
5′-GTTCAACAAGACAACCATAC-3′ |
| 10 | Reverse |
5′-ATGGAATTAACAGCTGTATC-3′ |
To solve this problem, we constructed two further
primers; one to amplify the 3q26.1-pro-seq (60-bp fragment
amplified by primer 7–8; Fig. 3
and Table III) and the other to
cover the 3q26.1-pro-seq region (108-bp amplified by primer 9–10;
Fig. 3 and Table III). These two primers were also
used for typing together with the three previous primer pairs. In
short, five kinds of PCR amplification, all producing the 141-,
71-, 294-, 60-, and 108-bp fragment, were performed for each sample
to compare presence and absence of the PCR product. Again, the
samples were heterogeneous with respect to the five fragments
always being present, and amplification efficiency of the five
fragments continued to vary among samples. We therefore arranged
the method of PCR amplification as shown in Materials and methods;
such that the number of PCR amplification cycles, volumes of Taq
polymerase, and primer concentrations were decreased. This change
in PCR conditions decreased the number of faint bands after
amplification, and increased the reproducibility of amplification
efficiency from the same samples. Intensity of the positive
amplification products became similar among positive samples, and
delicate faint bands decreased considerably in negative-like
samples. This PCR amplification protocol was subsequently used to
type new random samples.
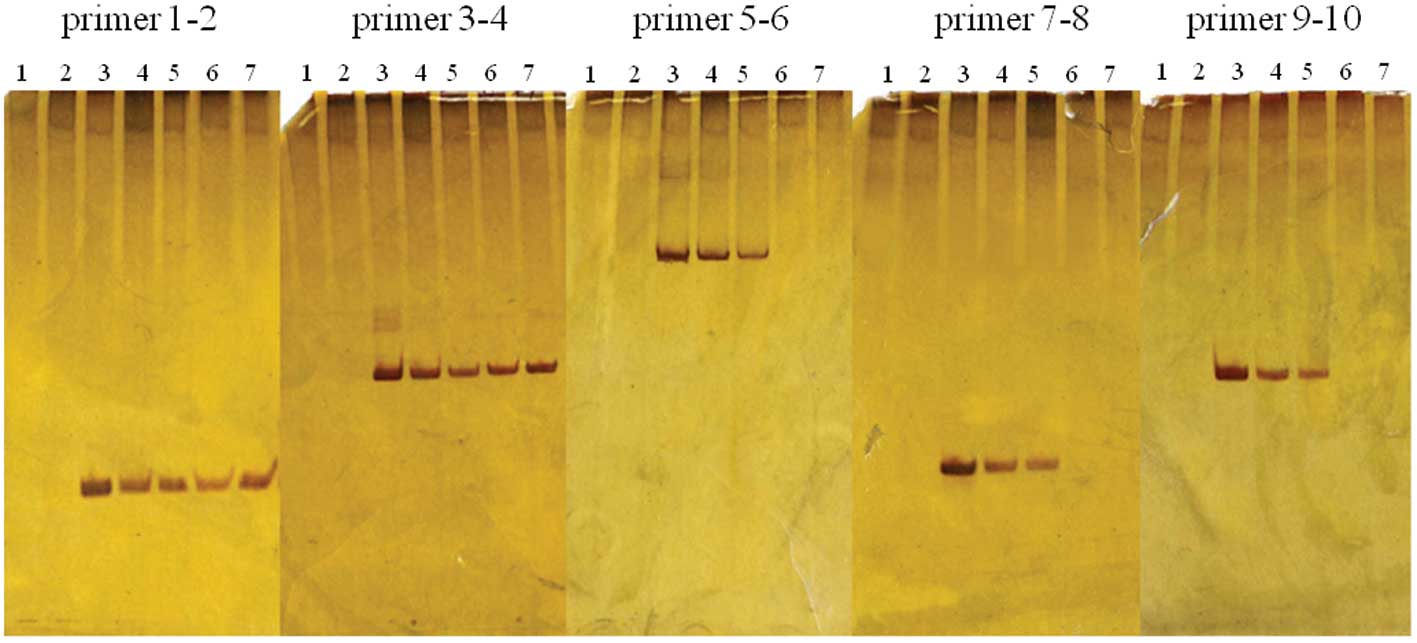
We then typed 60 healthy volunteers and 54 OSCC
patients. Final typing for positive (+) or negative (−) was
determined by the presence or absence, respectively, of a distinct
band. When a faint band was observed, PCR amplification was
performed two more times to determine if the same result could be
obtained. When a faint band was reproduced three times, we
considered the sample as positive (+), but marked that the band
intensity was weak. When the faint band was not reproducible, it
was described as such. The results of typing are shown in Fig. 4 and Table IV. Identical results were obtained
with the five different PCR products in most subjects (89% of 114
subjects). However, 6 samples from each group (healthy individuals
and OSCC patients) showed variation among the different PCR
products. They were (+) for a 71-bp product (produced by primer
1–2) and the 141-bp product (produced by primer 3–4), but (−) for
the 294-, 60-, and 108-bp products (produced by 5–6, 7–8, and 9–10,
respectively) (Table II). Among
these samples, 2 out of 6 (−) samples in the OSCC patient group
showed amplification of 71- and 108-bp products as faint bands in
the three PCR trials. Finally, the 12 variable samples were further
amplified using three primer pairs, 1–4, 1–8, or 1–10. All but one
of the samples was (+) for the products amplified by primer pair
1–4, but negative for those by primer pairs 1–8 and 1–10. The
exception was obtained from an OSCC patient, who was (−) for all
primer pairs (Table IV).
| Table IV.Results of different sized PCR
products. |
Table IV.
Results of different sized PCR
products.
| Amplified product
size (bp) | 71 | 141 | 294 | 60 | 108 | |
|---|
| Combination of
primer no. | 1–2 | 3–4 | 5–6 | 7–8 | 9–10 | No. of samples |
|---|
| Healthy
subject | (+) | (+) | (+) | (+) | (+) | 30 |
| (+) | (+) | (−) | (−) | (−) | 6 |
| (−) | (−) | (−) | (−) | (−) | 24 |
| OSCC subject | (+) | (+) | (+) | (+) | (+) | 13 |
| (+) | (+) | (−) | (−) | (−) | 6a |
| (−) | (−) | (−) | (−) | (−) | 35 |
Comparison of gene frequencies between
healthy volunteers and OSCC patients
As mentioned above, typing of each individual was
different depending on the primers used. Because this variability
could be due to genetic polymorphism, gene frequency was estimated
in the healthy individuals and OSCC patients. Different genes were
hypothesized depending on the size of fragments. The gene
frequencies were estimated by the presence and absence of the 71-bp
fragment produced by primer pair 1–2 and the 108-bp fragment
produced by primer pair 9–10. Because we could not discriminate
homozygote and heterozygote by the present method, we regarded (+)
individuals as a dominant type composed of homozygote (+)/(+) and
heterozygote (+)/(−) types, and (−) individuals as a recessive
genotype composed of negative homozygotes (−)/(−).
Gene frequencies for the 71-bp fragment were
0.368±0.050 and 0.632±0.050 for the 71-bp (+) and (−) genes,
respectively, in the healthy population, with 0.195±0.052 and
0.805±0.052 calculated as the frequencies of the 71-bp (+) and (−)
genes, respectively, in the OSCC patient population. This
difference in gene frequencies between healthy and OSCC patient
populations was significant (χ2=8.449, df=1,
0.01<P<0.001).
Gene frequencies for the 108-bp fragment were
0.293±0.046 and 0.707±0.046 for the 108-bp (+) and (−) genes,
respectively, in the healthy population, with 0.129±0.033 and
0.871±0.033 for the 108-bp (+) and (−) genes, respectively, in the
OSCC patient population; also a significant difference
(χ2=9.209, df=1, 0.01<P<0.001). These results
suggested that genetic variation of a region at chromosome 3q26.1
is associated with OSCC, and absence of this region was more common
in OSCC patients.
Discussion
In the present study, we used a simple method for
PCR amplification and detection by native gel electrophoresis to
detect genetic variation of the polymorphic region found previously
on chromosome 3q26.1 (3q26.1-pro-seq) in OSCC samples. To confirm
the presence or absence of the region by PCR, we designed primers
to amplify larger fragments containing the region identified by
real-time PCR. We expected apparent variation in the presence or
absence of amplified products irrespective of the difference in the
positive homozygote or hemizygote pattern. However, amplification
was not stable even between replicates of the same samples. We
first suspected contamination occurring during the PCR
amplification or genomic DNA isolation steps, and took steps to
eliminate this possibility. We changed all reagents used for PCR
amplification, conducted dual PCR of the blind PCR products, and
synthesized new primers at a different company. However,
contamination was suspected only in the process of dual PCR
amplification of control water solution in some experiments. In
these cases, contamination was not detected in the first PCR
amplification. We then isolated DNA from selected subjects by the
classical method of ethanol precipitation to test for contamination
with foreign DNA, but comparison of PCR amplification profiles for
the 141-bp fragment showed no difference between samples isolated
by the two procedures. We concluded that contamination was not
responsible for the variable amplification of faint bands in the
present study.
We therefore decided to control the method of PCR
amplification to avoid excessive amplification of the PCR products.
Although approximately 90% of the samples showed clear-cut results
concerning presence or absence of the five different-sized PCR
products among samples from the same subjects, approximately 10% of
the subjects showed different PCR amplification profiles depending
on the primer pairs used for amplification. Faint and unstable PCR
products are amplified when highly degraded or small amounts of DNA
are used as templates for PCR amplification in common forensic
cases or when primer sequences do not match sufficiently. We
therefore concluded that in some of the deletion genotypes,
breakage points might exist near the 3q26.1-pro-seq, with the most
possible region covered by primer 4–10. In addition, breakage
points may not always be identical among individuals, because
amplification efficiencies differ among primer pairs. Based on
these observations, we finally selected two regions (71-bp fragment
amplified by primer pair 1–2 and 108-bp fragment amplified by
primer pair 9–10) to determine presence or absence of the defect
region in this study.
Significant differences were observed in the
frequencies of polymorphism of the region around the 3q26.1-pro-seq
between the healthy volunteers and OSCC patients, suggesting that a
deletion polymorphism in this region (chromosome 3q26.1) could be
associated with occurrence of OSCC. We also tested the association
between presence and absence of the amplified products and clinical
characteristics of OSCC patients. However, no statistically
significant association was observed.
The 3q26.1 region was previously reported to harbor
colorectal cancer susceptibility loci in earlier studies, but no
candidate gene was identified. This region contains an element that
regulates the expression of an upstream candidate tumor suppressor,
PPM1L, thus providing a novel mechanism for colorectal
tumorigenesis in APC mutation-negative familial colorectal cancer
(20). Searches for a possible
gene around the present deleted region using genome browser did not
hit any candidates, and thus because there are reported defects
around chromosome 3q26.1 in cancer patients, we cannot validate
this association with OSCC in the present study due to insufficient
patient numbers. Further studies involving large-scale sample
collection and analysis are necessary to determine the reliability
of our suggested association. The range of the deleted region
should also be defined further to identify potential genes known to
affect the development of OSCC.
Acknowledgements
This study was supported by the grant
from Training program for Oncology Professionals in 9
Universities.
References
|
1.
|
Ming Y, Qin X, Ping Z, et al: Correlation
of NF-kappaB signal pathway with tumor metastasis of human head and
neck squamous cell carcinoma. BMC Cancer. 10:4372010. View Article : Google Scholar : PubMed/NCBI
|
|
2.
|
Zygogianni AG, Kyrgias G, Karakitsos P, et
al: Oral squamous cell cancer: early detection and the role of
alcohol and smoking. Head Neck Oncol. 3:22011. View Article : Google Scholar : PubMed/NCBI
|
|
3.
|
Krolls SO and Hoffman S: Squamous cell
carcinoma of oral soft tissues: a statistic analysis of 14, 253
cases by age, sex, and race of patients. J Am Dent Assoc.
92:571–574. 1976. View Article : Google Scholar : PubMed/NCBI
|
|
4.
|
Blot WJ and McLaughlin JK: Smoking and
drinking in relation to oral and pharyngeal cancer. Cancer Res.
48:3282–3287. 1988.PubMed/NCBI
|
|
5.
|
Gupta PC, Mehta FS, Daftary DK, et al:
Incidence rates of oral cancer and natural history of oral
precancerous lesions in 10-year follow-up study of Indian
villagers. Community Dent Oral Epidemiol. 8:283–333.
1980.PubMed/NCBI
|
|
6.
|
Petti S and Scully C: Oral cancer: the
association between nation-based alcohol-drinking profiles and oral
cancer mortality. Oral Oncol. 41:828–834. 2005. View Article : Google Scholar : PubMed/NCBI
|
|
7.
|
Sankaranarayanan R and Ramadas K: Effect
of screening on oral cancer mortality in Kerala, India; a
cluster-randomized controlled trial. Lancet. 365:1927–1933. 2005.
View Article : Google Scholar : PubMed/NCBI
|
|
8.
|
Khanna JN and Andre NN: Oral sub mucosal
fibrosis: a new concept in management. Report of 100 cases. Int J
Oral Maxillofac Surg. 24:433–439. 1995. View Article : Google Scholar
|
|
9.
|
Tanaka S and Sobue T: Comparison of oral
and pharyngeal cancer mortality in five countries: France, Italy,
Japan, UK and USA from the WHO mortality database (1960–2000). Jpn
J Clin Oncol. 35:488–491. 2005.PubMed/NCBI
|
|
10.
|
Tezal M, Sullivan MA, Hyland A, et al:
Chronic periodontitis and the incidence of head and neck squamous
cell carcinoma. Cancer Epidemiol Biomarkers Prev. 18:2406–2412.
2009. View Article : Google Scholar : PubMed/NCBI
|
|
11.
|
Toshinori O, Mikiko S and Sadahiko I:
Characterization of CIAS1-VNTR polymorphism associated with
essential hypertension. J Jpn Soc DNA Polymorph Res. 16:179–182.
2008.
|
|
12.
|
Scully C, Field JK and Tanzawa H: Genetic
aberrations in oral or head and neck squamous cell carcinoma
(SCCHN): 1. Carcinogen metabolism, DNA repair and cell cycle
control. Oral Oncol. 36:256–263. 2000. View Article : Google Scholar : PubMed/NCBI
|
|
13.
|
Sugahara K, Michikawa Y, Ishikawa K, et
al: Combination effects of distinct cores in 11q13 amplification
region on cervical lymph node metastasis of oral squamous cell
carcinoma. Int J Oncol. 39:761–769. 2011.PubMed/NCBI
|
|
14.
|
Chiaki Y, Kana T, Tsunenori T, et al:
Examination of PCR protocol and utility of various body parts as a
sample for sex identification in captive and wild birds. Jpn J Zoo
Wildl Med. 11:43–48. 2006.
|
|
15.
|
Trolet J, Hupé P, Huon I, et al: Genomic
profiling and identification of high-risk uveal melanoma by array
CGH analysis of primary tumors and liver metastases. Invest
Ophthalmol Vis Sci. 50:2572–2580. 2009. View Article : Google Scholar : PubMed/NCBI
|
|
16.
|
Weksberg R, Stachon AC, Squire JA, et al:
Molecular characterization of deletion breakpoints in adults with
22q11 deletion syndrome. Hum Genet. 120:837–845. 2007. View Article : Google Scholar : PubMed/NCBI
|
|
17.
|
Takahiro G, Hajime H, Tomoko I, et al:
Prediction of MYCN amplification in neuroblastoma using serum DNA
and real-time quantitative polymerase chain reaction. J Clin Oncol.
23:5205–5210. 2005. View Article : Google Scholar : PubMed/NCBI
|
|
18.
|
Shinji U and Masahiro W: Activation of
K-ras gene and allelic deletions on chromosome 17p and 18q
carcinoma of the colon and rectum. Med J Kinki Univ. 17:237–248.
1992.
|
|
19.
|
Samaneh B, Hamid R, Kamran G, et al:
Soluble Fas might serve as a diagnostic tool for gastric
adenocarcinoma. BMC Cancer. 275:102010.PubMed/NCBI
|
|
20.
|
Thean LF, Loi C, Ho KS, et al: Genome-wide
scan identifies a copy number variable region at 3q26 that
regulates PPM1L in APC mutation-negative familial colorectal cancer
patients. Genes Chromosomes Cancer. 49:99–106. 2010.
|