Introduction
Hypoxia develops in solid tumors due to the
insufficiency of oxygen diffusion (chronic hypoxia) and blood
perfusion (acute hypoxia) (1).
Chronic hypoxia is the result of the long distance of tumor cells
from the nearest blood vessel. Acute hypoxia is the result of
fluctuating flow in blood vessels. Tumor cells in a hypoxic
environment are more resistant to radiation damage than those in a
normal oxygen environment, since radiation damage sensitivity
depends on the oxygen concentration at the time of irradiation
(2). Hypoxic regions are also
related to tumor malignancy and proliferation (3–5).
Therefore, hypoxia imaging can provide useful information for
radiotherapy planning, including intensity-modulated radiation
therapy (IMRT), and may also be a useful prognostic tool.
[F-18]-Fluoromisonidazole ([F-18]-FMISO) is the most widely used
positron emission tomography (PET) tracer for the imaging of tumor
hypoxia. [F-18]-FMISO is a 2-nitroimidazole compound, which is
reduced by nitroreductase enzymes in a hypoxic environment and
trapped in hypoxic tumor cells. The hypoxia probe [F-18]-FMISO and
the hypoxia marker pimonidazole are imidazole derivatives and they
accumulate in similar regions in tumors (6,7).
[F-18]-FMISO imaging of hypoxia may enable the optimization of
radiotherapy planning and the prediction of radiotherapy outcome
(8–10). Furthermore, hypoxia imaging using
nitroimidazole has been used for patient selection for
hypoxia-modifying treatments, including high-oxygen-content gas
breathing and nitrometric radiation sensitizers (11,12).
Aside from oxygen concentration, biological
characteristics related to hypoxia have also been reported to
affect radiosensitivity and radiotherapy outcome (4,13,14).
Thus, it is important to elucidate the relationship between
[F-18]-FMISO distribution and biological characteristics. However,
the biological characteristics of intratumoral [F-18]-FMISO
distribution have not yet been fully investigated. Extensive
studies have been carried out on gene/protein expressions in
hypoxic regions. Genes inducing glucose metabolism are upregulated
in a hypoxic environment by hypoxia-inducible factor-1 (HIF-1)
transcription factor (15,16). HIF-1 target proteins include the
glucose transporter-1 (Glut-1) and hexokinase-II (HK-II). HIF-1 and
Glut-1 have been used as endogenous hypoxia markers to predict the
response to radiotherapy (17).
The expression of Glut-1 and the functional activity of HK-II
correlate with glucose metabolism in malignant tumors (18,19).
HIF-1 also upregulates genes inducing cellular proliferation
(20) and knockdown of HIF-1α
results in a decrease in cellular proliferation rate in
vivo(16). We therefore
compared the intratumoral [F-18]-FMISO distribution with Glut-1 and
Ki-67 expression and with [C-14]2-fluoro-2-deoxy-D-glucose
([C-14]-FDG) distribution in a rat glioma model, in order to gain
insight into the biological characteristics of intratumoral
[F-18]-FMISO distribution that is relevant to radiotherapy
planning.
Materials and methods
Animal studies
The experimental protocol was approved by the
Laboratory Animal Care and Use Committee of Hokkaido University.
Eight-week-old male Wistar King Aptekman/Hok (WKAH) rats (supplied
by Japan SLC, Inc., Hamamatsu, Japan) were inoculated with a
suspension of allogenic C6 rat glioma cells (2×10⁶
cells/0.2 ml) into the left calf muscle to generate a rat glioma
model (21). The rats were allowed
free access to water and laboratory chow until the day before the
experiment. Nine days after the tumor inoculation, when the tumors
had reached 1–2 cm in diameter, the rats were fasted overnight
(n=5). Under diethyl ether anesthesia, the tail vein was injected
with a mixture of 29–37 MBq of [F-18]-FMISO and 370–493 kBq of
[C-14]-FDG. [F-18]-FMISO (specific activity, 45–70 MBq/nmol) was
synthesized as previously described (22,23).
Universally labeled [C-14]-FDG (specific activity, 11.1 GBq/mmol)
in sterile saline was purchased from American Radiolabeled
Chemicals, Inc. Eighty minutes after the injection of [F-18]-FMISO
and [C-14]-FDG, the rats were anesthetized with pentobarbital (50
mq/kg body weight, intraperitoneally). Ten minutes after the
injection, the rats were injected into the tail vein with
pimonidazole (Hypoxyprobe-1; HPI Inc., Burlington, MA, USA) at a
dose of 60 mq/kg body weight. Sixty minutes after the pimonidazole
injection the animals were sacrificed and the tumors were quickly
excised. The calf muscles were excised with the tumors. Each
specimen was then sectioned to obtain two adjacent 3–5-mm slices.
One of the two slices was embedded in Tissue-Tek medium (Sakura
Finetechnical Co., Ltd.) and frozen in isopentane/dry ice for
autoradiography (ARG) and immunohistochemical (IHC) analyses. The
remaining slice was prepared as the formalin-fixed,
paraffin-embedded specimens for IHC analyses of pimonidazole.
Dual-tracer ARG
The frozen samples were cut into 20-μm and
5-μm adjacent sections with a CM3050-Cryostat (Leica
Microsystems) at −20°C. Tumor sections (20 μm and 5
μm) were prepared for ARG. The radioactivity of [F-18]-FMISO
was measured in 20-μm sections. The radioactivity of
[C-14]-FDG was measured in 5-μm sections. [C-14]-FDG ARG
images of 20-μm sections were used for superimposing. Four
5-μm tumor sections were prepared for IHC and
hematoxylin-eosin (HE) staining. The 20-μm and 5-μm
tumor sections were placed in a phosphor image plate cassette with
a set of calibrated standards (24), and the specimens were exposed to
phosphor imaging plates (Fuji Imaging Plate, Fuji Photo Film Co.,
Ltd.) overnight to detect the distribution of [F-18]-FMISO. During
ARG exposure, a polypropylene film was set between the phosphor
imaging plate and a set of tumor sections and calibrated standards
to block the β-rays from [C-14]-FDG. Two days later, following the
decay of [F-18]-FMISO, the same tumor sections and calibrated
standards were exposed to a phosphor imaging plate for 14 days to
detect the distribution of [C-14]-FDG. The HE staining of the
sections was carried out to exclude necrotic/apoptotic regions in
the regions of interest (ROIs) on the autoradiograms. The ARG
images obtained were analyzed using a computerized imaging analysis
system (BAS 5000 Bio-Imaging Analyzer; Fuji Photo Film Co., Ltd.).
The ARG resolution of BAS 5000 was 25 μm. The radioactivity
in each ROI was expressed as the percentage activity of injected
dose (ID) per gram of tissue following normalization to the
animal’s weight (% ID/g/kg), with the hypothesis that the tissue
density is 1 g/cm3(24,25).
Immunohistochemistry
The experimental conditions of IHC were set to be
identical using an automated staining system (Autostainer Plus,
Dako) (26). The uptake of
pimonidazole and the expression of Glut-1 and Ki-67 were examined
in the frozen sections. Four adjacent tumor sections were used for
pimonidazole, Glut-1, Ki-67, or HE staining. For pimonidazole
staining, following rehydration, the slides were immersed in a
citrate buffer solution (pH 6.0) and heated for 15 min at 121°C to
retrieve the antigen. Subsequently, endogenous peroxidase activity
was blocked for 10 min in 0.3% hydrogen peroxide. Thereafter, the
slides were incubated with Hyproxyprobe-1 MAb1 (HPI Inc.) for 30
min at 37°C, and then with biotinconjugated F(ab’)2 for 15 min at
37°C. Following incubation with the antibodies, the bound antibody
complex was visualized by incubation with streptavidin and
3,3-diaminobenzidine tetrahydrochloride. For Glut-1 and Ki-67
staining, the slides were immersed in a target retrieval solution
(pH 9.0; Nichirei) and heated for 10 min at 95°C following
rehydration. Endogenous peroxidase activity was then blocked for 10
min in 0.3% hydrogen peroxide. Thereafter, the slides for Glut-1
staining were incubated with anti-Glut-1 (Abcam) for 30 min at
37°C, and then with anti-rabbit immunoglobulins/biotinylated (Dako)
for 30 min at 37°C. The slides for Ki-67 staining were incubated
with an anti-Ki-67 antibody (Dako) for 30 min at 37°C, and then
with anti-mouse immunoglobulins/biotinylated (Dako) for 30 min at
37°C. Following incubation with the antibodies, the bound antibody
complex was visualized by incubation with streptavidin and
3,3-diaminobenzidine tetrahydrochloride. Tumor sections adjacent to
those used for the immunostaining were stained with HE to exclude
necrotic/apoptotic regions in ROIs on IHC images. IHC images were
captured using a Biozero fluorescence microscope (BZ-8000;
Keyence). The size of the IHC images was 2.32 pixels/μm.
The uptake of pimonidazole and the expression of
HK-II were studied in the formalin-fixed, paraffin-embedded tumor
sections. Two adjacent tumor sections were used for pimonidazole or
HK-II staining. Five-μm adjacent sections were prepared
using a Leika RM2265 microtome (Leica Microsystems). All
paraffin-embedded sections were deparaffinized prior to antigen
retrieval. For pimonidazole staining, the sections were stained
similarly to the frozen sections, except in antigen retrieval. The
antigen retrieval method for pimonidazole staining involved
immersion in a citrate buffer solution (pH 6.0) and heating for 15
min at 121°C. For HK-II staining, the slides were immersed in a
protease K solution (Dako) for 10 min at 37°C. The slides were then
immersed in 0.3% hydrogen peroxide for 10 min. Thereafter, the
slides were incubated with an anti-HK-II antibody (Chemicon
International) for 30 min at 37°C, and then with anti-rabbit
immunoglobulins/biotinylated (Dako) for 30 min at 37°C. Following
antibody incubation, the bound antibody complex was visualized by
incubation with streptavidin and 3,3-diaminobenzidine
tetrahydrochloride (Dako).
Image analysis
[F-18]-FMISO ARG images were compared with
[C-14]-FDG ARG images and the IHC images of pimonidazole, Glut-1
and Ki-67 in the frozen sections. [F-18]-FMISO ARG images were
divided into the regions of high [F-18]-FMISO uptake (FMISO+) and
low [F-18]-FMISO uptake (FMISO−). The tumor-to-muscle (T/M) ratio
of 4 was used as a cutoff value between FMISO+ and FMISO−, based on
a previous report stating that the T/M ratio of [F-18]-FMISO uptake
was 4.4±1.3 3 h following injection of [F-18]-FMISO to Walker 256
rat carcinosarcoma (27). The
[F-18]-FMISO uptake level in the calf muscles around the tumor was
measured. Three ROIs (0.04 mm2) were assigned to the
muscle and the [F-18]-FMISO uptake level was determined in these
ROIs. Large necrotic/apoptotic regions were excluded from the
evaluation by referring to the sections stained in HE images.
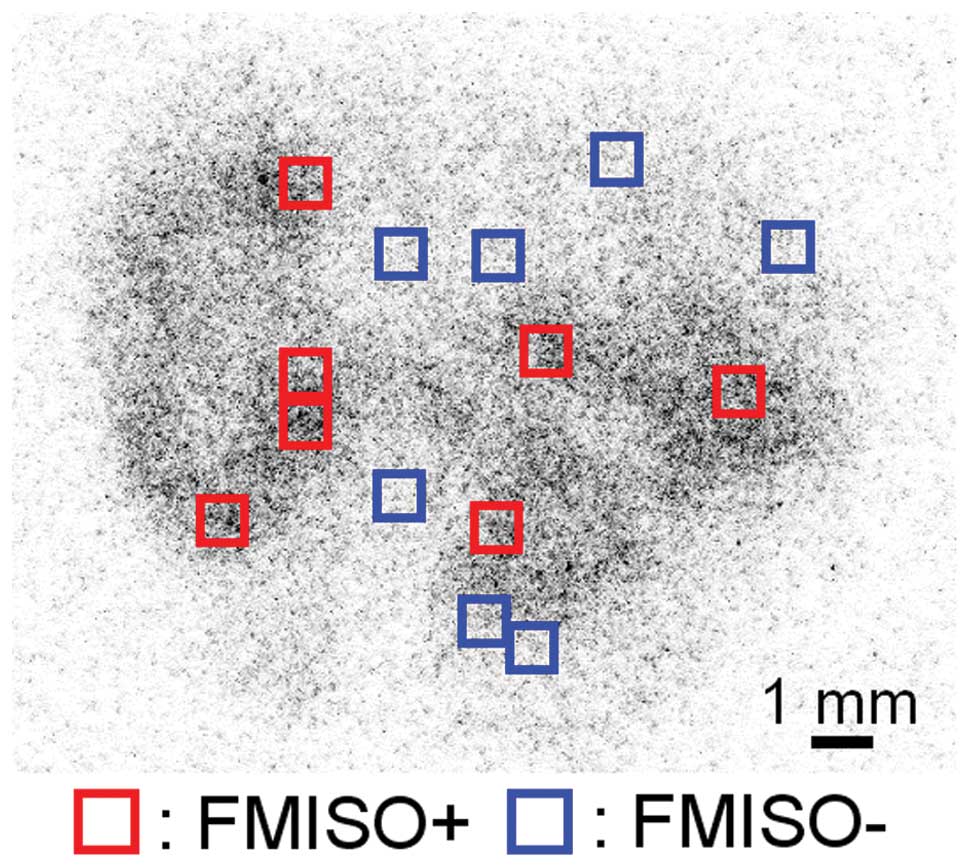
Initially, we set 0.16-mm2 areas in the entire FMISO+
and FMISO−. Then, we assigned random numbers to all the
0.16-mm2 areas. An individual not related to our study
selected seven numbers from each random number set of FMISO+ and
FMISO−. The areas that were assigned the selected numbers were
determined as ROIs (Fig. 1). The
[F-18]-FMISO uptake level in FMISO+ was significantly higher
compared to FMISO− (FMISO+, 0.45±0.11% ID/g/kg; FMISO−, 0.18±0.04%
ID/g/kg; P<0.001). The ROIs placed on the [C-14]-FDG ARG images
were transferred from the [F-18]-FMISO ARG images using Fujifilm
MultiGauge imaging software (Fujifilm Inc.). We manually
colocalized ARG images with each other using MultiGauge. Initially,
the ROIs placed on the [C-14]-FDG ARG images of 20-μm
sections were transferred from the [C-14]-FDG ARG images of
5-μm sections by superimposing the margins of the tumor.
Subsequently, the ROIs placed on the [F-18]-FMISO ARG images of
20-μm sections were transferred from the [C-14]-FDG ARG
images of 20-μm sections by measuring the position of the
phosphor imaging plates. IHC images were compared with [C-14]-FDG
ARG images by Adobe Photoshop (Adobe Systems). The positions of the
ROIs on the [C-14]-FDG ARG images were assigned to the
corresponding positions of ROIs placed on the IHC images, by
superimposing the margins of the tumor in the [C-14]-FDG ARG images
with those in the IHC images. The percentage of positively stained
areas (% positive) of pimonidazole and Glut-1 and the proliferation
index of Ki-67 were quantified using ImageJ 1.41o software
(National Institutes of Health). Thresholds for pimonidazole
positivity and the proliferation index of Ki-67 were set above the
background staining using a binary image.
The IHC images of pimonidazole in paraffin sections
were compared with those of HK-II. The IHC images of pimonidazole
were divided into pimonidazole-positive regions (Pimo+) and
pimonidazole-negative regions (Pimo−). Pimo+ and Pimo− areas were
defined as the areas containing only pimonidazole-positive and
-negative cells, respectively. We compared the expression of HK-II
between Pimo+ and Pimo−, rather than between FMISO+ and FMISO−,
since the images of HK-II IHC staining of the frozen sections were
not adequately stained for evaluation. Large necrotic/apoptotic
regions were excluded from the evaluation by referring to images of
the sections stained with HE. Twenty-five ROIs (0.04
mm2) were assigned from Pimo+ and Pimo− in a
double-blind manner. The positions of the ROIs on IHC images of
HK-II were assigned to the corresponding positions on IHC images of
pimonidazole, using Adobe Photoshop (Adobe Systems). The % positive
of pimonidazole and HK-II were quantified using ImageJ 1.41o
software (National Institutes of Health). The threshold for HK-II
positivity was set above the background staining using a binary
image.
Statistical analyses
In the analyses between FMISO+ and FMISO−, all
values were averaged in seven ROIs from each tumor section.
Subsequently, five values of FMISO+ and FMISO− per rat were
statistically analyzed. All values are expressed as the means ±
standard deviation. Statistical analyses were performed using a
non-parametric Mann-Whitney U test to evaluate the significance of
differences in values between FMISO+ and FMISO−.
In the analyses between Pimo+ and Pimo−, all values
were averaged in 25 ROIs from each tumor section. Five values of
Pimo+ and Pimo− per rat were then statistically analyzed. All
values are expressed as the means ± standard deviation. Statistical
analyses were performed using a non-parametric Mann-Whitney U test
to evaluate the significance of differences in values between Pimo+
and Pimo−. P-value <0.05 was considered to indicate a
statistically significant difference. The statistical program
StatView 5.0 was used for data assessment.
Results
[F-18]-FMISO distribution in comparison
with pimonidazole distribution
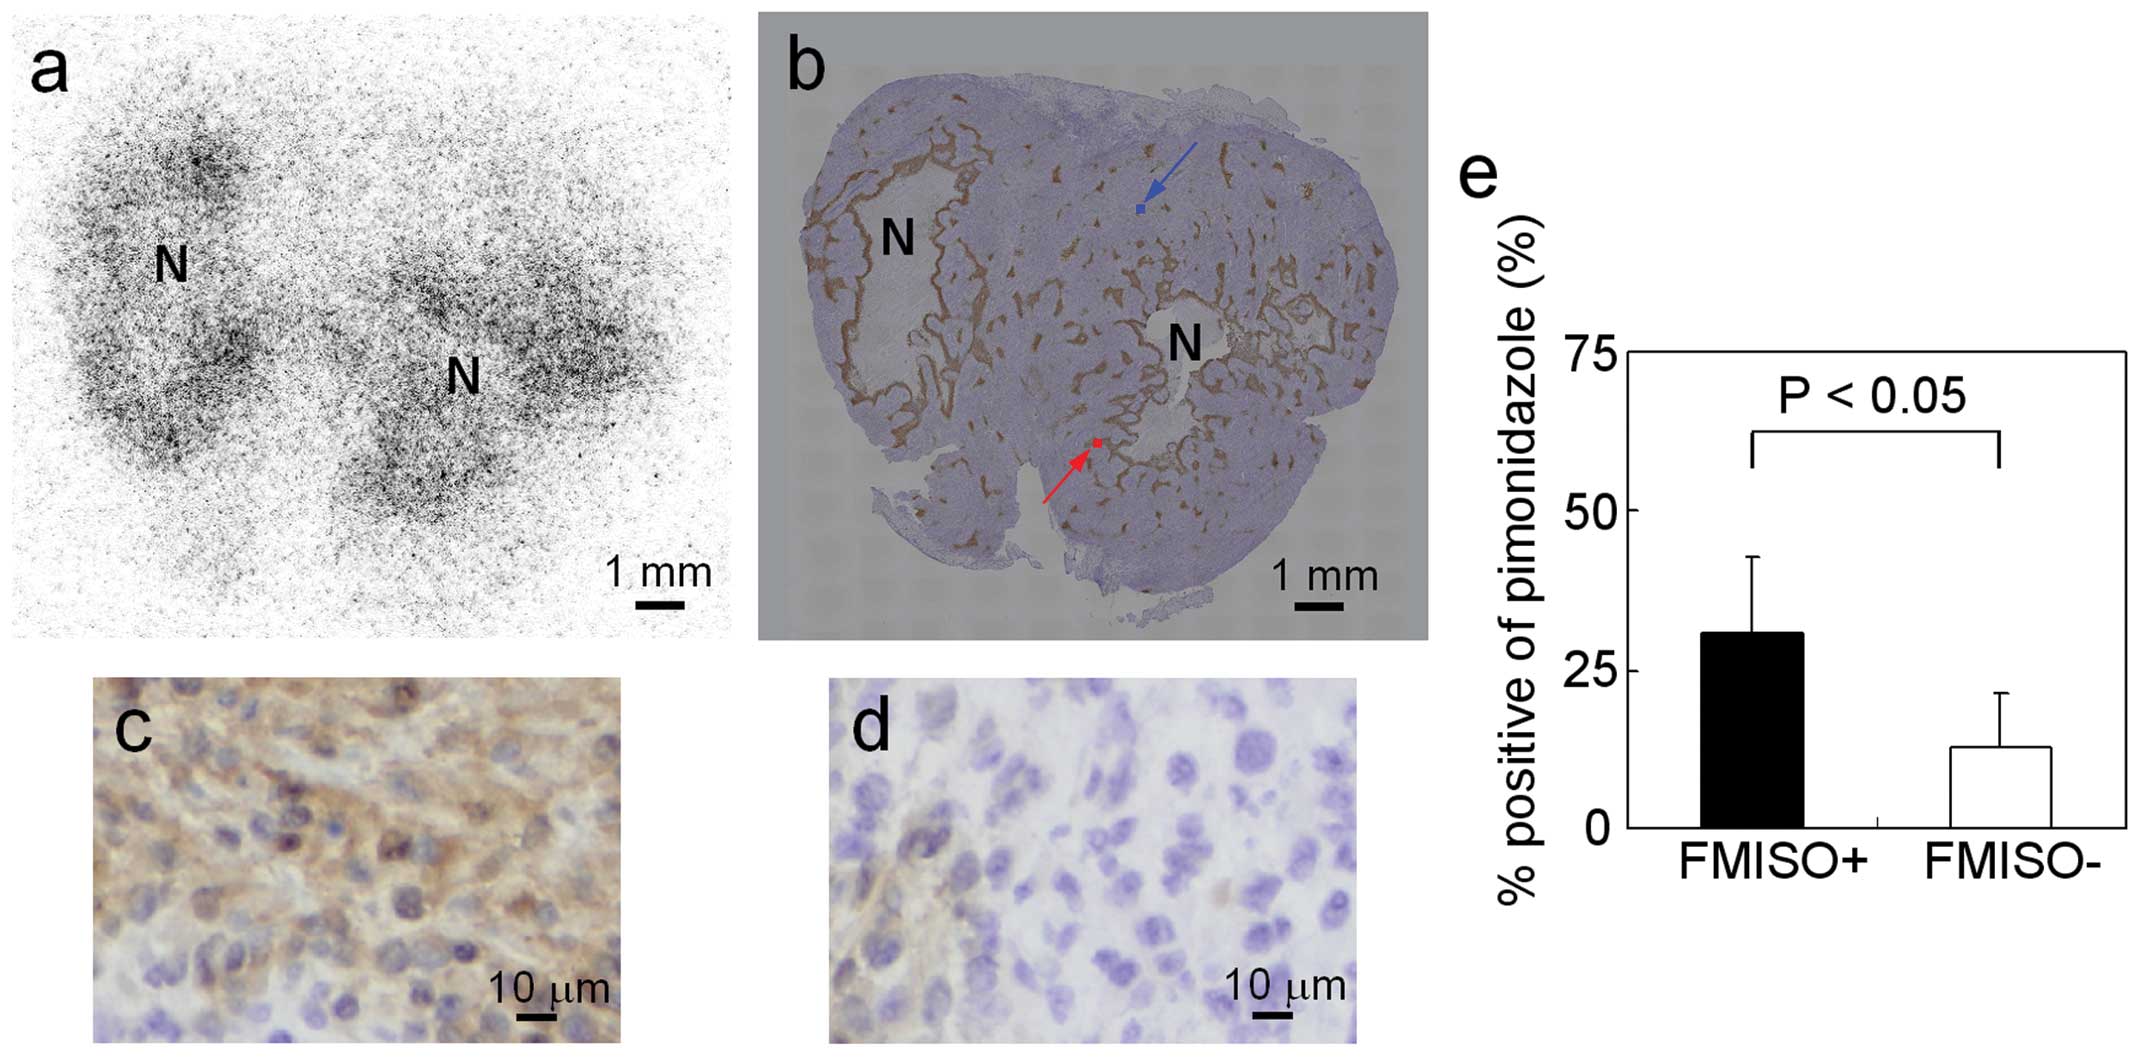
Fig. 2a and b shows
representative images of [F-18]-FMISO ARG and pimonidazole IHC
staining of the whole tumor. The patterns of pimonidazole uptake
were similar to those of [F-18]-FMISO uptake. The typical IHC
stainings of pimonidazole in FMISO+ and FMISO− are shown in
Fig. 2c and d, respectively. The
intensity and extent of pimonidazole staining were markedly greater
in FMISO+ compared to FMISO−. The results of semiquantitative
analysis of pimonidazole uptake are summarized in Fig. 2e. The % positive of pimonidazole
was significantly higher in FMISO+ compared to FMISO− (31±12% in
FMISO+ and 13±9% in FMISO−; P<0.05).
Glut-1 expression in comparison with
[F-18]-FMISO distribution
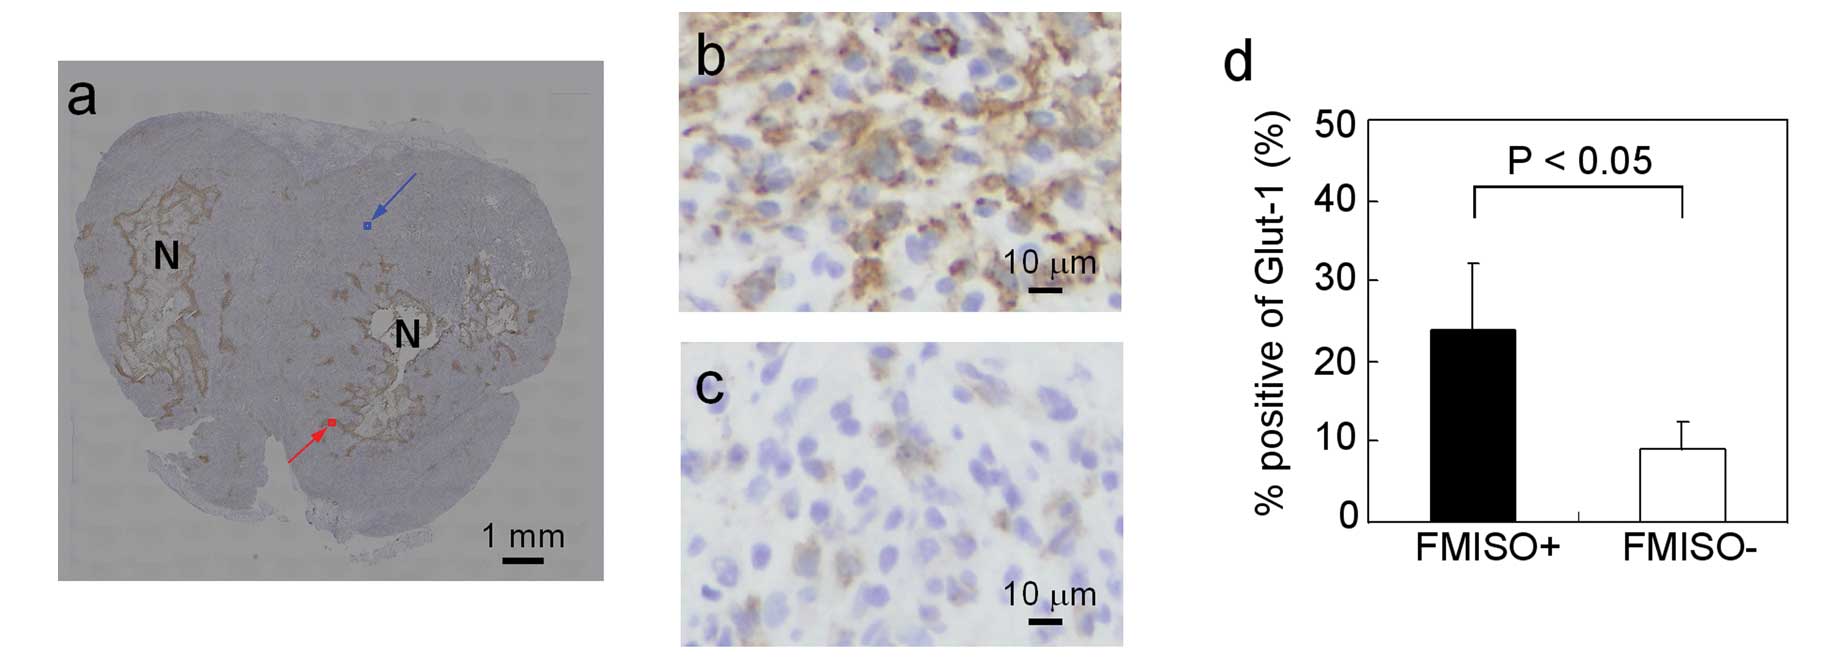
Fig. 3a shows
representative images of Glut-1 IHC staining of the whole tumor.
The patterns of Glut-1 positively stained areas were similar to
those of [F-18]-FMISO uptake (Fig.
2a). The typical IHC stainings of Glut-1 in FMISO+ and FMISO−
are shown in Fig. 3b and c,
respectively. The intensity and extent of Glut-1 staining were
markedly greater in FMISO+ compared to FMISO−. The results of
semiquantitative analysis of Glut-1 are summarized in Fig. 3d. The % positive of Glut-1 was
significantly higher in FMISO+ compared to FMISO−(24±8% in FMISO+
and 9±4% in FMISO−, P<0.05).
Ki-67 expression in comparison with
[F-18]-FMISO distribution
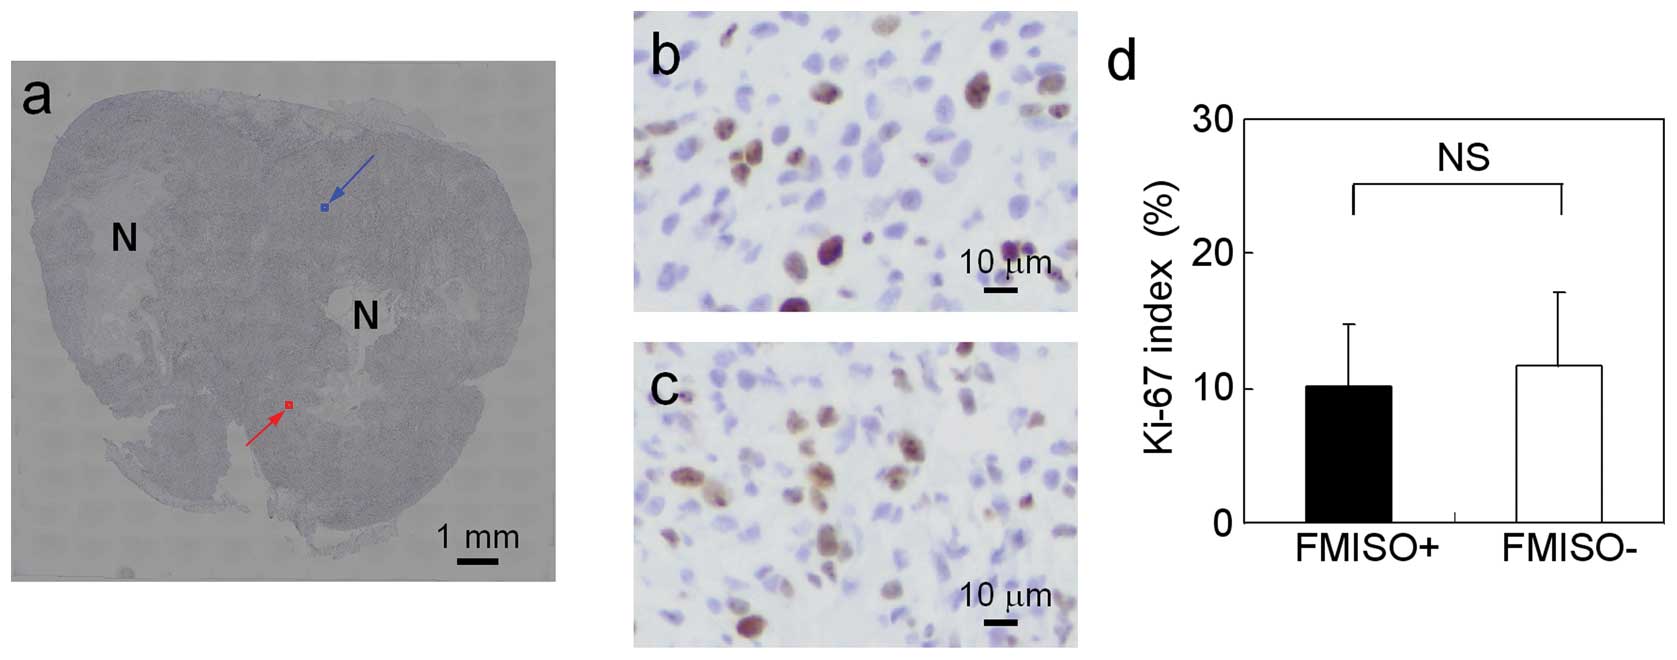
Fig. 4a shows a
representative Ki-67 IHC staining of the tumor. The typical IHC
stainings of Ki-67 in FMISO+ and FMISO− are shown in Fig. 4b and c, respectively.
Ki-67-positive cells were observed in both FMISO+ and FMISO−. The
results of semiquantitative analysis of Ki-67 are summarized in
Fig. 4d. There were no significant
differences in Ki-67 index between FMISO+ and FMISO− (10±5% in
FMISO+ and 12±5% in FMISO−; P = ns).
[C-14]-FDG distribution in comparison
with [F-18]-FMISO distribution
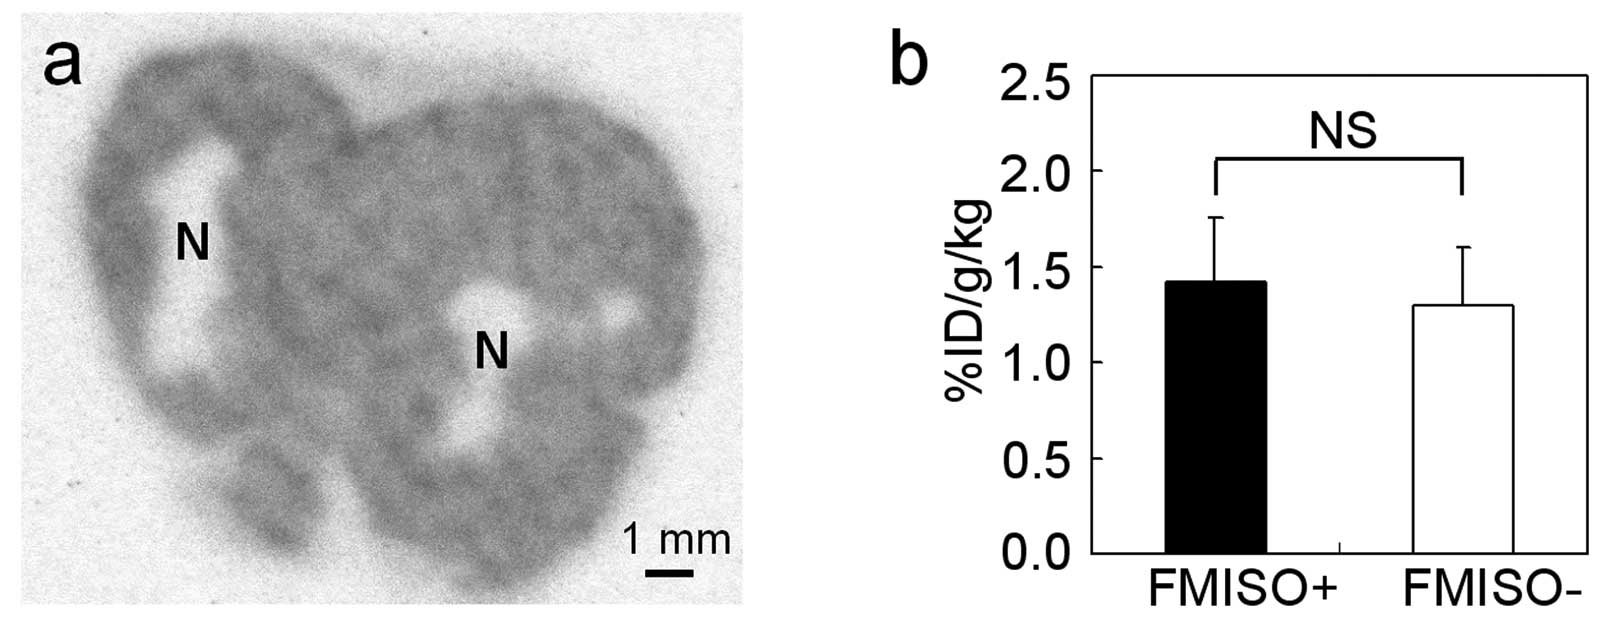
Fig. 5a shows a
representative [C-14]-FDG ARG image of the tumor. [C-14]-FDG
accumulation was observed in the entire tumor except in
necrotic/apoptotic regions. The results of semiquantitative
analysis of [C-14]-FDG accumulation based on ARG images are
summarized in Fig. 5b. There were
no significant differences in [C-14]-FDG uptake between FMISO+ and
FMISO− (1.4±0.3% ID/g/kg in FMISO+ and 1.3±0.3% ID/g/kg in FMISO−;
P = ns).
HK-II expression in comparison with
pimonidazole distribution
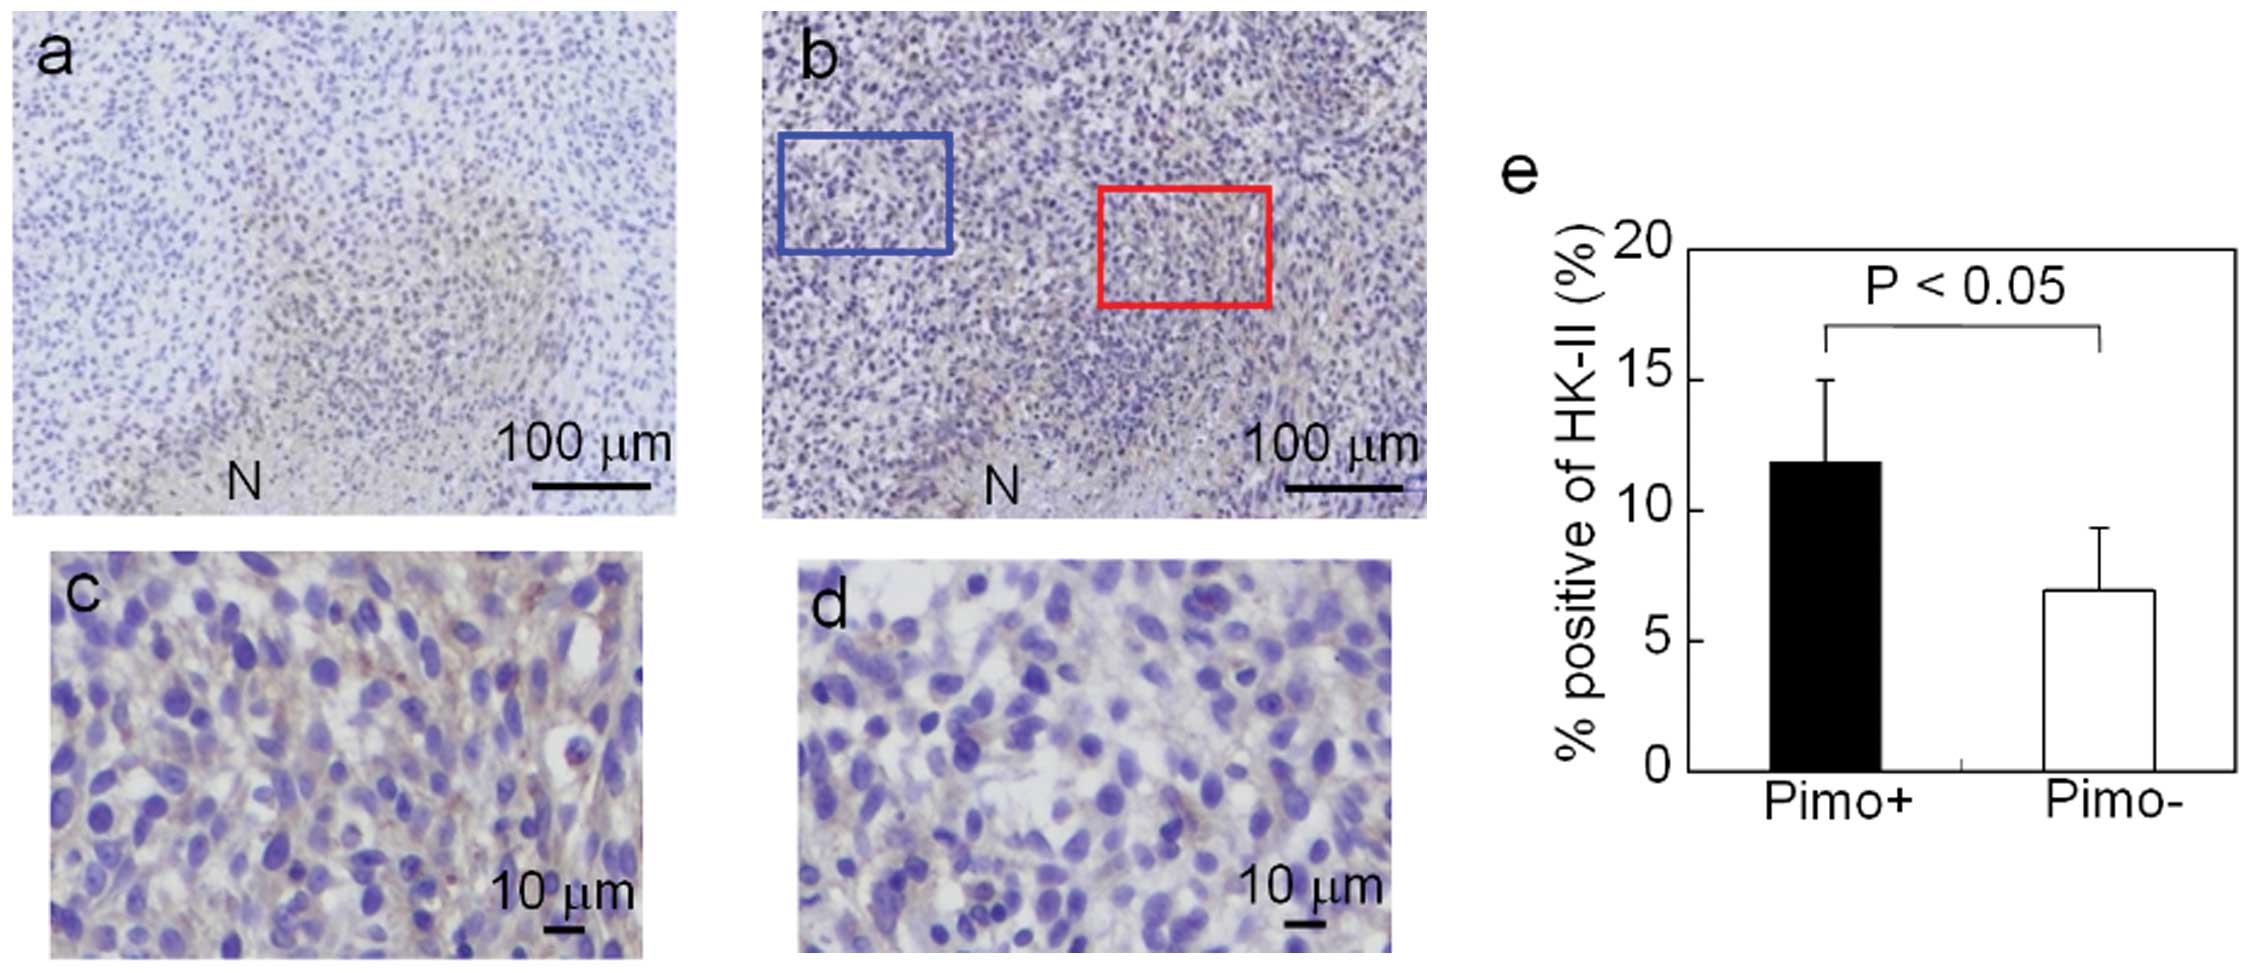
Fig. 6a shows
representative images of pimonidazole IHC staining of the tumor.
Fig. 6b shows representative
images of HK-II IHC staining of the tumor. The staining pattern of
pimonidazole-positive areas was similar to that of HK-II-positive
areas. The typical IHC stainings of HK-II in Pimo+ and Pimo− are
shown in Fig. 6c and d,
respectively. The intensity and extent of HK-II staining were
markedly greater in Pimo+ compared to Pimo−. The results of
semiquantitative analysis of HK-II are summarized in Fig. 6e. The % positive of HK-II was
significantly higher in Pimo+ compared to Pimo− (12±3% in Pimo+ and
7±2% in Pimo−; P<0.05).
Discussion
In this study, the % positive of pimonidazole and
Glut-1 were higher in FMISO+ than in FMISO−. However, there were no
significant differences in Ki-67 index and [C-14]-FDG uptake
between FMISO+ and FMISO−. These findings indicate that
intratumoral [F-18]-FMISO distribution reflects tumor hypoxia and
expression of the hypoxia-related gene product Glut-1; it does not,
however, reflect tumor proliferation or glucose metabolism.
Radiosensitivity depends on oxygen levels in tumor tissues
(2). Hypoxia imaging using
[F-18]-FMISO is therefore considered useful for patient selection
prior to and during radiotherapy (8–10).
Moreover, biological characteristics affect radiosensitivity and
radiotherapy outcome (4,13,14).
Therefore, [F-18]-FMISO may be used to identify hypoxic
radioresistant regions among regions with similar proliferative
activity and glucose metabolism activity. Such regions may be
targets for dose escalation using IMRT. Our results may thus
provide critical information on radiotherapy, since patients
suffering from malignant glioma are generally treated by
fractionated radiation therapy (28).
Our study indicated that [F-18]-FMISO distribution
was similar to pimonidazole distribution and that Glut-1 expression
level was higher in FMISO+. Since pimonidazole uptake is closely
related to tumor hypoxia, pimonidazole has been used as an
exogenous marker of radioresistance in clinical practice. Kaanders
et al demonstrated that locoregional tumor control and
disease-free survival were significantly reduced in patients who
had head-and-neck tumors with high pimonidazole binding levels
(29). These differences were not
observed in the subgroup of patients undergoing accelerated
radio-therapy combined with carbogen and nicotinamide (ARCON)
treatment. This indicated that pimonidazole binding reflects
hypoxic radiation resistance. While pimonidazole is used as the
exogenous marker, Glut-1 has been used as an endogenous marker.
Airley et al investigated the relationship between Glut-1
expression in cervical tumors and the prognosis following treatment
of these tumors with radiotherapy (30). A high Glut-1 staining intensity in
tumors indicated a shorter metastasis-free survival. This suggested
that Glut-1 expression may be a potential marker of
radioresistance. Therefore, the increases in pimonidazole uptake
and Glut-1 expression level in FMISO+ suggest that tumor cells in
FMISO+ may be more radioresistant compared to those in FMISO−.
Cellular proliferation and glucose metabolism are
indicators of biological aggressiveness. Therefore, tumor areas
with a high cellular proliferation or glucose metabolism may be an
important target for radiotherapy, comparable with hypoxic tumor
areas. Tumor hypoxia may correlate with cellular proliferation and
glucose metabolism, since HIF-1 upregulates genes that induce
cellular proliferation and glucose metabolism. We confirmed that
the Glut-1 expression level was increased in FMISO+. Moreover, we
discovered that the HK-II expression level was higher in
high-pimonidazole-uptake regions (Pimo+) than in
low-pimonidazole-uptake regions (Pimo−) (Fig. 6). However, we observed no
significant differences in cellular proliferation and glucose
metabolism between FMISO+ and FMISO−. Several studies have
demonstrated discordant results regarding the correlation between
hypoxia and cellular proliferation, or between hypoxia and glucose
metabolism (4,5,31–36).
The expressions of Glut-1 and HK-II are important factors that
induce glucose metabolism (18,19).
However, our data demonstrated that glucose metabolism in FMISO+
was not significantly enhanced, even when the expression levels of
Glut-1 in FMISO+ and HK-II in Pimo+ were increased. There was also
no notable increase in cellular proliferative activity. Therefore,
it is hypothesized that factors other than Glut-1 and HK-II
expression may predominantly affect glucose metabolism and cellular
proliferation in FMISO+. For example, the delivery of glucose is
reduced in hypoxic regions due to their long distance from blood
vessels. The reduced glucose delivery may result in decreased
glucose metabolism and cellular proliferation.
Riesterer et al demonstrated that
[F-18]-FMISO distribution in tumors is similar to the distribution
of Glut-1-positive regions in the mouse mammary tumor model
(37), which is consistent with
our results in the glioma rat model. Regarding the correlation
between oxygen concentration and proliferative activity, the
proliferative activity in hypoxic regions was decreased in several
types of tumors (5,38). However, Evans et al reported
that the hypoxia probe EF5-binding regions with a proximity to
Ki-67-positive cells (approximately 50 μm) were the 75.6% of
all EF5-binding regions in human glioblastoma, suggesting that the
majority of the hypoxic regions overlap with highly proliferative
regions in human glioblastoma (4).
Therefore, the correlation between oxygen concentration and
proliferative activity is considered to differ among different
types of tumors and this correlation in C6 glioma has not been
fully investigated. We discovered that the proliferative activity
in FMISO+ was not significantly different from that in FMISO− in C6
glioma. Regarding the correlation between oxygen concentration and
glucose metabolism, hypoxia probe uptake in tumors was weakly or
not correlated with glucose metabolism in several types of tumors
(31,39,40).
In C6 glioma, however, the correlation has not been elucidated. Our
results in C6 glioma also demonstrated a weak or no correlation
between [F-18]-FMISO distribution and glucose metabolism.
Although [F-18]-FMISO imaging may be useful for
radiotherapy planning, several issues remain to be addressed.
First, it is difficult to discriminate hypoxic from normoxic
regions due to the low resolution of clinical PET. Furthermore,
hypoxic regions in tumors were reported to be unstable (41). To optimize radiotherapy planning by
[F-18]-FMISO imaging, [F-18]-FMISO−positive regions must match
hypoxic regions at the time of radiation delivery.
There is an increasing interest in incorporating
functional and molecular information into radiotherapy. Molecular
imaging, including [F-18]-FDG and [F-18]-FMISO PET/CT, can provide
such information (42). At
present, radiotherapy planning using [F-18]-FDG and [F-18]-FMISO
PET/CT is mostly conducted without detailed biological information
regarding probe distribution. It is critical to elucidate the
biology underlying molecular imaging. Our results provide useful
insight into radiotherapy planning using [F-18]-FMISO PET, although
further studies are required to determine the optimal use of such
biological information in radiotherapy planning.
In conclusion, intratumoral [F-18]-FMISO
distribution reflected tumor hypoxia and the expression of the
hypoxia-related gene product Glut-1; it did not, however, reflect
tumor proliferation or glucose metabolism. Our findings may help
elucidate the biological characteristics of intratumoral
[F-18]-FMISO distribution that are relevant to radiotherapy
planning.
Acknowledgements
This study was partially supported by
the ‘Project for Developing Innovation Systems: Creation of
Innovation Centers for Advanced Interdisciplinary Research Areas
Program’ from the Ministry of Education, Culture, Sports, Science
and Technology, the Japanese Government. This study was also
partially supported by a Grant-in-Aid for General Scientific
Research from the Japan Society for the Promotion of Science. The
authors thank the staff of the Nuclear Medicine and Central
Institute of Isotope Science, Hokkaido University and the staff of
the Central Research Laboratory, Hitachi, Ltd., for their
support.
References
|
1
|
Brown JM and Giaccia AJ: The unique
physiology of solid tumors: opportunities (and problems) for cancer
therapy. Cancer Res. 58:1408–1416. 1998.PubMed/NCBI
|
|
2
|
Gray LH, Conger AD, Ebert M, Hornsey S and
Scott OC: The concentration of oxygen dissolved in tissues at the
time of irradiation as a factor in radiotherapy. Br J Radiol.
26:638–648. 1953. View Article : Google Scholar : PubMed/NCBI
|
|
3
|
Höckel M and Vaupel P: Tumor hypoxia:
definitions and current clinical, biologic, and molecular aspects.
J Natl Cancer Inst. 93:266–276. 2001.PubMed/NCBI
|
|
4
|
Evans SM, Jenkins KW, Chen HI, Jenkins WT,
Judy KD, Hwang WT, Lustig RA, Judkins AR, Grady MS, Hahn SM and
Koch CJ: The relationship among hypoxia, proliferation, and outcome
in patients with de novo glioblastoma: A pilot study. Transl Oncol.
3:160–169. 2010. View Article : Google Scholar : PubMed/NCBI
|
|
5
|
Evans SM, Hahn SM, Magarelli DP and Koch
CJ: Hypoxic heterogeneity in human tumors: EF5 binding,
vasculature, necrosis, and proliferation. Am J Clin Oncol.
24:467–472. 2001. View Article : Google Scholar : PubMed/NCBI
|
|
6
|
Troost EG, Laverman P, Philippens ME, et
al: Correlation of [18F]FMISO autoradiography and
pimonidazole immunohistochemistry in human head and neck carcinoma
xenografts. Eur J Nucl Med Mol Imaging. 35:1803–1811. 2008.
|
|
7
|
Troost EG, Laverman P, Kaanders JH,
Philippens M, Lok J, Oyen WJ, van der Kogel AJ, Boerman OC and
Bussink J: Imaging hypoxia after oxygenation-modification:
comparing [18F]FMISO autoradiography with pimonidazole
immunohistochemistry in human xenograft tumors. Radiother Oncol.
80:157–164. 2006.PubMed/NCBI
|
|
8
|
Spence AM, Muzi M, Swanson KR, O’Sullivan
F, Rockhill JK, Rajendran JG, Adamsen TC, Link JM, Swanson PE,
Yagle KJ, Rostomily RC, Silbergeld DL and Krohn KA: Regional
hypoxia in glioblastoma multiforme quantified with
[18F]fluoromisonidazole positron emission tomography
before radiotherapy: correlation with time to progression and
survival. Clin Cancer Res. 14:2623–2630. 2008.
|
|
9
|
Eschmann SM, Paulsen F, Reimold M,
Dittmann H, Welz S, Reischl G, Machulla HJ and Bares R: Prognostic
impact of hypoxia imaging with 18F-misonidazole PET in
non-small cell lung cancer and head and neck cancer before
radiotherapy. J Nucl Med. 46:253–260. 2005.PubMed/NCBI
|
|
10
|
Rajendran JG, Schwartz DL, O’Sullivan J,
Peterson LM, Ng P, Scharnhorst J, Grierson JR and Krohn KA: Tumor
hypoxia imaging with [F-18] fluoromisonidazole positron emission
tomography in head and neck cancer. Clin Cancer Res. 12:5435–5441.
2006.
|
|
11
|
Overgaard J: Clinical evaluation of
nitroimidazoles as modifiers of hypoxia in solid tumors. Oncol Res.
6:509–518. 1994.PubMed/NCBI
|
|
12
|
Overgaard J and Horsman MR: Modification
of hypoxia-induced radioresistance in tumors by the use of oxygen
and sensitizers. Semin Radiat Oncol. 6:10–21. 1996. View Article : Google Scholar : PubMed/NCBI
|
|
13
|
Moeller BJ and Dewhirst MW: HIF-1 and
tumour radiosensitivity. Br J Cancer. 95:1–5. 2006. View Article : Google Scholar
|
|
14
|
Moeller BJ, Dreher MR, Rabbani ZN,
Schroeder T, Cao Y, Li CY and Dewhirst MW: Pleiotropic effects of
HIF-1 blockade on tumor radiosensitivity. Cancer Cell. 8:99–110.
2005. View Article : Google Scholar : PubMed/NCBI
|
|
15
|
Dang CV and Semenza GL: Oncogenic
alterations of metabolism. Trends Biochem Sci. 24:68–72. 1999.
View Article : Google Scholar
|
|
16
|
Kamlah F, Eul BG, Li S, Lang N, Marsh LM,
Seeger W, Grimminger F, Rose F and Hänze J: Intravenous injection
of siRNA directed against hypoxia-inducible factors prolongs
survival in a Lewis lung carcinoma cancer model. Cancer Gene Ther.
16:195–205. 2009.
|
|
17
|
Le QT and Courter D: Clinical biomarkers
for hypoxia targeting. Cancer Metastasis Rev. 27:351–362. 2008.
View Article : Google Scholar : PubMed/NCBI
|
|
18
|
Reske SN, Grillenberger KG, Glatting G,
Port M, Hildebrandt M, Gansauge F and Beger HG: Overexpression of
glucose transporter 1 and increased FDG uptake in pancreatic
carcinoma. J Nucl Med. 38:1344–1348. 1997.PubMed/NCBI
|
|
19
|
Aloj L, Caracó C, Jagoda E, Eckelman WC
and Neumann RD: Glut-1 and hexokinase expression: relationship with
2-fluoro-2-deoxy-D-glucose uptake in A431 and T47D cells in
culture. Cancer Res. 59:4709–4714. 1999.
|
|
20
|
Semenza GL: Targeting HIF-1 for cancer
therapy. Nat Rev Cancer. 3:721–732. 2003. View Article : Google Scholar
|
|
21
|
Zhao S, Kuge Y, Yi M, Zhao Y, Hatano T,
Magota K, Nishijima K, Kohanawa M and Tamaki N: Dynamic
11C-methionine PET analysis has an additional value for
differentiating tumors from granulomas: An experimental study using
small animal PET. Eur J Nucl Med Mol Imaging. 38:1876–1886. 2011.
View Article : Google Scholar : PubMed/NCBI
|
|
22
|
Tang G, Wang M, Tang X, Gan M and Luo L:
Fully automated one-pot synthesis of
[18F]fluoromisonidazole. Nucl Med Biol. 32:553–558.
2005.
|
|
23
|
Oh SJ, Chi DY, Mosdzianowski C, Kim JY,
Gil HS, Kang SH, Ryu JS and Moon DH: Fully automated synthesis of
[18F]fluoromisonidazole using a conventional
[18F]FDG module. Nucl Med Biol. 32:899–905. 2005.
|
|
24
|
Brown RS, Leung JY, Fisher SJ, Frey KA,
Ethier SP and Wahl RL: Intratumoral distribution of tritiated
fluorodeoxyglucose in breast carcinoma: I. Are inflammatory cells
important? J Nucl Med. 36:1854–1861. 1995.PubMed/NCBI
|
|
25
|
Toyama H, Ichise M, Liow JS, Modell KJ,
Vines DC, Esaki T, Cook M, Seidel J, Sokoloff L, Green MV and Innis
RB: Absolute quantification of regional cerebral glucose
utilization in mice by 18F-FDG small animal PET scanning
and 2-14C-DG autoradiography. J Nucl Med. 45:1398–1405.
2004.PubMed/NCBI
|
|
26
|
Hatanaka Y, Imaoka Y, Torisu K, Kamihara
Y, Hashizume K, Ichimura K, Yoshino T and Tani Y: A simplified,
sensitive immunohistochemical detection system employing signal
amplification based on fluorescyl-tyramide/antifluorescein antibody
reaction: its application to pathologic testing and research. Appl
Immunohistochem Mol Morphol. 16:87–93. 2008.
|
|
27
|
Sorger D, Patt M, Kumar P, Wiebe LI,
Barthel H, Seese A, Dannenberg C, Tannapfel A, Kluge R and Sabri O:
[18F] Fluoroazomycinarabinofuranoside
(18FAZA) and [18F]Fluoromisonidazole
(18FMISO): a comparative study of their selective uptake
in hypoxic cells and PET imaging in experimental rat tumors. Nucl
Med Biol. 30:317–326. 2003.
|
|
28
|
Buatti J, Ryken TC, Smith MC, Sneed P, Suh
JH, Mehta M and Olson JJ: Radiation therapy of pathologically
confirmed newly diagnosed glioblastoma in adults. J Neurooncol.
89:313–337. 2008. View Article : Google Scholar : PubMed/NCBI
|
|
29
|
Kaanders JH, Wijffels KI, Marres HA,
Ljungkvist AS, Pop LA, van den Hoogen FJ, de Wilde PC, Bussink J,
Raleigh JA and van der Kogel AJ: Pimonidazole binding and tumor
vascularity predict for treatment outcome in head and neck cancer.
Cancer Res. 62:7066–7074. 2002.PubMed/NCBI
|
|
30
|
Airley R, Loncaster J, Davidson S, Bromley
M, Roberts S, Patterson A, Hunter R, Stratford I and West C:
Glucose transporter glut-1 expression correlates with tumor hypoxia
and predicts metastasis-free survival in advanced carcinoma of the
cervix. Clin Cancer Res. 7:928–934. 2001.PubMed/NCBI
|
|
31
|
Thorwarth D, Eschmann SM, Holzner F,
Paulsen F and Alber M: Combined uptake of [18F]FDG and
[18F]FMISO correlates with radiation therapy outcome in
head-and-neck cancer patients. Radiother Oncol. 80:151–156.
2006.
|
|
32
|
Wyss MT, Honer M, Schubiger PA and
Ametamey SM: NanoPET imaging of [18F]fluoromisonidazole
uptake in experimental mouse tumours. Eur J Nucl Med Mol Imaging.
33:311–318. 2006.
|
|
33
|
Zimny M, Gagel B, DiMartino E, Hamacher K,
Coenen HH, Westhofen M, Eble M, Buell U and Reinartz P: FDG - a
marker of tumour hypoxia? A comparison with
[18F]fluoromisonidazole and pO2-polarography
in metastatic head and neck cancer. Eur J Nucl Med Mol Imaging.
33:1426–1431. 2006.
|
|
34
|
Gagel B, Piroth M, Pinkawa M, Reinartz P,
Zimny M, Kaiser HJ, Stanzel S, Asadpour B, Demirel C, Hamacher K,
Coenen HH, Scholbach T, Maneschi P, DiMartino E and Eble MJ:
pO2 polarography, contrast enhanced color duplex
sonography (CDS), [18F] fluoromisonidazole and
[18F] fluorodeoxyglucose positron emission tomography:
validated methods for the evaluation of therapy-relevant tumor
oxygenation or only bricks in the puzzle of tumor hypoxia? BMC
Cancer. 7:1132007.
|
|
35
|
Rajendran JG, Mankoff DA, O’Sullivan F,
Peterson LM, Schwartz DL, Conrad EU, Spence AM, Muzi M, Farwell DG
and Krohn KA: Hypoxia and glucose metabolism in malignant tumors:
evaluation by [18F]fluoromisonidazole and
[18F]fluorodeoxyglucose positron emission tomography
imaging. Clin Cancer Res. 10:2245–2252. 2004.
|
|
36
|
Cherk MH, Foo SS, Poon AM, Knight SR,
Murone C, Papenfuss AT, Sachinidis JI, Saunder TH, O’Keefe GJ and
Scott AM: Lack of correlation of hypoxic cell fraction and
angiogenesis with glucose metabolic rate in non-small cell lung
cancer assessed by 18F-Fluoromisonidazole and
18F-FDG PET. J Nucl Med. 47:1921–1926. 2006.PubMed/NCBI
|
|
37
|
Riesterer O, Honer M, Jochum W, Oehler C,
Ametamey S and Pruschy M: Ionizing radiation antagonizes tumor
hypoxia induced by antiangiogenic treatment. Clin Cancer Res.
12:3518–3524. 2006. View Article : Google Scholar : PubMed/NCBI
|
|
38
|
Wijffels KI, Marres HA, Peters JP, Rijken
PF, van der Kogel AJ and Kaanders JH: Tumour cell proliferation
under hypoxic conditions in human head and neck squamous cell
carcinomas. Oral Oncol. 44:335–344. 2008. View Article : Google Scholar : PubMed/NCBI
|
|
39
|
Rajendran JG, Wilson DC, Conrad EU,
Peterson LM, Bruckner JD, Rasey JS, Chin LK, Hofstrand PD, Grierson
JR, Eary JF and Krohn KA: [18F]FMISO and
[18F]FDG PET imaging in soft tissue sarcomas:
correlation of hypoxia, metabolism and VEGF expression. Eur J Nucl
Med Mol Imaging. 30:695–704. 2003.
|
|
40
|
Kubota K, Tada M, Yamada S, Hori K, Saito
S, Iwata R, Sato K, Fukuda H and Ido T: Comparison of the
distribution of fluorine-18 fluoromisonidazole, deoxyglucose and
methionine in tumour tissue. Eur J Nucl Med. 26:750–757. 1999.
View Article : Google Scholar : PubMed/NCBI
|
|
41
|
Dewhirst MW: Intermittent hypoxia furthers
the rationale for hypoxia-inducible factor-1 targeting. Cancer Res.
67:854–855. 2007. View Article : Google Scholar : PubMed/NCBI
|
|
42
|
Søvik A, Malinen E and Olsen DR:
Strategies for biologic image-guided dose escalation: a review. Int
J Radiat Oncol Biol Phys. 73:650–658. 2009.PubMed/NCBI
|