Introduction
Neuroblastoma (NB) is the most common and deadly
extra-cranial solid tumor of childhood. NBs, together with the more
differentiated, less aggressive ganglioneuromas and
ganglioneuroblastomas, form the neuroblastic tumors. They are all
derived from migratory, primitive precursor cells of the developing
sympathetic nervous system. NB tumors are graded according to INSS
stage, where stages 1 and 2 represent low-risk tumors and stages
3–4 high-risk tumors (1,2). Children that are diagnosed with NB
when they are over 1 year of age generally suffer from the advanced
stages of the disease. These NB tumors, especially stage 4, can
rapidly spread to regional lymph nodes and then to distal bone and
bone marrow, resulting in very poor patient prognosis. Infants
diagnosed with NB can present a unique pattern of metastatic spread
(stage 4S, S = Special) to the liver and skin, but only rarely to
bone or bone marrow. Remarkably, these metastasized tumors usually
undergo spontaneous regression and patients have excellent
prognosis (1,2). Important prognostic features of NB
tumors are therefore INSS stage and patient age at diagnosis. In
addition, recurrent genomic aberrations like MYCN gene
amplification can be used for patient stratification (1,2).
Unfortunately, these combined NB features are still too limited to
ensure early proper treatment stratification and new prognostic
markers are needed. In addition, NB treatment, especially of
metastasized tumors is still not sufficiently efficient and more
insight is needed into the molecular pathways involved in NB
metastasis.
Prenylated Rab acceptor 1 domain family, member 2
(PRAF2, initially described as JM4) is a 19-kDa protein with four
transmembrane-spanning domains. PRAF2 belongs to the PRAF family of
vesicle transport-associated proteins. Members of the PRAF family
are structurally related and contain a large prenylated Rab
acceptor 1 (PRA1) domain. These PRAF proteins are localized in the
ER, Golgi and vesicular structures of the cell (3,4).
PRAF2 was first discovered as an interacting protein of human
chemokine receptor 5 (CCR5) (3)
and of human glycerophosphoinositol phosphodiesterase (GDE1/MIR16)
(5). Human PRAF2 is highly
expressed in numerous tissues: small intestine, lung, spleen,
pancreas and most significantly in the brain. Furthermore,
overexpression of PRAF2 is observed in tumor tissue samples of
breast, colon, lung and ovary, compared to matched normal tissue
samples (4,6,7).
The other two members of PRAF protein family (PRAF1
and PRAF3) have already been extensively studied and their
biological function has been characterized. In fact, many of these
studies associated PRAF1 and PRAF3 with several well-known cancer
signaling pathways. For instance, PRAF1 (also known as Rabac1,
PRA1, prenylin and Yip3), a Golgi complex, post-Golgi vesicle and
endosomal transmembrane protein, was initially identified to
interact with small GTPase proteins that regulate intracellular
vesicle trafficking (8–10). In addition, PRAF1 has a crucial
role in colorectal tumorigenesis by regulating the nuclear
transport of β-catenin in TCF/β-catenin signaling (11). PRAF1 functions in Epstein-Barr
virus (EBV)-induced transformation: it binds and modulates the
anti-apoptotic activity of BHRF1, an EBV-encoded early protein and
enhances nuclear import of the oncogenic EBV-encoded latent
membrane protein 1 (LMP1) (12,13).
PRAF3 (also known as JWA, GTRAP3–18 and Arl6-IP5) is
an integral ER membrane protein that is upregulated by retinoic
acid (RA) and then activates the excitation amino acid carrier 1
(EAAC1), a primary neuronal glutamate transporter (14,15).
PRAF3 is also defined as a potential inhibitor of cancer cell
migration by regulation of the MAPK signaling pathway and F-actin
cytoskeleton (16). PRAF3 was
found to inhibit melanoma metastasis by suppressing integrin αvβ3
signaling, a key factor in tumor metastasis. Downregulation of
PRAF3 in melanoma cells significantly increased integrin αvβ3
expression (both at mRNA and protein level) and accelerated cell
adhesion, migration and invasion in vitro and enhanced
melanoma lung metastasis in vivo.
Unlike PRAF1 and PRAF3, PRAF2 has not yet been
widely studied and its functional role therefore remains largely
unknown. Previously, our lab found PRAF2 as a candidate prognostic
marker of neuroblastic tumors. We observed high level of PRAF2 mRNA
in most neuroblastic tumor samples. We also found that PRAF2
protein is strongly expressed in all 24 NB cell lines tested,
including SK-N-SH (17). Despite
these discoveries, the molecular role of PRAF2 in NB tumorigenesis,
or in other tumors in which it is highly expressed, has remained
unexplored. Therefore, in this study, we generated NB cell lines
that stably downregulate endogenous PRAF2 expression by RNA
interference (RNAi). We used these PRAF2 knockdown NB cell lines to
investigate the function of PRAF2 in NB tumorigenesis. Metastasis
is the main cause of death in NB patients, but its underlying
mechanisms remain elusive. Considering the role of its homolog
PRAF3 in melanoma invasion and metastasis, we were especially
interested to find out if PRAF2 is involved in NB metastasis and
therefore focused on cell migration and matrix-attachment.
Materials and methods
Cell line culture
The human NB cell line SK-N-SH was purchased from
the American Type Culture Collection (Manassas, VA). Cells were
maintained in RPMI-1640 (Media tech Inc., Manassas, VA) containing
10% heat-inactivated fetal bovine serum (FBS) (Invitrogen Corp.,
Carlsbad, CA) at 37°C in a humidified atmosphere containing 5%
CO2. Cells were counted using a hemocytometer in the
presence of trypan blue (Sigma-Aldrich, St. Louis, MO).
Construction of stable PRAF2 knockdown NB
cell lines
HuSH 29-mer short hairpin RNA (shRNA) expression
constructs against PRAF2 (shPRAF2) and GFP (scrambled; as a
negative control) were purchased from Origene Technologies
(Rockville, MD). SK-N-SH cells were seeded in 6-well culture plates
(Greiner Bio-One Inc., Monroe, NC) at a concentration of
5.0×10⁵ cells per well and transfected with 4 μg
shPRAF2 or scrambled plasmid using Lipofectamine 2000 (Invitrogen).
Transfected cells were incubated for 24 h at 37°C as described
above and subsequently selected using 1.0 μg/ml puromycin
(Sigma-Aldrich). After selection for 2 weeks, cells retaining the
shPRAF2 (SK-shPRAF2) or scrambled expression vector (SK-Sc) were
maintained at 100 ng/ml puromycin.
Western blot analysis
For total protein isolation, medium was removed by
aspiration, adherent cells were washed twice in ice-cold DPBS
(Dulbecco’s phosphate buffered saline, Mediatech) and cell lysates
prepared by scraping on ice into radioimmunoprecipitation assay
(RIPA) buffer [20 mM Tris-HCl (pH 7.5), 0.1% (w/v) sodium lauryl
sulfate, 0.5% (w/v) sodium deoxycholate, 135 mM NaCl, 1% (v/v)
Triton X-100, 10% (v/v) glycerol, 2 mM EDTA], supplemented with
Complete Protease Inhibitor Cocktail (Roche Diagnostic Corp.,
Indianapolis, IN) and phosphatase inhibitors (20 mM sodium fluoride
and 0.27 mM sodium vanadate). Lysate samples were resuspended by
rotation at 50 rpm and 4°C for at least 30 min and clarified by
centrifugation for 15 min at 14,000 rpm and 4°C. The supernatant
was stored at − 20°C until further use. Total protein concentration
was determined by Bradford dye reagent protein assay (Bio-Rad
Laboratories Inc., Richmond, CA). Laemmli buffer (Bio-Rad)
containing 10% (v/v) β-mercaptoethanol (VWR International,
Brisbane, CA) solution was added to the lysates and boiled for 5
min. Ten micrograms total protein was resolved by 12% sodium
dodecyl sulfate-polyacrylamide gel electrophoresis (SDS-PAGE) and
electrotransferred onto a polyvinylidene difluoride (PVDF) membrane
(Immobilon-P, VWR International). Membranes were incubates with
rabbit polyclonal PRAF2, peptide-blocked rabbit polyclonal PRAF2
(PRAF2-P) (QED Bioscience, San Diego, CA), or rabbit monoclonal
α-tubulin (Cell Signaling Technology, Danvers, MA) primary
antibodies. The membranes were then washed and incubated with
enhanced chemiluminescence (ECL) rabbit or mouse IgG, horseradish
peroxidase (HRP)-linked secondary antibody (GE Healthcare
Biosciences, Pittsburgh, PA). Subsequently, membranes were again
washed and protein-antibody complexes were detected using ECL plus
western blotting detection reagents (GE Healthcare Biosciences) and
Blue Lite Autorad Film (ISC BioExpress, Kaysville, UT). Bands were
quantified using the Bio-Rad Multi Imager and its Quantity One
Quantification software.
Cell viability assay
Cells (1.0×10⁴ cells in 0.1 ml) were
seeded in 96-well microtiter plates (Greiner Bio-One Inc.) and
incubated for 24, 48 or 72 h. For each time point, 20 μl of
CellTiter 96 AQueous One Solution Reagent (Promega Bioscience Inc.,
San Luis Obispo, CA) was added to wells and incubated at 37°C for 3
h. The conversion of MTS tetrazolium to soluble formazan in cell
cultures was measured at 490 nm using an HTS 7000 Plus Microplate
Reader (Perkin-Elmer, Waltham, MA). Optical density (OD) readings,
proportional to the number of viable cells, were calculated and
evaluated using Microsoft Excel.
Cell proliferation assay
Cell proliferation was determined with the EMD BrdU
Cell Proliferation Assay kit (EMD Biosciences Inc., San Diego, CA),
following the manufacturer’s protocol. Briefly, cells were seeded
and grown as above. For each time point, 20 μl of BrdU label
was added to cell cultures and allowed to incorporate into DNA for
2 h at 37°C. Cells were fixed and denatured, upon addition of 200
μl fixative/denaturing solution, for 30 min at room
temperature. Anti-BrdU antibody (1:100) was added and incubated for
1 h at room temperature to bind incorporated BrdU label. Unbound
BrdU antibodies were removed by washing three times with wash
buffer. Peroxidase goat anti-mouse IgG HRP conjugate (200
μl) was added and incubated for 30 min at room temperature.
Cells were washed twice with wash buffer and once with deionized
water. Cells were incubated in 100 μl substrate solution for
15 min in the dark at room temperature, after which 100 μl
stop solution was added to the cells. Absorbance was measured
immediately at 450 nm using the HTS 7000 Plus Microplate Reader. OD
readings, representing cell proliferation, were calculated and
evaluated using Microsoft Excel.
Cell cycle analysis
Cells (1.0×10⁶ cells in 1 ml) were seeded
in 60-mm culture plates (Greiner Bio-One Inc.) and incubated for 24
h. Cells were trypsinized, washed twice in DPBS and counted using a
hemocytometer. Cells were pelleted by centrifugation at 1,500 rpm
and resuspended to 2.0×10⁶ cells/ml DPBS. One million
cells per 5 ml polystyrene tube (Fisher Scientific, Pittsburgh, PA)
were fixed by slow addition of 1.5 ml 70% ice-cold ethanol (Fisher
Scientific) under gentle vortexing. Ethanol-fixed cells were
incubated in an ice bath for 1 h, pelleted again and washed twice
in DPBS. Cells were then resuspended and stained with 0.5 ml
PI/RNase staining buffer (Becton-Dickinson Biosciences, San Jose,
CA) for 15 min at room temp in the dark. Finally, stained cells
were resuspended in 1 ml DPBS. A minimum of 10,000 cells was
analyzed using the FACScan flow cytometry instrument and its
CellQuest software (Becton-Dickinson).
Wound-healing assay
Cell migration in vitro was determined using
the wound-healing assay as described by Valster et
al(18). Briefly, cells were
cultured to confluency in a 6-well culture plate and wounds
scratched through the monolayer using a sterile 20 μl
pipette tip. Cells were carefully washed several times with DPBS to
remove floating cells and fresh medium was added back without
detaching cells. Cell images were taken at 0, 6, 12, 18 and 24 h
using a Leica DM-IL digital microscope (Leica Microsystems, Buffalo
Grove, IL). The rate of wound closure was calculated as the ratio
of the migrated cell surface area divided by the total surface
area.
Adhesion assay
Immulon-2 96-well microtiter plates (Fisher
Scientific) were pre-coated with 10 μg/ml fibronectin (FN),
vitronectin (VN), or laminin (LM) (all from Sigma) or not coated
and incubated overnight at 4°C. Substrates were removed by
aspiration and blocking solution (2% BSA heat-inactivated in DPBS)
was added to coated and uncoated wells and incubated for 2 h at
room temperature. Afterwards, wells were washed with serum-free
RPMI. Cells (50,000 cells in 0.1 ml) were seeded and incubated for
90 min at 37°C and then washed with DPBS until cells in the
BSA-only coated control wells were completely removed. Attached
cells were fixed with 50% (v/v) glutaraldehyde in DPBS for 20 min
at room temperature, after which the solution was removed by
aspiration and the cells allowed to air-dry for 5 min. Cells were
then stained with 0.5% crystal violet in 20% methanol for 45 min
and washed three times with DPBS. The cells were air-dried and
solubilized in 10% acetic acid for 30 min. Absorbance was measured
at 560–590 nm using a Perkin-Elmer HTS 7000 Plus microplate reader.
OD readings, representing the number of adherent cells, were
calculated and evaluated using Microsoft Excel.
Affymetrix DNA micro-array hybridization
and analysis
The Affymetrix NB tumor dataset Versteeg-88 contains
the mRNA expression profiles of 88 NB tumors with documented
genetic and clinical features and has been described (19). Total RNA was extracted from frozen
NBs containing >95% tumor cells and Affymetrix HG-U133 Plus 2.0
micro-array analysis (Affymetrix, Santa Clara, CA, USA) performed
as described (20). The
Versteeg-88 set has been deposited for public access in a
MIAME-compliant format through the Gene Expression Omnibus (GEO)
database at the NCBI website (21)
under number GSE16476. Public domain data-sets Hiyama-51
(GSE16237), Jagannathan-100 (GSE19274), Łastowska-30 (GSE13136),
Maris-101 (GSE3960) were also from the NCBI GEO site, the
Oberthuer-251 set (E-TABM-38) was from EMBL-EBI ArrayExpress.
Annotations and clinical data for the tissue samples analyzed are
available from http://www.ncbi.nlm.nih.gov/geo/query/ or http://www.ebi.ac.uk/arrayexpress/ thru their GEO
or EMBL-EBI ID’s, respectively. CEL data for all data-sets were
downloaded and analyzed as previously described (20). Briefly, gene transcript levels were
determined from data image files using GeneChip operating software
(MAS5.0 and GCOS1.0, from Affymetrix). Samples were scaled by
setting the average intensity of the middle 96% of all probe-set
signals to a fixed value of 100 for every sample in the dataset,
allowing comparisons between micro-arrays. The TranscriptView
genomic analysis and visualization tool was used to check if
probe-sets had an anti-sense position in an exon of the gene
(http://bioinfo.amc.uva.nl/human-genetics/transcriptview/).
The Affymetrix probe-set selected for PRAF2, 203456_at meets these
criteria and showed significant expression in all 88 samples in the
Versteeg-88 set. Analyses were performed using R2; an Affymetrix
analysis and visualization platform developed in the Department of
Human Genetics at the Academic Medical Center, University of
Amsterdam. R2 can be accessed at: http://r2.amc.nl.
Statistical analyses
PRAF2 correlation with survival probability was
evaluated by Kaplan-Meier analysis using the Wilcoxon log-rank test
as described (22). PRAF2
expression and correlation with NB clinical and genetic features
were determined using the non-parametric Kruskal-Wallis test;
correlation with other gene expressions was calculated with a 2log
Pearson test. The significance of a correlation is determined by t
= R/sqrt[(1−r^2)/(n−2)], where R is the correlation value and n is
the number of samples. Distribution measure is approximately as t
with n-2 degrees of freedom. The statistical significance of the
effects on NB cell viability, proliferation, cell cycle and
adhesion were determined using the statistical Student’s t-test.
For all tests, P<0.05 was considered statistically
significant.
Results
PRAF2 expression correlates with NB
parameters indicative of poor outcome
We have previously shown that PRAF2 expression is
higher in neuroblastic tumors than in most other cancers. To
explore the potential role of PRAF2 in NB, the most aggressive
neuroblastic tumor, we investigated PRAF2 expression in a new
cohort of NB tumors. We analyzed a series of 88 NB tumors for which
extensive genetic and clinical features were available from patient
files (‘Versteeg-88’, Academic Medical Center at the University of
Amsterdam) using the genome-wide HG-U133 Plus 2.0 Affymetrix DNA
microarray. We found that PRAF2 was efficiently expressed in all 88
NB samples. Since MYCN amplification is the most dependable
prognostic marker and is associated with very poor prognosis, we
investigated a possible correlation PRAF2 expression. Fig. 1A shows that PRAF2 is significantly
higher in MYCN-amplified tumors than in tumors with a
diploid MYCN gene complement (P=9.7×10⁻⁴;
Fig. 1A). In addition, PRAF2
expression is higher in patients diagnosed when they are older than
1 year old than in younger patients (P=4.9×10⁻³;
Fig. 1B). Since high PRAF2
expression is correlated to two unfavorable clinical parameters of
NB, it was not surprising that PRAF2 expression in tumor samples
taken from NB patients that have since died is significantly higher
than that in NB from patients that are still alive at the time of
analysis (P=3.1×10⁻⁶; Fig.
1C). To assess the predictive value of PRAF2 expression, we
performed Kaplan-Meier analysis. The most significant P-value was
found when the Versteeg-88 set was divided into a group of 20 with
high and of 68 with low expression of PRAF2 mRNA, but also for most
other groupings within the set, high PRAF2 expression was
significantly indicative for poor outcome (Fig. 1D). Survival of patients with low
PRAF2 expression (n=68) was ∼80% for up to 216 months, while that
for patients with high PRAF2 expression (n=20) dropped to 20%
within 48 months (P=9.6×10⁻⁶; Fig. 1D). Not surprisingly therefore, when
PRAF2 expression was investigated with respect to INSS stage, we
found that PRAF2 expression was highest in the most aggressive,
stage 4 tumors, that often and rapidly metastasize to lymph nodes,
bone and bone marrow and are the major cause of
neuroblastoma-related death. Of note, PRAF2 expression was
significantly higher in stage 4 tumors than in any other stage
(P<0.05; Fig. 1E), including
stage 4S tumors. Since these tumors can metastasize to skin and
liver but have an extremely good prognosis, this would suggest
PRAF2 has a role in clinically important, but not 4S metastasis
processes. Together, the results from the Versteeg-88 set strongly
suggest a role for PRAF2 in tumor cell survival and aggressive
tumor growth and metastasis. To investigate the robustness of these
observations in the NB series presented in this report, we
investigated the correlations found between PRAF2 expression and NB
clinical parameters in five additional NB series in the public
domain (Table I). We observed
similar patterns for PRAF2 mRNA expression in these independent
series, suggesting that the results obtained with the Versteeg-88
set are representative. However, as noted before, the molecular
role of PRAF2 in these processes is still completely unknown.
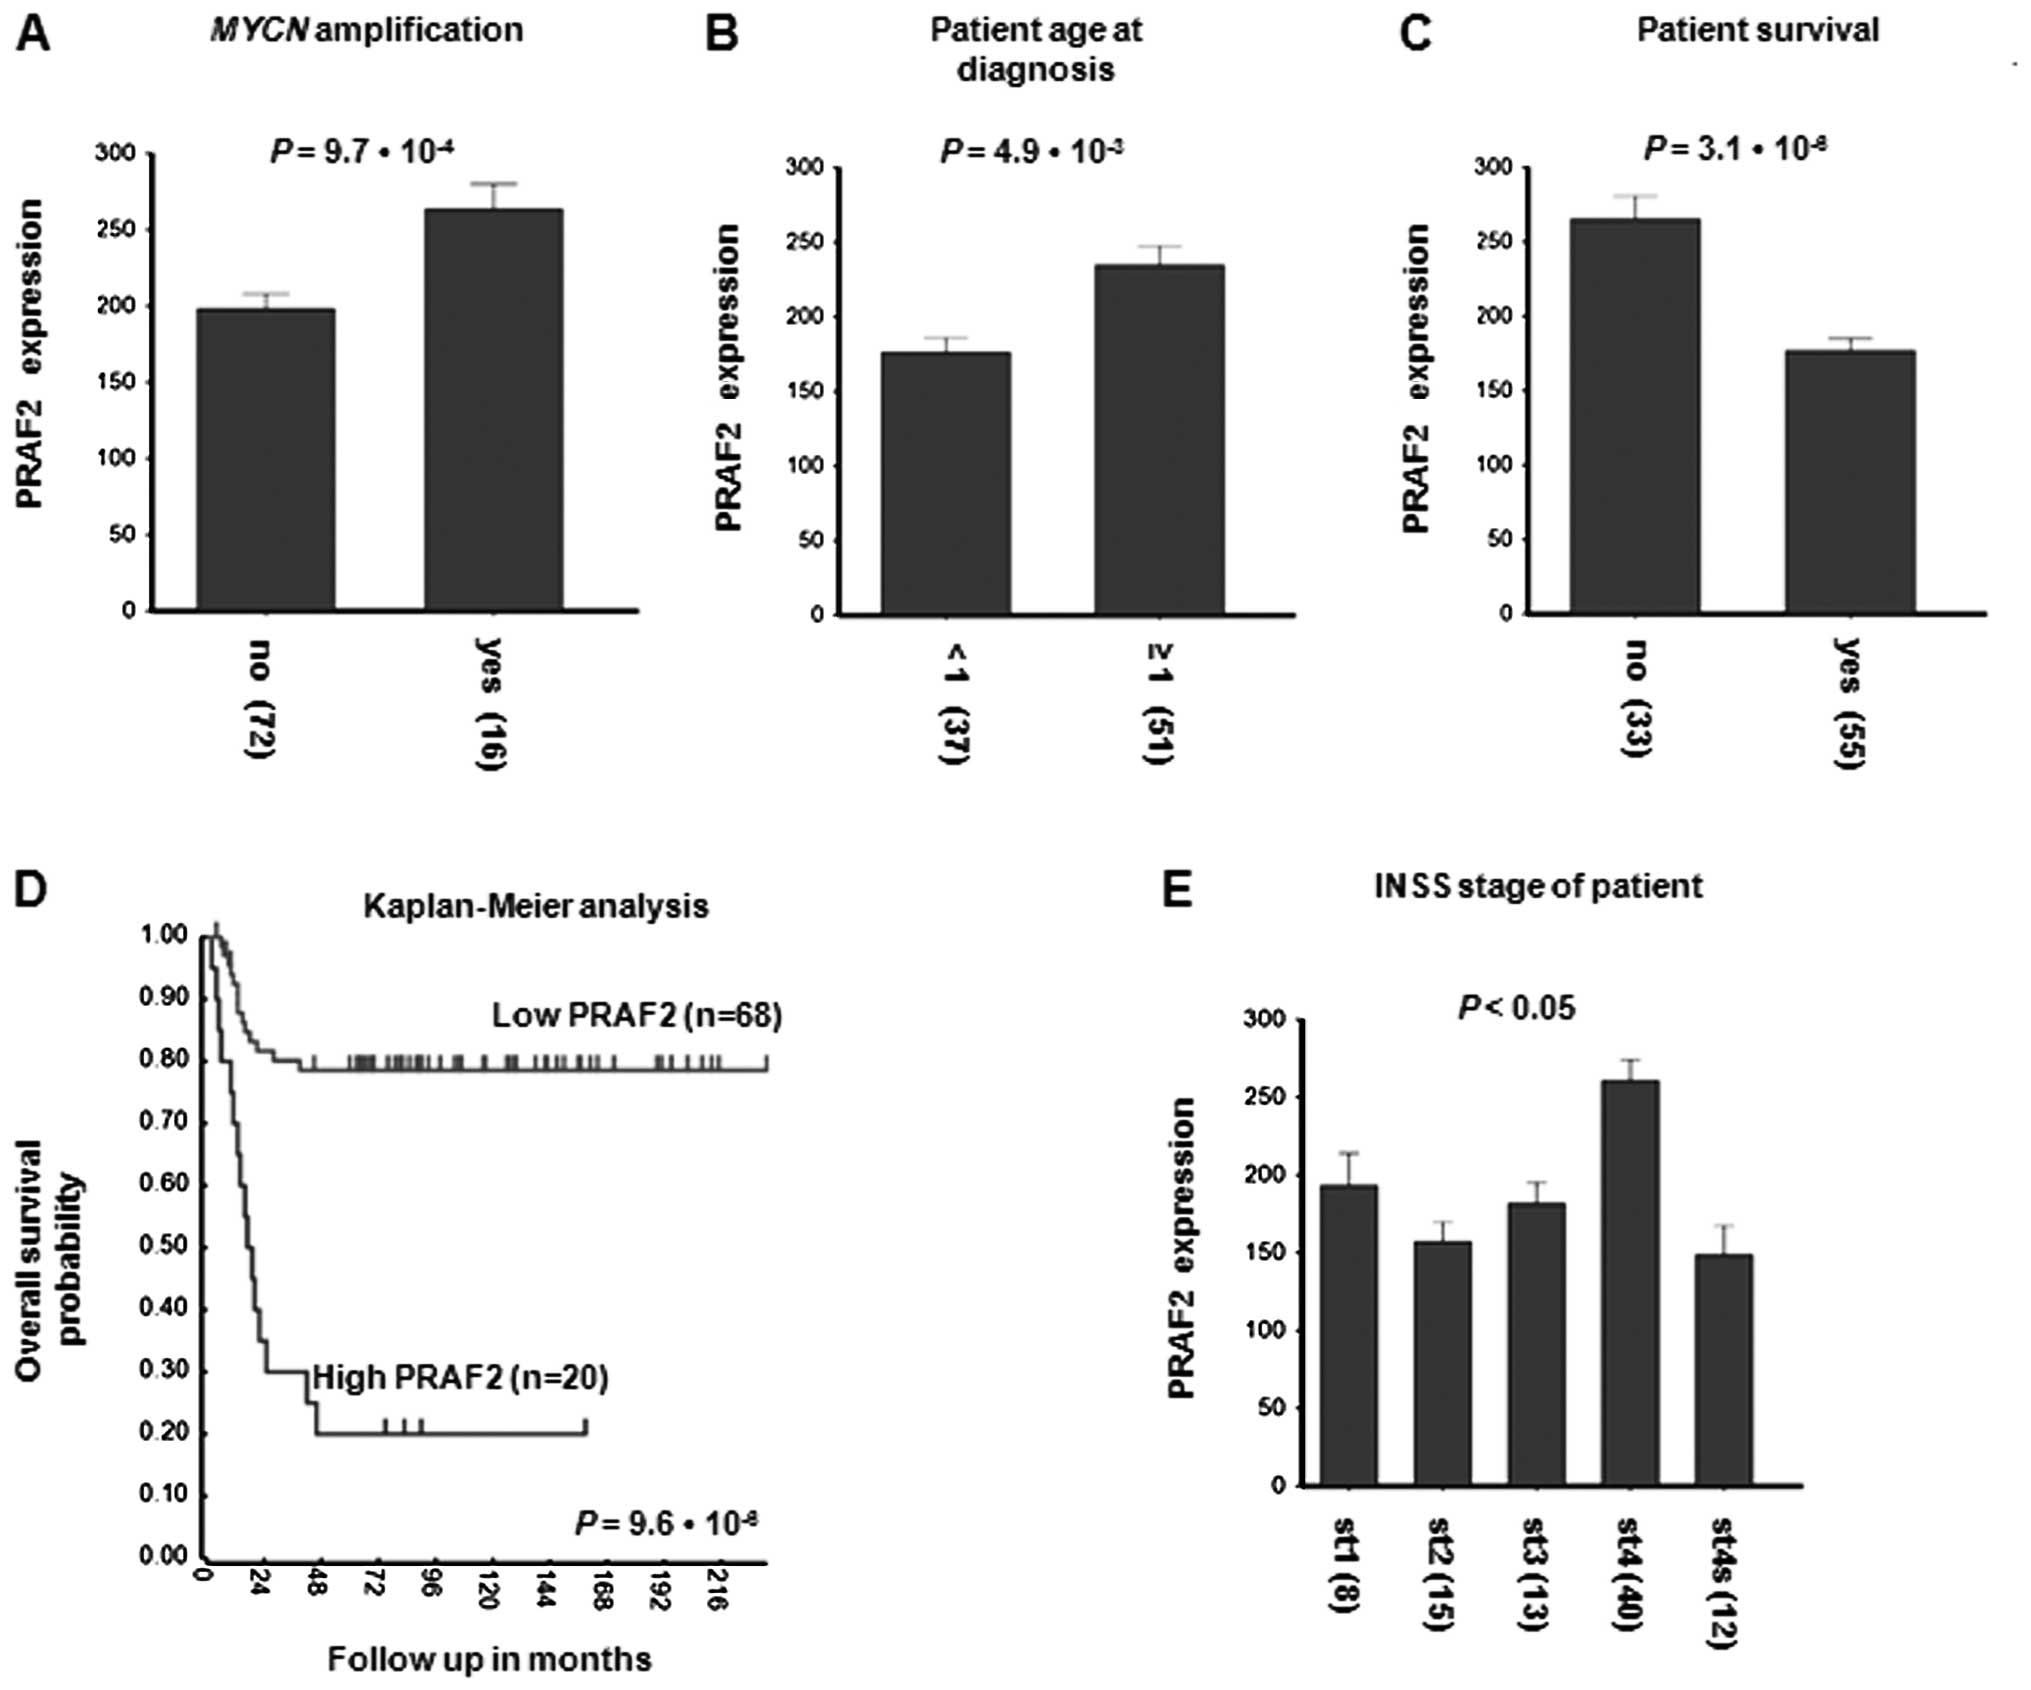 | Figure 1Correlation of PRAF2 expression with
clinical features of NB. PRAF2 mRNA expression was examined by
Affymetrix micro-array in the Versteeg-88 series of 88 NB tumors
with full clinical description and compared with important clinical
parameters. PRAF2 mRNA expression correlates with (A) tumor
MYCN amplification, (B) age at diagnosis, (C) patient
survival during follow-up, (D) patient survival probability and (E)
INSS stage of the disease. (A) NB patients with tumor MYCN
amplification (16 samples) expressed significantly higher PRAF2
levels than patients without tumor MYCN amplification (72
samples; P=9.7×10⁻⁴). (B) NB patients that were
diagnosed above the age of 1 year (higher risk; 51 samples)
expressed significantly higher PRAF2 tumor levels than patients
that were diagnosed below this age (lower risk; 34 samples;
P=4.9×10⁻³). (C) NB patients that were still alive at
the time of analysis (55 samples) expressed significantly higher
PRAF2 tumor levels than patients who had died before that time (33
samples; P=3.1×10⁻⁶). (D) PRAF2 gene expression
correlates with NB patient survival prognosis. Shown is a
Kaplan-Meier graph representing the survival prognosis of 88 NB
patients based on high or low expression levels of PRAF2. The
survival probability of NB patients (follow-up >216 months) with
high PRAF2 expression is significantly lower than of patients with
low PRAF2 expression. For the Kaplan-Meier analysis, the P-values
were calculated for all 72 groups tested (minimum group size = 8).
For PRAF2, the 20 ‘high’ versus the 68 ‘low’ group represents the
highest P-value (P=9.6×10⁻⁶), but the P-value was
<0.05 for all groups from 28 low/60 high to 77 low/11 high. Also
when the 88 tumors were divided using the median or average PRAF2
expression, P-value was <0.05, showing that PRAF2 expression has
a robust correlation with survival. Statistical analysis was
performed with the Wilcoxon log-rank test. (E) Children with NB
tumor stages 1, 2, 3 or 4S (8, 15, 13 or 12 samples, respectively)
expressed significantly lower-level PRAF2 tumor levels than
children with tumor stage 4 (40 samples; stage 4 comparison to any
other stage has P<0.05). Statistical analysis of (A–C) and (E)
was performed using the non-parametric Kruskal-Wallis tests, but
for reasons of representation, the bar plots show actual expression
values. Numeric values in parentheses indicate the number of
evaluated NB patient tumor samples. For expression value
calculations in all panels, see Materials and methods. |
 | Table IPRAF2 correlations with clinical
parameters in additional NB tumor sets in the public domain. |
Table I
PRAF2 correlations with clinical
parameters in additional NB tumor sets in the public domain.
| Set | Kaplan-Meier | Survival | INSS | MYCNA | Platform |
|---|
| Hiyama-51 | ND | Lower in alive | ST4 highest | NS | Affymetrix HG-U133
Plus 2.0 |
|
Jagannathan-100 | ND | Lower in
low-risk | ST3 higher than
ST4 | Higher in MNA | Illumina HWG
6V2 |
| Łastowska-30 | ND | ND | ST4 highesta | NS | Affymetrix HG-U133
Plus 2.0 |
| Maris-101 | ND | ND | ST4 highest | Higher in MNA | Affymetrix HG-U95
Av2 |
| Oberthuer-251 | Poor prognosis | Lower in alive | ST4 highest | Higher in MNA | Amexp255 |
| Versteeg-88 | Poor prognosis | Lower in alive | ST4 highest | Higher in MNA | Affymetrix HG-U133
Plus 2.0 |
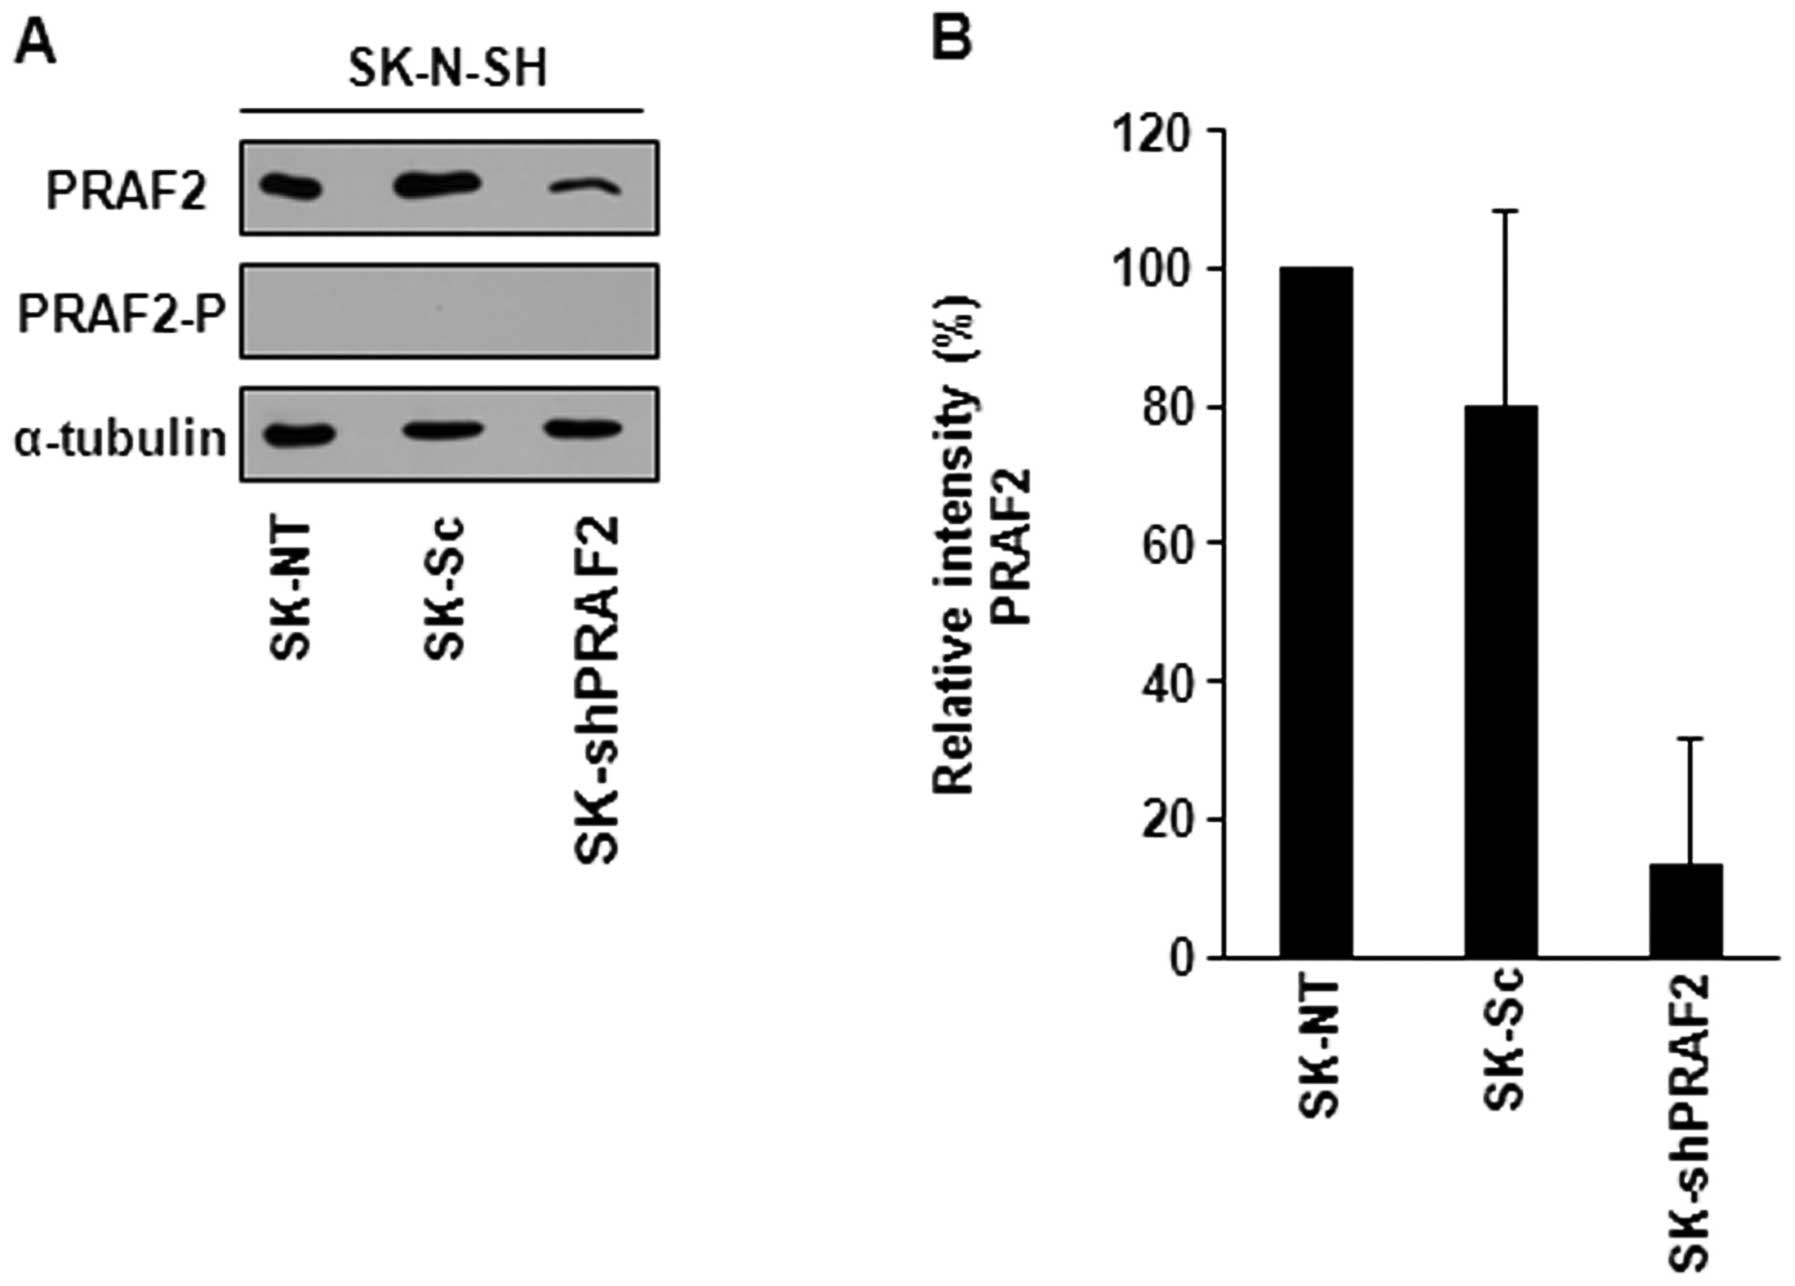
Generation of stable PRAF2 knockdown NB
cells using shRNA
To confirm a role for PRAF2 in NB progression and to
gain insight into the molecular pathways downstream of PRAF2
function, we generated PRAF2 knockdown NB cell lines using shRNA.
We stably transfected PRAF2 shRNA (shPRAF2) or scrambled control
shRNA (Sc) expression vectors into SK-N-SH NB cells, grew
shRNA-expressing clones and analyzed the PRAF2 protein content of
these clones by western blotting. We used the peptide-blocked PRAF2
antibody (PRAF2-P) to confirm that the PRAF2 bands we detected are
specific. PRAF2-P antibody prevents PRAF2 from binding. As
expected, PRAF2-P antibody did not recognize PRAF2 (Fig. 2A). PRAF2 shRNA-transduced SK-N-SH
cells (SK-shPRAF2) showed ∼80% decrease in PRAF2 protein expression
in comparison with control cells.
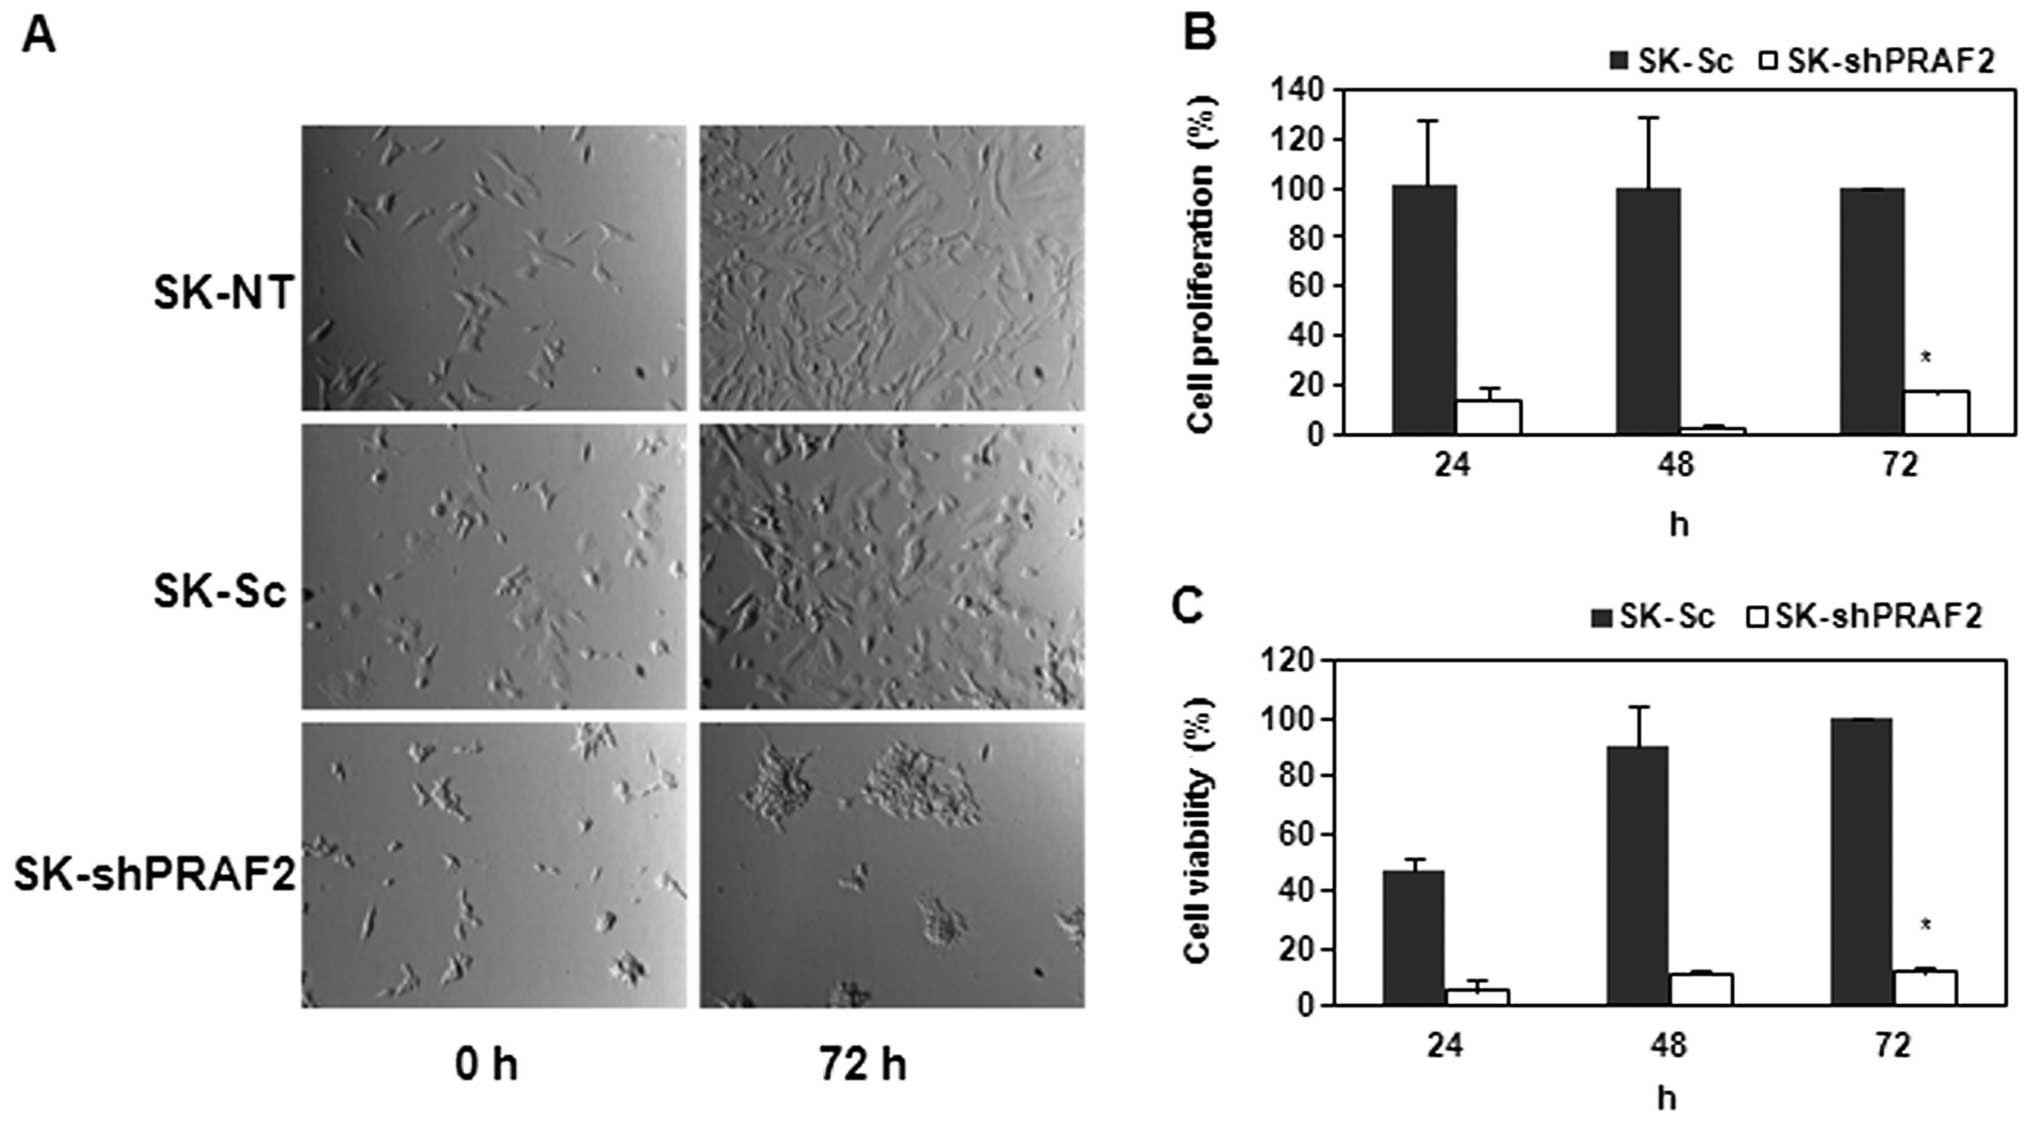
Upon establishment of this PRAF2 knockdown NB cell
line, we investigated the effect of PRAF2 downregulation in these
NB cells by observing their phenotypic morphology and viability. To
this end, we seeded equal numbers of shPRAF2-and Sc-expressing
cells. Strikingly, we found that SK-shPRAF2 cells were less able to
grow confluent than both SK controls cells, non-transfected (-NT)
and scrambled (-Sc) control cells, after 72-h incubation (Fig. 3A). These data suggest down
regulation of PRAF2 inhibits cell growth and/or adhesion in NB
cells.
PRAF2 is essential for NB cell
proliferation
We therefore examined whether PRAF2 knockdown
regulates the proliferation of NB cells. First, we used the MTS
assay to determine the cell viability of SK-shPRAF2 compared to
that of SK control cells. As shown in Fig. 3C, SK-Sc showed steadily increasing
metabolic activity indicative of viable cell growth, while
SK-shPRAF2 remained at very low levels even after 72-h incubation.
We further investigated the effect of PRAF2 down-regulation in
SK-N-SH cell proliferation using the BrdU cell proliferation assay.
We found that downregulation of PRAF2 significantly suppressed the
cell proliferation of SK-N-SH cells by ∼80% compared to that of
SK-Sc after 24, 48 or 72 h (Fig.
3B). The steady decrease in BrdU incorporation suggests that
SK-shPRAF2 cells are severely defective in DNA synthesis and hardly
undergo cell division. Together, these results show that silencing
PRAF2 suppresses the proliferation of NB cells. Similar
observations were made with another stable NB cell line (data not
shown).
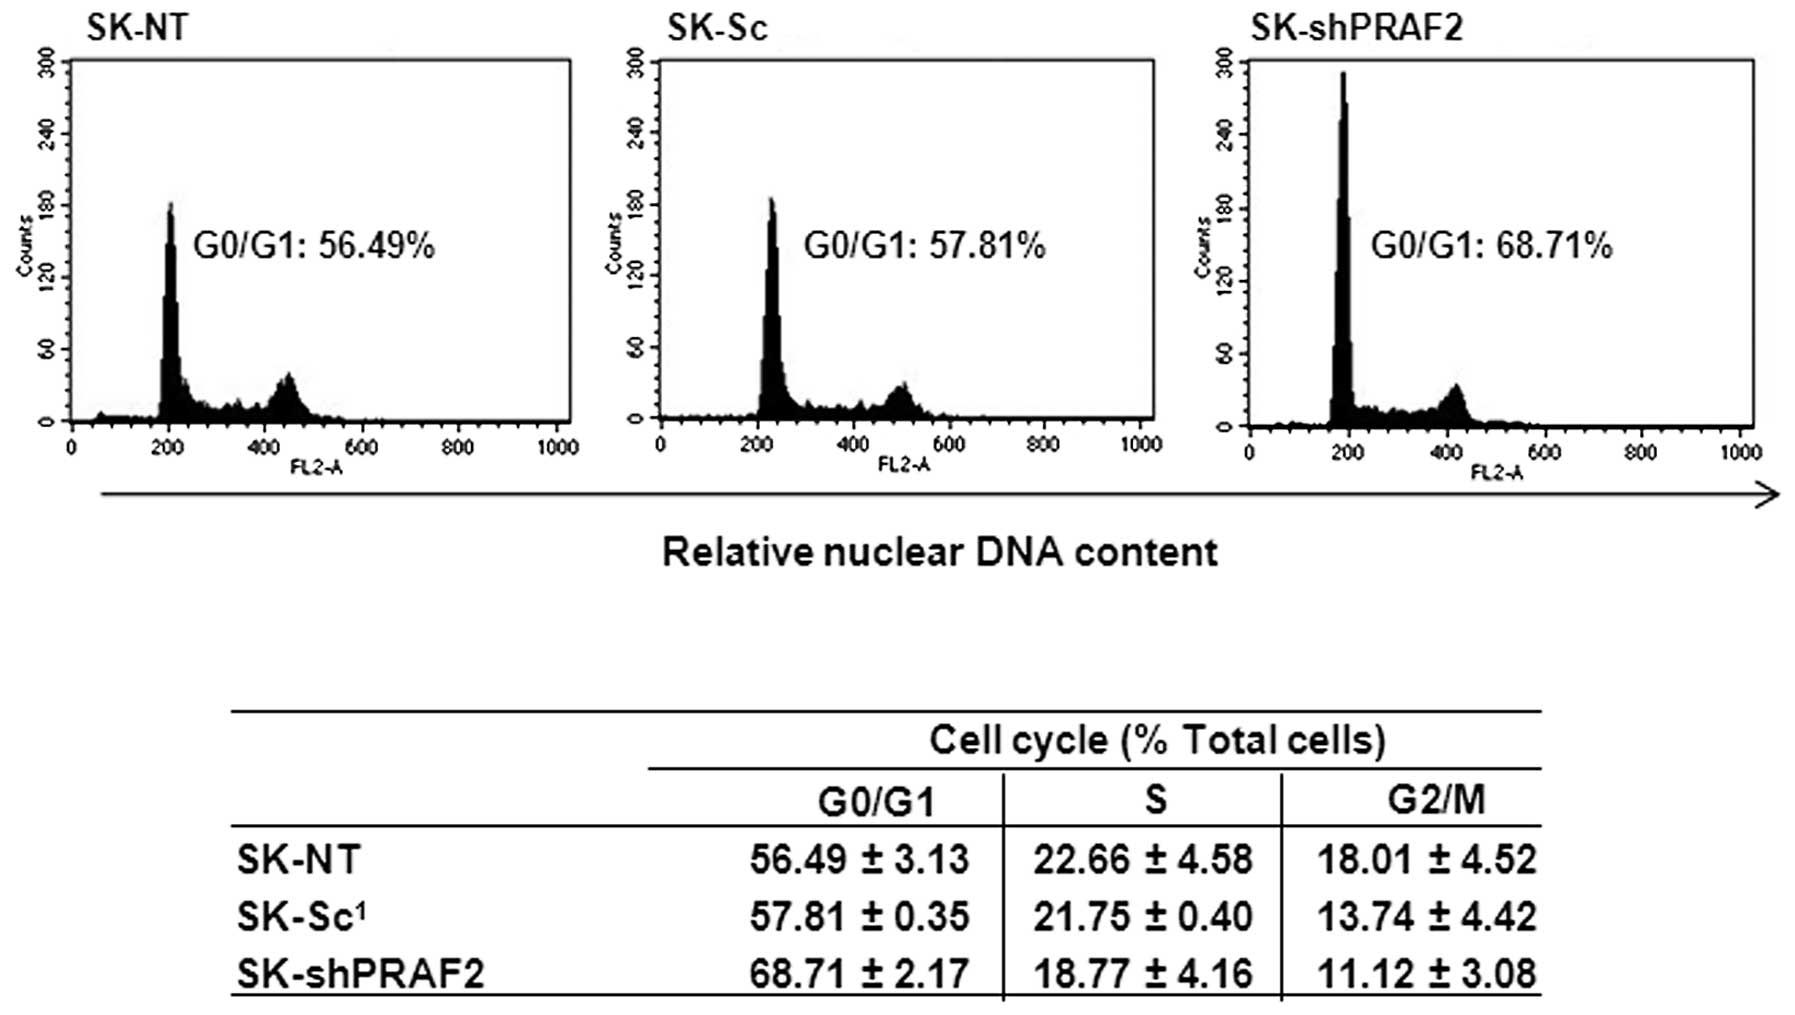
PRAF2 regulates G1-S cell
cycle transition in NB
Since PRAF2 downregulation effectively suppresses
the proliferation rate of NB cells and also seems to inhibit DNA
synthesis, we wanted to further analyze if this effect is linked
with cell cycle abrogation. In order to examine this, we performed
cell cycle analysis by PI staining and FACS analysis of SK-shPRAF2
nuclei 24 h after seeding and compared with those of SK control
cells -NT and -Sc. As shown in Fig.
4, we observed an increase in G1 population (∼68%)
in the SK-shPRAF2 cells compared with SK-NT (∼55%) and SK-Sc (∼58%)
control cells. The increase in G1 was accompanied by a
similar decrease in S and G2/M phase. No changes were apparent in
the sub-G1 fraction, suggesting the observed decrease in
proliferation was not due to an increase in apoptosis. Together,
these data strongly indicate that PRAF2 downregulation inhibits the
proliferation of NB cells by causing a G1 cell cycle
arrest, explaining at least part of the decreased cell growth
observed in Fig. 3.
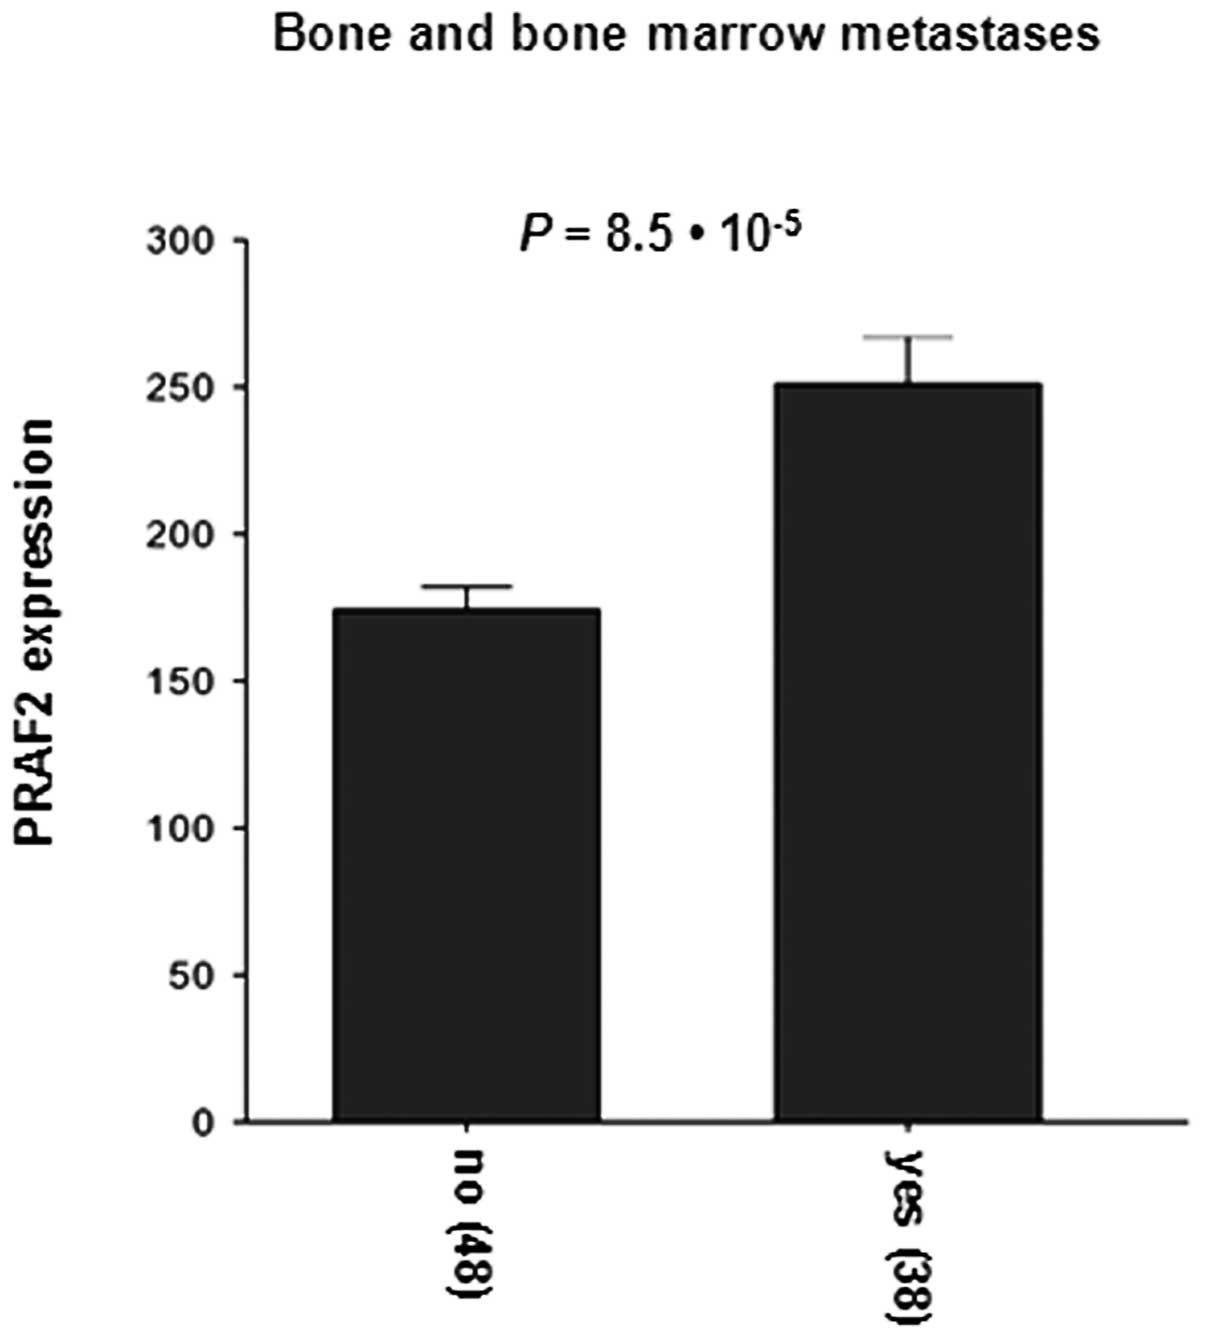
PRAF2 downregulation inhibits NB cell
migration
The results obtained in Fig. 4 clearly suggest that PRAF2
expression was important for NB cell growth, but decreased
confluence, observed in Fig. 3
could also result from lower cell adhesion efficiency. PRAF2
expression is highest in ST4 NB tumors (Fig. 1E), which often metastasize. We
investigated PRAF2 expression in correlation with NB metastasis.
Strikingly, PRAF2 expression was notably higher in both bone and
bone marrow-metastasized tumors (P=8.5×10⁻⁵; Fig. 5) than in local tumors. These
results show that high level of PRAF2 is also associated with NB
metastasis.
By using the SK-shPRAF2 cells, we tested the effect
of PRAF2 knockdown on NB cell migration in vitro. We used
the wound-healing assay to investigate and compare the migration
ability of SK-shPRAF2 cells with -NT and -Sc control cells. As
shown in Fig. 6A and B, PRAF2
knockdown produced SK-N-SH cells with a marked delay in wound
closure, >24 h, while both -NT and -Sc control cells showed
complete wound closure after only 12-h incubation. Finally, we
examined whether downregulation of PRAF2 regulates NB cell
attachment on fibronectin, vitronectin and laminin using an
adhesion assay. The results show that PRAF2 knockdown considerably
decreased the cell attachment ability of SK-N-SH cells on all three
substrates: fibronectin (∼75%), vitronectin (∼80%) and laminin
(∼55%) (Fig. 6C). These data
confirm a role for PRAF2 in regulating NB tumor cell migration and
suggest involvement of PRAF2 in high-stage NB, providing urgently
needed clues for unraveling the mechanisms involved in NB
metastasis.
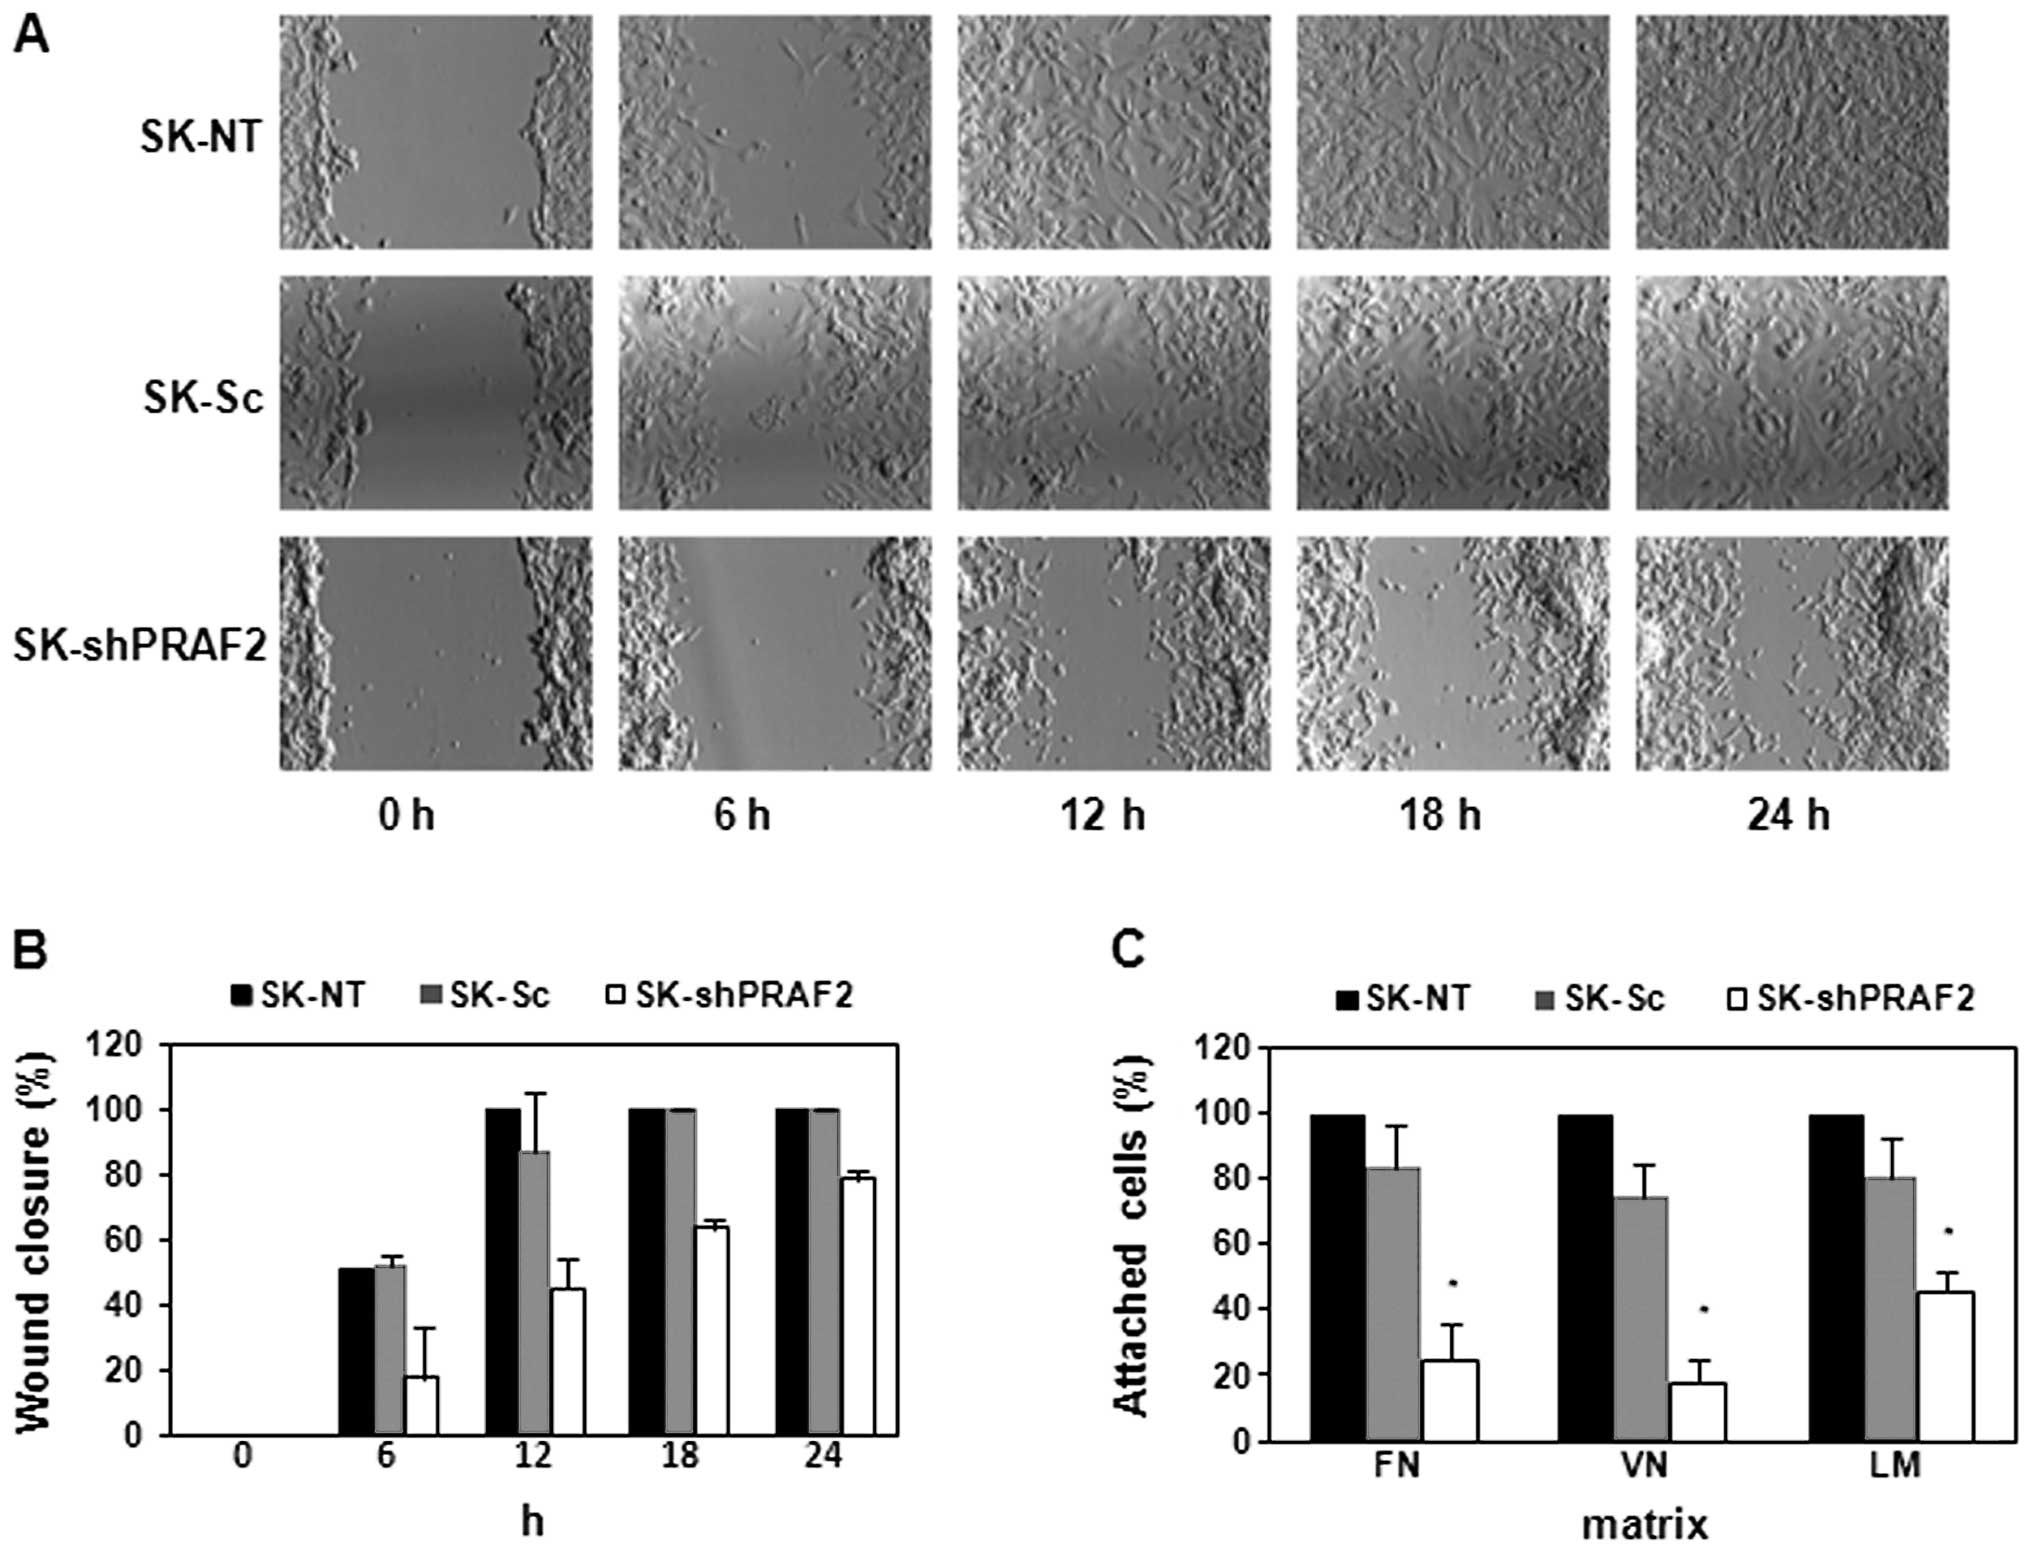 | Figure 6PRAF2 downregulation regulates NB
cell migration and attachment. SK-N-SH cells (SK-shPRAF2, SK-NT and
SK-Sc) were grown to full confluence in 6-well plates and subjected
to monolayer wounding (A and B), or were seeded in fibronectin-
(FN), vitronectin- (VN), or laminin (LM)-coated 96-well plates,
allowed to grow for 3 h and subjected to an adhesion assay (C).
After monolayer wounding, photomicrographs were taken at 0, 6, 12,
18 and 24 h. The wound healing in cells with silenced PRAF2
(SK-shRPAF2) was significantly slower than in SK-NT or SK-Sc
control cells (A). The wound-healing assays were quantified by
measurement of the percentage of the gap closed during the time
indicated (B). While SK-shPRAF2 cells required >24 h,
identically treated SK-NT and SK-Sc control cells closed the gap
within 12 h. The cell attachment of cells was determined using an
adhesion assay with three different matrices (FN, VN and LM) and
coloring with crystal violet (C). SK-shPRAF2 cells showed
significantly lower adhesion capability than the SK-NT or SK-Sc
controls cells. Each assay was performed in duplicate and data are
presented as mean ± SD from three independent experiments (n=6).
*P<0.005 compared with control cells. |
Discussion
Previously, our lab found that PRAF2 expression is
higher in neuroblastic tumors than in all other cancers examined
(17). To explore the role of
PRAF2 in NB, the most aggressive neuroblastic tumor, we
investigated PRAF2 expression in a new cohort of NB tumors. Here,
we found that PRAF2 is significantly correlated with unfavorable
genetic and clinical hallmarks of NB. PRAF2 tumor expression is
notably higher in NB patients with tumor MYCN amplification,
in high-risk patients of >1 year-old or with high-stage disease
and in patients who died during follow-up. We therefore
hypothesized that PRAF2 plays an important role in tumorigenesis
and progression of NB.
Cancer is regularly defined as a disease of the cell
cycle: the uncontrollable proliferation of tumor cells is often due
to the deregulation of cell cycle machinery (23,24)
and NB tumors can have mutations in several cell cycle checkpoints,
most notably the G1-S transition (25). Since PRAF2 is overexpressed in NB
tumor cells, we used RNAi to knock down the level of PRAF2 in NB
cells and examine possible cellular viability effects. Strikingly,
PRAF2 knockdown NB cells showed decreased cell growth in comparison
with control NB cells. This is in apparent contrast with a recent
study in which no growth retardation was detected when expression
of PRAF2 was depleted (23). We
also noted an increase of cell population at G1 phase in
PRAF2 knockdown NB cells. Therefore, these data suggest that high
PRAF2 expression, in cooperation with the decreased G1-S
threshold caused by mutated checkpoint molecules, allows NB tumor
cells to leave the G1 phase and continue the cell
cycle.
Previous studies showed that reduction of PRAF3, a
PRAF2 homologue, enhances adhesion and invasion of melanoma cells
in vitro and melanoma metastasis in vivo by
regulating integrin αvβ3 (26). We
therefore evaluated if PRAF2 is also involved in NB metastasis.
Cancer metastasis is a complex process, in which tumor cells need
to detach from their primary site, migrate, adhere at a distal
location and invade this new host environment (24, 27). Interestingly, Affymetrix analysis
showed that overexpression of PRAF2 is strongly correlated with NB
metastasis. In contrast to the role of PRAF3 in melanoma cell
migration, we found that PRAF2 downregulation delays NB cell
migration. PRAF3 expression is associated with good prognosis in NB
(data not shown). Moreover, depletion of PRAF2 decreased
cell-matrix attachment ability of NB cells in fibronectin,
vitronectin and laminin, three of the major components of
extracellular matrix.
PRAF family proteins act by virtue of their
Rab-binding activity. Most probably therefore, PRAF2 is involved in
the formation of exosome-like vesicles, which were recently
discovered as a novel mechanism in tumor metastasis that depend on
Rab function and cause changes in cell cycle, extracellular matrix,
as well as migration/invasion (28,29).
Indeed, we found that PRAF2 expression is correlated with these
processes. In addition, the expression of several crucial
exosome-associated Rab and extracellular matrix genes correlates
with that of PRAF2 in NB (data not shown). Future studies will
therefore investigate the role of PRAF2 in this mechanism in
detail.
In conclusion, we found a clinical implication of
PRAF2 expression in a cohort of 88 NB tumors. These observations
were validated in vitro by silencing PRAF2 in NB cells which
led to reduced proliferation, migration and cell-matrix adhesion.
In contrast to PRAF3 which inhibits cell migration and induces
apotosis (16,30), our experiments suggest that the
novel PRAF2 protein plays a prominent role in NB tumorigenesis and
metastasis and thus may be of value as a novel target in NB.
Acknowledgements
We gratefully acknowledge Drs
Dana-Lynn Koomoa, Tamas Borsics, Joe Ramos, Florian Sulzmaier,
Joanna Gawecka and Ms. Sarah Hampe for their contributions and
expert technical advice. This study was supported by institutional
funds from the College of Pharmacy and the University of Hawaii
Cancer Center to A.S.B. and grants UVA 2005–3665 from the Dutch
Cancer Society ‘KWF Kankerbestrijding’ and EU COST BM0805 to
D.G.
References
|
1
|
Brodeur GM: Neuroblastoma: biological
insights into a clinical enigma. Nat Rev Cancer. 3:203–216. 2003.
View Article : Google Scholar : PubMed/NCBI
|
|
2
|
Maris JM, Hogarty MD, Bagatell R and Cohn
SL: Neuroblastoma. Lancet. 369:2106–2120. 2007. View Article : Google Scholar : PubMed/NCBI
|
|
3
|
Schweneker M, Bachmann AS and Moelling K:
JM4 is a four-transmembrane protein binding to the CCR5 receptor.
FEBS Lett. 579:1751–1758. 2005. View Article : Google Scholar : PubMed/NCBI
|
|
4
|
Fo CS, Coleman CS, Wallick CJ, Vine AL and
Bachmann AS: Genomic organization, expression profile, and
characterization of the new protein PRA1 domain family, member 2
(PRAF2). Gene. 371:154–165. 2006. View Article : Google Scholar : PubMed/NCBI
|
|
5
|
Bachmann AS, Duennebier FF and Mocz G:
Genomic organization, characterization, and molecular 3D model of
GDE1, a novel mammalian glycerophosphoinositol phosphodiesterase.
Gene. 371:144–153. 2006. View Article : Google Scholar
|
|
6
|
Koomoa DL, Go RC, Wester K and Bachmann
AS: Expression profile of PRAF2 in the human brain and enrichment
in synaptic vesicles. Neurosci Lett. 436:171–176. 2008. View Article : Google Scholar : PubMed/NCBI
|
|
7
|
Borsics T, Lundberg E, Geerts D, et al:
Subcellular distribution and expression of prenylated Rab acceptor
1 domain family, member 2 (PRAF2) in malignant glioma: influence on
cell survival and migration. Cancer Sci. 101:1624–1631. 2010.
View Article : Google Scholar : PubMed/NCBI
|
|
8
|
Sivars U, Aivazian D and Pfeffer SR: Yip3
catalyses the dissociation of endosomal Rab-GDI complexes. Nature.
425:856–859. 2003. View Article : Google Scholar : PubMed/NCBI
|
|
9
|
Compton SL and Behrend EN: PRAF1: a Golgi
complex trans-membrane protein that interacts with viruses. Biochem
Cell Biol. 84:940–948. 2006. View
Article : Google Scholar : PubMed/NCBI
|
|
10
|
Compton SL, Kemppainen RJ and Behrend EN:
Prenylated Rab acceptor domain family member 1 is involved in
stimulated ACTH secretion and inhibition. Cell Signal.
21:1901–1909. 2009. View Article : Google Scholar : PubMed/NCBI
|
|
11
|
Kim JT, Cho MY, Choi SC, et al: Prenylated
Rab acceptor 1 (PRA1) inhibits TCF/beta-catenin signaling by
binding to beta-catenin. Biochem Biophys Res Commun. 349:200–208.
2006. View Article : Google Scholar : PubMed/NCBI
|
|
12
|
Li LY, Shih HM, Liu MY and Chen JY: The
cellular protein PRA1 modulates the anti-apoptotic activity of
Epstein-Barr virus BHRF1, a homologue of Bcl-2, through direct
interaction. J Biol Chem. 276:27354–27362. 2001. View Article : Google Scholar : PubMed/NCBI
|
|
13
|
Liu HP, Wu CC and Chang YS: PRA1 promotes
the intracellular trafficking and NF-kappaB signaling of EBV latent
membrane protein 1. EMBO J. 25:4120–4130. 2006. View Article : Google Scholar : PubMed/NCBI
|
|
14
|
Lin CI, Orlov I, Ruggiero AM, et al:
Modulation of the neuronal glutamate transporter EAAC1 by the
interacting protein GTRAP3–18. Nature. 410:84–88. 2001.
|
|
15
|
Mao WG, Liu ZL, Chen R, Li AP and Zhou JW:
JWA is required for the antiproliferative and pro-apoptotic effects
of all-trans retinoic acid in HeLa cells. Clin Exp Pharmacol
Physiol. 33:816–824. 2006. View Article : Google Scholar : PubMed/NCBI
|
|
16
|
Chen H, Bai J, Ye J, et al: JWA as a
functional molecule to regulate cancer cells migration via MAPK
cascades and F-actin cytoskeleton. Cell Signal. 19:1315–1327. 2007.
View Article : Google Scholar : PubMed/NCBI
|
|
17
|
Geerts D, Wallick CJ, Koomoa DL, et al:
Expression of prenylated Rab acceptor 1 domain family, member 2
(PRAF2) in neuroblastoma: correlation with clinical features,
cellular localization, and cerulenin-mediated apoptosis regulation.
Clin Cancer Res. 13:6312–6319. 2007. View Article : Google Scholar
|
|
18
|
Valster A, Tran NL, Nakada M, Berens ME,
Chan AY and Symons M: Cell migration and invasion assays. Methods.
37:208–215. 2005. View Article : Google Scholar : PubMed/NCBI
|
|
19
|
Fardin P, Barla A, Mosci S, et al: A
biology-driven approach identifies the hypoxia gene signature as a
predictor of the outcome of neuroblastoma patients. Mol Cancer.
9:1852010. View Article : Google Scholar : PubMed/NCBI
|
|
20
|
Revet I, Huizenga G, Chan A, et al: The
MSX1 homeobox transcription factor is a downstream target of PHOX2B
and activates the Delta-Notch pathway in neuroblastoma. Exp Cell
Res. 314:707–719. 2008. View Article : Google Scholar : PubMed/NCBI
|
|
21
|
Barrett T, Troup DB, Wilhite SE, et al:
NCBI GEO: archive for high-throughput functional genomic data.
Nucleic Acids Res. 37:D885–D890. 2009. View Article : Google Scholar : PubMed/NCBI
|
|
22
|
Bewick V, Cheek L and Ball J: Statistics
review 12: survival analysis. Crit Care. 8:389–394. 2004.
View Article : Google Scholar : PubMed/NCBI
|
|
23
|
Vento MT, Zazzu V, Loffreda A, et al:
Praf2 is a novel Bcl-xL/Bcl-2 interacting protein with the ability
to modulate survival of cancer cell. PLoS One. 5:e156362010.
View Article : Google Scholar : PubMed/NCBI
|
|
24
|
Malumbres M and Barbacid M: Cell cycle,
CDKs and cancer: a changing paradigm. Nat Rev Cancer. 9:153–166.
2009. View
Article : Google Scholar : PubMed/NCBI
|
|
25
|
Molenaar JJ, Koster J, Ebus ME, et al:
Copy number defects of G1-cell cycle genes in neuroblastoma are
frequent and correlate with high expression of E2F target genes and
a poor prognosis. Genes Chromosomes Cancer. 51:10–19. 2012.
View Article : Google Scholar : PubMed/NCBI
|
|
26
|
Bai J, Zhang J, Wu J, et al: JWA regulates
melanoma metastasis by integrin alphaVbeta3 signaling. Oncogene.
29:1227–1237. 2010. View Article : Google Scholar : PubMed/NCBI
|
|
27
|
Hynes RO: Metastatic potential: generic
predisposition of the primary tumor or rare, metastatic variants -
or both? Cell. 113:821–823. 2003. View Article : Google Scholar : PubMed/NCBI
|
|
28
|
Hendrix A, Westbroek W, Bracke M and De
Wever O: An ex(o) citing machinery for invasive tumor growth.
Cancer Res. 70:9533–9537. 2010. View Article : Google Scholar : PubMed/NCBI
|
|
29
|
Peinado H, Lavotshkin S and Lyden D: The
secreted factors responsible for pre-metastatic niche formation:
old sayings and new thoughts. Semin Cancer Biol. 21:139–146. 2011.
View Article : Google Scholar : PubMed/NCBI
|
|
30
|
Shi GZ, Yuan Y, Jiang GJ, et al: PRAF3
induces apoptosis and inhibits migration and invasion in human
esophageal squamous cell carcinoma. BMC Cancer. 12:972012.
View Article : Google Scholar : PubMed/NCBI
|