Introduction
One of the main tenets of cancer therapeutics is
that combinations of anticancer agents with different targets or
different mechanisms of action and varied toxicities will produce
better therapeutic outcomes. The premise of controlled randomized
trials is that there is uncertainty whether any combination of
treatments may have more benefit than the individual single
treatments. Indeed, very large studies analyzing outcomes from
multiple clinical trials most often find no substantive differences
between the combination treatment regimen and the single agent arms
lending support to the continuing need for randomized trials
(1,2).
Objective mathematical and graphical methods for the
assessment of additivity, synergy, and antagonism have been
defined, including combination index, median effect, isobolograms,
continuous measures, Bliss methodology and varied response surface
techniques (3–17). Drug-drug interactions are
inherently defined by a 3-dimensional (3D) concentration- or
dose-response surface (17). 3D
methods have several advantages: i) the response surface can be
directly visualized and plotted; ii) predicted additive effects can
be calculated using either the similar site or dissimilar site
assumptions of additivity and the additive surface can be
subtracted from the experimental surface to highlight areas of
synergy and antagonism; iii) the synergy and antagonism can be
quantified allowing varied drug combinations to be compared; and
iv) the data can be analyzed for statistical significance. 3D
analysis highlights stoichiometric or other relationships which may
elucidate mechanisms of synergy. These methods can be effectively
applied to cell-based and in vivo preclinical data.
Predicting from preclinical studies whether a
potential new anticancer agent will have a positive therapeutic
index in patients remains a challenge. The mouse is the traditional
preclinical host for anticancer compound testing. Although the
mouse is often a good predictor for certain organ system toxicities
and mechanism of action, there are species differences. Bone marrow
is critically sensitive to many antineoplastic agents, and
combinations of agents with overlapping target organ toxicity may
increase the risk of additive bone marrow toxicity (18). Mouse bone marrow is often less
sensitive to cytotoxic agents than human bone marrow, resulting in
exposures used during preclinical efficacy testing that cannot be
achieved in patients (18–22). Bone marrow granulocyte
macrophage-colony forming unit (CFU-GM) assays comparing the
sensitivity of bone marrow cells across species are useful for
predicting the blood levels of an agent that might be achieved in
patients relative to those achievable in preclinical efficacy and
safety species. Drug combinations with small or no differential in
bone marrow progenitor sensitivity between species may have a
better potential for reaching the efficacious exposure level of
mice in patients, when bone marrow toxicity is dose limiting. It
has been suggested that the ratio of mouse/human CFU-GM
IC90 values equals the ratio of maximum tolerated doses
in mouse and man for myelosuppressive agents, so the human maximum
tolerated dose of an experimental compound could be predicted and
thus the potential for achieving a therapeutic blood level in
patients estimated prior to clinical development (18).
6-Mercaptopurine (6-MP) was synthesized and
developed by Hitchings and Elion in the 1950s as one of a large
series of purine analogs designed to interfere with nucleic acid
biosynthesis. 6-MP is active against human leukemia (23). Monitoring plasma 6-MP after an oral
dose is of questionable value due to high inter-patient variability
in plasma levels. 6-MP moves rapidly into the anabolic and
catabolic pathways for purines. The active intracellular
metabolites have longer half-lives than the parent drug. The
biochemical effects of a single 6-MP dose are evident long after
the parent drug has disappeared from plasma (24). 6-MP competes with hypoxanthine and
guanine for the enzyme hypoxanthine-guanine
phosphoribosyltransferase (25).
6-MP is metabolized to thioinosinic acid. Thioinosinic acid
inhibits several reactions involving inosinic acid, including the
conversion of inosinic acid to xanthylic acid and to adenylic acid
via adenylosuccinate. 6-Methylthioinosinate is formed by the
methylation of thioinosinic acid. Both thioinosinic acid and
methylthioinosinic acid inhibit the first enzyme in the de
novo purine ribonucleotide synthesis pathway. 6-MP is found in
DNA in the form of deoxythioguanosine. Some 6-MP is converted to
nucleotide derivatives of 6-thioguanine (6TG) by the sequential
actions of inosinate dehydrogenase and xanthylate aminase,
converting thioinosinic acid to thioguanylic acid. Preclinical
tumors resistant to 6-MP often cannot convert 6-MP to thioinosinic
acid (26,27). However, many mechanisms of
resistance to 6-MP have been identified, particularly in human
leukemias (28). It is not known
which biochemical effect of 6-MP and its metabolites are
predominantly responsible for cell death. Bone marrow suppression
is a 6-MP dose-limiting toxicity and may be more profound when 6-MP
is administered with other myelosuppressive agents.
Deregulated BCR-ABL tyrosine kinase activity is the
molecular marker for chronic myeloid leukemia (CML). Imatinib, a
BCR-ABL TK inhibitor, is the front-line therapy for CML. However,
patients develop resistance to imatinib with up to 90% of patients
in the accelerated/blastic phase resistant. Based on modeling
studies, dasatinib was predicted to bind to multiple conformations
of the ABL kinase, and it can produce durable responses in patients
with many BCR-ABL mutations highly resistant to imatinib. Dasatinib
is recommended for CML in chronic, blastic or accelerated phase
that is resistant to imatinib (29). Dasatinib inhibits BCR-ABL, SRC
family (SRC, LCK, YES, FYN), c-KIT, EPHA2, and PDGFRβ at nanomolar
concentrations, and likely inhibits the activity of upregulated
c-Abl following genotoxic agents or γ-irradiation (30). Dasatinib overcomes imatinib
resistance resulting from BCR-ABL kinase domain mutations,
activation of alternate SRC family kinase signaling pathways (LYN,
HCK), and multi-drug resistance gene overexpression (31). The cellular effects of dasatinib
are widespread and not limited to immediate BCR-ABL targets
affecting downstream MAPK pathways (32). Dasatinib interacts with many
proteins involved in processing and repair of DNA damage such as
p53, p73, Mdm2, Rad51, DNA-PK, WRN, CSB and BRCA1. Dasatinib
induces myelosuppression in leukemia patients and is the most
common reason for dose reduction. Data suggest that dasatinib may
increase the severity and frequency of myelosuppression when given
in combination with agents with myelosuppressive effects (33).
The current cell-based study explored the
combination of 6-MP and dasatinib in 6 human tumor cells lines
using two experimental end-points and two methods for determination
of additivity/synergy. The colony formation end-point for the tumor
cell lines is compared with colony formation by human bone marrow
CFU-GM exposed to the drug combination.
Materials and methods
Materials
6-Mercaptopurine (NSC755) and dasatinib (NSC732517)
were obtained from the DTP compound repository. Both compounds were
formulated as 50 mM stock solutions in DMSO (Sigma-Aldrich, St.
Louis, MO, USA), aliquoted, stored at −70°C and diluted with
RPMI-1640 medium to the appropriate concentrations for experiments.
For CFU-GM experiments, both compounds were formulated in DMSO as
4,000X target concentration stock solutions.
Cell lines and culture
All cell lines were purchased from ATCC (Manassas,
VA, USA). The MCF-7 breast adenocarcinoma line was established from
pleural effusion of a 69-year-old female patient in the early 1970s
(34,35). MCF-7 cells are ER+ and
p53 wild-type (36). MDA-MB-468
breast adenocarcinoma line was established from a 51-year-old
female patient in the 1970s and is ER+ and p53 mutant
(37,38). The NCI-H23 lung adenocarcinoma cell
line was established from a 51-year-old male patient in the 1970s
and has mutant K-ras, mutant p53 and has c-myc gene amplification
(39,40). The NCI-H460 lung large cell
carcinoma was developed from the pleural effusion of a male patient
in 1982 (41). The NCI-H460 cell
line has wild-type p53 (42). The
A498 renal cell carcinoma line was established from the kidney
cancer of a 520year-old patient in the early 1970s and has
wild-type p53 (43,44). The 786-O renal cell adenocarcinoma
cell line was established from the primary clear cell
adenocarcinoma of a 58-year-old male in the early 1970s and has
mutant p53 (45,46). All of the cell lines were
maintained in RPMI-1640 medium (Life Technologies, Grand Island,
NY, USA) supplemented with 5% fetal bovine serum (HyClone/Thermo
Fisher Scientific, Logan, UT, USA) and glutaMAX™ (Life
Technologies, Grand Island, NY, USA) in a humidified 5% carbon
dioxide atmosphere at 37°C.
Growth inhibition assay
Six human tumor cell lines were exposed to a
concentration range of 6-MP, dasatinib or combinations of 6-MP and
dasatinib in 3 to 4 independent experiments. Cells were plated in
96-well tissue culture plates in 100 μl RPMI medium
supplemented with 5% FBS and glutamine at different cell seeding
densities depending upon the properties of the cell line: the
initial seeding densities were: MCF-7, 5×10³;
MDA-MB-468, 2.5×10³; NCI-H23, 2.5×10³;
NCI-H460, 1×10³; A498, 1.25×10³ and 786-O,
1.25×10³ cells/well. Eight concentrations of 6-MP (0.03
to 100 μM) or dasatinib (0.001 to 3 μM) in half-log
intervals were tested. Plates were incubated overnight at 37°C in
humidified air with 5% CO2 prior to the addition of 6-MP
or dasatinib for a 72-hour drug exposure at 37°C with humidified
air/5% CO2. After the incubation period, the test plates
were allowed to stand at room temperature for 10 min; 100 μl
of media was removed from each well and replaced with 100 μl
of CellTiter-Glo® (Promega, Madison, WI, USA) at room
temperature according to the manufacturer’s instructions. The
plates were allowed to stand at room temperature for 30 min and
luminescence was read on Infinity 200M (Tecan Systems Inc, Grödig,
Austria). Luminescence data were converted to growth fraction by
comparison with the luminescence for the untreated control for each
cell line, and IC50 and IC90 values
determined from the graphical data. Each cell line was tested in at
least 3 independent experiments.
Colony formation assay
Each of the 6 cell lines were grown as monolayers in
RPMI-1640 medium supplemented with 5% FBS and glutamine in 6-well
dishes. The 6-MP and dasatinib were tested over a concentration
range from centering on the clinical achievable circulating
Cmax for each agent alone and in combination. Cultures
were exposed to the compounds for 3 days at 37°C in a humidified
atmosphere of 5% CO2. The cells were suspended by
exposure to trypsin then plated for colony formation in 6-well
dishes in different numbers depending upon the properties of the
cell line. The cells were plated in 6-well plates in a RPMI-1640
medium supplemented with 5% FBS and glutamine: MCF-7,
1.2×10³; MDA-MB-468, 1.2×10³; NCI-H23,
1×10³; NCI-H460, 0.75×10³; A498,
0.75×10³ and 786-O, 0.75×10³. Each treatment
group was tested in triplicate wells. Each experiment was conducted
at 2 independent times. After 7 to 12 days, colonies were fixed and
stained with 0.5% w/v crystal violet in 20% methanol. Colonies were
defined as clusters containing 50 or more cells. Colonies were
counted using a GelCount (Oxford Optronix, Oxford, UK). The
IC50 and IC90 values were determined from the
graphical data.
Human bone marrow
For CFU-GM, the assay was conducted using freshly
collected, human bone marrow mononuclear cells (Lonza-Biowhittaker,
Walkersville, MD, USA).
Bone marrow CFU-GM assay
The semi-solid matrix agarose based CFU-GM assay was
used to establish levels of toxicity for the compounds tested.
Human bone marrow cells were received from the vendor on ice and
upon arrival, the cells were gently pelleted and the transport
media removed. The cells were then suspended in 5 ml of Plasma-Lyte
A USP (Baxter Healthcare, Deerfield, IL, USA), mixed well and
treated with 2.5 μl/ml Pulmozyme (Genentech Inc., South San
Francisco, CA, USA). After 10 min at room temperature, the cells
were layered over 5 ml Ficoll-Paque PLUS (Stem Cell Technologies,
Vancouver, BC, Canada) and centrifuged for 30 min at 1,500 × g
relative centrifugal force to enrich the viable mononuclear cell
population. The buffy layer containing the mononuclear cells
(MNC’s) was collected, washed in 14 ml Plasma-Lyte A USP, and
finally suspended in 10 ml IMDM (Stem Cell Technologies). Cell
counts were performed using Beckman Coulter ViCell cell counter. A
minimal volume of cell suspension was added to 3.5 ml complete
medium containing IMDM, 20% fetal bovine serum (Lonza,
Walkersville, MD, USA), 100 ng/ml gentamicin (Abraxis, Schaumburg,
IL, USA), and 10 ng/ml Leukine sargramostim rhGM-CSF (Berlex,
Seattle, WA, USA) in 15 ml conical tubes. For each test
concentration, drugs were solubilized in DMSO at 4,000-fold stock
solution concentration. To create the drug combination stock
solutions relevant drug stocks (or drug stock + DMSO for single
agent control groups) were mixed together in a 1:1 ratio to form
2,000X stock solutions. A 5 μl aliquot of drug stock
solution was added into 5 ml of complete medium containing 1.3X
FBS, gentamicin and rhGM-CSF in a 15 ml conical tube and mixed and
this 1,000X diluted drug stock solution in medium was then
transferred to the 3.5 ml cell suspension and mixed. After warming,
1.5 ml of 2.5% SeaPlaque Agarose (Lonza-Biowhittaker, Walkersville,
MD, USA; catalog # 50101) in water was added, mixed using a vortex
mixer, and 2 ml was plated in triplicate in 6-well plates
containing a pre-gelled, 2 ml under-layer of IMDM, FBS and 2.5%
SeaPlaque Agarose per well. For 72-h pulse exposures, the 1.5 ml
agarose solution was substituted with medium and the entire 10 ml
contents were transferred to 25 cm2 vented cap, canted
neck culture flasks (Corning, Manassas, VA, catalog # 430639) for
incubation until the completion of the 72-h period. At the end of
the 72-h period, the entire content of the flasks were transferred
to individual 15 ml conical tubes and the flask rinsed with an
additional 3 ml medium that was added to the respective tube of the
flask. The tubes were gently spun (190X G) for 5 min to pellet the
cells and treatment + rinse medium removed. The contents of each
flask were reconstituted in 8.5 ml medium, 1.5 ml warmed agarose
solution was added and cell suspensions were plated as done for the
constant exposure group. For constant and pulse exposure groups,
each well contained 2×10⁵ human donor MNC and total
culture time (including the 72-h exposure period) was 14 days. The
plates were maintained at 4°C until completely gelled (usually
15–20 min) and then placed in a humidified incubator at 37°C with
5% CO2. After 14 days, colonies >64 cells were
counted manually, and the treatment effect calculated from the
reduction in colonies per well as percent of vehicle control.
Data analysis
Data analysis for additivity was performed using the
MacSynergy II program (Prichard and Shipman, University of MI, Ann
Arbor, MI) and CompuSyn program (Chou and Martin). CompuSyn program
(Chou and Martin) was used to compute a combination index (CI) for
drug combinations studied with growth assays and colony formation
assays. The Chou-Talalay combination-index method for drug
combination is based on the median-effect equation, derived from
the mass-action law principle, which is the unified theory that
provides the common link between single entity and multiple
entities, and first order and higher order dynamics. This general
equation encompasses the Michaelis-Menten, Hill,
Henderson-Hasselbalch and Scatchard equations in biochemistry and
biophysics. The resulting combination index (CI) theorem of
Chou-Talalay offers quantitative definition for additive effect
(CI=1), synergism (CI<1) and antagonism (CI>1) in drug
combinations. This theory also provides algorithms for computer
simulation of synergism and/or antagonism at any effect and
concentration/dose level, as shown in the CI plot and isobologram,
respectively (14,47).
The MacSynergy II program calculates the theoretical
additive interactions of the drugs based on the Bliss Independence
mathematical definition of expected effects for drug-drug
interactions. The Bliss Independence model is based on statistical
probability and assumes that the drugs act independently.
MacSynergy II provides a 3D model for additivity analysis of drug
combinations and contour plot. The calculated theoretical additive
interactions are determined from the concentration response data of
the individual drugs. The calculated additive surface, which
represents the predicted additive interaction, is then subtracted
from the observed surface to show regions of greater-than-expected
(synergy) or less-than-expected (antagonism) interactions. If the
interactions are additive, the resulting surface appeared as a
horizontal plane at 0% above the calculated additive surface in the
resulting difference plots. Peaks above this plane in the
difference plots are indicative of synergy, while depressions below
the horizontal plane indicate antagonism (17).
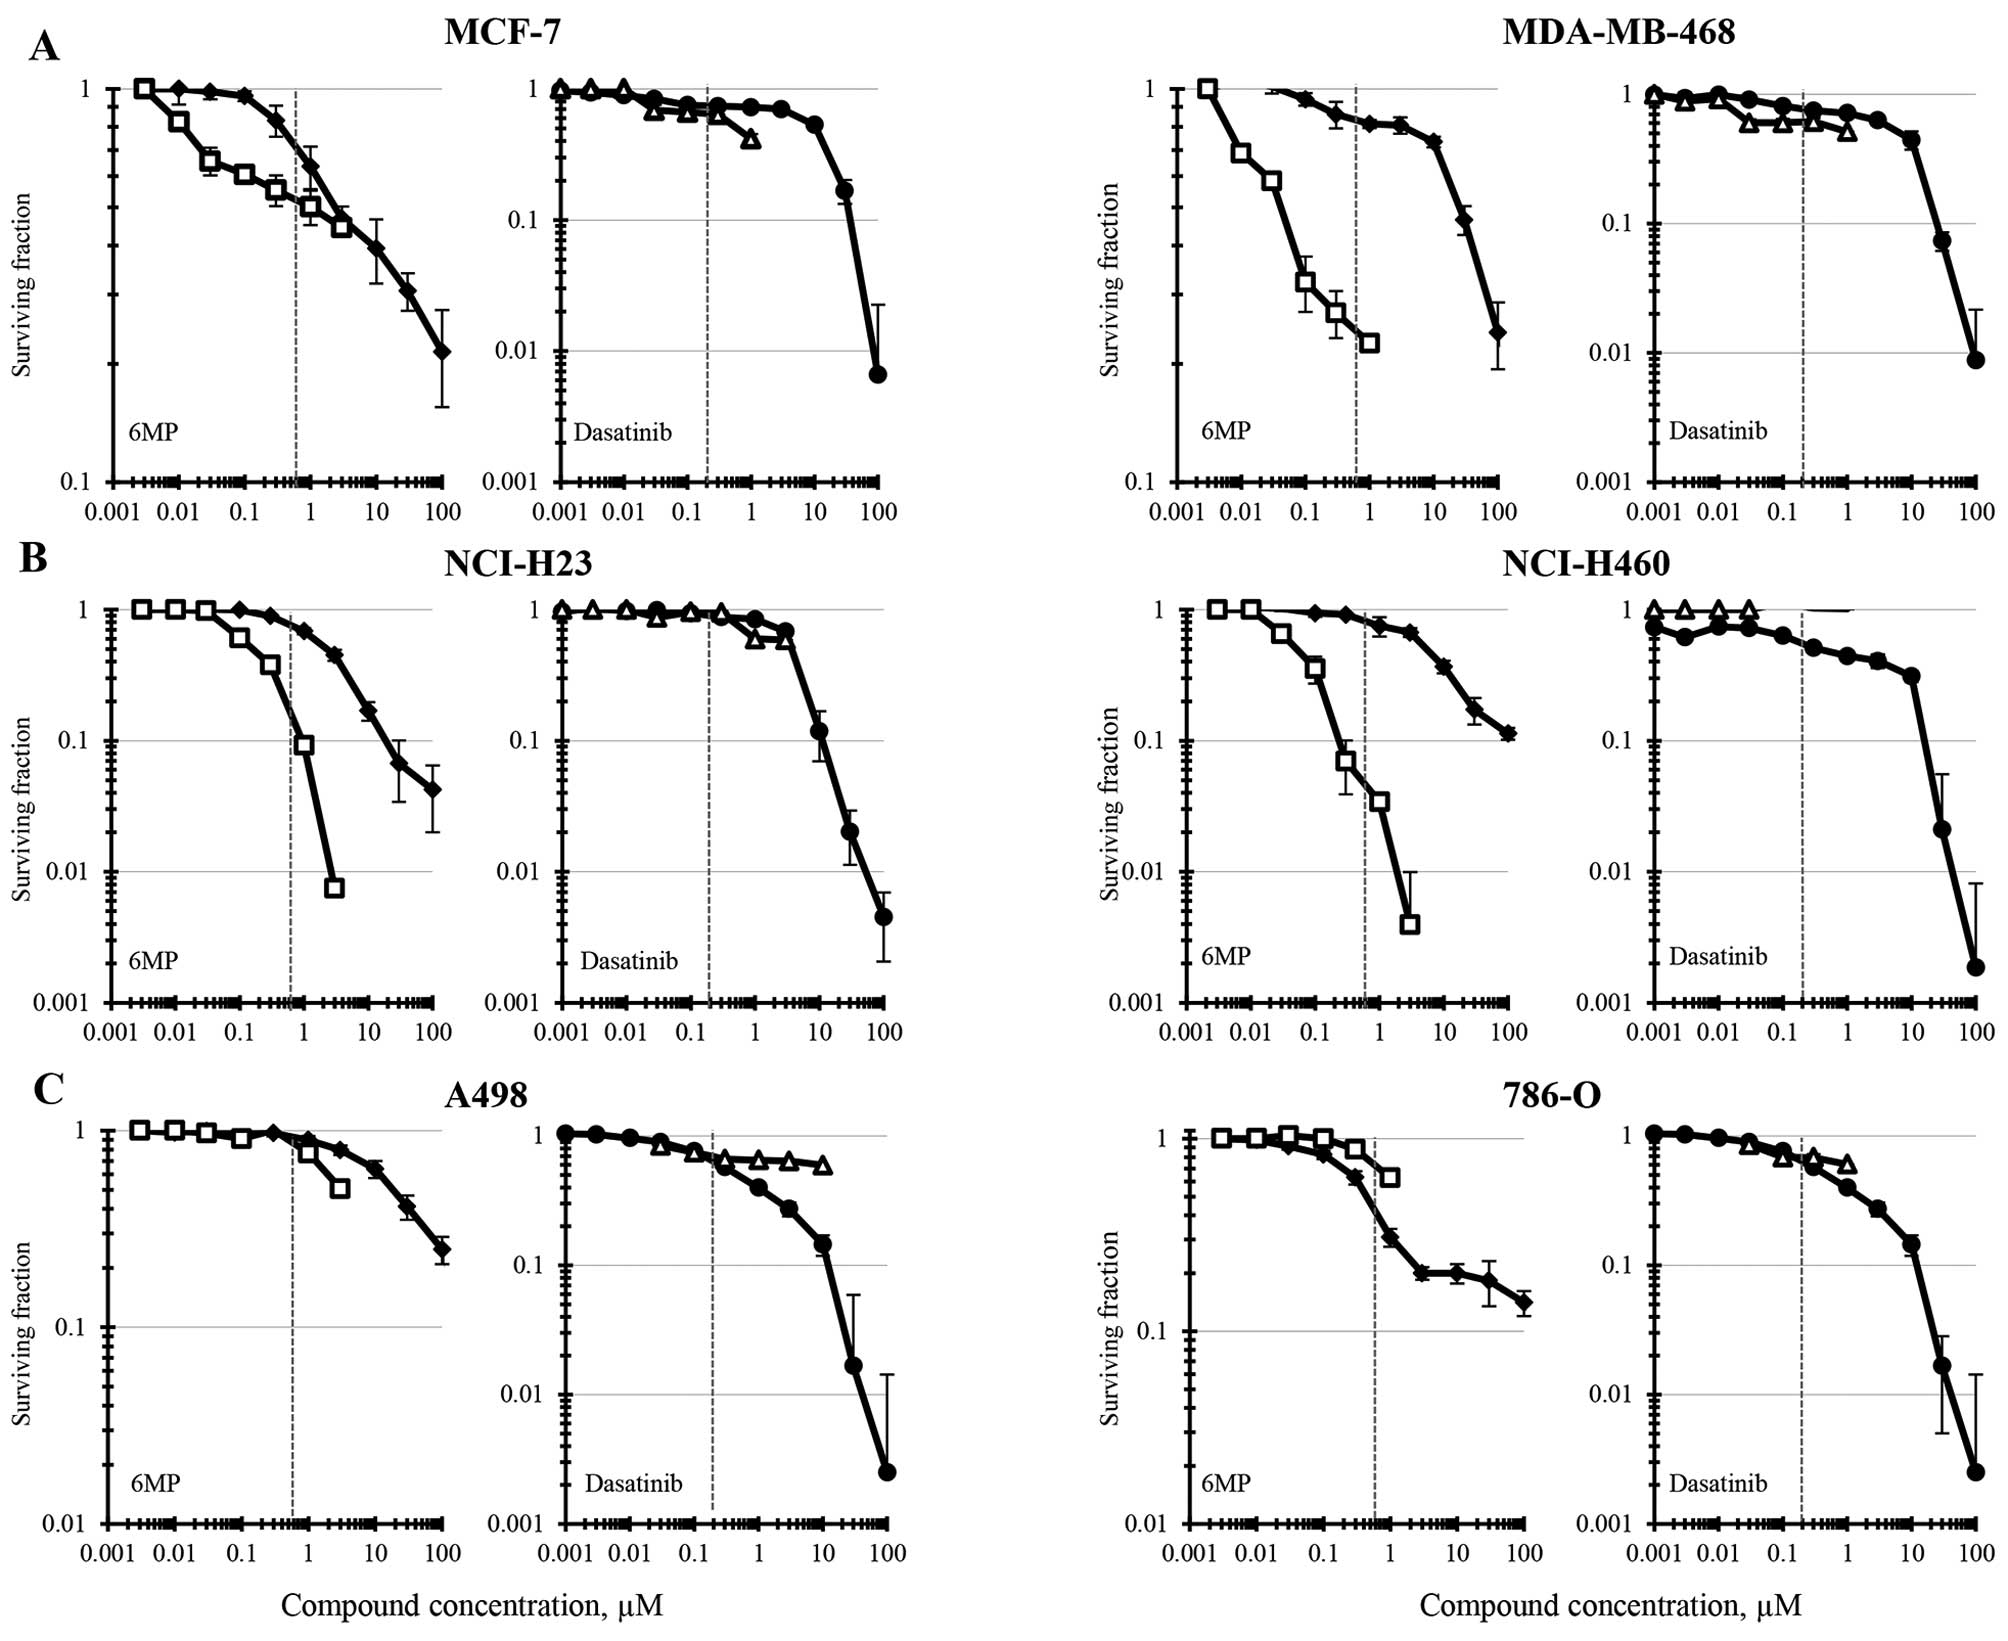
Results
Six human tumor cell lines, 2 breast cancer, 2
non-small cell lung cancer and 2 renal cell carcinoma, were
selected for study. The compounds were tested as single agents in
each cell line using ATP content (CellTiter-Glo luminescence) and
colony formation as end-points (Fig.
1). Concentrations of 6-MP and dasatinib were selected to cover
several logs encompassing the clinical achievable Cmax
for both assays. The reported clinical Cmax for 6-MP is
0.6 μM and the clinical Cmax for dasatinib is
reported to be 0.2 μM (48,49).
The 6-MP IC50 concentrations in the MCF-7 human breast
carcinoma cell line were similar for both experimental end-points
and were 1–2 μM (Fig. 1A).
In the same cell line, dasatinib had an IC50 of 11
μM by ATP content and of 0.6 μM by colony formation.
The MDA-MB-468 breast carcinoma line was less sensitive to 6-MP as
determined by ATP content, having an IC50 of 23
μM but more sensitive by the cell survival measurement of
colony formation with an IC50 of 0.04 μM. The
dasatinib IC50 in MDA-MB-468 cells determined by ATP
content was 7.5 μM and by colony formation was 0.7
μM. Both the NCI-H23 and the NCI-H460 non-small cell lung
carcinoma cell line were more sensitive to 6-MP when survival was
measured by colony formation than was determined by ATP content
(Fig. 1B). The 6-MP
IC50s for the NCI-H23 and NCI-H460 cells determined by
colony formation were 0.15 and 0.06 μM and by ATP content
were 2.6 and 8 μM, respectively. The non-small cell lung
carcinoma cell lines had differing sensitivity to dasatinib having
IC50s of 4.5 and 0.3 μM as determined by ATP
content for the NCI-H23 and NCI-H460 lines, respectively. However,
neither the NCI-H23 line nor the NCI-H460 cells were responsive to
dasatinib in the concentration range tested by colony formation
(<50% reduction). The 6-MP IC50 for the A498 renal
cell carcinoma line was 24 μM as determined by ATP content
and 2.8 μM as determined by colony formation (Fig. 1C). The dasatinib IC50 in
the same cell line was 0.6 μM as determined by ATP content
and >20 μM as determined by colony formation. Finally,
the 6-MP IC50 for the 786-O renal cell carcinoma cell
line was 0.45 μM as determined by ATP content and >1.25
μM as determined by colony formation. For the 786-O line,
the dasatinib IC50 was 0.5 μM when determined by
ATP content and >1 μM when survival was determined by
colony formation.
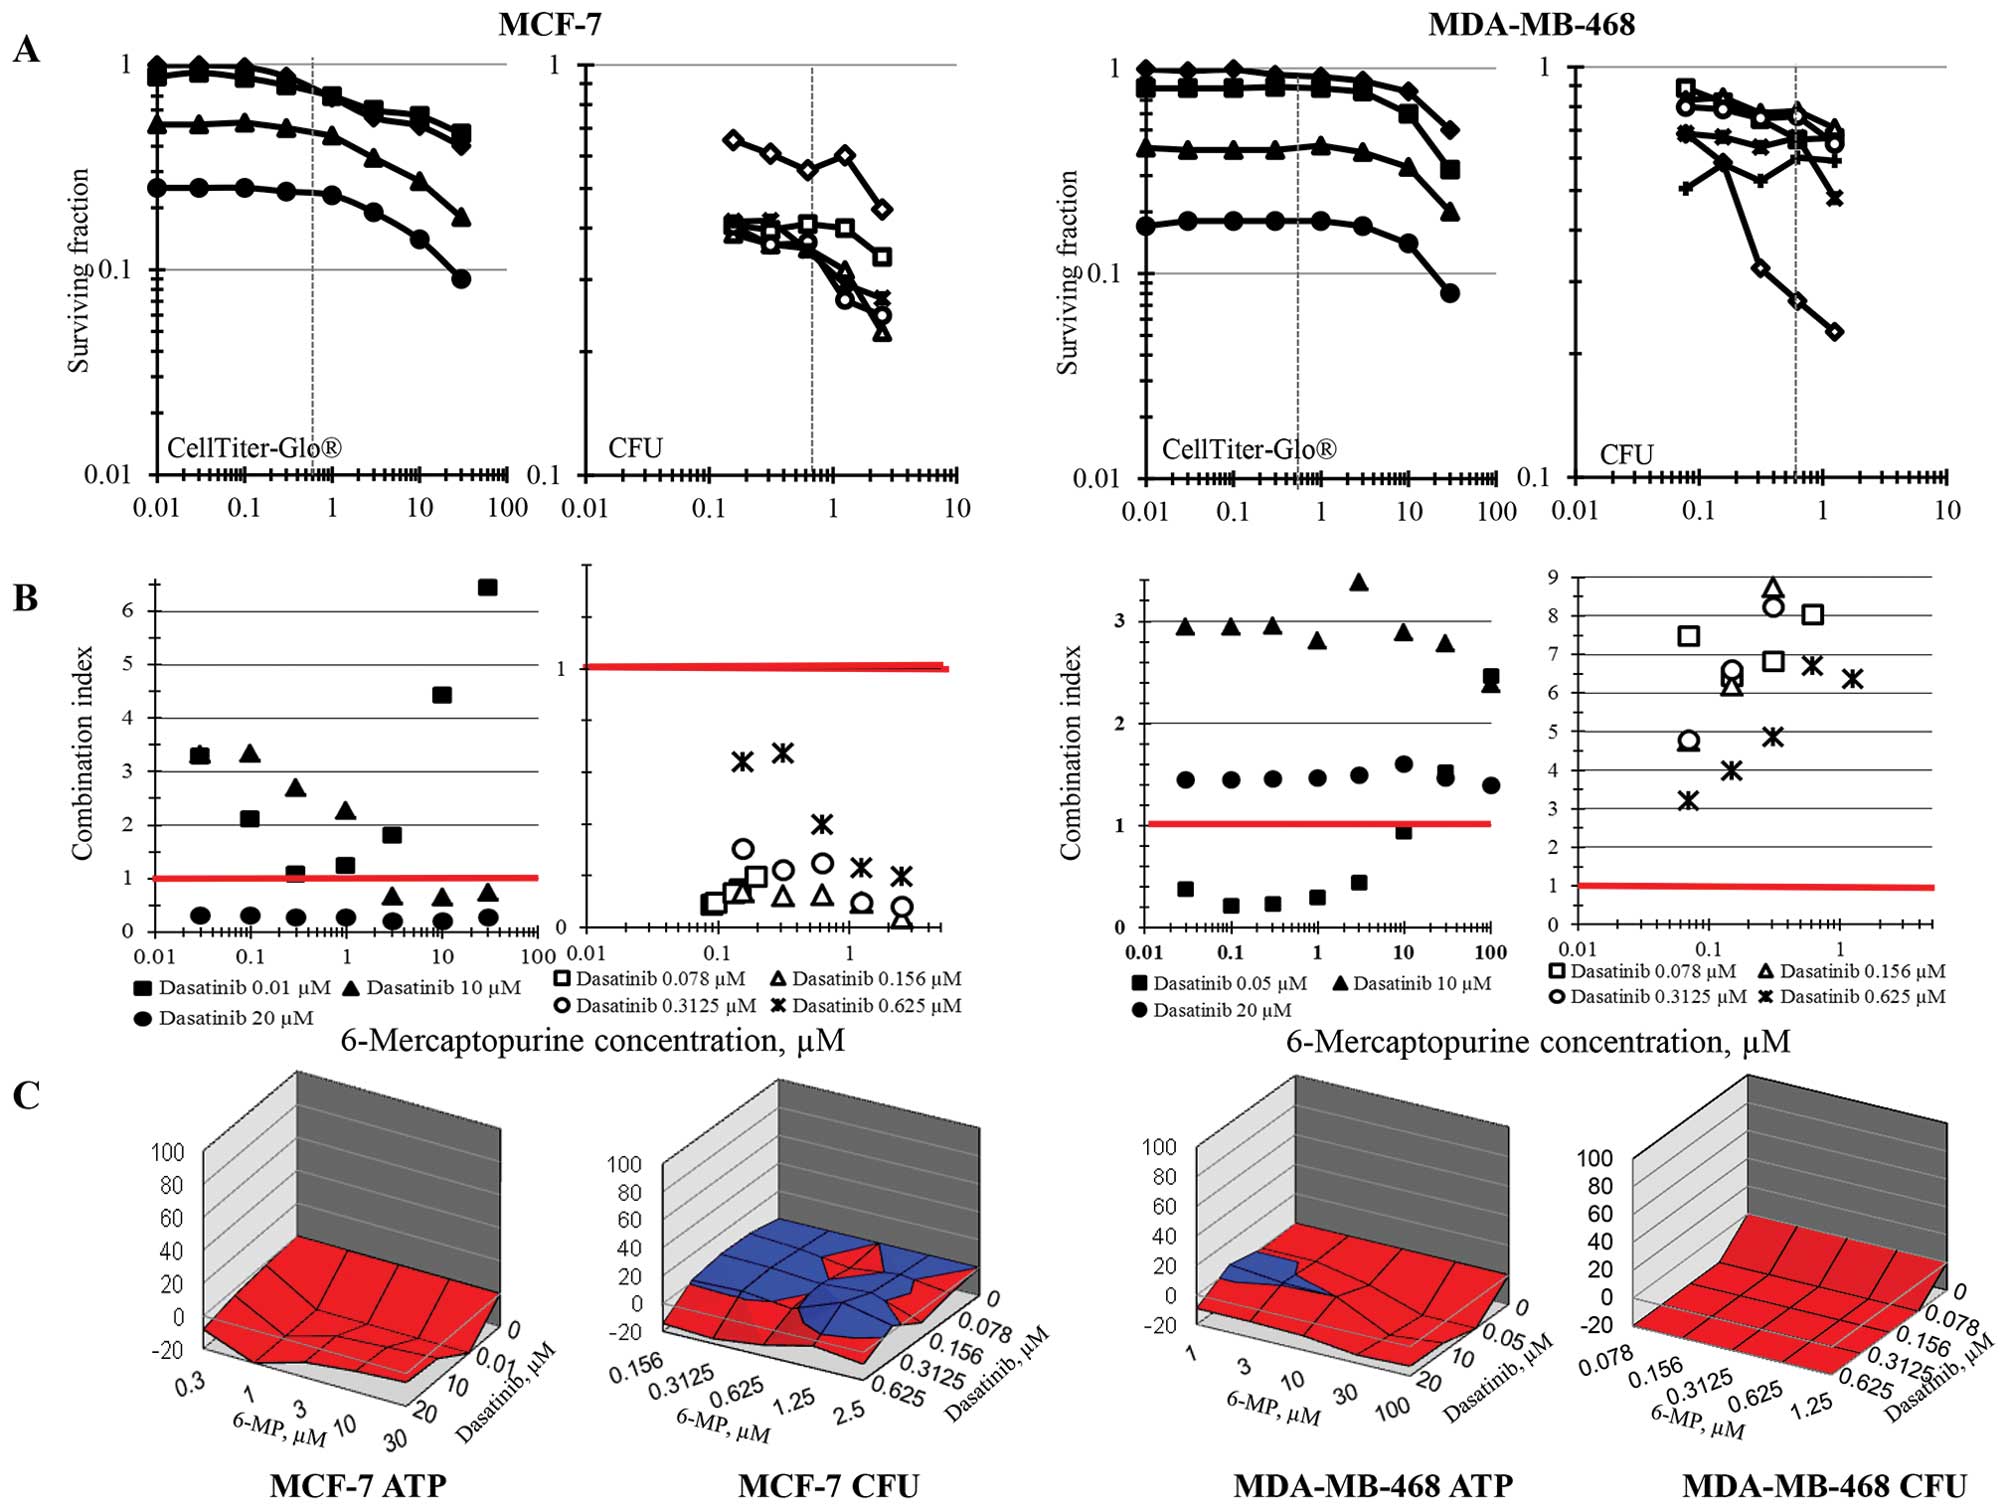
Simultaneous combinations of 6-MP and dasatinib were
assessed in the same 6 human tumor cell lines by ATP content and
colony formation and analyzed for additivity/synergy using
combination index methodology and response surface methodology. The
concentration ranges selected for the combination studies
encompassed the clinical Cmax concentrations for each
drug. Using ATP content as an end-point, the response curves for
6-MP with increasing concentrations of dasatinib tend to be
parallel except at the highest concentrations indicating that the
drugs are not interacting. In the MCF-7 breast carcinoma cell line,
the combinations of 6-MP and dasatinib were sub-additive as
determined by ATP content using the combination index method except
at the very high dasatinib concentration of 20 μM and were
sub-additive across all concentration combinations by the response
surface area method. However, when MCF-7 cell survival was measured
by colony formation, all of the combinations of 6-MP and dasatinib
produced greater than additive cell killing by the combination
index data analysis method and were additive to sub-additive by the
response surface area method (Fig.
2). As determined by ATP content, combinations of 6-MP and
dasatinib were sub-additive to additive both by combination index
analysis and response surface are analysis in the MDA-MB-468 breast
carcinoma cell line. On the other hand, using the colony formation
end-point, both methods of data analysis indicate that the
combinations were sub-additive across all combinations (Fig. 2).
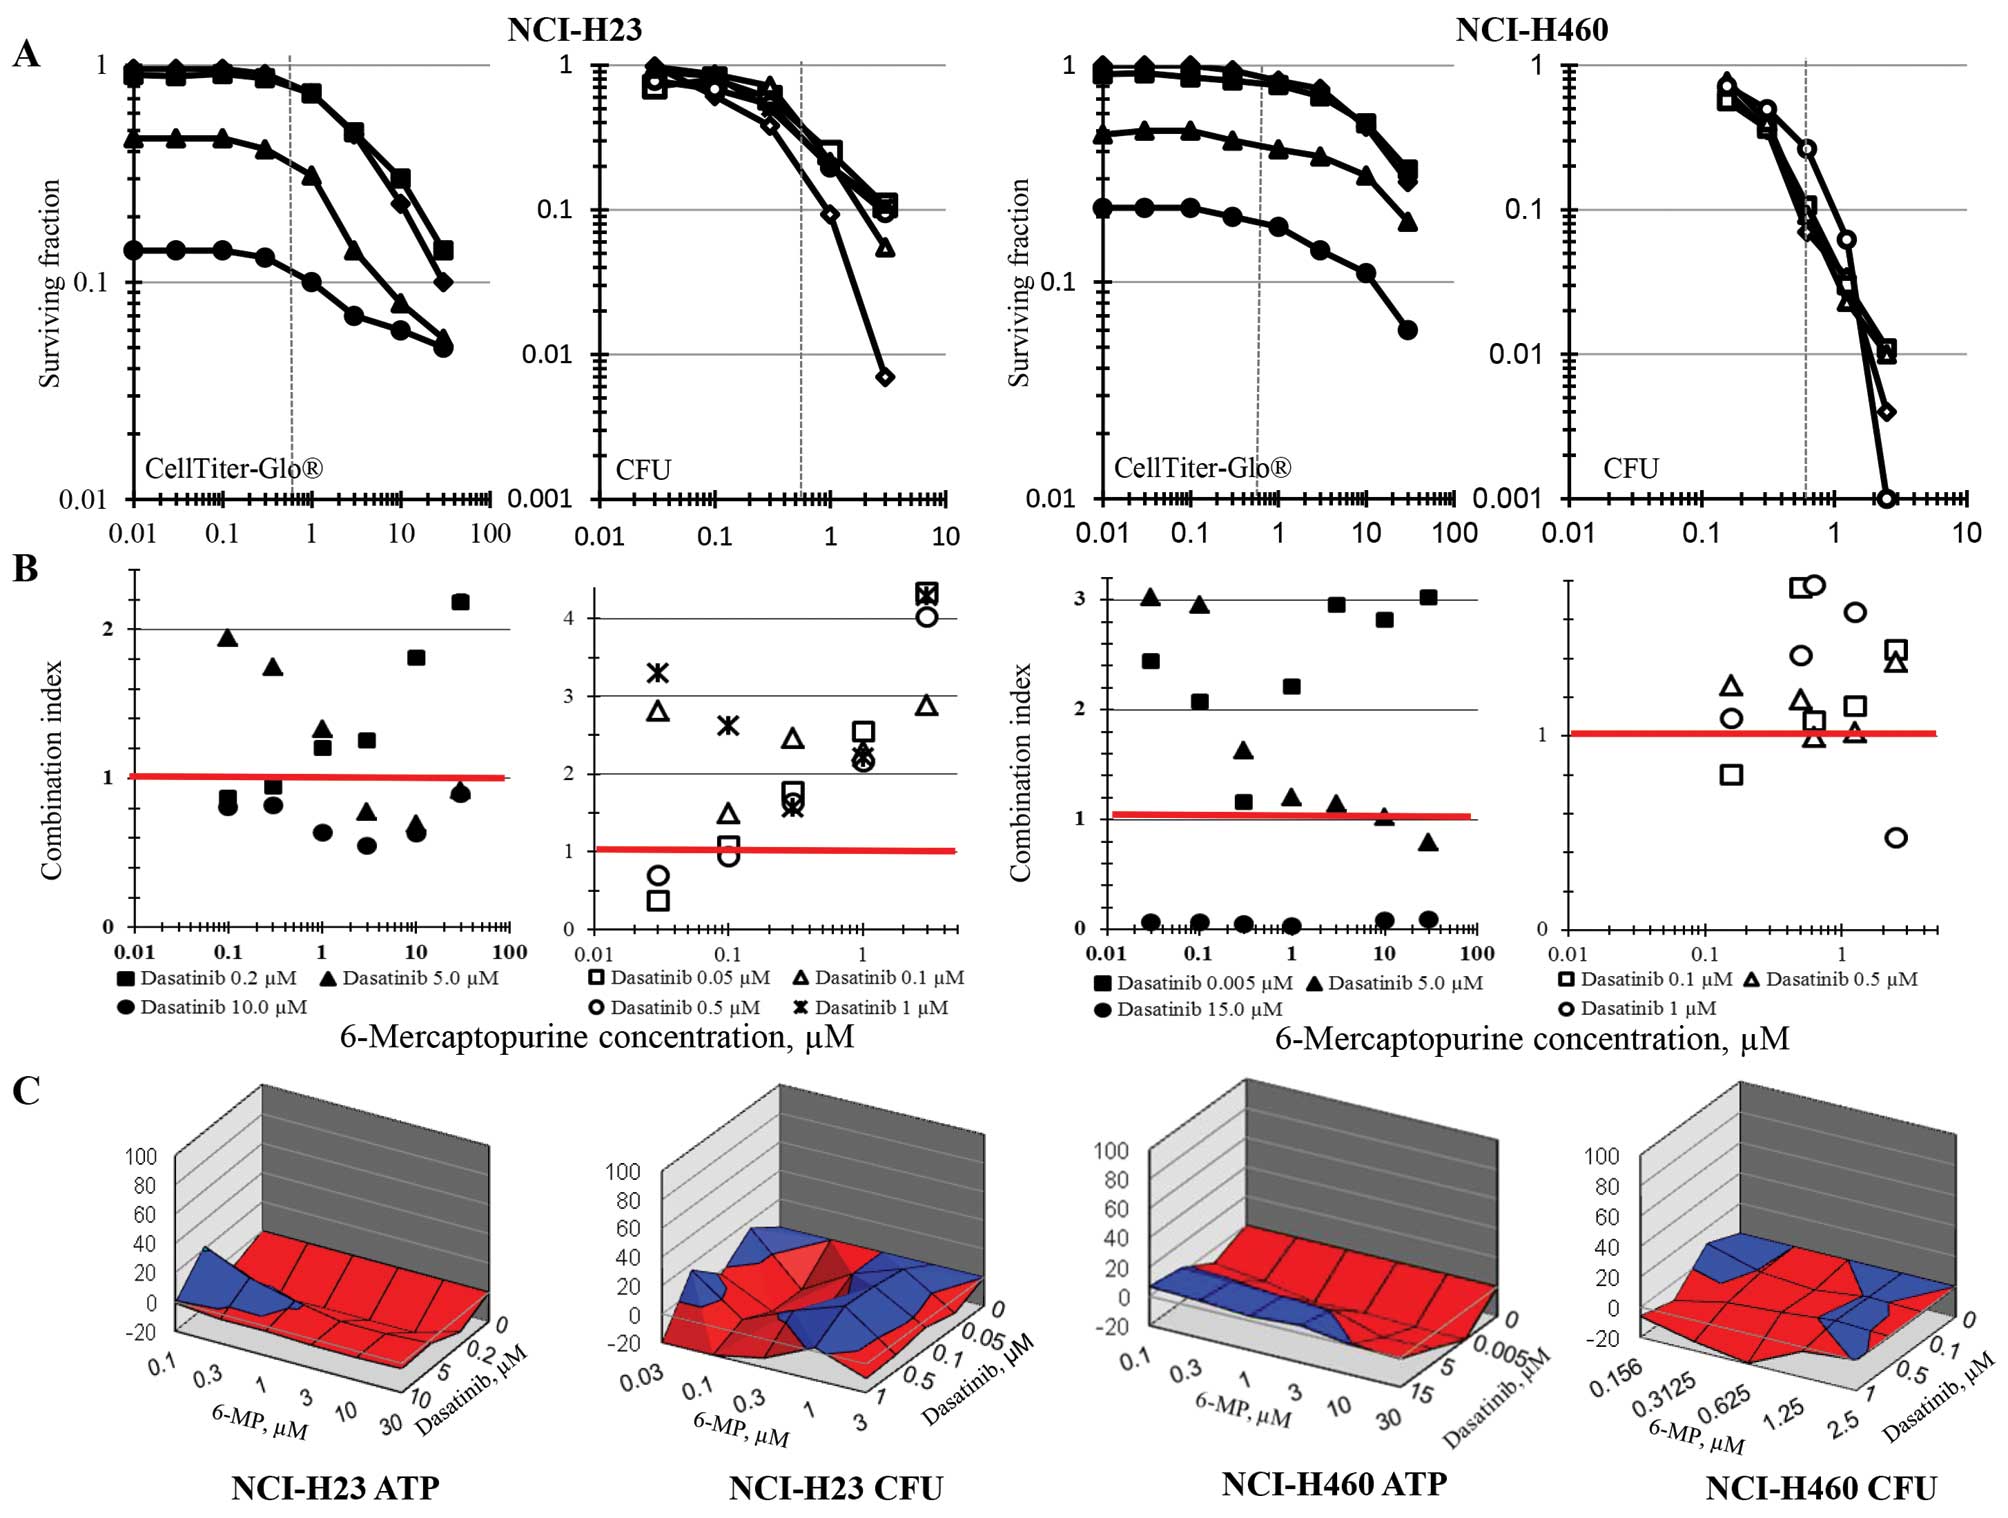
Experiments testing the simultaneous combination of
6-MP and dasatinib in the NCI-H23 and NCI-H460 non-small cell lung
carcinoma cell lines examined a wide dasatinib concentration range
with the ATP content end-point and a narrower dasatinib
concentration range centered on the clinically achievable dasatinib
Cmax concentration with the colony formation end-point
(Fig. 3). The combination index
for 6-MP and dasatinib in the NCI-H23 non-small cell lung cancer
line found modest synergy at the very high dasatinib concentration
of 10 μM and sub-additivity at lower dasatinib
concentrations, while the response surface analysis indicated
sub-additive to additive response to the combination regimens.
Similarly, by colony formation, the combination index analysis and
response surface analysis found the combination of 6-MP and
dasatinib to be additive to sub-additive. In the NCI-H460 cell
line, dasatinib at the very high concentration of 15 μM was
greater than additive when combined with 6-MP in the ATP content
assay using the combination index analysis method; however, the
response surface method found the combinations to be primarily
sub-additive. In the NCI-H460 cells, the colony formation survival
assay found the 6-MP and dasatinib combination was primarily
sub-additive by both the combination index and response surface
methods of data analysis.
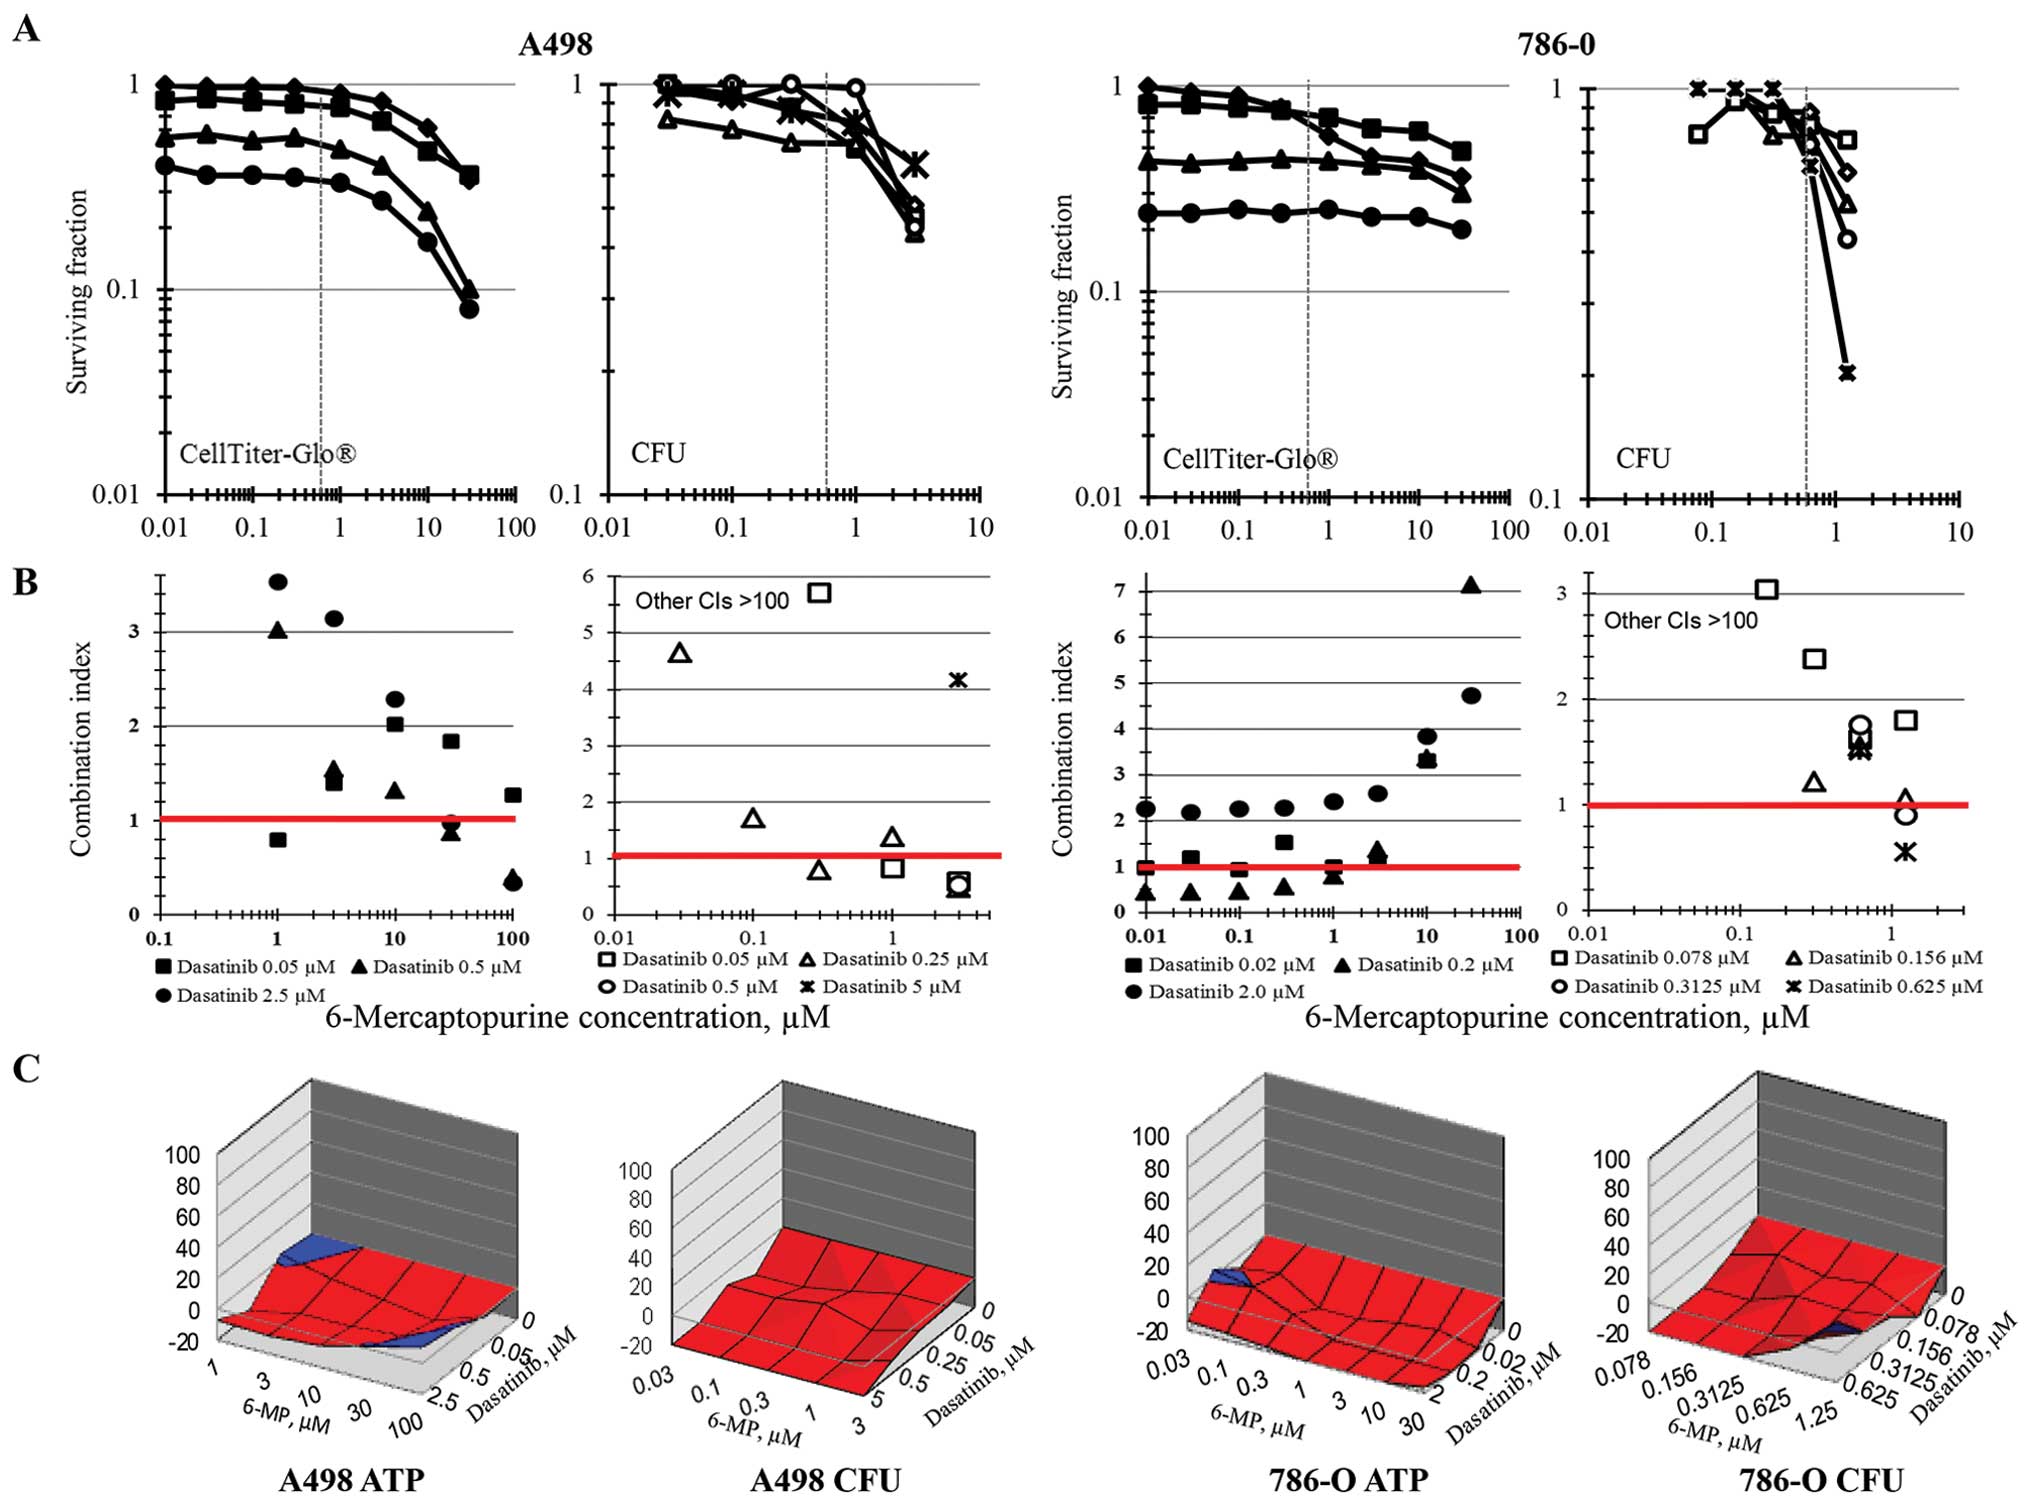
The renal cell carcinoma cell lines A498 and 786-O
had a primarily sub-additive response to the combination of 6-MP
and dasatinib as determined by ATP content using the combination
index method of data analysis (Fig.
4). Interestingly, when 6-MP and dasatinib were tested in the
renal cell carcinoma line by colony formation to measure survival,
data analysis by the combination index method indicated that the
combination was additive to antagonistic producing combination
index values >100 for most of the concentrations tested. The
response surface data analysis similarly showed sub-additive
response to the combinations regimens over all concentrations
tested.
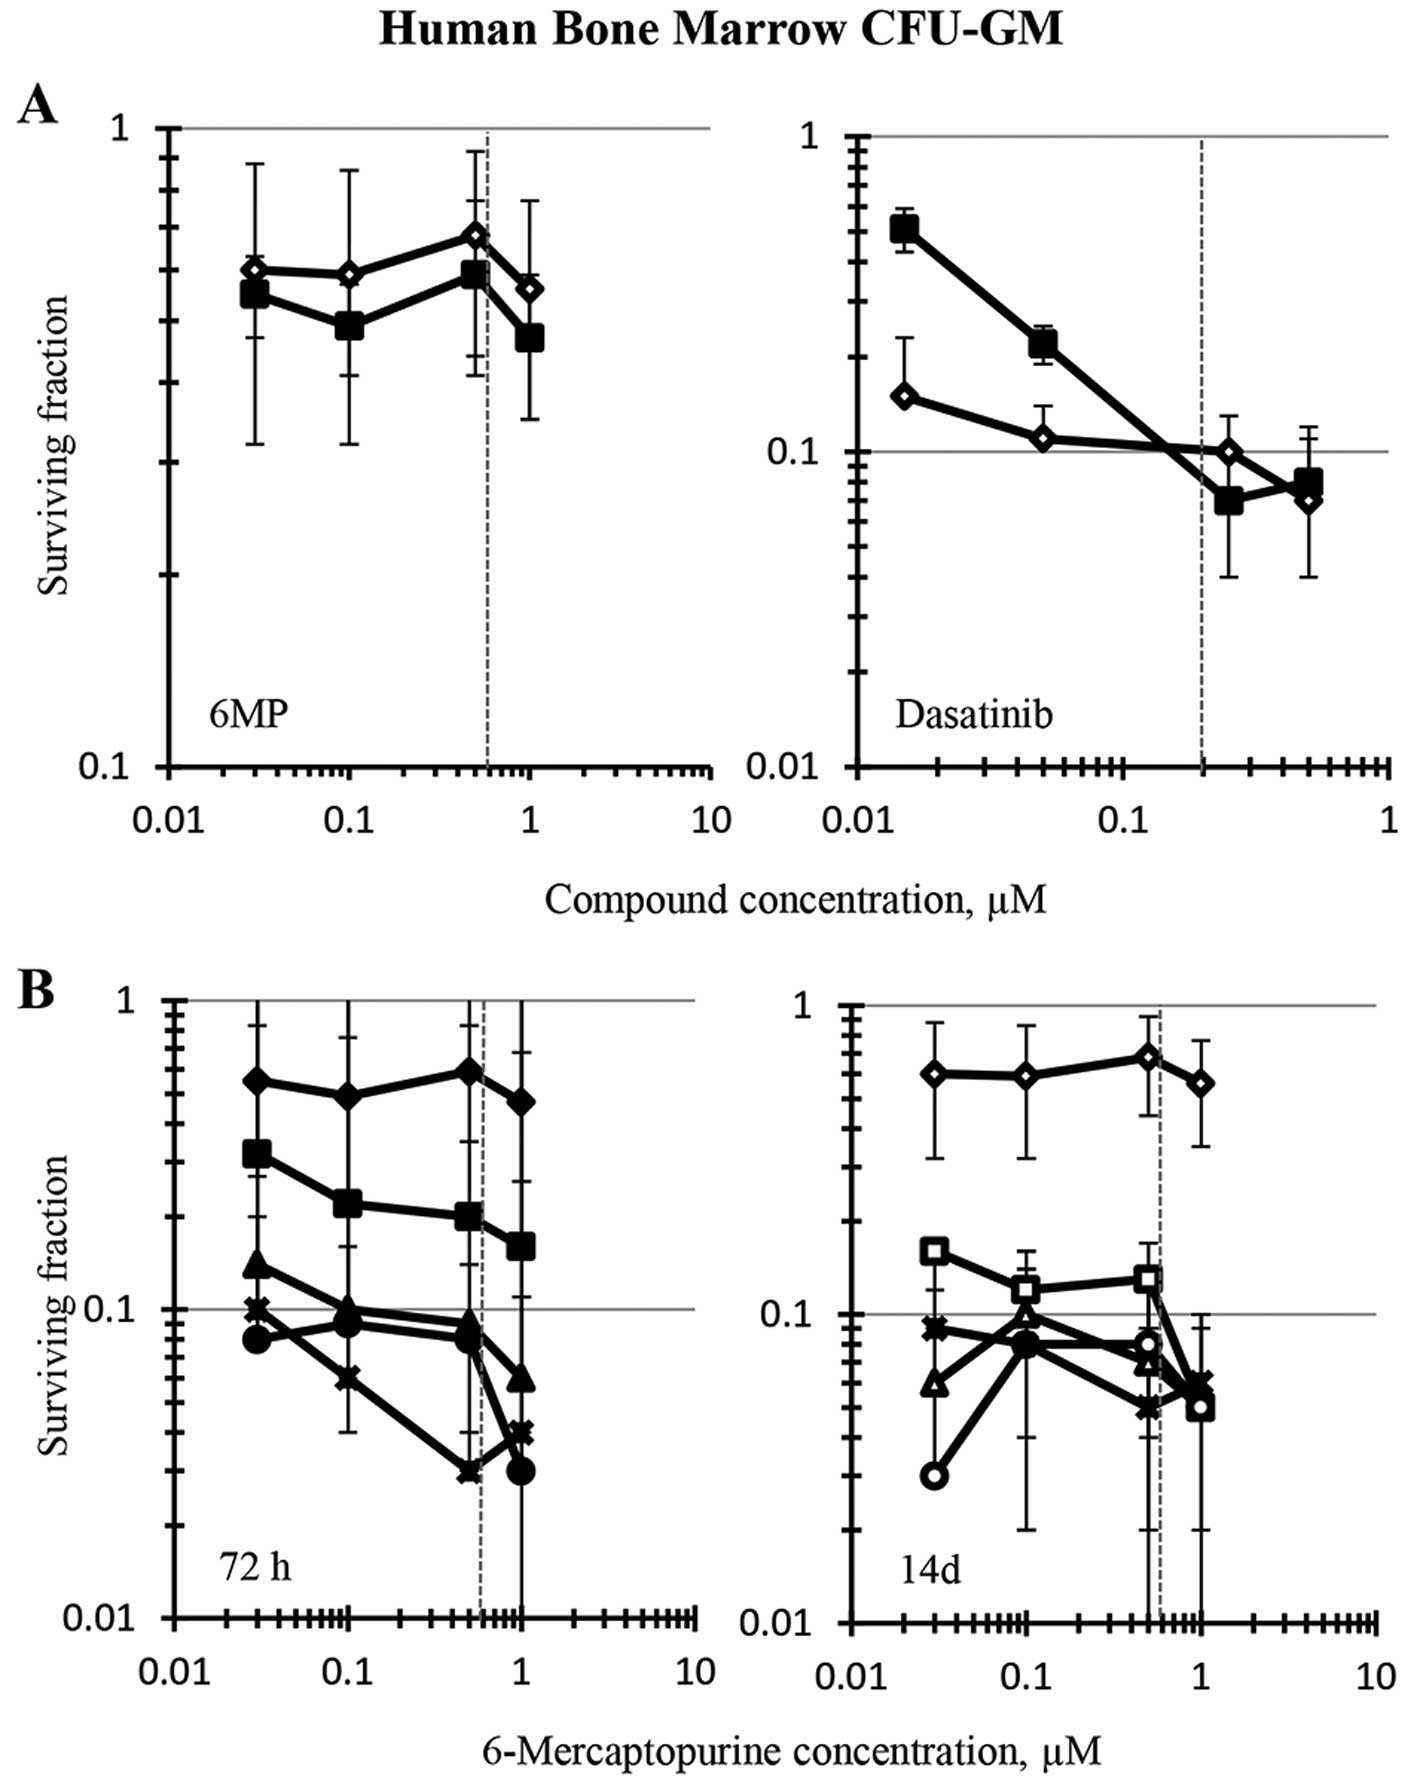
Human bone marrow CFU-GM was modestly sensitive to
6-MP upon 72-h exposure or 14-day continuous exposure in a
concentration range of drug that centered on its clinical
Cmax of 0.6 μM, reaching an IC50 at 1
μM, the highest concentration tested (Fig. 5A). Dasatinib was a more potent
cytotoxicant than 6-MP to human bone marrow CFU-GM and exhibited a
concentration X time response to the drug. The 14-day continuous
exposure to dasatinib produced greater inhibition of colony
formation than 72-h exposure at concentrations below its clinical
Cmax of 0.2 μM (Fig.
5A). The IC90 for 72-h exposure to dasatinib was
0.15 μM, whereas huCFU-GM colony formation was inhibited 90%
by continuous exposure to 0.05 μM dasatinib (Fig. 5, note standard deviation at this
concentration). The 6-MP and dasatinib combination was cytotoxic to
the bone marrow CFU-GM upon both 72-h and 14-day exposure.
Clinically-relevant dasatinib concentrations of 0.05 to 0.25
μM combined with the clinical Cmax concentration
of 6-MP (0.6 μM) inhibited huCFU-GM by 90% or more using
either 72-h or 14-day exposures (Fig.
5B). Comparing the CFU-GM toxicity of dasatinib alone and in
combination with 6-MP indicated that the huCFU-GM toxicity of
dasatinib dominated that of 6-MP.
Discussion
Both 6-MP and dasatinib are used for the treatment
of human leukemia. 6-MP and dasatinib have different mechanisms of
action and by inhibiting differing pathways in cancer cells, are
hypothesized to have greater-than-additive cytotoxicity in
combination. The thiopurines azathioprine, 6-thioguanine (6TG) and
6-MP are effective anti-inflammatory, anticancer and
immunosuppressive drugs and have been in clinical use for over half
a century. 6-MP and azathioprine received FDA approval in 1953 and
1968, respectively (50,51). Dasatinib was approved by the FDA in
2006 for the treatment of resistant, recurrent chronic myelogenous
leukemia, based upon potent inhibition of several mutant forms of
the BCR-ABL kinase that leads to improved survival. As evidenced by
concentration response curves, dasatinib may have off-target
effects at higher than clinically achievable concentrations. It
potently inhibits other kinases including NEK2 and CLK2. NEK2, NIMA
(never in mitosis A)-related kinase, is a homodimeric
serine/threonine kinase that localizes to centrosomes at the onset
of mitosis. NEK2 phosphorylates the intercentrosome linker
proteins, thereby disconnecting the centrosomes and allowing
separation (52). Inhibition of
NEK2 would impair chromosome segregation. CLK2 is a member of the
cdc2-like kinase family which functions by phosphorylating the
spliceosome serine-arginine proteins within the spliceosome
assembly, thus facilitating alternate splicing of pre-mRNAs into
protein-encoding mRNAs leading to protein diversity. Inhibition of
CLK2 would produce misregulation of pre-mRNA splicing (53).
There are several mechanisms by which chemotherapy
combinations can produce metabolic imbalance in cells leading to
cell death; sequential inhibition of multiple enzymes in the same
pathway, concurrent blockade of multiple pathways leading to the
same critical end-product or complimentary inhibition of multiple
pathways in a critical metabolic process (54). Additionally, the term ‘horizontal
combination’ describes combining inhibitors of different pathways
in two or more cell types involved in malignant disease, and the
term ‘vertical combination’ describes combining inhibitors of the
same or related pathways in two or more cell types involved in
malignant disease (55).
The current study evaluated the simultaneous
combination of 6-MP and dasatinib in six human tumor cell lines and
in human bone marrow CFU-GM, a hematopoietic progenitor of the
neutrophil lineage. Using the 72-h ATP content end-point assay, the
clinically achievable concentrations of single agent 6-MP reached
50% response only in the 786-O renal cell carcinoma line. However,
in the colony formation survival assay, a 72-h exposure to 6-MP
achieved 50% cell kill in both the MCF-7 and MDA-MB-468 breast
carcinoma cell lines, and 90% cell kill was achieved at the 6-MP
clinical Cmax concentration in both the NCI-H23 and
NCI-H460 non-small cell lung carcinoma cell lines. Using the 72-h
ATP-content end-point, the clinical Cmax concentration
of single agent dasatinib reached 50% response only in the 786-O
renal cell carcinoma line. However, by colony formation assays
following a 72-h exposure to 6-MP, none of the cell lines reached
50% cell kill at or below the dasatinib Cmax
concentration.
The most striking difference in the combination data
occurred with colony formation in the breast cancer cell lines: the
6-MP plus dasatinib combination was additive to greater than
additive by response surface analysis and greater than additive by
combination index analysis in the MCF-7 line, and markedly
sub-additive by both analytical methods in the MDA-MB-468 line.
Overall, there was reasonable agreement between the ATP content
end-point and the colony formation end-point, when estimating
combinations of concentrations achieving one-log cell kill and when
analyzing for drug interaction with the combination index method or
the response surface method. Among the tumor cell lines, the renal
cell carcinoma lines were most resistant to the 6-MP plus dasatinib
combination, while the non-small lung cancer lines were most
responsive. However, the combination regimen was much more
cytotoxic to bone marrow CFU-GM than to any of the tumor cell
lines, exhibiting greater than one-log kill of these hematopoietic
progenitors at the clinical Cmax of 6-MP combined with
dasatinib concentrations below its clinical Cmax.
Because a 1-log reduction in marrow CFU-GM progenitors associates
with maximum tolerated doses that cause severe neutropenia
(18,21), these in vitro results
suggest that dose reductions of 6-MP and/or dasatinib would likely
be required to avoid severe myelosuppression in solid tumor
patients where adequate marrow function needs to be maintained. In
conclusion, although a scientific rationale can be described for
the combination of 6-MP and dasatinib, it is unlikely that
combining these two drugs will provide increased benefit to solid
tumor patients.
Acknowledgements
This research was supported (in part)
by the Developmental Therapeutics Program in the Division of Cancer
Treatment and Diagnosis of the National Cancer Institute. This
project has been funded in whole or in part with federal funds from
the National Cancer Institute, National Institutes of Health, under
contract no. HHSN261200800001E. The content of this publication
does not necessarily reflect the views or policies of the
Department of Health and Human Services, nor does mention of trade
names, commercial products or organizations imply endorsement by
the U.S. Government.
References
|
1
|
Teicher BA, Herman TS, Holden SA and Eder
JP: Chemotherapeutic potentiation through interaction at the level
of DNA. Synergism and Antagonism in Chemotherapy. Chou TC and
Rideout DC: Academic Press; Orlando, FL: pp. 541–583. 1991
|
|
2.
|
Teicher BA: Human tumor xenografts and
mouse models of human tumors: re-discovering the models. Expert
Opin Drug Discov. 4:1–11. 2009. View Article : Google Scholar : PubMed/NCBI
|
|
3.
|
Sausville EA and Burger AM: Contributions
of human tumor xenografts to anticancer drug development. Cancer
Res. 66:3351–3354. 2006. View Article : Google Scholar : PubMed/NCBI
|
|
4.
|
Sausville EA, Elsayed Y, Monga M and Kim
G: Signal transduction directed cancer treatments. Annu Rev
Pharmacol Toxicol. 43:199–231. 2003. View Article : Google Scholar : PubMed/NCBI
|
|
5.
|
Gitler MS, Monks A and Sausville EA:
Preclinical models for defining efficacy of drug combinations:
mapping the road to the clinic. Mol Cancer Ther. 2:929–932.
2003.PubMed/NCBI
|
|
6.
|
Borisy AA, Elliott PJ, Hurst NW, Lee MS,
Lehar J, Price ER, Serbedzija G, Zimmermann GR, Foley MA, Stockwell
BR and Keith CT: Systematic discovery of multicomponent
therapeutics. Proc Natl Acad Sci USA. 100:7977–7982. 2003.
View Article : Google Scholar : PubMed/NCBI
|
|
7.
|
Tan M, Fang HB, Tian GL and Houghton PJ:
Experimental design and sample size determination for testing
synergism in drug combination studies based on uniform measures.
Stats Med. 22:2091–2100. 2003. View
Article : Google Scholar : PubMed/NCBI
|
|
8.
|
Grabovsky Y and Tallarida RJ:
Isobolographic analysis for combinations of a full and partial
agonist: curved isoboles. J Pharmacol Exp Ther. 310:981–986. 2004.
View Article : Google Scholar : PubMed/NCBI
|
|
9.
|
Zhao L, Wientjes MG and Au JLS: Evaluation
of combinations chemotherapy: integration of nonlinear regression,
curve shift, isobologram and combination index analyses. Clin
Cancer Res. 10:7994–8004. 2004. View Article : Google Scholar
|
|
10.
|
Zhao L, Au JLS and Wientjes MG: Comparison
of methods for evaluating drug-drug interaction. Front Biosci.
2:241–249. 2010. View
Article : Google Scholar : PubMed/NCBI
|
|
11.
|
Levasseur LM, Delon A, Greco WR, Faury P,
Bouquet S and Couet W: Development of a new quantitative approach
for the isobolographic assessment of the convulsant interaction
between perfloxacin and theophylline in rats. Pharm Res.
15:1069–1076. 1998. View Article : Google Scholar : PubMed/NCBI
|
|
12.
|
Greco WR, Faessel H and Levasseur L: The
search for cytotoxic synergy between anticancer agents: a case of
Dorothy and the ruby slippers? J Natl Cancer Inst. 88:699–700.
1996. View Article : Google Scholar : PubMed/NCBI
|
|
13.
|
Berenbaum MC: Re: W.R. Greco et
al., application of a new approach for the quantitation of drug
synergism to the combination of cis-diamminedichloroplatinum and
1-beta-D-arabinofuransylcytosine. Cancer Res 50: 5318–5327, 1990.
Cancer Res. 52:4558–4565. 1992.PubMed/NCBI
|
|
14.
|
Chou TC: Theoretical basis, experimental
design and computerized simulation of synergism and antagonism in
drug combination studies. Pharmacol Rev. 58:621–681. 2006.
View Article : Google Scholar : PubMed/NCBI
|
|
15.
|
Prichard MN, Aseltine KR and Shipman C Jr:
MacSynergy II. Version 1.0. User’s manual. University of Michigan;
Ann Arbor: pp. 1993
|
|
16.
|
Steel GG and Peckham MJ: Exploitable
mechanisms in combined radiotherapy chemotherapy: the concept of
additivity. Int J Radiat Oncol Biol Phys. 5:85–91. 1979. View Article : Google Scholar : PubMed/NCBI
|
|
17.
|
Prichard MN and Shipman C: A
three-dimensional model to analyze drug-drug interactions.
Antiviral Res. 1990:181–206. 1990. View Article : Google Scholar : PubMed/NCBI
|
|
18.
|
Pessina A, Albella B, Bayo M, et al:
Application of the CFU-GM assay to predict acute drug-induced
neutropenia: an international blind trial to validate a prediction
model for the maximum tolerated dose (MTD) of myelosuppressive
xenobiotics. Toxicol Sci. 75:355–367. 2003. View Article : Google Scholar
|
|
19.
|
Kurtzberg LS, Battle T, Rouleau C, Bagley
RG, Agata N, Yao M, Schmid SM, Roth S, Crawford J, Krumbholz R,
Ewesuedo R, Yo XJ, Wang F, LaVoie E and Teicher BA: Bone marrow and
tumor cell colony-forming units and human tumor xenograft efficacy
of noncamptothecin and camptothecin topoisomerase I inhibitors. Mol
Cancer Therap. 7:3212–3222. 2008. View Article : Google Scholar
|
|
20.
|
Masubuchi N: A predictive model of human
myelotoxicity using five camptothein derivatives and the in vitro
colony-forming unit granulocyte/macrophage assay. Clin Cancer Res.
10:6722–6731. 2004. View Article : Google Scholar : PubMed/NCBI
|
|
21.
|
Erickson-Miller C: Differential toxicity
of camptothecin, topotecan and 9-amino-camptothecin to human,
canine, and murine myeloid progenitors (CFUGM) in vitro. Cancer
Chemother Pharmacol. 39:467–472. 1997. View Article : Google Scholar
|
|
22.
|
Kumar S, Gutierrez M, Doroshow JH and
Murgo AJ: Drug development in oncology: classical cytotoxics and
molecularly targeted agents. Brit J Clin Pharmacol. 62:15–26. 2006.
View Article : Google Scholar : PubMed/NCBI
|
|
23.
|
Hitchings GH and Elion GB: The chemistry
and biochemistry of purine analogs. Ann NY Acad Sci. 60:195–199.
1954. View Article : Google Scholar : PubMed/NCBI
|
|
24.
|
Curto R, Voit EO, Sorribas A and Cascante
M: Validation and steady-state analysis of a power-law model of
purine metabolism in man. Biochem J. 324:761–775. 1997.PubMed/NCBI
|
|
25.
|
Salser JS, Hutchison DJ and Balis ME:
Studies on the mechanism of action of 6-mercaptopurine in cell-free
preparations. J Biol Chem. 235:429–432. 1960.PubMed/NCBI
|
|
26.
|
Kela U and Vijayvargiya R: Studies on the
mechanism of action of 6-mercaptopurine: interaction with copper
and xanthine oxidase. Biochem J. 193:799–803. 1981.PubMed/NCBI
|
|
27.
|
Salser JS and Balis ME: The mechanism of
action of 6-mercaptopurine. I. biochemical effects. Cancer Res.
25:46–52. 1965.
|
|
28.
|
Higuchi T, Nakamura T and Wakisaka G:
Metabolism of 6-mercaptopurine in human leukemic cells. Cancer Res.
36:3779–3783. 1976.PubMed/NCBI
|
|
29.
|
Aguilera DG and Tsimberidou AM: Dasatinib
in chronic myeloid leukemia: a review. Therap Clin Risk Man.
5:281–289. 2009.PubMed/NCBI
|
|
30.
|
Fanta S, Sonnenberg M, Skorta I, Duyster
J, Miething C, Aulitzky WE and van der Kuip H: Pharmacological
inhibition of c-Abl compromises genetic stability and DNA repair in
Bcr-Abl-negative cells. Oncogene. 27:4380–4384. 2008. View Article : Google Scholar : PubMed/NCBI
|
|
31.
|
Bantscheff M, Eberhard D, Abraham Y,
Bastuck S, Boesche M, Hobson S, Mathieson T, Perrin J, Raida M, Rau
C, Reader V, Sweetman G, Bauer A, Bouwmeester T, Hopf C, Kruse U,
Neubauer G, Ramsden N, Rick J, Kuster B and Drewes G: Quantitative
chemical proteomics reveals mechanisms of action of clinical ABL
kinase inhibitors. Nat Biotech. 25:1035–1044. 2007. View Article : Google Scholar : PubMed/NCBI
|
|
32.
|
Pan C, Olsen JV, Daub H and Mann M: Global
effects of kinase inhibitors on signaling networks revealed by
quantitative phosphoproteomics. Molec Cell Proteomics. 8:2796–2808.
2009. View Article : Google Scholar : PubMed/NCBI
|
|
33.
|
Secord AA, Teoh DK, Barry WT, Yu M,
Broadwater G, Havrilesky LJ, Lee PS, Berchuck A, Lancaster J and
Wenham RM: A phase I trial of dasatinib, a Src-family kinase
inhibitor, in combination with paclitaxel and carboplatin in
patients with advanced or recurrent ovarian cancer. Clin Cancer
Res. 18:5488–5498. 2012. View Article : Google Scholar : PubMed/NCBI
|
|
34.
|
Soule HD, Vazguez J, Long A, Albert S and
Brennan M: A human cell line from a pleural effusion derived from a
breast carcinoma. J Natl Cancer Inst. 51:1409–1416. 1973.PubMed/NCBI
|
|
35.
|
Brandes LJ and Hermonat MW: Receptor
status and subsequent sensitivity of subclones of MCF-7 human
breast cancer cells surviving exposure to diethylstilbestrol.
Cancer Res. 43:2831–2835. 1983.PubMed/NCBI
|
|
36.
|
Komarova EA, Zelnick CR, Chin D, Zeremski
M, Gleiberman AS, Bacus SS and Gudkov AV: Intracellular
localization of p53 tumor suppressor protein in gamma-irradiated
cells is cell cycle regulated and determined by the nucleus. Cancer
Res. 57:5217–5220. 1997.PubMed/NCBI
|
|
37.
|
Cailleau R, Olive M and Cruciger QV:
Long-term human breast carcinoma cell lines of metastatic origin:
preliminary characterization. In Vitro. 14:911–915. 1978.
View Article : Google Scholar : PubMed/NCBI
|
|
38.
|
Nigro JM, Baker SJ, Preisinger AC, Jessup
JM, Hostetter R, Cleary K, Bigner SH, Davidson N, Baylin S, Devilee
P, et al: Mutations in the p53 gene occur in diverse human tumor
types. Nature. 342:705–707. 1989. View Article : Google Scholar : PubMed/NCBI
|
|
39.
|
Gazdar AF, Carney DN, Russell EK, Sims HL,
Baylin SB, Bunn PA, Guccion JG and Minna JD: Establishment of
continuous, clonable cultures of small cell carcinoma of the lung
which have amine precursor uptake and decarboxylation cell
properties. Cancer Res. 40:3502–3507. 1980.PubMed/NCBI
|
|
40.
|
Mitsudomi T, Steinberg SM, Nau MM, Carbone
D, D’Amico D, Bodner S, Oie HK, Linnoila RI, Mulshine JL, Minna JD,
et al: p53 gene mutations in non-small cells lung cancer cell lines
and their correlation with the presence of ras mutations and
clinical features. Oncogene. 7:171–180. 1992.PubMed/NCBI
|
|
41.
|
Banks-Schlegel SP, Gazdar AF and Harris
CC: Intermediate filament and cross-linked envelope expression in
human lung tumor cell lines. Cancer Res. 45:1187–1197.
1985.PubMed/NCBI
|
|
42.
|
Takahashi T, Nau MM, Chiba I, et al: p53:
a frequent target for genetic abnormalities in lung cancer.
Science. 246:491–494. 1989. View Article : Google Scholar : PubMed/NCBI
|
|
43.
|
Giard DJ, Aaronson SA, Todaro GJ, Arnstein
P, Kersey JH, Dosik H and Parks WP: In vitro cultivation of human
tumors: establishment of cell lines derived from a series of solid
tumors. J Natl Cancer Inst. 51:1417–1423. 1973.PubMed/NCBI
|
|
44.
|
Fogh J, Wright WC and Loveless JD: Absence
of HeLa cell contamination in 169 cell lines derived from human
tumors. J Natl Cancer Inst. 58:209–214. 1977.PubMed/NCBI
|
|
45.
|
Williams RD, Elliott AY, Stein N and
Fraley EE: In vitro cultivation of human renal cell cancer. I.
Establishment of cells in culture. In Vitro. 12:623–627. 1976.
View Article : Google Scholar : PubMed/NCBI
|
|
46.
|
Williams RD, Elliott AY, Stein N and
Fraley EE: In vitro cultivation of human renal cell cancer. II.
Characterization of cell lines. In Vitro. 14:779–786. 1978.
View Article : Google Scholar : PubMed/NCBI
|
|
47.
|
Chou TC: Drug combination studies and
their synergy quantification using the Chou-Talalay method. Cancer
Res. 70:440–446. 2010. View Article : Google Scholar : PubMed/NCBI
|
|
48.
|
Balis FM, Holcenberg JS, Poplack DG, Ge J,
Sather HN, Murphy RF, Ames MM, Waskerwitz MJ, Tubergen DG, Zimm S,
Gilchist GS and Bleyer WA: Pharmacokinetics and pharmacodynamics of
oral methotrexate and mercaptopurine in children with lower risk
acute lymphoblastic leukemia: a joint children’s cancer group and
pediatric oncology branch study. Blood. 92:3569–3577.
1998.PubMed/NCBI
|
|
49.
|
Alpenc R, Blaney SM, Strauss LC, Balis FM,
Shusterman S, Ingle AM, Agrawal S, Sun J, Wright JJ and Adamson PC:
Pediatric phase I trial and pharmacokinetic study of dasatinib: a
report from the Children’s Oncology Group phase I Consortium. J
Clin Oncol. 29:839–844. 2011.PubMed/NCBI
|
|
50.
|
Elion GB: The purine path to chemotherapy.
Science. 244:41–47. 1989. View Article : Google Scholar : PubMed/NCBI
|
|
51.
|
Karran P and Attard N: Thiopurine in
current medical practice: molecular mechanisms and contributions to
therapy-related cancer. Nature Rev Cancer. 8:24–36. 2008.
View Article : Google Scholar : PubMed/NCBI
|
|
52.
|
Mardin BR, Lange C, Baxter JE, Hardy T,
Scholz SR, Fry AM and Schiebel E: Components of the hippo pathway
cooperate with nek2 kinase to regulate centrosome disjunction. Nat
Cell Biol. 12:1166–1178. 2010. View Article : Google Scholar : PubMed/NCBI
|
|
53.
|
Rosenthal AS, Tanega C, Shen M, Mott BT,
Bougie JM, Nguyen DT, Misteli T, Auld DS, Maloney DJ and Thomas CJ:
Potent and selective small molecular inhibitors of specific
isoforms of cdc2-like kinases (Clk) and dual specificity
tyrosine-phosphorylation-regulated kinases (Dyrk). Bioorg Med Chem
Lett. 21:3152–3158. 2011. View Article : Google Scholar : PubMed/NCBI
|
|
54.
|
Sartorelli AC: Some approaches to the
therapeutic exploitation of metabolic sites of vulnerability of
neoplastic cells. Cancer Res. 29:2292–2299. 1969.PubMed/NCBI
|
|
55.
|
Sosman JA, Puzanov I and Atkins MB:
Opportunities and obstacles to combination targeted therapy in
renal cell cancer. Clin Cancer Res. 13:764s–769s. 2007. View Article : Google Scholar : PubMed/NCBI
|