Introduction
The pathological category of low-grade B cell
non-Hodgkin’s lymphoma (NHL) encompasses mature B cell neoplasms
with small to medium-sized cells such as follicular lymphoma (FL),
marginal zone lymphoma (MZL), B cell chronic lymphocytic
leukemia/small lymphocytic lymphoma (B-CLL/SLL), and mantle cell
lymphoma (MCL). The histological transformation of low-grade
lymphomas is thought to have a major impact on their prognosis,
however, the clonal relationship between the two neoplasm types and
the pathogenesis underlying the progression of the disease are
still controversial.
MCL is considered a well categorized B cell NHL
because virtually all cases feature the chromosomal translocation
t(11;14)(q13;q32) (IgH/CCND1) which leads to cyclin D1
(CCND1) overexpression. Despite this strong genetic hallmark, MCL
presents in a broad spectrum of morphological forms with a high
number of additional chromosomal abnormalities. From a practical
point of view, we can detect the mantle zone growth pattern, which
represents the initial component of MCL, in only 8.6% of cases
(1). Aggressive transformation in
MCL is more notable, occurring in 32% of living cases and in 70% of
autopsy cases (2). Hence, the
presence of pathological evidence such as characteristic cytologies
(small, classical, blastic and pleomorphic) or proliferating
patterns (mantle-zone, nodular and diffuse) at the time of biopsy
seems to depend on temporal changes in the accumulation of
molecular genetic alterations.
For an accurate understanding of MCL, there are some
questions requiring resolution. First, why is this lymphoma
characterized by biological heterogeneity despite the
characteristic translocation event? Second, what is required for
the initial pathogenesis of MCL in addition to the t(11;14)
translocation? A recent study has shown that the t(11;14)
translocation alone is not sufficient to produce tumors (3) and, though at very low levels,
t(11;14)-positive cells have been found in the blood of healthy
individuals (4). Thus, key
molecular behavior in MCL is thought to be divided into two major
stages: initial lymphomagenesis in addition to the t(11;14)
translocation (initiation) and the accumulation of variable
secondary genomic alterations occurring over time, leading to the
evolution into more aggressive forms (transformation).
Recently, microarray profiling studies have
identified differential expression of several genes in the
progression of MCL (5-7). Some of these studies have used
purified mantle zone B lymphocytes sorted from reactive
tonsillectomy specimens for gene expression profiling to avoid
contamination with stromal cells, T cells and macrophages (6,7). In
these studies, several genes identified as overexpressed in
aggressive form are known to be involved in cell cycle control or
apoptotic cell death, and several genes related to the PI3K/AKT,
WNT and TGF-β signaling pathways are reportedly important in the
pathogenesis of MCL. Although morphological heterogeneity remains a
central issue in the prognosis and treatment of this lymphoma, no
gene expression profiling studies to date have attempted to
identify the genes and signaling pathways involved in the each
event separately. The present study was designed based on the
concept that gene expression profiling of morphologically
heterogeneous MCL samples would provide insight into the role of
aberrant gene expression for both initial lymphomagenesis and
transformation events.
Materials and methods
Patients and tissue samples
We performed cDNA microarray experiments using
frozen tissues of 19 lymph node biopsies. A total of 15 MCLs were
collected from the files of the Departments of Pathology of Kurume
University (Fukuoka, Japan), which include a total of 237 MCL
patients (1) confirmed by
histology as CCND1-positive (Table
I). All 15 cases were subjected to cytogenetic and/or FISH
studies and found positive for the IgH/CCND1. This study was
approved by the Kurume University Institutional Review Board, and
patients provided informed consent in accordance with the
Declaration of Helsinki.
 | Table I.Data of studied patients. |
Table I.
Data of studied patients.
| Case | Age | Sex | Diagnosis | Tissue | Growth pattern | PI (Ki-67) | IgH/CCND1 | RNA extraction |
|---|
| R1 | 36 | F | Benign
lymphadenitis | LN | - | ND | ND | LMD |
| R2 | 25 | F | Benign
lymphadenitis | LN | - | ND | ND | LMD |
| R3 | 54 | M | Benign
lymphadenitis | LN | - | ND | ND | LMD |
| R4 | 14 | M | Benign
lymphadenitis | LN | - | ND | ND | LMD |
| MCL112 | 68 | M | MCL in
situ | LN | MZ | 15 | + | LMD |
| MCL113 | 49 | M | MCL in
situ | LN | MZ | 10 | + | LMD |
| MCL114 | 73 | M | MCL in
situ | LN | MZ | 20 | + | LMD |
| MCL71 | 57 | M | MCL in
situ | LN | MZ | 5 | + | LMD |
| MCL126 | 79 | M | Classical MCL
(cMCL) | LN | N | 25 | + | Whole |
| MCL135 | 59 | M | cMCL | LN | N | 20 | + | Whole |
| MCL141 | 75 | M | cMCL | LN | N | 25 | + | Whole |
| MCL200 | 75 | M | cMCL | LN | N | 30 | + | Whole |
| MCL80 | 80 | M | Intermediate MCL
(iMCL) | LN | N&D | 20/80 | + | LMD |
| MCL132 | 67 | F | iMCL | LN | N&D | 15/95 | + | LMD |
| MCL5 | 71 | M | Aggressive MCL
(aMCL) | LN | D | 70 | + | Whole |
| MCL40 | 77 | F | aMCL | LN | D | 70 | + | Whole |
| MCL98 | 87 | M | aMCL | LN | D | 95 | + | Whole |
| MCL102 | 77 | M | aMCL | LN | D | 75 | + | Whole |
| MCL107 | 76 | M | aMCL | LN | D | 60 | + | Whole |
In order to identify differentially expressed genes
and their contribution to each event, we posited four stepwise
morphological grades for MCL: MCL in situ, MCL with
classical form (cMCL), MCL with aggressive form (aMCL), and MCL
with intermediate morphology between classical and aggressive forms
at the same site (iMCL) (Fig. 1).
Namely, MCL in situ is defined as those samples with a very
thin neoplastic mantle zone growth pattern and very little or no
spreading of tumor cells into interfollicular areas. cMCL is
characterized by a prominent nodular proliferation of atypical
medium-sized tumor cells (classical form) without diffuse
proliferation. aMCL is designated as a combination of two
morphological forms: blastoid and pleomorphic. iMCL contains
distinct areas of both classical and aggressive forms.
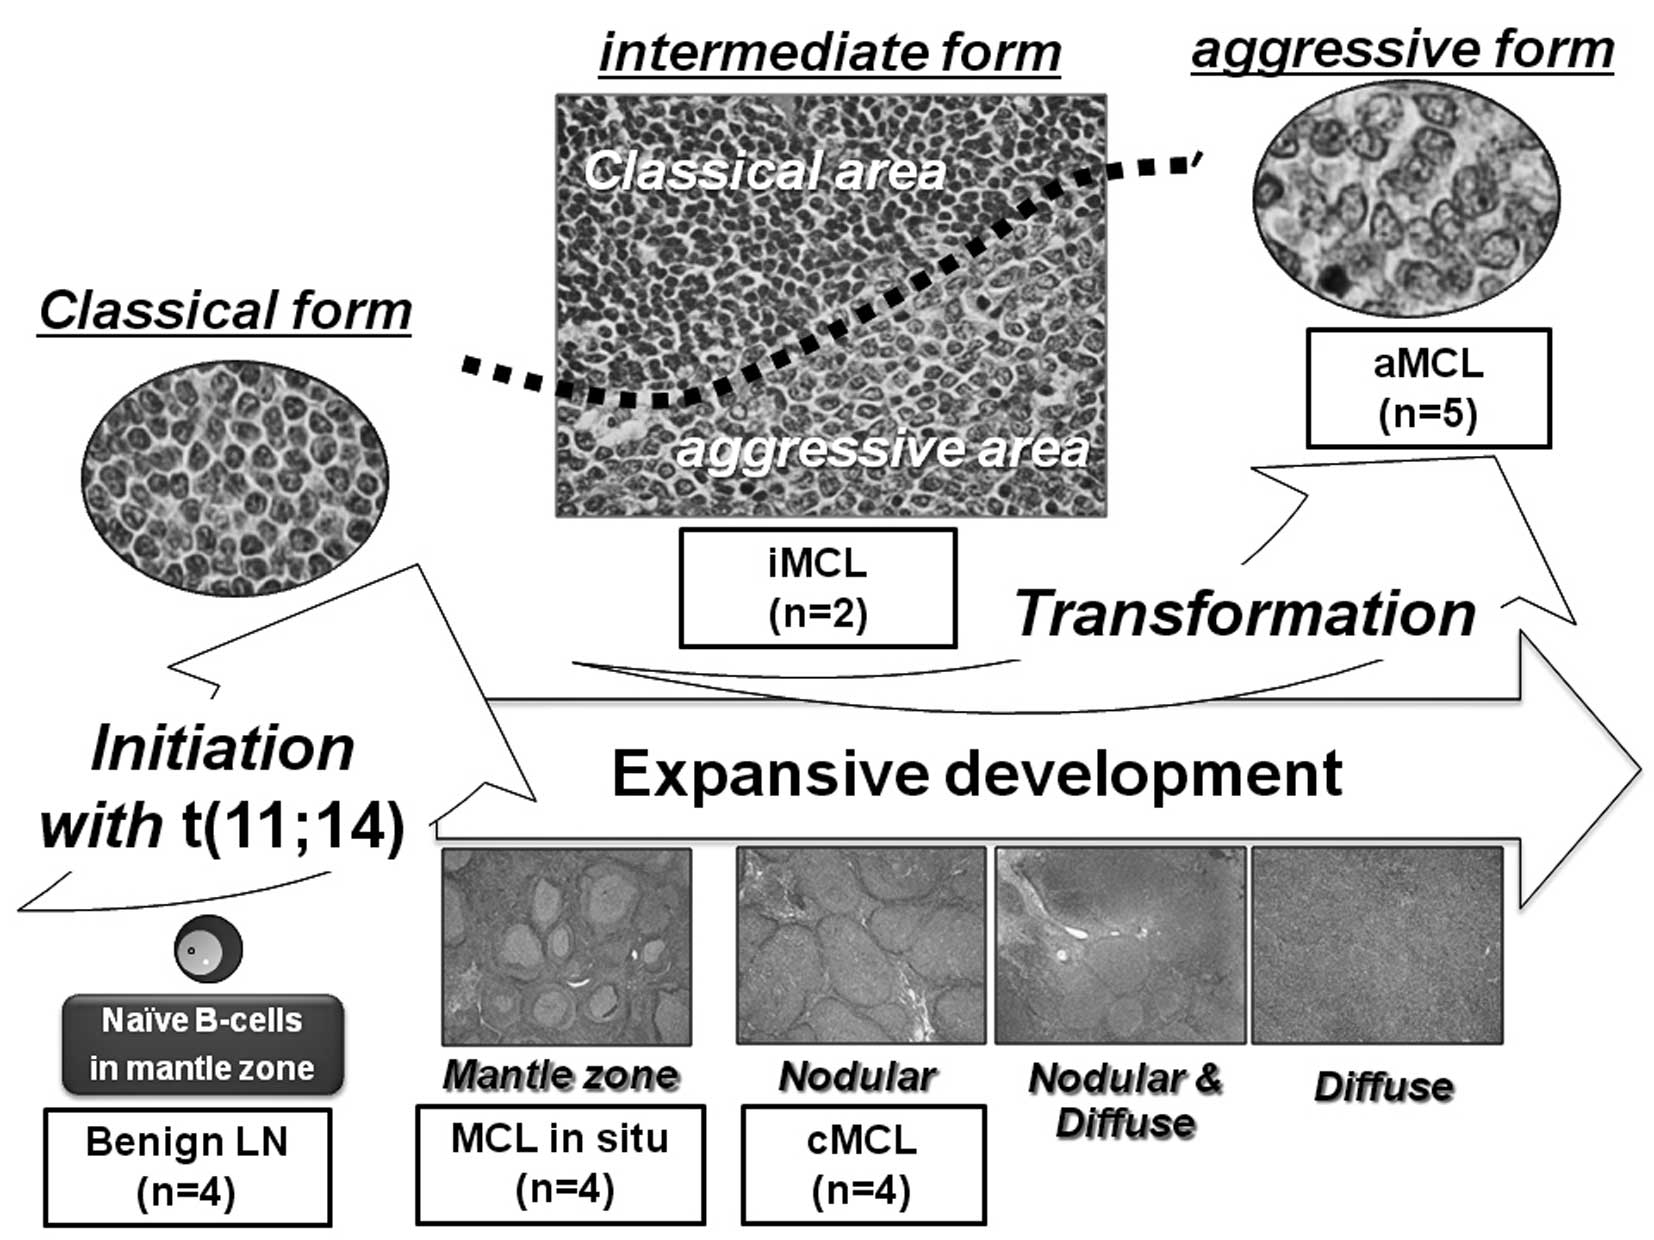 | Figure 1.Schema of the stepwise morphological
grades for MCL used in the present study. This diagram shows the
morphological evolution of MCL occurring in parallel with
transformational development (classical, intermediate, and
aggressive) and expansive development (mantle zone, nodular,
nodular & diffuse, and diffuse). The origin of MCL cells is
postulated as naive CD5-positive pre-germinal center B cells. In
order to identify the genes contributing to each event, we posited
four stepwise morphological grades for MCL: MCL in situ, MCL
with classical form (cMCL), MCL with aggressive form (aMCL), and
MCL with intermediate morphology between classical and aggressive
forms at the same site (iMCL). MCL in situ represents the
mantle zone growth pattern in that the neoplastic mantle zone was
very thin and there was very little if any spreading of tumor cells
into interfollicular areas. cMCL is characterized by a prominent
nodular proliferation of atypical medium-sized tumor cells
(classical form) without diffuse area. iMCL contains both classical
and aggressive form areas but separated by border lines (black
dotted line). aMCL was designated a combination of two
morphological forms, blastoid and pleomorphic. |
For evaluation of initiation, we compared samples
from the tumor cells of MCL in situ (n=4) with those from
normal mantle zone B-lymphocytes from benign lymphadenitis (n=4).
Samples were derived from selected specimens by means of laser
microdissection (LMD). We hypothesize that transformation into aMCL
is a multistep process, similar to the progression of carcinomas.
It may be beneficial to subdivide aMCL neoplasms into two major
subtypes: ‘aMCL with genetic stepwise process’ which results from
the accumulation of many molecular genetic alterations and ‘de
novo aMCL’ resulting from fewer but stronger genetic
alterations. Therefore, comparing cMCL with aMCL is not sufficient
for the detection of transformation specific genes because it is
not possible to distinguish them morphologically. Alternatively, we
expected that using results from the gene selection method in
combination with that of iMCL cases (n=2) would provide the
candidate genes restricted within aMCL having genetic stepwise
process. Additionally, using iMCL samples as a discovery set can
compensate for individual differences between cases. For a concrete
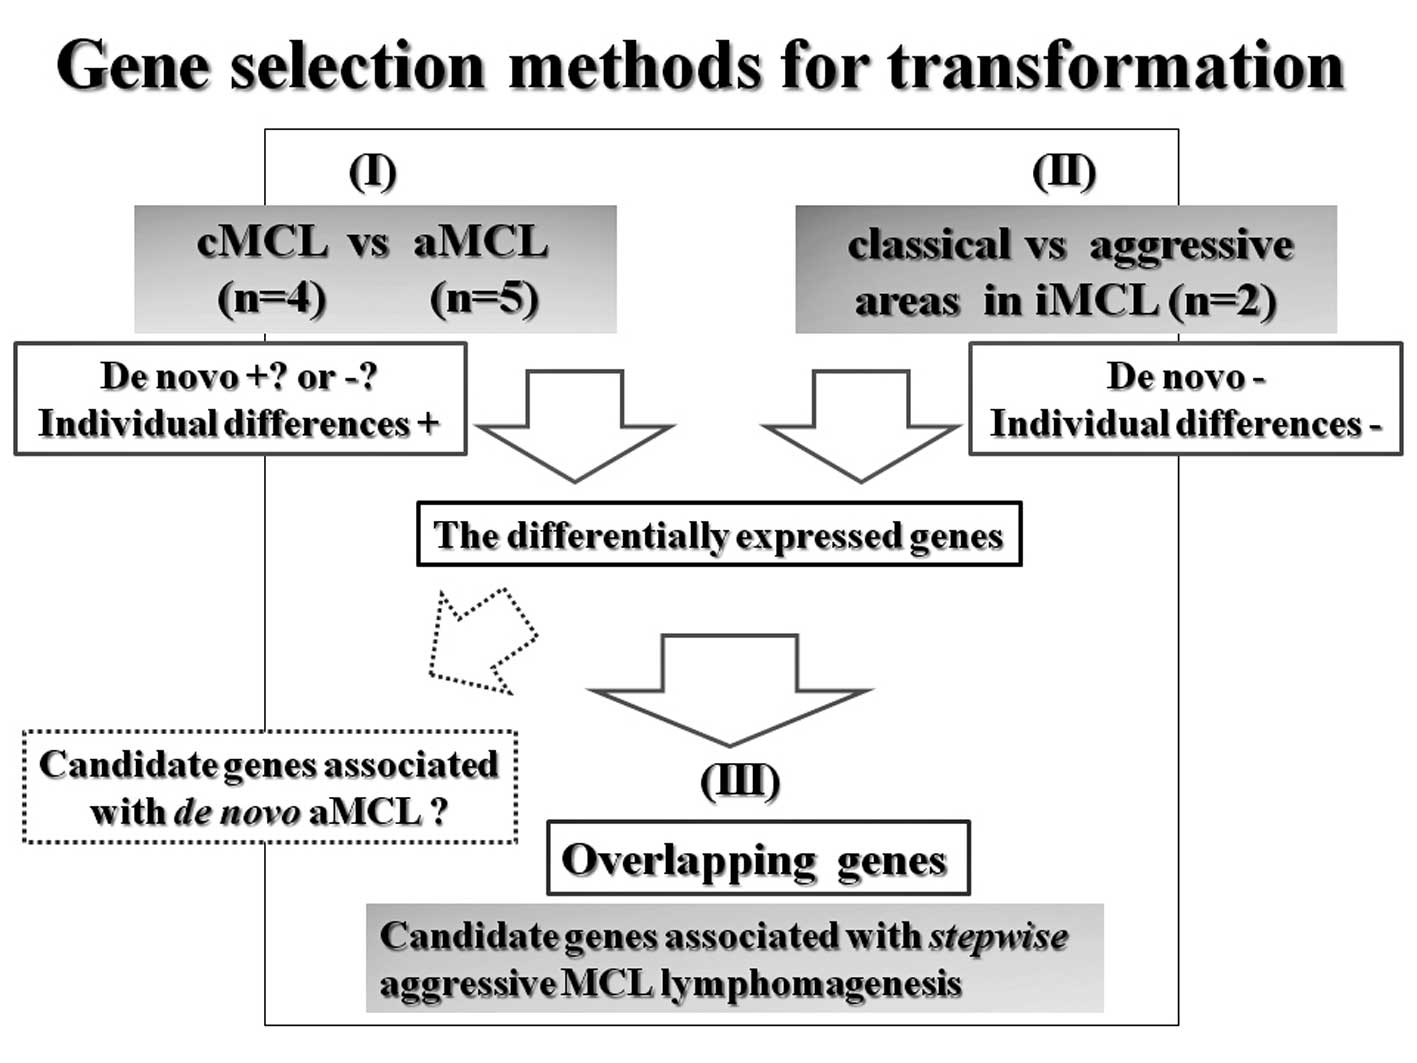
explanation of transformation, total RNA from whole tumor tissue
samples, cMCL (n=4) and aMCL (n=5) were used [Fig. 2(I)]. We also compared classical
areas with aggressive areas in iMCL obtained by LMD [Fig. 2(II)]. Finally, we selected the
overlapping genes differentially expressed in both comparisons
[Fig. 2(III)].
Laser microdissection (LMD)
The tissue samples were immediately frozen in
acetone/dry ice and stored at -80°C for microdissection. The lymph
node samples were embedded in an optical cutting temperature (OCT)
compound (Sakura Finetek, Tokyo, Japan) and frozen in liquid
nitrogen. Cryosections (10-μm-thick) were mounted on
2.0-μm-thick PEN-Membrane slides (MicroDissect GmbH,
Herborn, Germany). After fixation in 100% ethanol, the slides were
stained rapidly with Toluidine Blue O (Chroma-Gesellschaft Schmid
GmbH & Co., Köngen, Germany) and then washed in DEPC-treated
water and air-dried with a fan. The frozen sections were
microdissected with a Leica LMD6000 laser microdissection system by
following the company’s protocol (Leica, Wetzlar, Germany). The
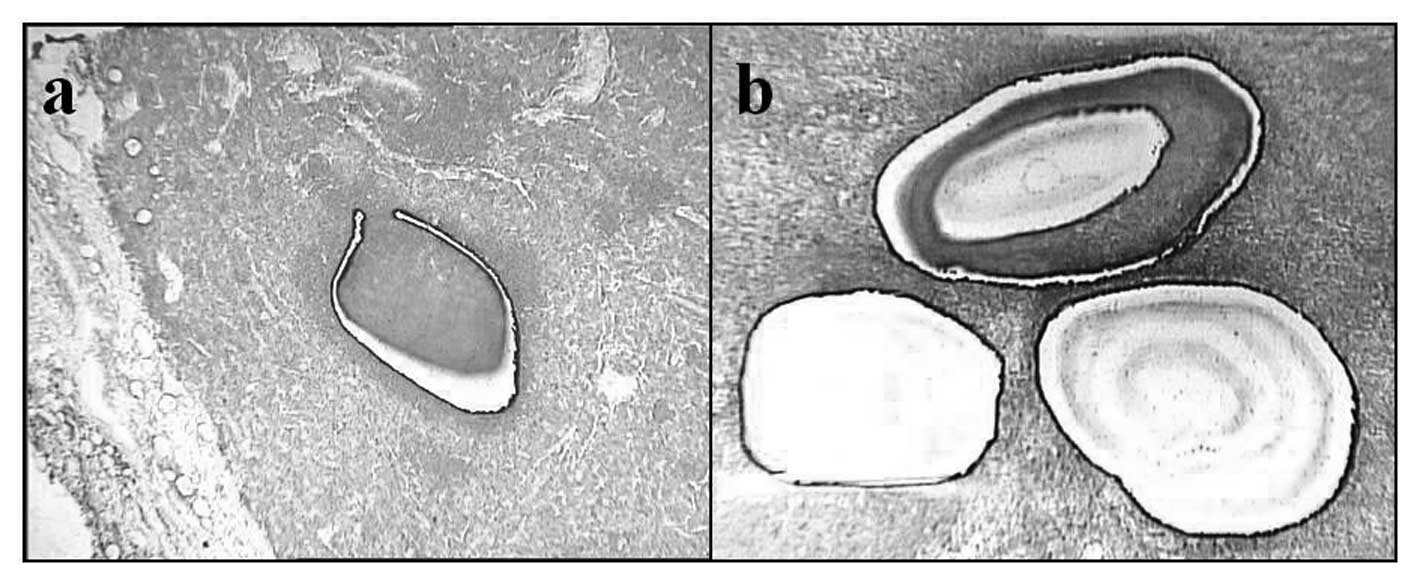
sorting regions were micro-dissected from the tissue sections with
LMD (Fig. 3), and the dissected
cells were collected in 0.5 ml tubes filled with 50 μl lysis
buffer for RNA extraction.
RNA extraction and biotinylated cRNA
amplification
Total RNA was extracted from the LMD-obtained
samples with an RNAqueous-Micro kit (Ambion, Austin, TX, USA)
according to the manufacturer’s instructions. For cMCL and aMCL
tissues, total RNA was isolated using TRIzol reagent (Invitrogen,
Carlsbad, CA, USA). RNA samples were quantified by an ND-1000
spectrophotometer (NanoDrop Technologies, Wilmington, DE, USA) and
the quality was confirmed with an Experion System (Bio-Rad
Laboratories, Hercules, CA, USA). Both cRNA amplification and
labeling with biotin were used to prepare samples for gene
expression profiling by microarray analysis. Briefly, 350-500 ng
total RNA was amplified overnight (14 h) with the Illumina Total
Prep RNA Amplification kit (Ambion) in accordance with the
manufacturer’s protocol. Reaction cRNA was biotinylated during
in vitro transcription.
Illumina BeadChips microarray
Sentrix Human WG-6 v3.0 Expression BeadChips were
purchased from Illumina, Inc. (San Diego, CA, USA). More than
48,000 different bead types, each with a 50-base gene-specific
probe, are represented on a single Beadchip. For each probe
represented on the array, beads are assembled with an average
30-fold redundancy. A hybridization mixture containing 1.5
μg biotinylated cRNA was hybridized to the beadchips at 58°C
overnight (18 h) before being washed and stained with
streptavidin-Cy3 (GE Healthcare, Buckinghamshire, UK) according to
the manufacturer’s protocol. Beadchips were scanned on Illumina
BeadStation 500 and fluorescent hybridization signals were assessed
with Illumina BeadStudio software.
Immunohistochemistry
The samples were also evaluated for expression of
markers such as Wnt3 (Abcam Inc., Cambridge, MA, USA),
phosphorylated-β-catenin (Ser552) (pβ-catenin-S552) (Cell
Signaling, Boston, MA, USA), and Ki-67 (Dako Cytomation,
Glostrup, Denmark). Formalin-fixed, paraffin-embedded tissues were
used for all immunohistochemical stains. Antibody dilutions and
antigen retrieval procedures were performed as standards.
Data analysis and filter criteria
Pre-processing was performed on the raw signal
intensities of all samples by log2-transformation and
normalization using the quantile algorithm of the ‘preprocess Core’
library package (8) in
Bioconductor (9). We selected the
probes (excluding the control probes) where the detection p-value
was <0.01 in all samples, and used only these probes to identify
differentially expressed genes. For the samples meeting the
criteria of initiation (MCL in situ vs. normal mantle zone B
lymphocytes) and transformation (I) (cMCL vs. aMCL), we applied
Linear Models for Microarray Analysis (limma) package (10) of Bioconductor. We used a cutoff of
limma p-value <0.05 and absolute log-fold change (|logFC|)
>0.5 to assess differentially expressed genes in each
comparison. For the transformation (II) comparison (classical area
vs. aggressive area in iMCL), we selected probes that contained a
‘P’ flag in both iMCL samples. To identify up or downregulated
genes between aggressive and classical areas, we calculated
Z-scores (11) and ratios (non-log
scaled fold change) from the normalized signal intensities of each
probe. Then we established criteria for regulated genes: absolute
Z-score (|Z|) >2. Ingenuity Pathway Analysis (IPA6.0; Ingenuity
Systems, Redwood, CA, USA; http://www.ingenuity.com) was used to identify
networks of interacting genes. Lists of expressed (up and
downregulated) genes were uploaded for IPA. A heat map of the
differentially expressed genes was generated by MeV software
(12). Array data are available on
the Gene Expression Omnibus (GEO) website under accession numbers
GSE30189 (http://www.ncbi.nlm.nih.gov/geo/).
Results
Differentially expressed genes in
initiaion
In the analysis of MCL initiation, we selected 1,538
genes (851 upregulated and 787 downregulated) which showed
significant differences (p<0.05) between normal mantle zone B
lymphocytes and MCL in situ samples (http://www.ncbi.nlm.nih.gov/geo/). The identification
of CCND1 as the most significantly upregulated gene in
‘initiation’ samples gives us confidence that these array
experiments are measuring biologically relevant differences between
the sample types. The top 10 up- and down-regulated genes in MCL
in situ were: up, CCND1, FCGBP, IL17RB,
NULL (probe ID; 5390192), WNT3, D4S234E,
FBLN2, CPXM1, DBN1 and TEAD2; down,
PLAC8, LOC439949, HVCN1, FGR,
LOC651751, IL7R, DEF8, TXNDC8,
GZMB and SLAMF1.
For further analysis, we focused on the canonical
β-catenin-dependent Wnt pathway (WCP), which is critically
involved in cell fate and diffrerentiation (13). As reasons for this, IPA analysis
revealed that a significant number of differentially expressed
genes (n=23) belong to this category (p=0.016), and none of the
genes in this pathway were observed as differentially expressed in
the transformation experiments (Table
II). Whether the cytosolic pool of β-catenin participates in
WCP signaling is dictated by the availability of its binding
partners, and these binding interactions are regulated by
phosphorylation (14).
Phosphorylation of β-catenin at Ser552 by AKT can enhance
β-catenin/TCF reporter activation, suggesting that pβ-catenin-S552
is a nuclear-localized form of β-catenin (active form) (15). Microarray results indicate that
β-catenin was not significantly upregulated in MCL
initiation, but immunohistochemical results revealed that the tumor
cells of the MCL in situ samples showed nuclear localization
of pβ-catenin-S552 with high levels of cytoplasmic Wnt3 staining
(Fig. 4a-d). On the other hand,
reactive mantle zone B cells were negative for pβ-catenin-S552 in
the nuclear, and cytoplasmic Wnt3 staining was weak (Fig. 4e-h).
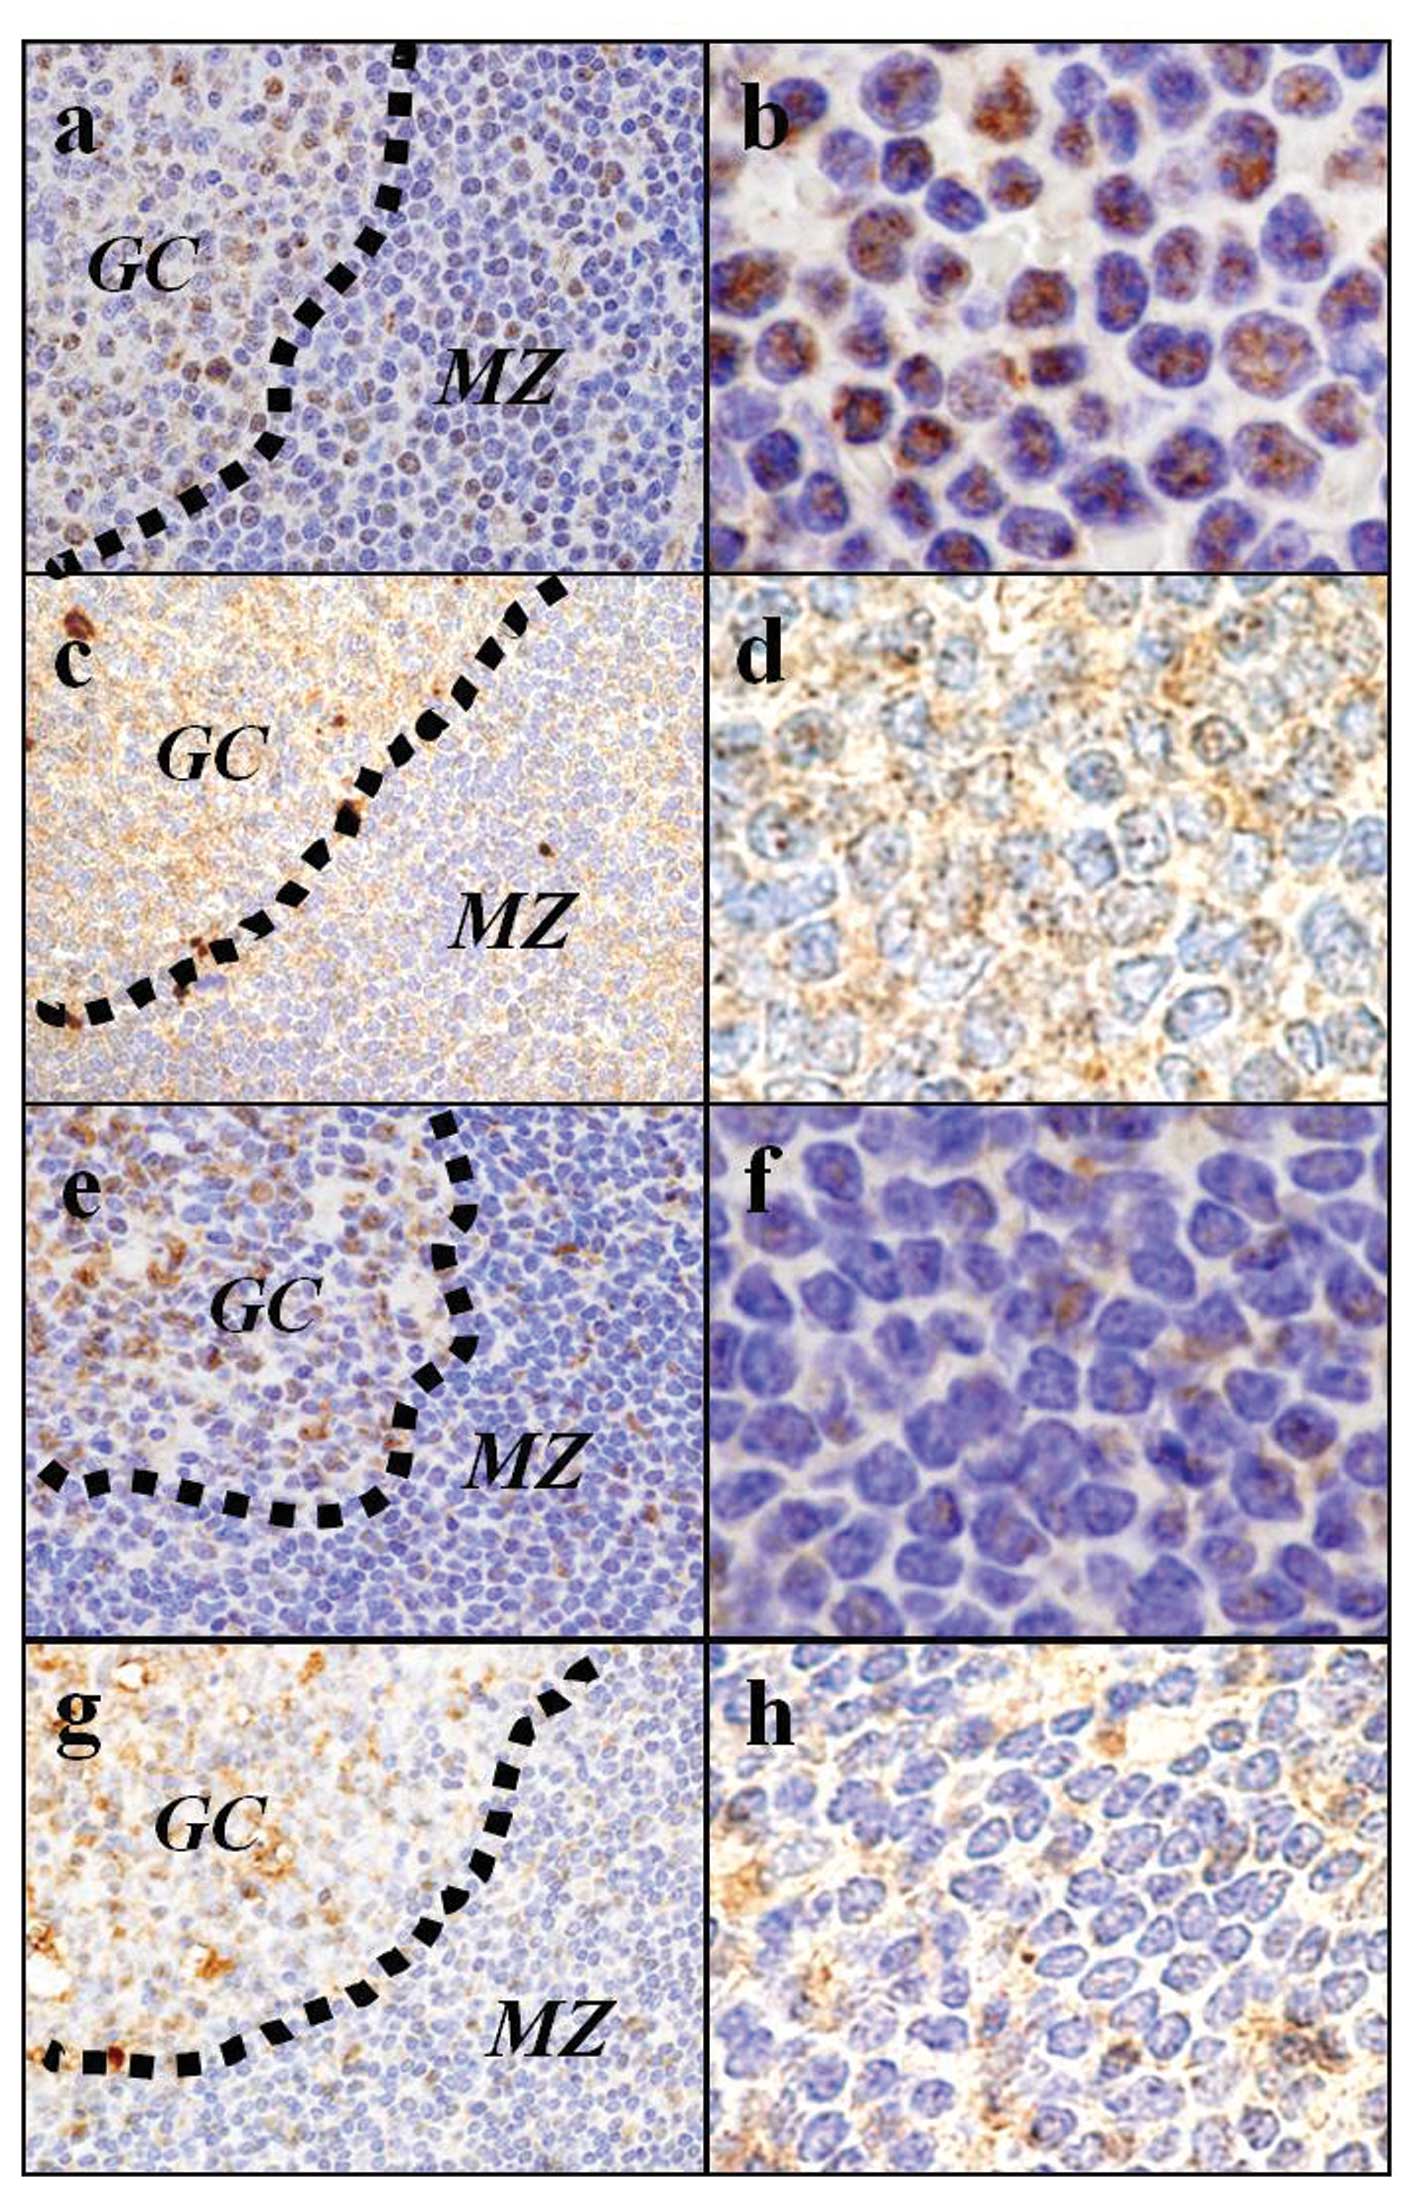 | Figure 4.Immunohistochemistry of (a, b, e and
f) pβ-catenin-S552 and (c, d, g and h) Wnt3. The
immunohistochemical studies revealed that the tumor cells of the
MCL in situ showed nuclear localization of pβ-catenin-S552
(a and b) with high levels of cytoplasmic Wnt3 staining (c and d).
The reactive mantle zone B cells were negative for pβ-catenin-S552
in the nuclear (e and f) with low lelels of cytoplasmic Wnt3
staining (g and h). pβ-catenin-S552 and Wnt3, original
magnification: a, c, e and g, ×1,000 and b, d, f and h, ×2,000. GC,
germinal center; MZ, marginal zone. |
| Table II.Genes associated with Wnt signaling
pathway (p<0.05). |
Table II.
Genes associated with Wnt signaling
pathway (p<0.05).
| Acc | Gene name | Gene
description | Time course
p<0.05
|
|---|
| Normal MZ vs. Fold
change | MCL in situ
P-value | cMCL vs. Fold
change | aMCL P-value |
|---|
| NM_053056.2 | CCND1 | Cyclin D1 | 4.41 | 2.51E-08 | NS | NS |
| NM_030753.3 | WNT3a | Wingless-type MMTV
integration site family, member 3 | 2.65 | 0.000063 | NS | NS |
| NM_024507.2 | KREMEN2 | Kringle containing
transmembrane protein 2 | 1.52 | 0.001595 | NS | NS |
| NM_002335.1 | LRP5b | Low density
lipoprotein receptor-related protein 5 | 1.04 | 0.000428 | NS | NS |
| NM_020335.1 | VANGL2 | Vang-like 2 (van
gogh, Drosophila) | 1.00 | 0.000208 | NS | NS |
| NM_001466.2 | FZD2 | Frizzled homolog 2
(Drosophila) | 0.90 | 0.001185 | NS | NS |
| NM_003199.2 | TCF4b | Transcription
factor 4 | 0.81 | 0.000155 | NS | NS |
| NM_004380.2 | CREBBPb | CREB binding
protein | 0.72 | 0.000165 | NS | NS |
| NM_001760.2 | GRN | Granulin | 0.67 | 0.014332 | NS | NS |
| NM_138713.2 | NFAT5 | Nuclear factor of
activated T-cells 5, tonicity-responsive | 0.57 | 0.001586 | NS | NS |
| NM_002738.5 | PRKCB | Protein kinase C,
beta | 0.55 | 0.003660 | NS | NS |
| NM_152221.2 | CSNK1Eb | Casein kinase 1,
epsilon | 0.53 | 0.004865 | NS | NS |
| NM_001006610.1 | SIAH1 | Seven in absentia
homolog 1 (Drosophila) | 0.52 | 0.001216 | NS | NS |
| NM_004423.3 | DVL3b | Dishevelled, dsh
homolog 3 (Drosophila) | 0.45 | 0.007706 | NS | NS |
| NM_020248.2 | CTNNBIP1 | Catenin, beta
interacting protein 1 | 0.42 | 0.016759 | NS | NS |
| NM_003200.1 | TCF3 | Transcription
factor 3 (E2A immunoglobulin enhancer binding factors E12/E47) | 0.35 | 0.031493 | NS | NS |
| NM_181492.1 | TCF20 | Transcription
factor 20 (AR1) | −0.39 | 0.020984 | NS | NS |
| NM_033120.2 | NKD2 | Naked cuticle
homolog 2 (Drosophila) | −0.39 | 0.037969 | NS | NS |
| NM_002872.3 | RAC2 | Ras-related C3
botulinum toxin substrate 2 (rho family, small GTP binding protein
Rac2) | −0.42 | 0.008708 | NS | NS |
| NM_007236.3 | CHP | Calcium binding
protein P22 | −0.45 | 0.005099 | NS | NS |
| NM_002467.3 | MYC | V-myc
myelocytomatosis viral oncogene homolog (avian) | −0.48 | 0.034874 | NS | NS |
| NM_002737.2 | PRKCA | Protein kinase C,
alpha | −0.72 | 0.002025 | NS | NS |
| NM_016269.2 | LEF1 | Lymphoid
enhancer-binding factor 1 | −0.87 | 0.004964 | NS | NS |
Differentially expressed genes in
transformation
With the Illumina BeadStudio software, we detected
710 genes that showed significant differences in expression between
cMCL and aMCL groups [Fig. 2(I)]
(http://www.ncbi.nlm.nih.gov/geo/). Gene
expression profiling in iMCL showed that 220 genes were differently
expressed between microdissected classical area and aggressive area
samples [Fig. 2(II)] (http://www.ncbi.nlm.nih.gov/geo/). Finally, we
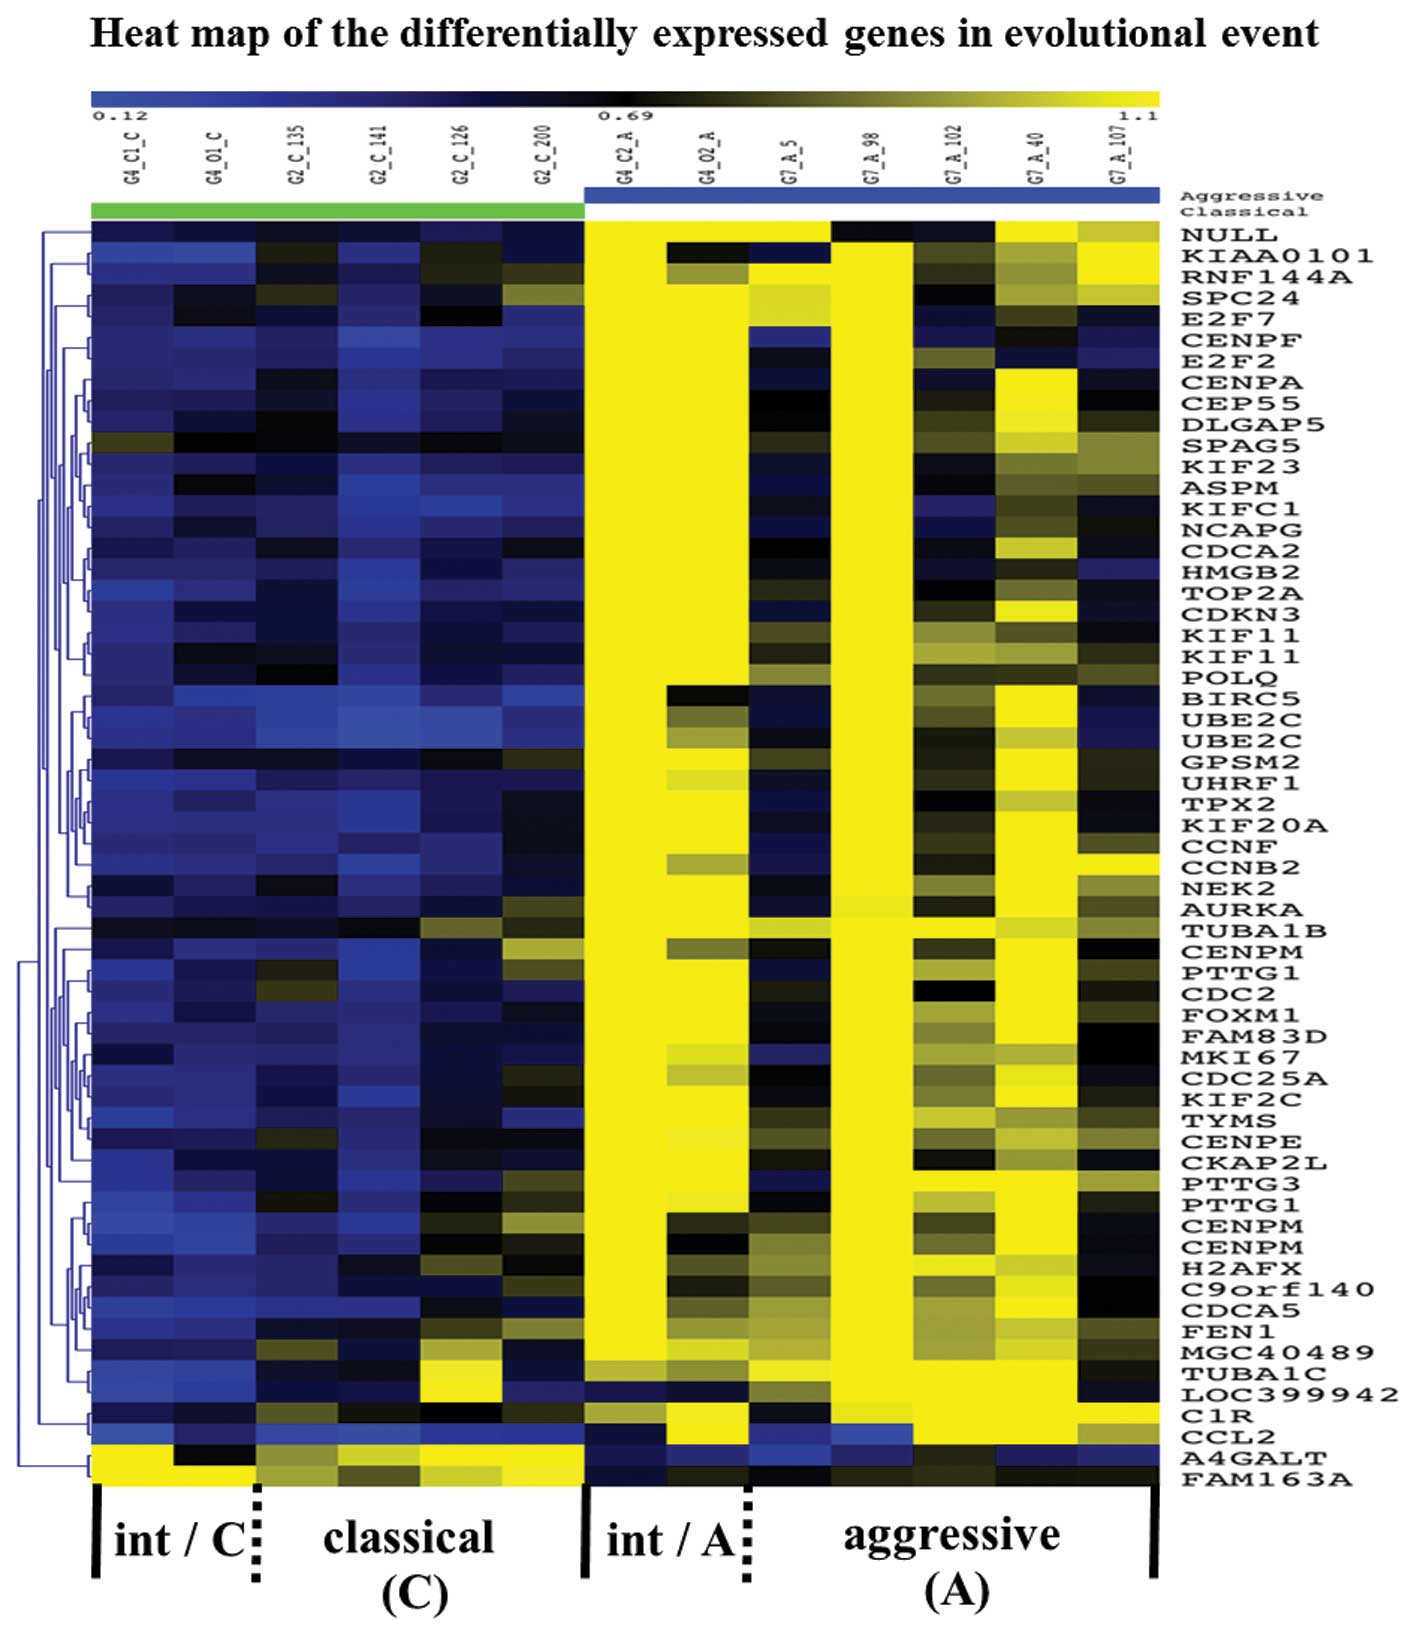
identified 60 overlapping genes [Fig.
2(III)] (Table III), both
upregulated (n=58) and down-regulated (n=2), which showed
significant differences in pre- vs. post-transformation with a
p-value of <0.05. These genes are visualized as a heat map in
Fig. 5.
| Table III.Genes associated with the development
of aggressive form of MCL (cMCL vs. aMCL using by iMCL). |
Table III.
Genes associated with the development
of aggressive form of MCL (cMCL vs. aMCL using by iMCL).
| Acc | Gene name | Gene
description | Fold change | P-value |
|---|
| NM_181800.1 | UBE2C |
Ubiquitin-conjugating enzyme E2C | 1.84 | 0.000371 |
| NM_181803.1 | UBE2C |
Ubiquitin-conjugating enzyme E2C | 1.74 | 0.000558 |
| NM_002982.3 | CCL2 | Chemokine (C-C
motif) ligand 2 | 1.60 | 0.038047 |
| NM_001168.2 | BIRC5d,e | Baculoviral IAP
repeat-containing 5 | 1.58 | 0.000489 |
| NM_080668.2 | CDCA5 | Cell division cycle
associated 5 | 1.27 | 0.003079 |
| NM_004701.2 | CCNB2c | Cyclin B2 | 1.21 | 0.004265 |
| NM_001071.1 | TYMSc | Thymidylate
synthetase | 1.11 | 0.001068 |
| NM_002263.2 | KIFC1 | Kinesin family
member C1 | 1.09 | 0.007440 |
| NM_001067.2 | TOP2Aa,c | Topoisomerase (DNA)
II alpha 170 kDa | 1.08 | 0.006076 |
| NR_002734.1 | PTTG3 | Pituitary
tumor-transforming 3 | 1.07 | 0.014845 |
| NM_018136.3 | ASPMb,c,d,e | ‘Abnormal spindle
(ASP) homolog, microcephaly associated (Drosophila)’ | 1.07 | 0.005186 |
| NM_021953.2 | FOXM1c | Forkhead box
M1 | 1.01 | 0.003420 |
| NM_005733.1 | KIF20Ac | Kinesin family
member 20A | 0.99 | 0.010183 |
| NM_001761.1 | CCNF | Cyclin F | 0.99 | 0.006634 |
| NM_001048201.1 | UHRF1a,e | Ubiquitin-like with
PHD and ring finger domains 1 | 0.97 | 0.007291 |
| NM_001002876.1 | CENPM | Centromere protein
M | 0.94 | 0.016725 |
| NM_004091.2 | E2F2 | E2F transcription
factor 2 | 0.94 | 0.019567 |
| NM_001002876.1 | CENPM | Centromere protein
M | 0.94 | 0.035235 |
| NM_030919.2 | FAM83D | ‘Family with
sequence similarity 83, member D’ | 0.92 | 0.007561 |
| NM_024053.3 | CENPM | Centromere protein
M | 0.92 | 0.046319 |
| NM_006845.2 | KIF2C | Kinesin family
member 2C | 0.90 | 0.016135 |
| NM_199420.3 | POLQ | ‘Polymerase (DNA
directed), theta’ | 0.89 | 0.004755 |
| NM_012112.4 | TPX2 | ‘TPX2,
microtubule-associated, homolog (Xenopus laevis)’ | 0.89 | 0.016590 |
| NM_018131.3 | CEP55 | Centrosomal protein
55 kDa | 0.88 | 0.006728 |
| NM_004523.2 | KIF11c | Kinesin family
member 11 | 0.88 | 0.005905 |
| NM_022346.3 | NCAPG | ‘Non-SMC condensin
I complex, subunit G’ | 0.88 | 0.014421 |
| XM_934471.1 | LOC399942 | - | 0.87 | 0.039823 |
| NM_002417.3 | MKI67e | Antigen identified
by monoclonal antibody Ki-67 | 0.86 | 0.022646 |
| NM_001786.2 | CDC2b,c,d,e | ‘Cell division
cycle 2, G1 to S and G2 to M’ | 0.86 | 0.023818 |
| NM_016343.3 | CENPFb,c,e | ‘Centromere protein
F, 350/400ka (mitosin)’ | 0.84 | 0.032315 |
| NM_002497.2 | NEK2c | NIMA (never in
mitosis gene a)-related kinase 2 | 0.83 | 0.002697 |
| NM_178448.2 | C9orf140 | Chromosome 9 open
reading frame 140 | 0.81 | 0.023110 |
| NM_004219.2 | PTTG1 | Pituitary
tumor-transforming 1 | 0.80 | 0.047544 |
| NM_004856.4 | KIF23c,e | Kinesin family
member 23 | 0.80 | 0.007960 |
| NM_005192.2 | CDKN3a,c | Cyclin-dependent
kinase inhibitor 3 | 0.79 | 0.029828 |
| NM_004219.2 | PTTG1 | Pituitary
tumor-transforming 1 | 0.79 | 0.038189 |
| NM_002129.2 | HMGB2a,c | High-mobility group
box 2 | 0.79 | 0.045729 |
| NM_152515.2 | CKAP2L | Cytoskeleton
associated protein 2-like | 0.78 | 0.036949 |
| NM_004523.2 | KIF11c | Kinesin family
member 11 | 0.78 | 0.004380 |
| NM_014746.2 | RNF144A | Ring finger protein
144A | 0.78 | 0.005460 |
| NM_014750.3 | DLGAP5 | ‘Discs, large
(Drosophila) homolog-associated protein 5’ | 0.76 | 0.009518 |
| NM_014736.4 | KIAA0101c | KIAA0101 | 0.76 | 0.045005 |
| NM_032704.2 | TUBA1Cb | ‘Tubulin, alpha
1c’ | 0.73 | 0.027816 |
| NM_001813.2 | CENPEc,d | ‘Centromere protein
E, 312 kDa’ | 0.73 | 0.013906 |
| BC004287 | NULL | Null | 0.73 | 0.019170 |
| NM_001789.2 | CDC25A | Cell division cycle
25 homolog A (S. pombe) | 0.73 | 0.025460 |
| NM_002105.2 | H2AFX | ‘H2A histone
family, member X’ | 0.72 | 0.038540 |
| NM_203394.2 | E2F7 | E2F transcription
factor 7 | 0.68 | 0.032400 |
| NM_001042426.1 | CENPAc | Centromere protein
A | 0.65 | 0.044459 |
| NM_198434.1 | AURKAc | Aurora kinase
A | 0.62 | 0.042391 |
| NM_152562.2 | CDCA2 | Cell division cycle
associated 2 | 0.61 | 0.040259 |
| NM_006082.2 | TUBA1Ba,f | ‘Tubulin, alpha
1b’ | 0.61 | 0.002775 |
| NM_004111.4 | FEN1 | Flap
structure-specific endonuclease 1 | 0.60 | 0.035752 |
| NM_013296.3 | GPSM2 | ‘G-protein
signaling modulator 2 (AGS3-like, C. elegans)’ | 0.55 | 0.033270 |
| NM_182513.1 | SPC24 | ‘SPC24, NDC80
kinetochore complex component, homolog (S. cerevisiae)’ | 0.55 | 0.034394 |
| XR_016048.1 | MGC40489 | - | 0.53 | 0.049409 |
| NM_001733.4 | C1R | ‘Complement
component 1, R subcomponent’ | 0.52 | 0.039100 |
| NM_006461.3 | SPAG5c | Sperm associated
antigen 5 | 0.48 | 0.008955 |
| NM_173509.2 | FAM163A | ‘Family with
sequence similarity 163, member A’ | −0.39 | 0.007364 |
| NM_017436.4 | A4GALT | ‘Alpha
1,4-galactosyltransferase’ | −1.28 | 0.000604 |
As may be expected, IPA analysis of the filtered 60
genes revealed that most of these genes (42/60; 70%) were
classified in the following categories, all of which are thought to
be involved in transformation: 36 genes belonged to the category of
‘Cell cycle progression’ (UBE2C, BIRC5, CDCA5, TYMS, KIFC1,
TOP2A, FOXM1, CCNF, E2F2, KIF2C, TPX2, KIF11, CDC2, CENPF, NEK2,
CDKN3, PTTG1, DLGAP5, CENPE, CDC25A, AURKA, CCNB2, ASPM, KIF20A,
UHRF1, CEP55, NCAPG, MKI67, KIF23, H2AFX, GPSM2); 28 ‘DNA
replication, recombination and repair’ genes (AURKA, BIRC5,
CENPE, DLGAP5, KIF2C, KIFC1, NCAPG, TOP2A, CCNB2, GPSM2, NEK2,
PTTG1, KIF11, TPX2, CDCA5, CDK1, CDC25A, E2F2, FEN1, FOXM1, HMGB2,
KIAA0101, H2AFX, POLQ, TYMS, KIF23, CENPA, UHRF1); 10 ‘cell death’
genes (A4GALT, AURKA, BIRC5, CCL2, CDC25A, CDCA2, CDK1, E2F2, NEK2,
PTTG1, TOP2A, TYMS, UBE2C, CENPF, FEN1, FOXM1, HMGB2, KIF2C).
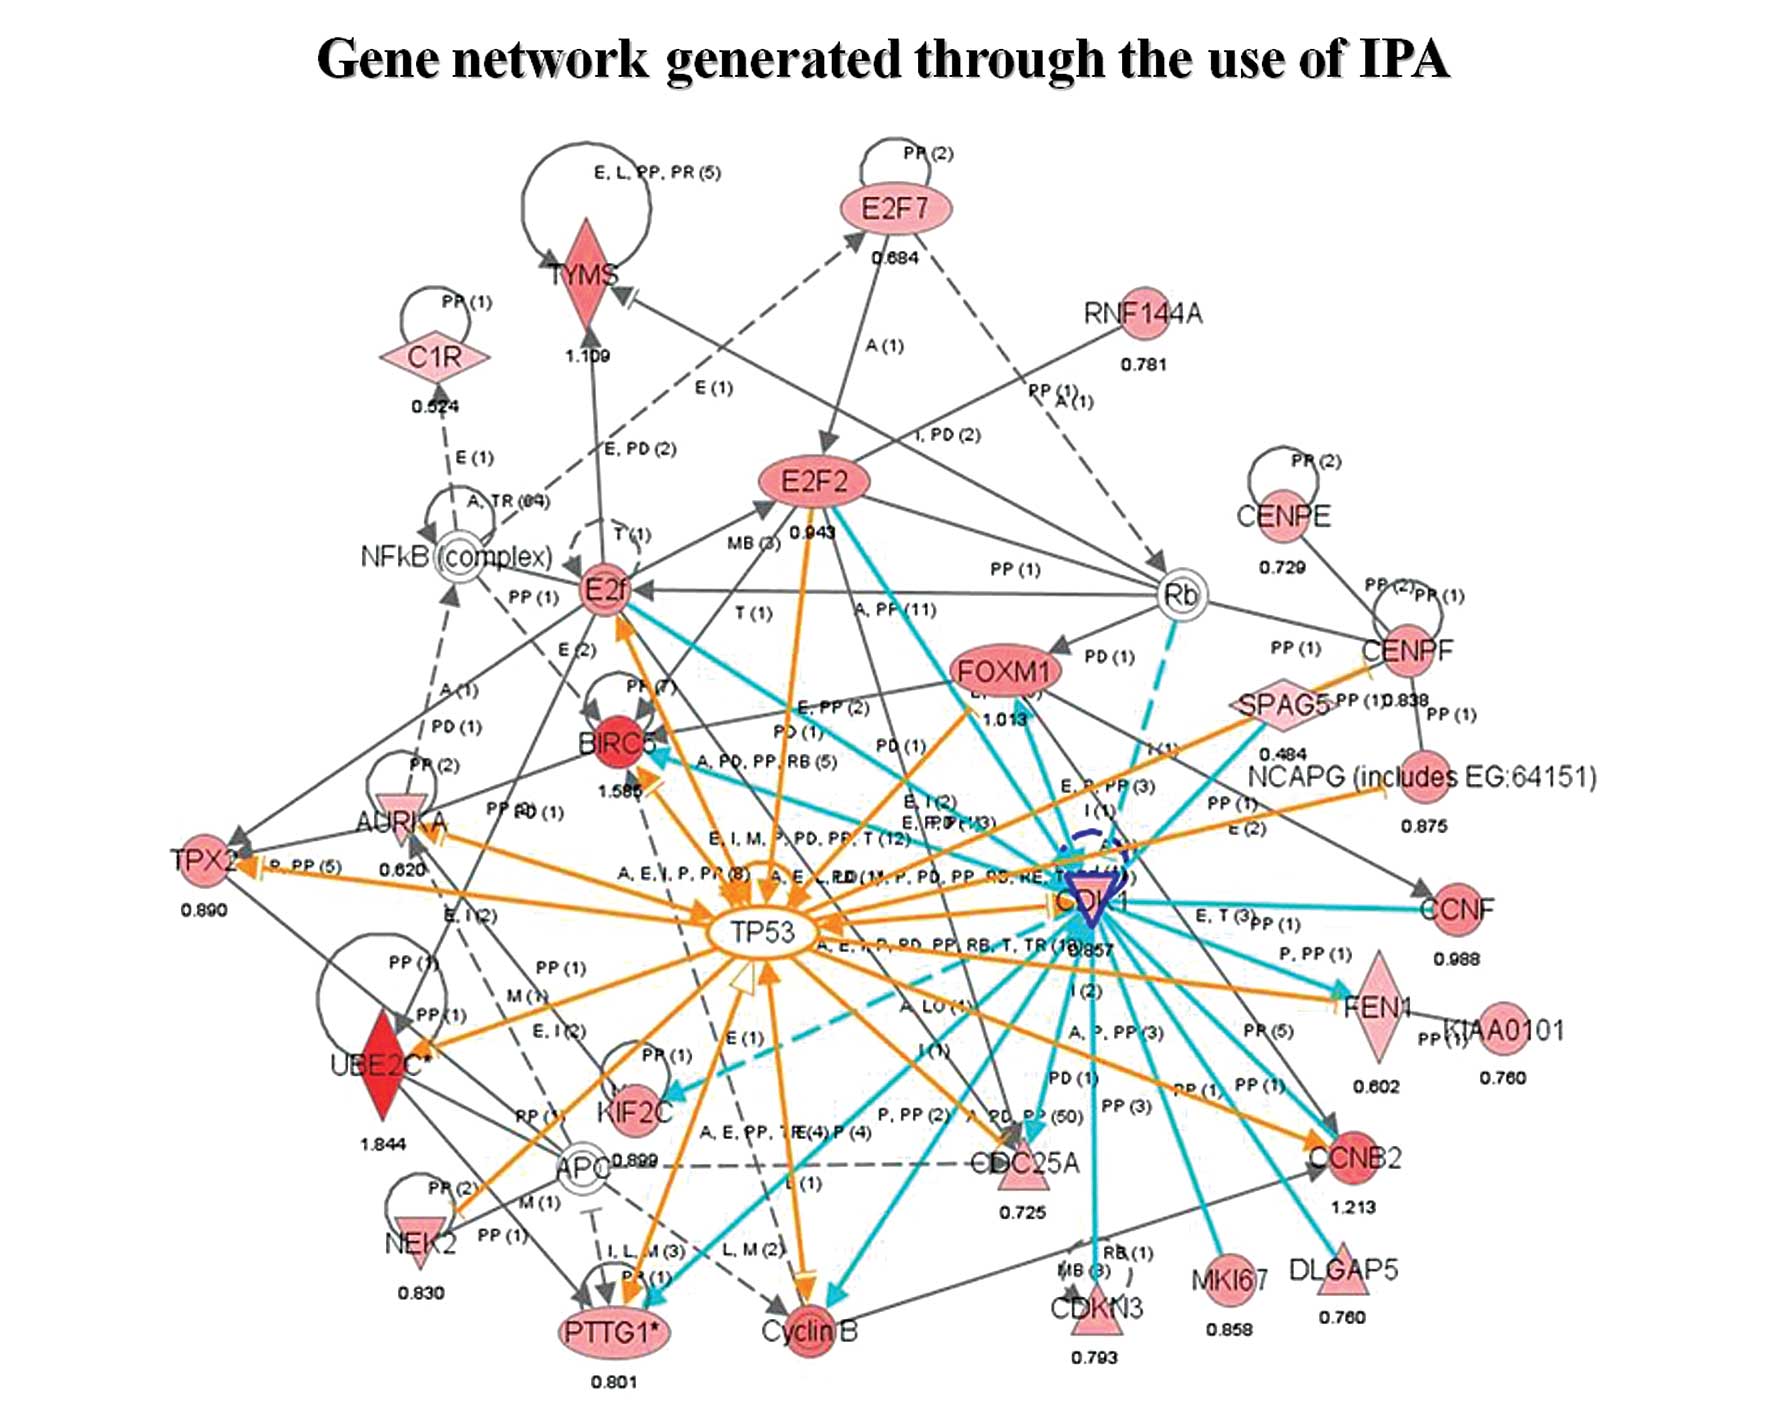
As seen in Fig. 6, these genes
recapitulate much of the p53 interaction network, a network
centrally involved in cell cycle progression. Most of these genes
(AURKA, BIRC5, CDC2, CDC25A, CENPF, CENPE, CCNB2, FOXM1, NEK2,
PTTG1, TPX2, ASPM, TOP2A, DLGAP5, KIF2C, KIF23, UBE2C) were
considered important players in MCL transformation because of their
known function as mitotic regulators, which mediate cell cycle
progression during the G2/M transition. CDC2, FOXM1
and BIRC5 in particular interact with many other highly
expressed genes in aMCL, which suggests that they may play a
critical role in transformational events along with p53. Of
these transformation-associated genes, only CDCA5 and
MKI67 were also significantly changed in initiation, while
the remaining 58 genes were aberrantly expressed specifically in
transformation.
Discussion
Biological heterogeneity has become an important
position in the current understanding of MCL. To meet this need, we
performed cDNA microarray experiments stratifying MCL samples into
four morphological grades based on the files including a large
series of patients. In order to investigate the molecular
mechanisms underlying these differences, we compared initial
component samples or transformational morphology samples and
identified genes associated with the Wnt signaling pathway and
several known mitotic regulators as differentially regulated.
Cell cycle alterations resulting in unscheduled
proliferation are strongly associated with the evolution of
malignant tumors. Most of these changes alter pathways involved in
G1 progression or the G1/S transition (16). With regard to MCL, the ‘Lymphoma
and Leukemia Molecular Profiling Project (LLMPP)’ demonstrated that
the length of survival of MCL patients depends upon quantitative
differences in progression from G1/S phase of the cell cycle
(17). Sander et al also
showed that a subset of MCL tumors with low levels of the long
CCND1 transcript is highly proliferative and some of its
related genes have homology to the group of cell cycle (G1/S)
promoting E2F transcription partners (18). Indeed, there is a strong
correlation between these reported genes and the 60 we identified
in this study as involved in transformation (Table III), which emphasizes the
importance of G1/S regulators in MCL evolution. The morphological
classifications used in this study were based on our previous
findings that MCL presents in three morphological evolutions:
classical, intermediate and aggressive, and that the aggressive
form is considered an important clinical signal of poor prognosis
(1). Therefore, it might be
natural to expect that dysregulation of G1/S proliferation
signature genes is necessary to determine both the length of MCL
patient survival and the time to neoplasm transformation.
Although the dysregulation of progression through
mitosis does not directly promote proliferation, a few centrosomal
and mitotic proteins (such as AURKA, PLK1 and
PTTG1) have been reported to act as oncogenes (19). Interestingly, our results highlight
a large number of mitotic regulators (CDC2, AURKA, BIRC5,
CDC25A, CENPE, CCNB2, FOXM1, NEK2, PTTG1, TPX2, DLGAP5, KIF2C,
KIF23 and UBE2C) in addition to G1/S regulators
(CDC25A, E2F2, FOXM1 and TYMS). Of these genes,
CDC2, FOXM1 and BIRC5 interact with many other
highly expressed mitotic regulators within the p53
interaction network, suggesting that specific mitotic regulators
facilitate the transformation of MCL into more aggressive form. In
support of this hypothesis, Blenk et al identified
significantly differentially expressed genes between samples with
good and poor prognosis in MCL using exploratory analysis of gene
expression values and CGH data (20). Surprisingly, the majority of the
genes highlighted in that study (BIRC5, ASPM, MKI67, UHRF1,
CDC2, CENPF and KIF23), including their survival predictor of
genes for MCL patients (CENPE, CDC2, BIRC5 and ASPM),
overlap with our current findings (Table III). These observations imply that
both CDC2 and BIRC5 expression play central roles in
MCL transformation and thus reflect prognosis.
CDC2 (also known as CDK1) is one of
the master regulators of mitosis, as it is involved in the
centrosome cycle and early mitotic events. Hui et al
reported that elevated protein levels of CDC2 are correlated with
the expression of proliferation marker, and represent a useful and
simple method in evaluating the prognosis of MCL patients (21). Although BIRC5 (also known as
survivin) is known as a member of inhibitor of apoptosis proteins
gene family (22), several studies
have shown that its role in cancer is not limited to apoptosis
inhibition (23). Accordingly,
BIRC5 expression levels are higher in aMCL samples than cMCL
samples and are associated with proliferative activity and survival
of the patients (24).
The role of FOXM1 in lymphoma has not been
reported in the literature. However, FOXM1 was also
significantly upregulated genes in MCL transformation (FC; 1.01 and
p<0.005) in our results. FOXM1 is a typical
proliferation-associated transcription factor, and is intimately
involved in mitosis regulation (25). Namely, FOXM1 directly or
indirectly (via MYC) regulates genes that control G1/S
transition, S-phase progression, G2/M transition and M-phase
progression (25), supporting that
it is involved in tumorigenesis. It is of interest that its
expression level is known to be increased in several other tumor
grades, such as prostate carcinoma and glioblastoma (26,27).
Thus, all of these genes, as well as the other mitotic regulators
we found to have differential expression in MCL transformation, are
potentially attractive therapeutic targets or strong diagnostic
tools.
Alterations in the DNA damage response pathway and
mitotic checkpoints through p53 are major additional genetic
events in MCL, as indicated by the high rate of tetraploidy found
in aMCL (28). In fact, p53
inactivation in MCL as a consequence of deletion or mutation occurs
more frequently in the aggressive form than in the classic form
(29). However, inactivating
mutations of p53 are found in only 38% of aMCL cases
(30,31), suggesting that several other
genetic alterations also contribute to inactivation of the
p53 pathway. Currently, ATM deletions are thought to
be strongly associated with the dysregulation of the DNA damage
response pathway through p53, and are probably present in
the early phase of MCL (17,32-34).
Our microarray experiments have revealed that ATM was
significantly downregulated in initiation with strong fold change
(FC=-0.73), while there was no significant change observed in
transformation. In the results of our previous study using
immunohistochemistry, higher cell positivity of p53 (DO7) was
observed in iMCL than in cMCL, while there was no significant
difference between iMCL and aMCL (1). This is due to the fact that there is
a high concordance between p53 (DO7) nuclear overexpression and
gene mutation in human carcinomas (35). These results strongly indicated
that dysregulation of the ATM/p53 pathway in MCL would occur
at undetectable levels as a relatively early phenomenon. After
that, the disruption of central mitotic regulators (CDC2,
BIRC5 and FOXM1) is responsible for the induction of
chromosomal instability. Combined, these factors play an important
pathogenic role in the evolution of MCL, perturbing the regulation
of tumor cell cycling at the G2/M transition.
The mechanisms of the initial lymphomagenesis of MCL
in addition to the IgH/CCND1 remain unclear, and new
approaches are urgently needed to elucidate which genes and
signaling pathways contribute to this event. Our results support
the hypothesis that aberrant Wnt3 signaling is required for the MCL
lymphomagenesis, because a significant number of WCP associated
genes were aberrantly expressed in the initiation and not
significantly changed in the transformation. Moreover,
immunohistochemical findings revealed the special activation of
WCP.
The significance of WCP signaling in tumor
initiation may be straightforward from the view point of the
adenoma-carcinoma sequence (36).
Deletion of the APC gene resulting in the activation of WCP
is a consistent finding among the earliest events in both de
novo and sporadic colon carcinomas. Also, several studies
support the notion that WCP can influence both lymphopoiesis
(37,38) and hematological malignancies
(39). In our initiation
experiments, especially Wnt3 and LRP5 were genes with
a high average increase (2.65- and 1.04-fold, respectively), and
are reportedly highly expressed in MCL cases (40).
The binding of Wnt proteins to their respective cell
surface receptors, including seven of the transmembrane fizzled
(Fz) receptors and low-density lipoprotein receptor-related protein
(LRP5 or 6), activates disheveled (Dvl). Activated Dvl can inhibit
the degradation of β-catenin by the destruction complex, which is
composed of adenomatous polyposis coli (APC),
axin, casein kinase 1 (CK1) and GSK-3β.
Consequently, accumulation of β-catenin in the nucleus regulates
gene expression in cooperation with T cell factor
(TCF)/lymphocyte enhancer factor (LEF)
transcription factors, resulting in the activation of the WCP
target genes such as CCND1 and c-Myc (13).
Using gene expression profiling, Rosenwald et
al identified MCL signature genes in CCND1-negative lymphoma
cases classified as MCL by both morphology and IHC. Wnt3 is
one of these MCL signature genes, suggesting that Wnt3 is
more intrinsic to MCL than CCND1 (17). According to Gelebart et al,
Wnt 3 is highly and consistently expressed in MCL as detected by
WCP-specific oligonucleotide arrays (40). Lako et al showed that Wnt3
protein can enhance haematopoietic commitment during in
vitro differentiation of embryonic stem cells (41). From these studies, we speculate
that aberrant expression of Wnt3 can emerge as potential
activator of lymphomagenesis in MCL because CCND1 itself is
an oncogenic target of activated WCP. In addition, several studies
have shown that Wnt3 is highly expressed in B cell CLL (42,43)
as well as in MCL.
To summarize, this study shed light on the
mechanisms of initiation and evolution in MCL. The resulting
patterns of gene dysregulation in these evens strongly indicate
that the Wnt signaling pathway plays a critical role in
initial lymphomagenesis, and that specific mitotic regulators
facilitate transformation into more aggressive forms. Our unique
approach may contribute to future understanding of various mature B
cell lymphomas. These data hint at a novel system for the
classification of low-grade B cell neoplasms using the expression
levels of WCP genes and specific mitotic regulator genes as markers
for disease stage and predicted outcomes.
Acknowledgements
The authors would like to thank Konomi
Takasu, Mayumi Miura and Kanoko Miyazaki for their technical
support.
References
|
1.
|
Kimura Y, Sato K, Arakawa F, et al: Mantle
cell lymphoma shows three morphological evolutions of classical,
intermediate, and aggressive forms, which occur in parallel with
increased labeling index of cyclin D1 and Ki-67. Cancer Sci.
101:806–814. 2010. View Article : Google Scholar
|
|
2.
|
Kaleem Z, Wakoff AR, Smith RP and Hess JL:
Blastic transformation of mantle cell lymphoma. Arch Pathol Lab
Med. 120:577–580. 1996.PubMed/NCBI
|
|
3.
|
Bodrug SE, Warner BJ, Bath ML, Lindeman
GJ, Harris AW and Adams JM: Cyclin D1 transgene impedes lymphocyte
maturation and collaborates in lymphomagenesis with the myc gene.
EMBO J. 13:2124–2130. 1994.PubMed/NCBI
|
|
4.
|
Hirt C, Schuler F, Dolken L, Schmidt CA
and Dolken G: Low prevalence of circulating
t(11;14)(q13;q32)-positive cells in the peripheral blood of healthy
individuals as detected by real-time quantitative PCR. Blood.
104:904–905. 2004. View Article : Google Scholar : PubMed/NCBI
|
|
5.
|
De Vos S, Krug U, Hofmann WK, et al: Cell
cycle alterations in the blastoid variant of mantle cell lymphoma
(MCL-BV) as detected by gene expression profiling of mantle cell
lymphoma (MCL) and MCL-BV. Diagn Mol Pathol. 12:35–43.
2003.PubMed/NCBI
|
|
6.
|
Rizzatti EG, Falcao RP, Panepucci RA, et
al: Gene expression profiling of mantle cell lymphoma cells reveals
aberrant expression of genes from the PI3K-AKT, WNT and TGFbeta
signalling pathways. Br J Haematol. 130:516–526. 2005. View Article : Google Scholar : PubMed/NCBI
|
|
7.
|
Martinez N, Camacho FI, Algara P, et al:
The molecular signature of mantle cell lymphoma reveals multiple
signals favoring cell survival. Cancer Res. 63:8226–8232.
2003.PubMed/NCBI
|
|
8.
|
Bolstad BM, Irizarry RA, Astrand M and
Speed TP: A comparison of normalization methods for high density
oligonucleotide array data based on variance and bias.
Bioinformatics. 19:185–193. 2003. View Article : Google Scholar : PubMed/NCBI
|
|
9.
|
Gentleman RC, Carey VJ, Bates DM, et al:
Bioconductor: open software development for computational biology
and bioinformatics. Genome Biol. 5:R802004. View Article : Google Scholar : PubMed/NCBI
|
|
10.
|
Smyth GK, Michaud J and Scott HS: Use of
within-array replicate spots for assessing differential expression
in micro-array experiments. Bioinformatics. 21:2067–2075. 2005.
View Article : Google Scholar : PubMed/NCBI
|
|
11.
|
Quackenbush J: Microarray data
normalization and transformation. Nat Genet. 32(Suppl): 496–501.
2002. View
Article : Google Scholar
|
|
12.
|
Saeed AI, Sharov V, White J, et al: TM4: a
free, open-source system for microarray data management and
analysis. Biotechniques. 34:374–378. 2003.PubMed/NCBI
|
|
13.
|
Aguilera O, Munoz A, Esteller M and Fraga
MF: Epigenetic alterations of the Wnt/beta-catenin pathway in human
disease. Endocr Metab Immune Disord Drug Targets. 7:13–21. 2007.
View Article : Google Scholar : PubMed/NCBI
|
|
14.
|
Daugherty RL and Gottardi CJ:
Phospho-regulation of beta-catenin adhesion and signaling
functions. Physiology (Bethesda). 22:303–309. 2007. View Article : Google Scholar : PubMed/NCBI
|
|
15.
|
Fang D, Hawke D, Zheng Y, et al:
Phosphorylation of beta-catenin by AKT promotes beta-catenin
transcriptional activity. J Biol Chem. 282:11221–11229. 2007.
View Article : Google Scholar : PubMed/NCBI
|
|
16.
|
Massague J: G1 cell-cycle control and
cancer. Nature. 432:298–306. 2004. View Article : Google Scholar : PubMed/NCBI
|
|
17.
|
Rosenwald A, Wright G, Wiestner A, et al:
The proliferation gene expression signature is a quantitative
integrator of oncogenic events that predicts survival in mantle
cell lymphoma. Cancer Cell. 3:185–197. 2003. View Article : Google Scholar : PubMed/NCBI
|
|
18.
|
Sander B, Flygare J, Porwit-Macdonald A,
et al: Mantle cell lymphomas with low levels of cyclin D1 long mRNA
transcripts are highly proliferative and can be discriminated by
elevated cyclin A2 and cyclin B1. Int J Cancer. 117:418–430. 2005.
View Article : Google Scholar : PubMed/NCBI
|
|
19.
|
Perez de Castro I, de Carcer G and
Malumbres M: A census of mitotic cancer genes: new insights into
tumor cell biology and cancer therapy. Carcinogenesis. 28:899–912.
2007.PubMed/NCBI
|
|
20.
|
Blenk S, Engelmann JC, Pinkert S, et al:
Explorative data analysis of MCL reveals gene expression networks
implicated in survival and prognosis supported by explorative CGH
analysis. BMC Cancer. 8:1062008. View Article : Google Scholar : PubMed/NCBI
|
|
21.
|
Hui D, Reiman T, Hanson J, et al:
Immunohistochemical detection of cdc2 is useful in predicting
survival in patients with mantle cell lymphoma. Mod Pathol.
18:1223–1231. 2005. View Article : Google Scholar : PubMed/NCBI
|
|
22.
|
Schimmer AD: Inhibitor of apoptosis
proteins: translating basic knowledge into clinical practice.
Cancer Res. 64:7183–7190. 2004. View Article : Google Scholar : PubMed/NCBI
|
|
23.
|
Mita AC, Mita MM, Nawrocki ST and Giles
FJ: Survivin: key regulator of mitosis and apoptosis and novel
target for cancer therapeutics. Clin Cancer Res. 14:5000–5005.
2008. View Article : Google Scholar : PubMed/NCBI
|
|
24.
|
Martinez A, Bellosillo B, Bosch F, et al:
Nuclear survivin expression in mantle cell lymphoma is associated
with cell proliferation and survival. Am J Pathol. 164:501–510.
2004. View Article : Google Scholar : PubMed/NCBI
|
|
25.
|
Wierstra I and Alves J: FOXM1, a typical
proliferation-associated transcription factor. Biol Chem.
388:1257–1274. 2007. View Article : Google Scholar : PubMed/NCBI
|
|
26.
|
Liu M, Dai B, Kang SH, et al: FoxM1B is
overexpressed in human glioblastomas and critically regulates the
tumorigenicity of glioma cells. Cancer Res. 66:3593–3602. 2006.
View Article : Google Scholar : PubMed/NCBI
|
|
27.
|
Kalin TV, Wang IC, Ackerson TJ, et al:
Increased levels of the FoxM1 transcription factor accelerate
development and progression of prostate carcinomas in both TRAMP
and LADY transgenic mice. Cancer Res. 66:1712–1720. 2006.
View Article : Google Scholar : PubMed/NCBI
|
|
28.
|
Ott G, Kalla J, Ott MM, et al: Blastoid
variants of mantle cell lymphoma: frequent bcl-1 rearrangements at
the major translocation cluster region and tetraploid chromosome
clones. Blood. 89:1421–1429. 1997.PubMed/NCBI
|
|
29.
|
Pinyol M, Hernandez L, Cazorla M, et al:
Deletions and loss of expression of p16INK4a and p21Waf1 genes are
associated with aggressive variants of mantle cell lymphomas.
Blood. 89:272–280. 1997.PubMed/NCBI
|
|
30.
|
Hernandez L, Fest T, Cazorla M, et al: p53
gene mutations and protein overexpression are associated with
aggressive variants of mantle cell lymphomas. Blood. 87:3351–3359.
1996.PubMed/NCBI
|
|
31.
|
Greiner TC, Moynihan MJ, Chan WC, et al:
p53 mutations in mantle cell lymphoma are associated with variant
cytology and predict a poor prognosis. Blood. 87:4302–4310.
1996.PubMed/NCBI
|
|
32.
|
Bentz M, Plesch A, Bullinger L, et al:
t(11;14)-positive mantle cell lymphomas exhibit complex karyotypes
and share similarities with B-cell chronic lymphocytic leukemia.
Genes Chromosomes Cancer. 27:285–294. 2000. View Article : Google Scholar : PubMed/NCBI
|
|
33.
|
Monni O, Oinonen R, Elonen E, et al: Gain
of 3q and deletion of 11q22 are frequent aberrations in mantle cell
lymphoma. Genes Chromosomes Cancer. 21:298–307. 1998. View Article : Google Scholar : PubMed/NCBI
|
|
34.
|
Stilgenbauer S, Winkler D, Ott G, et al:
Molecular characterization of 11q deletions points to a pathogenic
role of the ATM gene in mantle cell lymphoma. Blood. 94:3262–3264.
1999.PubMed/NCBI
|
|
35.
|
Soong R, Robbins PD, Dix BR, et al:
Concordance between p53 protein overexpression and gene mutation in
a large series of common human carcinomas. Hum Pathol.
27:1050–1055. 1996. View Article : Google Scholar : PubMed/NCBI
|
|
36.
|
Vogelstein B, Fearon ER, Hamilton SR, et
al: Genetic alterations during colorectal-tumor development. N Engl
J Med. 319:525–532. 1988. View Article : Google Scholar : PubMed/NCBI
|
|
37.
|
Reya T, O’Riordan M, Okamura R, et al: Wnt
signaling regulates B lymphocyte proliferation through a LEF-1
dependent mechanism. Immunity. 13:15–24. 2000. View Article : Google Scholar : PubMed/NCBI
|
|
38.
|
Staal FJ and Sen JM: The canonical Wnt
signaling pathway plays an important role in lymphopoiesis and
hematopoiesis. Eur J Immunol. 38:1788–1794. 2008. View Article : Google Scholar : PubMed/NCBI
|
|
39.
|
Ge X and Wang X: Role of Wnt canonical
pathway in hematological malignancies. J Hematol Oncol. 3:332010.
View Article : Google Scholar : PubMed/NCBI
|
|
40.
|
Gelebart P, Anand M, Armanious H, et al:
Constitutive activation of the Wnt canonical pathway in mantle cell
lymphoma. Blood. 112:5171–5179. 2008. View Article : Google Scholar : PubMed/NCBI
|
|
41.
|
Lako M, Lindsay S, Lincoln J, Cairns PM,
Armstrong L and Hole N: Characterisation of Wnt gene expression
during the differentiation of murine embryonic stem cells in vitro:
role of Wnt3 in enhancing haematopoietic differentiation. Mech Dev.
103:49–59. 2001. View Article : Google Scholar : PubMed/NCBI
|
|
42.
|
Lu D, Zhao Y, Tawatao R, et al: Activation
of the Wnt signaling pathway in chronic lymphocytic leukemia. Proc
Natl Acad Sci USA. 101:3118–3123. 2004. View Article : Google Scholar : PubMed/NCBI
|
|
43.
|
Rosenwald A, Alizadeh AA, Widhopf G, et
al: Relation of gene expression phenotype to immunoglobulin
mutation genotype in B cell chronic lymphocytic leukemia. J Exp
Med. 194:1639–1647. 2001. View Article : Google Scholar : PubMed/NCBI
|