Introduction
Liver cancer in men is the fifth most frequently
diagnosed cancer worldwide but the second most frequent cause of
cancer death (1). Half of these
cases and deaths were estimated to occur in China (2).
Krüppel-like factor (KLF) family members
share a three C2H2 zinc-finger DNA binding domain, and are involved
in cell proliferation and differentiation control in normal as well
as in pathological situations (3).
An emerging body of evidence indicates that KLF is associated with
various types of cancers. Downregulation of KLF4 expression is
reported in esophageal cancer (4)
and colorectal cancer (5).
Significant genetic alterations of KLF6 expression are observed in
prostate cancer (6). LOH of
KLF6 locus at chromosome 10p15 contributes to the
development of colorectal carcinoma (7). In the study of Kang et al
(8), downregulation of KLF9 is
confirmed in human colorectal cancer. However, the roles of KLF9 in
hepatocellular carcinoma (HCC) were not clear. KLF9 is an
evolutionary well-conserved member of the KLF family of
transcriptional regulators (9).
KLF9 is first identified as a transcriptional repressor of
the rat Cyp1a1 (previously P-4501A1) gene and
originally named basic transcription element-binding protein 1
(Bteb1) (10). Human
KLF9 gene, localized on human chromosome 9q13 (11), has been implicated in mediating a
diverse range of biological processes including stem cell
maintenance (12) and
differentiation of T- and B-lymphocytes (13,14).
In our previous study, we confirmed that the levels
of PDCD5 mRNA and protein were lower in HCC tissue than normal
tissue (15). In this study, we
investigated the potential role of KLF9 in HCC. We first
demonstrated that KLF9 expression is correlated with
clinicopathological features and patient survival, and it may be a
useful predictor of prognosis in patients with HCC. Interesting,
our results also showed that exogenous KLF9 expression played its
role in HepG2 cells depending on PDCD5 expression.
Materials and methods
Cell culture and tumor specimens
Human liver cancer cell line, HepG2, was cultured in
DMEM (Hyclone, Logan, UT, USA) containing 10% fetal bovine serum
(Invitrogen Gibco, Carlsbad, CA, USA) and incubated in a 5%
CO2 incubator at 37°C. Liver specimens were derived from
56 patients undergoing surgical resection of primary hepatocellular
carcinoma without prior chemotherapeutic treatment or radiotherapy.
Basic information of these patients was described in our previous
study (15).
Quantitative real-time RT-PCR
(QRT-PCR)
Total cellular RNA (1 μg) from each cell line
was reverse-transcribed using Takara Reverse Transcription kit
(Takara, Dalian, China) and oligo(dT) 15 primers (Takara). The
KLF9 primers were: 5′-TGGCTGTGGGAAAGTCTATGG-3′ (sense) and
5′-CTC GTCTGAGCGGGAGAACT-3′ (antisense). SYBR Green real-time PCR
was performed with an ABI PRISM 7500 Sequence Detector. Thermal
cycling conditions included pre-incubation at 50°C for 2 min, 95°C
for 10 min followed by 40 PCR cycles at 95°C for 15 sec and 60°C
for 1 min. Relative transcript levels were calculated using the
relative standard curve method and results were normalized to
GAPDH. The GAPDH primers were:
5′-AGAAGGCTGGGGCTCATTTG-3′ (sense) and 5′-AGGGGCCATCCACAGTCTTC-3′
(antisense).
Immunohistochemical staining (IHC)
As described in our previous study (15), 4-μm sections of
paraffin-embedded specimens were performed using the KLF9
polyclonal antibody (sc-12996, Santa Cruz Biotechnology, Santa
Cruz, CA, USA). Briefly, after deparaffinization and hydration, the
endogenous peroxidase activity was quenched by a 30-min incubation
in a mixture of 0.3% hydrogen peroxide solution in 100% methanol.
The sections were blocked for 2 h at room temperature with 1.5%
blocking serum in PBS and incubated with KLF9 antibody (1:1,000
dilution) at 4°C in a moist chamber overnight, followed by
incubation with Envision reagent (Dako, Carpinteria, CA, USA) and
color development in 3,3′-diaminobenzidine tetrahydrochloride (DAB,
Sigma-Aldrich, Carlsbad, CA, USA). The slides were then lightly
counterstained with hematoxylin, dehydrated with ethanol, cleaned
with xylene, and mounted. Adjacent non-cancer tissues were used as
controls. Sections treated without primary antibodies were used as
negative controls. The positive percentage of counting cells was
graded semi-quantitatively according to a four-tier scoring system:
negative (−), 0–5%; weakly positive (+), 6–25%; moderately positive
(++), 26–50%; and strongly positive (+++), 51–100%.
Plasmid construction and
transfection
The recombinant plasmid, pEGFP-C1-KLF9 was kindly
gifted by Mr. Lin Niu (China Medical University) and verified by
DNA sequencing (Sunbiotech, Beijing, China). pEGFP-C1-KLF9
transfections were performed using Lipofectamine 2000 (Invitrogen)
according to the manufacturer’s instructions.
Colony formation assay
Cells were seeded at 200 cells per well in 24-well
tissue culture plates. Plates were incubated for one week in a
humidified incubator at 37°C. One week after seeding, colonies were
stained with 0.05% crystal violet containing 50% methanol and
counted. The colonies were counted in 4–5 random fields for each of
the duplicate samples by using a microscope at ×100
magnification.
Transmission electron microscopy
Specimens were immersed in 2% cacodylate-buffered
glutaraldehyde, rinsed in cacodylate buffer supplemented with 15%
sucrose, post-fixed with 1% phosphate-buffered OsO4,
dehydrated with alcohol, clarified in propylene oxide, and embedded
in Epon using flat molds. Ultrathin sections were made with an
ultramicrotome, stained with uranyl acetate, followed by a
saturated solution of bismuth subnitrate, and observed under a JEOL
JSM 6400 scanning electron microscope (JEOL, Tokyo, Japan).
Cell apoptosis assay
Cells (5×10⁵) were collected without EDTA
and washed with PBS. A 500-μl binding buffer, 5 μl
Annexin V-FITC and 5 μl propidium iodide (PI) (KeyGen,
Nanjing, China) were added into the suspension in that order and
mixed at room temperature in the dark for 10 min. The examination
was performed by a FACSCalibur machine (BD Biosciences, Baltimore,
MD, USA) within 1 h.
Determination of mitochondrial membrane
potential
The mitochondrial membrane potential (MMP) was
analyzed using the fluorescent dye
5,5′,6,6′-tetrachloro-1,1′,3,3′-tetraethylbenzimidazolycarbocyanine
iodide (JC-1) following the manufacturer’s protocol (KeyGen).
Briefly, cells were plated in a 6-well culture plate. After 24 h,
cells were washed twice with PBS, harvested and loaded with 20 nM
JC-1 for 30 min in the dark. Afterwards, MMP was analyzed by a
FACSCalibur machine as described above.
In vitro wound healing assay
Cells were grown in a 6-well dish. A confluent
monolayer of cells was scratched with a 200-μl pipette tip
to simulate a wound. Cells were washed twice with PBS and then
supplemented with medium and incubated for 4 h at 37°C. Cell
migration into the wounded area was monitored microscopically.
Images were captured at the interface of the unwounded and wounded
areas.
Cell invasion assay
For invasive assay, cells were resuspended in
serum-free DMEM, and seeded in the control-membrane insert on the
top portion of the Matrigel-coated chamber (BD Bioscience). The
lower compartment of the chamber contained 10% FBS as a
chemo-attractant. After incubation for 24 h, cells on the membrane
were scrubbed, washed with PBS and fixed in 100% methanol and
stained with Giemsa dye.
Imaging with confocal FRET
microscopy
Confocal images were acquired with a Leica TCS-SP2
confocal microscope (Leica Microsystems, Heidelberg GmbH, Germany).
To correct for spectral bleed-through (SBT) and for uncontrolled
variations in donor-acceptor concentrations, a combination of
donor, FRET and acceptor filter sets was used to isolate and
maximize three specific signals: donor fluorescence, acceptor
fluorescence resulting from FRET and the directly excited acceptor
fluorescence, respectively. Filter sets used were as follows: the
red channel (donor excitation/donor emission = 543/575 nm), the
green/blue channel (acceptor excitation/acceptor emission = 633/680
nm) and the FRET channel (donor excitation/acceptor emission =
543/680 nm: FRET).
Co-immunoprecipitation
Transfected cells were washed once with PBS, lysed
for 30 min in lysis buffer (50 mM Tris-HCl, pH 7.5, 150 mM NaCl, 1%
Nonidet P-40) containing protease inhibitors (Cocktail, Roche,
Basel, Switzerland) and phosphatase inhibitors (1 mM NaF and 1 mM
Na3VO4), and centrifuged at 15,000 × g at 4°C
for 15 min. Supernatants were pre-cleared with EZ View Red protein
G-Sepharose (Sigma) for 1 h at 4°C. Then 5 μg of antibody
specific for each target protein were added in each sample. Immune
complexes were precipitated by EZ View red protein G-Sepharose
overnight at 4°C and washed 3 times with lysis buffer. The immune
complexes were boiled (100°C) for 10 min in SDS sample buffer (100
mM Tris-HCl, pH 8.8, 0.01% bromophenol blue, 20% glycerol, 4% SDS)
containing 10 mM dithiothreitol and resolved by 10% SDS-PAGE.
Luciferase assays
The methods of Du et al (16), were used for transfection with 0.4
μg of either pGL3-control-692-bp KLF9 promoter or
pGL3-control-131-bp KLF9 promoter in 24-well plates. Each group of
cells was cotransfected with either 1.0 μg of pcDNA3.1-PDCD5
vector or empty pcDNA3.1 vector. All cells were cotransfected with
10 ng of pRL-TK to control for transfection efficiency. After 4 h,
the media were changed, and 48-h posttransfection, the cells were
rinsed with cold PBS and lysed with 1X reporter lysis buffer
(Promega, Madison, WI, USA). The lysate was collected after two
freeze/thaw cycles. Luciferase activity was measured using the
luciferase reagent kit (Promega). Transfections were performed in
duplicate, and experiments were repeated three times. The
pGL3-control vector was used as a control.
Western blot analysis
Whole protein was extracted from human liver cancer
cell lines and liver tissues using RIPA buffer (20 mM Tris-HCl, 150
mM NaCl, 2 mM EDTA, 1% Triton-X100) containing a protease inhibitor
cocktail (Sigma). Extract protein amounts were quantified using the
BCA protein assay kit (CWbiotech, Beijing, China). Equivalent
amounts of protein (60 μg) were separated using 10% SDS-PAGE
and transferred to a PVDF membrane (Millipore Corp., Billerica, MA,
USA). Western blot analysis was performed using primary antibodies:
KLF9 (sc-376422) and β-actin (sc-130657, Santa Cruz Biotechnology).
Each specific antibody binding was detected with horseradish
peroxidase (HRP)-conjugated respective secondary antibodies
(Amersham Biosciences, Amersham, UK) and ECL solutions (Amersham
Biosciences).
Affymetrix GeneChip technology
The total RNA was extracted from cells as described
above. The total RNA samples were then analyzed by CapitalBio Corp
for GeneChip (Affymetrix) assay. Furthermore, each treatment has 3
biological replicates that were measured in this manner. Gene
expression analysis was performed by using the Affymetrix (Santa
Clara, CA, USA) GeneChip, following the laboratory methods in the
Affymetrix GeneChip expression manual. Gene expression analysis was
performed using triple arrays and triple independent mRNA samples
for each treatment. Microarray data were analyzed by using Bio MAS
3.0 software (CapitalBio, Beijing, China). Using the criterion of
cutoff limitation as a fold change ≥2 or ≤0.5 and q-value ≤5%,
differential expression genes were screened and clustered.
Statistical analysis
Statistical analyses were performed using SPSS 15.0
software (SPSS, Chicago, IL, USA). Comparisons were made using
χ2 tests, the Wilcoxon signed-rank test and the t-test.
Overall survival was analyzed using the Kaplan-Meier method and the
significance of differences in survival rates was estimated using
the log-rank test. P-values of <0.05 were considered
significant.
Results
Reduction of KLF9 in HCC tissues compared
with normal tissues
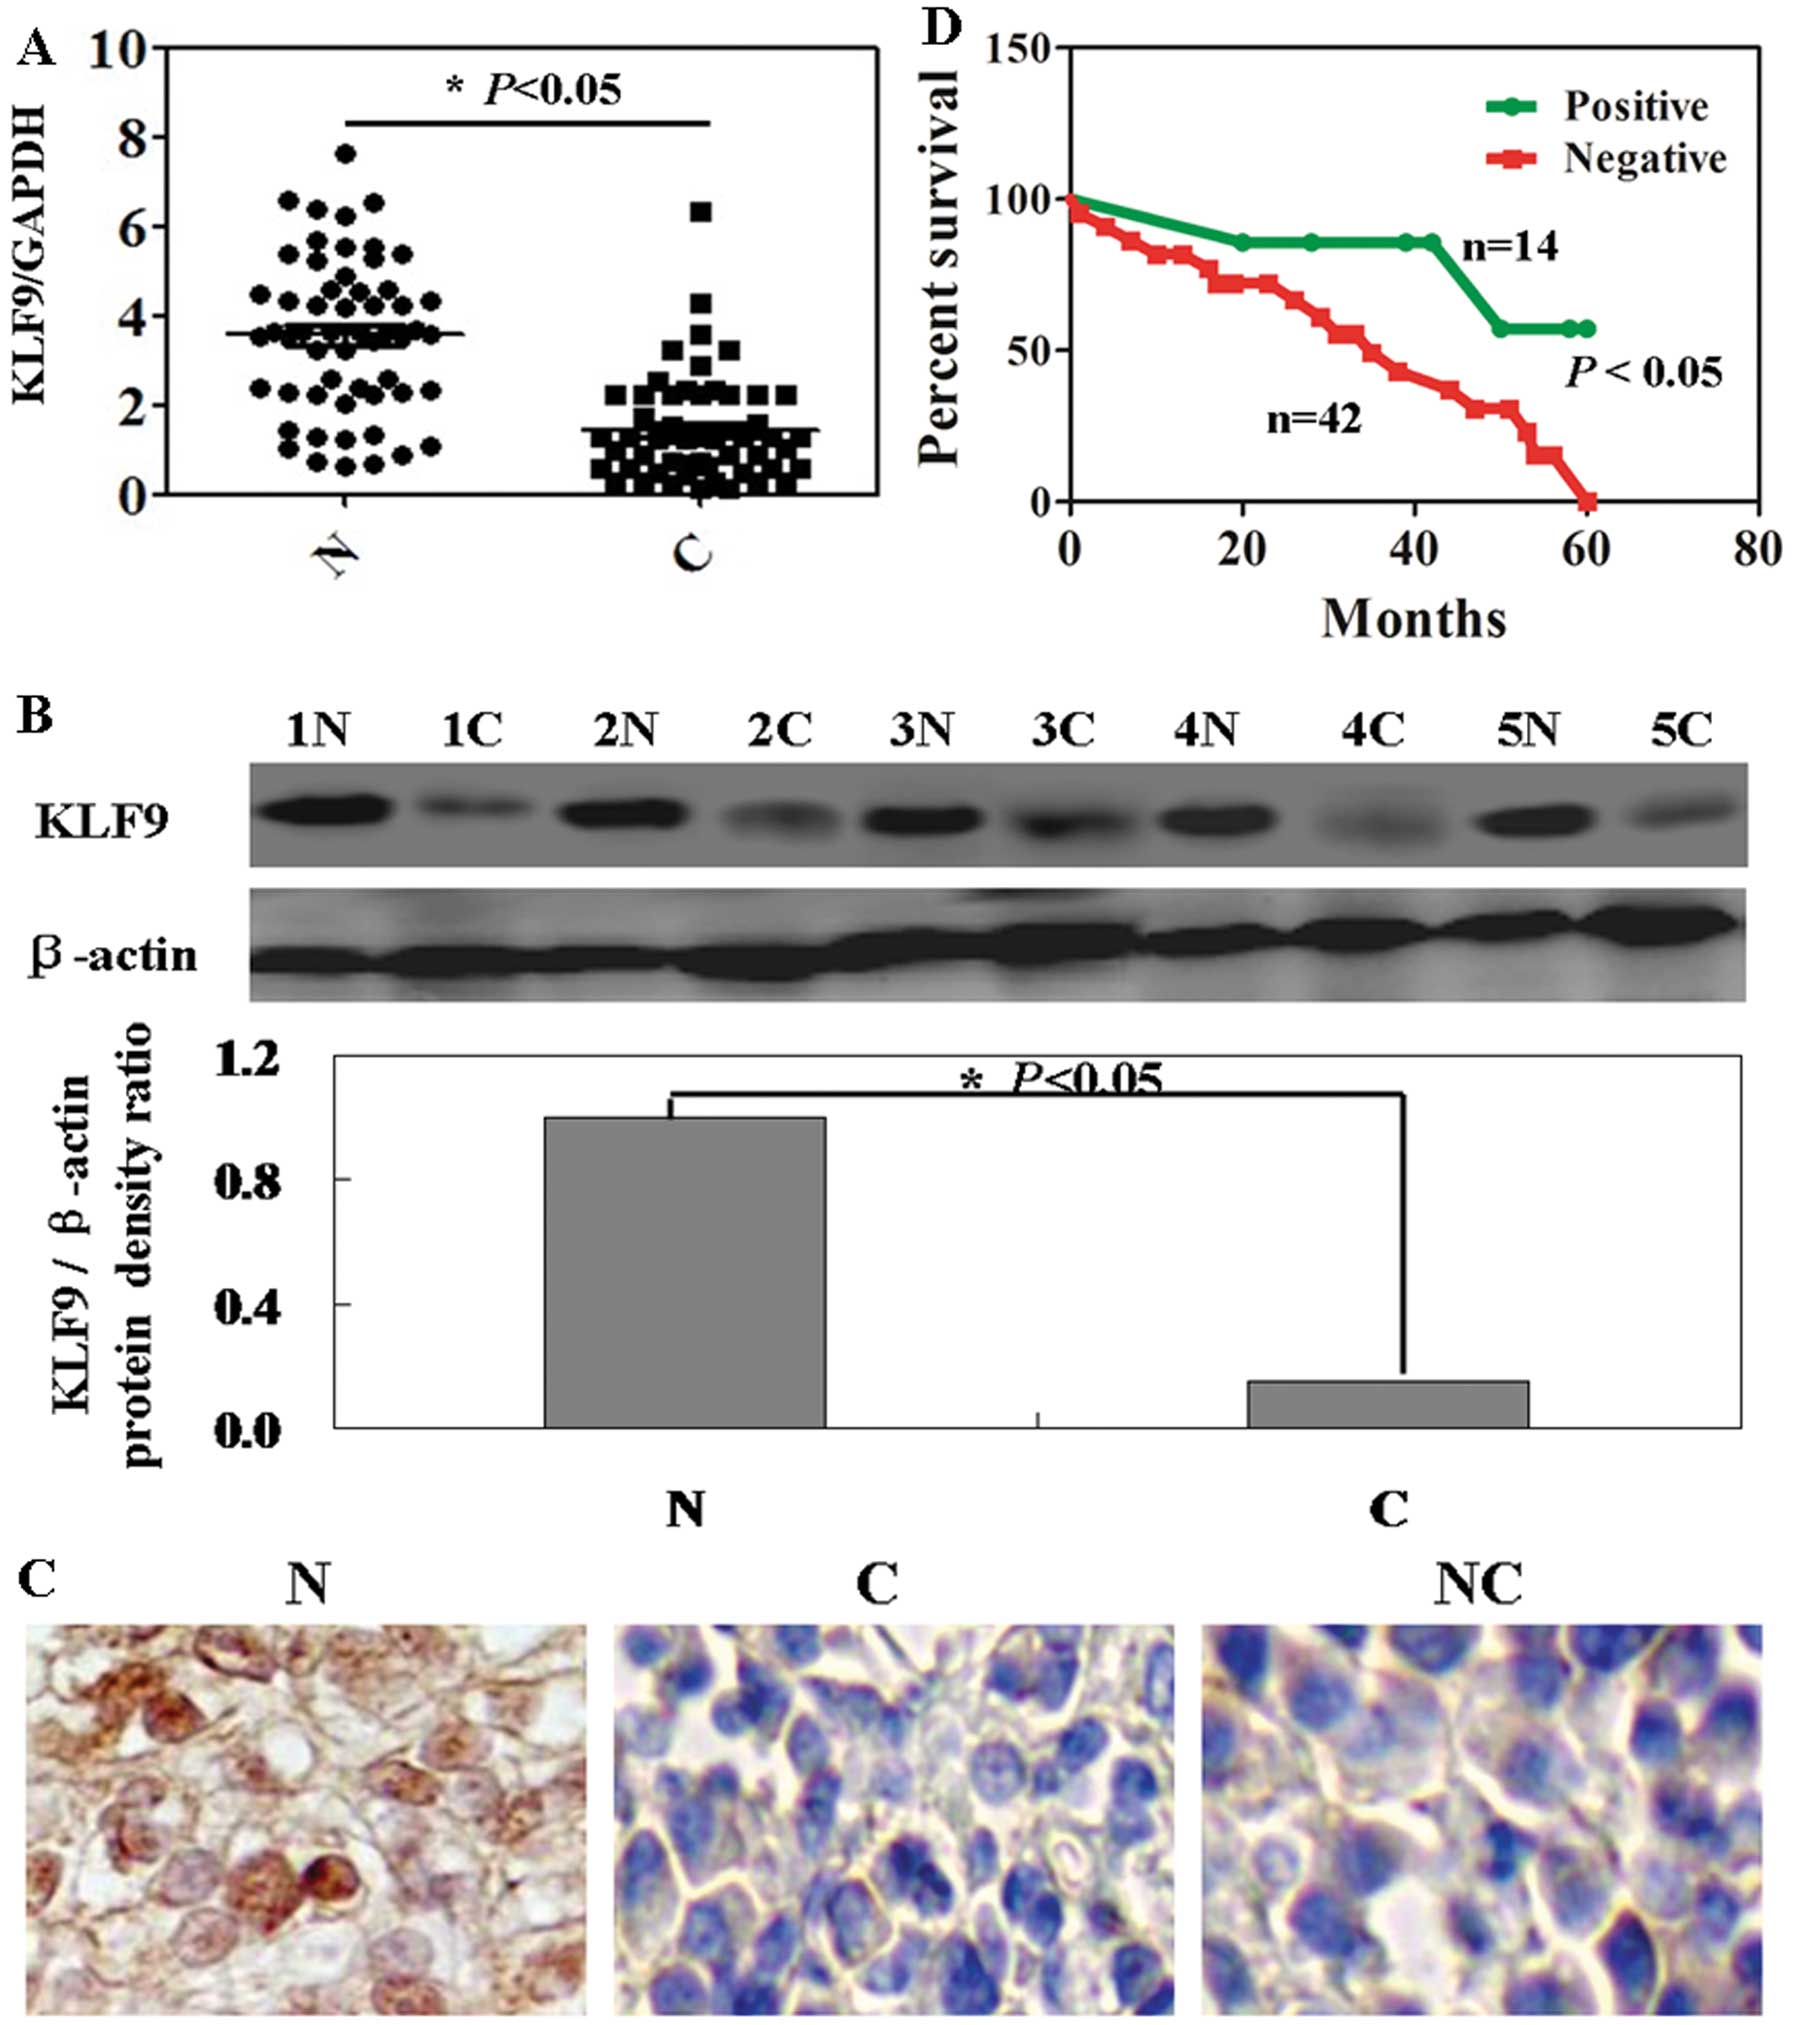
In hepatoma tumor tissues, downregulation of KLF9
mRNA and protein was detected in all 56 cases compared with each
individual normal tissue (Fig. 1A and
B; P<0.05). In Fig. 1C, the
results of immunohistochemical staining showed that positive
staining was seen in the nucleus of the normal cells, in contrast,
almost no positive cells were seen in cancer tissue. We failed to
detect any significant association between KLF9 expression and age,
tumor number, differentiation, portal invasion and HBV infection
(Table I; P>0.05). However, the
KLF9 expression was correlated statistically with sex (P=0.012) and
lymph node metastasis (P=0.037). Cox’s proportional hazard analysis
indicated that KLF9 expression was an independent prognostic factor
for HCC (Table II; P<0.05). HCC
patients with KLF9 expression were associated with a significantly
higher survival rate than the ones without KLF9 expression
(Fig. 1D; P=0.023).
 | Table I.KLF9 expression associated with
demographic and biological parameters in 56 hepatocellular
carcinoma samples. |
Table I.
KLF9 expression associated with
demographic and biological parameters in 56 hepatocellular
carcinoma samples.
| Clinicopathological
features | n | KLF9 expression
|
|---|
| − | + | ++ | +++ | PR (%) | χ2 | P-value |
|---|
| Sex | | | | | | | 10.84 | 0.012 |
| Female | 20 | 10 | 4 | 3 | 3 | 50.0 | | |
| Male | 36 | 32 | 1 | 1 | 2 | 11.1 | | |
| Age (years) | | | | | | | 5.72 | 0.126 |
| <55 | 26 | 16 | 4 | 2 | 4 | 38.5 | | |
| ≥55 | 30 | 26 | 1 | 2 | 1 | 13.3 | | |
| Tumor number | | | | | | | 4.09 | 0.252 |
| Multiple | 38 | 30 | 3 | 1 | 4 | 21.1 | | |
| Solitary | 18 | 12 | 2 | 3 | 1 | 33.3 | | |
|
Differentiation | | | | | | | 0.42 | 0.935 |
|
Differentiated | 27 | 20 | 2 | 2 | 3 | 25.9 | | |
|
Undifferentiated | 29 | 22 | 3 | 2 | 2 | 24.1 | | |
| Portal
invasion | | | | | | | 6.48 | 0.090 |
| − | 17 | 11 | 1 | 1 | 4 | 35.3 | | |
| + | 39 | 31 | 4 | 3 | 1 | 20.5 | | |
| Lymph node
metastasis | | | | | | | 8.46 | 0.037 |
| − | 18 | 10 | 3 | 1 | 4 | 44.4 | | |
| + | 38 | 32 | 2 | 3 | 1 | 15.8 | | |
| Tumor size
(cm) | | | | | | | 2.31 | 0.511 |
| <5 | 25 | 17 | 3 | 3 | 2 | 32.0 | | |
| ≥5 | 31 | 25 | 2 | 1 | 3 | 19.4 | | |
| HBV infection | | | | | | | 6.84 | 0.077 |
| − | 22 | 13 | 2 | 3 | 4 | 40.9 | | |
| + | 34 | 29 | 3 | 1 | 1 | 14.7 | | |
| Table II.Multivariate analysis of clinical
variables. |
Table II.
Multivariate analysis of clinical
variables.
| Clinicopathological
parameters | KLF9
expression |
|---|
| Relative risk (95%
CI) | P-value |
|---|
| Sex (male) | 0.853
(0.648–1.057) | 0.345 |
| Age (>50
years) | 0.564
(0.429–0.699) | 0.157 |
|
Differentiation | 0.775
(0.589–0.961) | 0.642 |
| Lymphatic
invasion | 0.654
(0.497–0.811) | 0.332 |
| Venous
invasion | 0.235
(0.179–0.291) | 0.108 |
| Lymph node
metastasis | 0.854
(0.649–1.059) | 0.094 |
| Tumor size (≥3
cm) | 0.667
(0.507–0.827) | 0.228 |
| KLF9 expression
(+-+++) | 1.235
(0.939–1.531) | 0.043 |
PDCD5 and KLF9-expressing HepG2 cell
lines
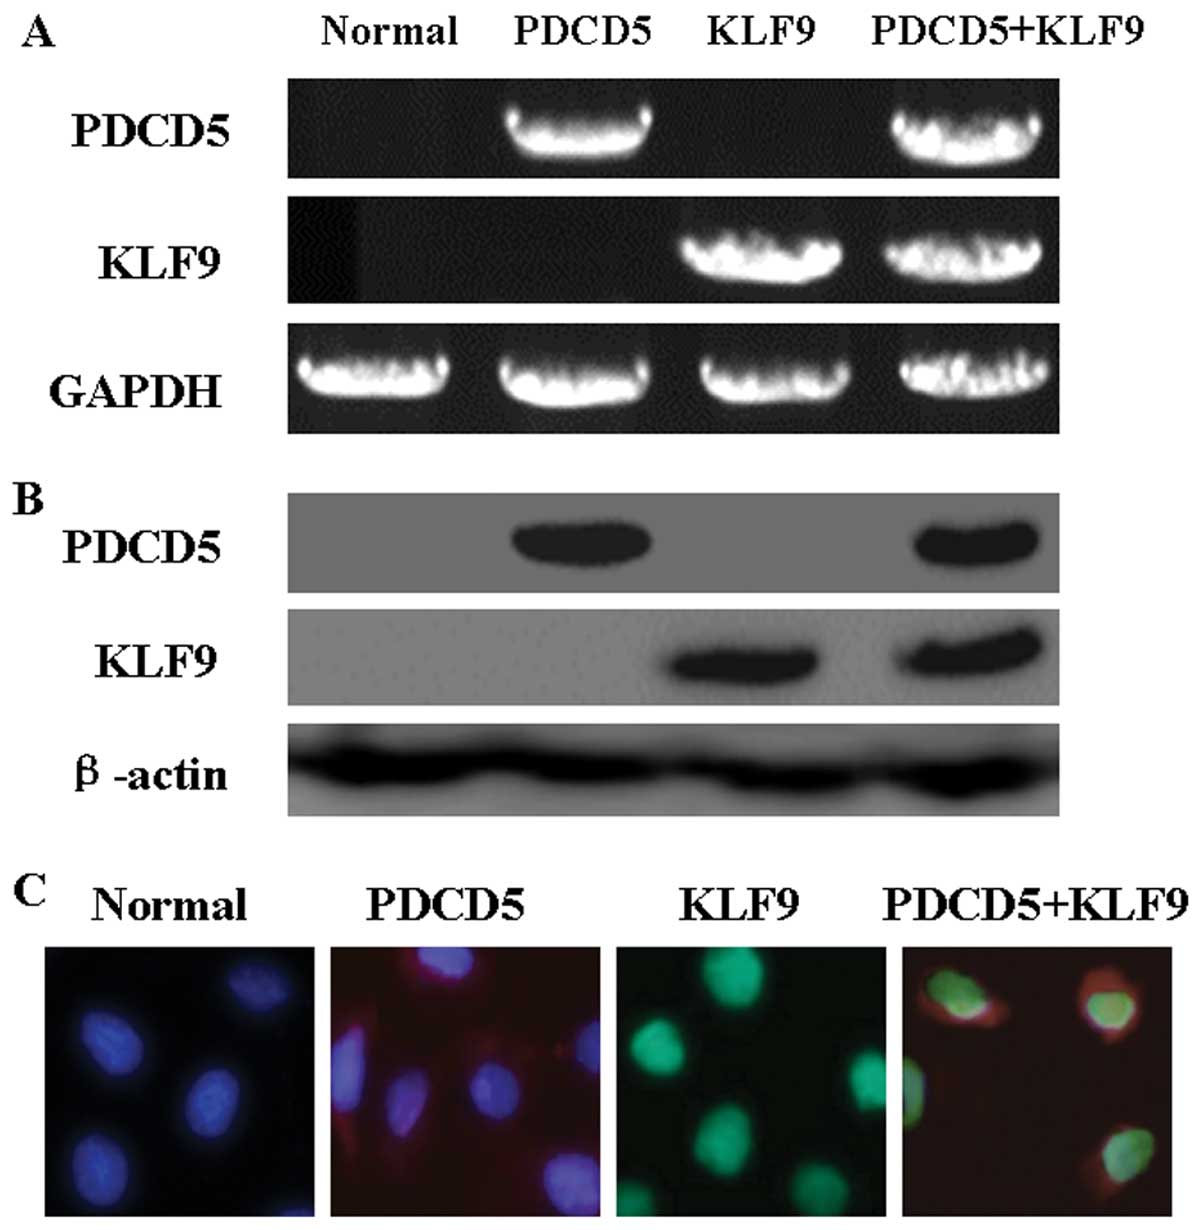
We investigated the consequence of exogenous KLF9
and PDCD5 expression in HepG2 cells. As shown in Fig. 2A and B, the results of RT-PCR and
western blot analysis confirmed exogenous expression of KLF9 and
PDCD5 in HepG2 cells after transfection. Moreover,
immunofluorescence analysis showed the localization of KLF9 and
PDCD5 in transfected cells (Fig.
2C). The evidence confirmed that the co-transfection of KLF9
and PDCD5 in HepG2 cells was successful.
Growth inhibitory effects of KLF9 in
PDCD5 expressing HepG2 cells
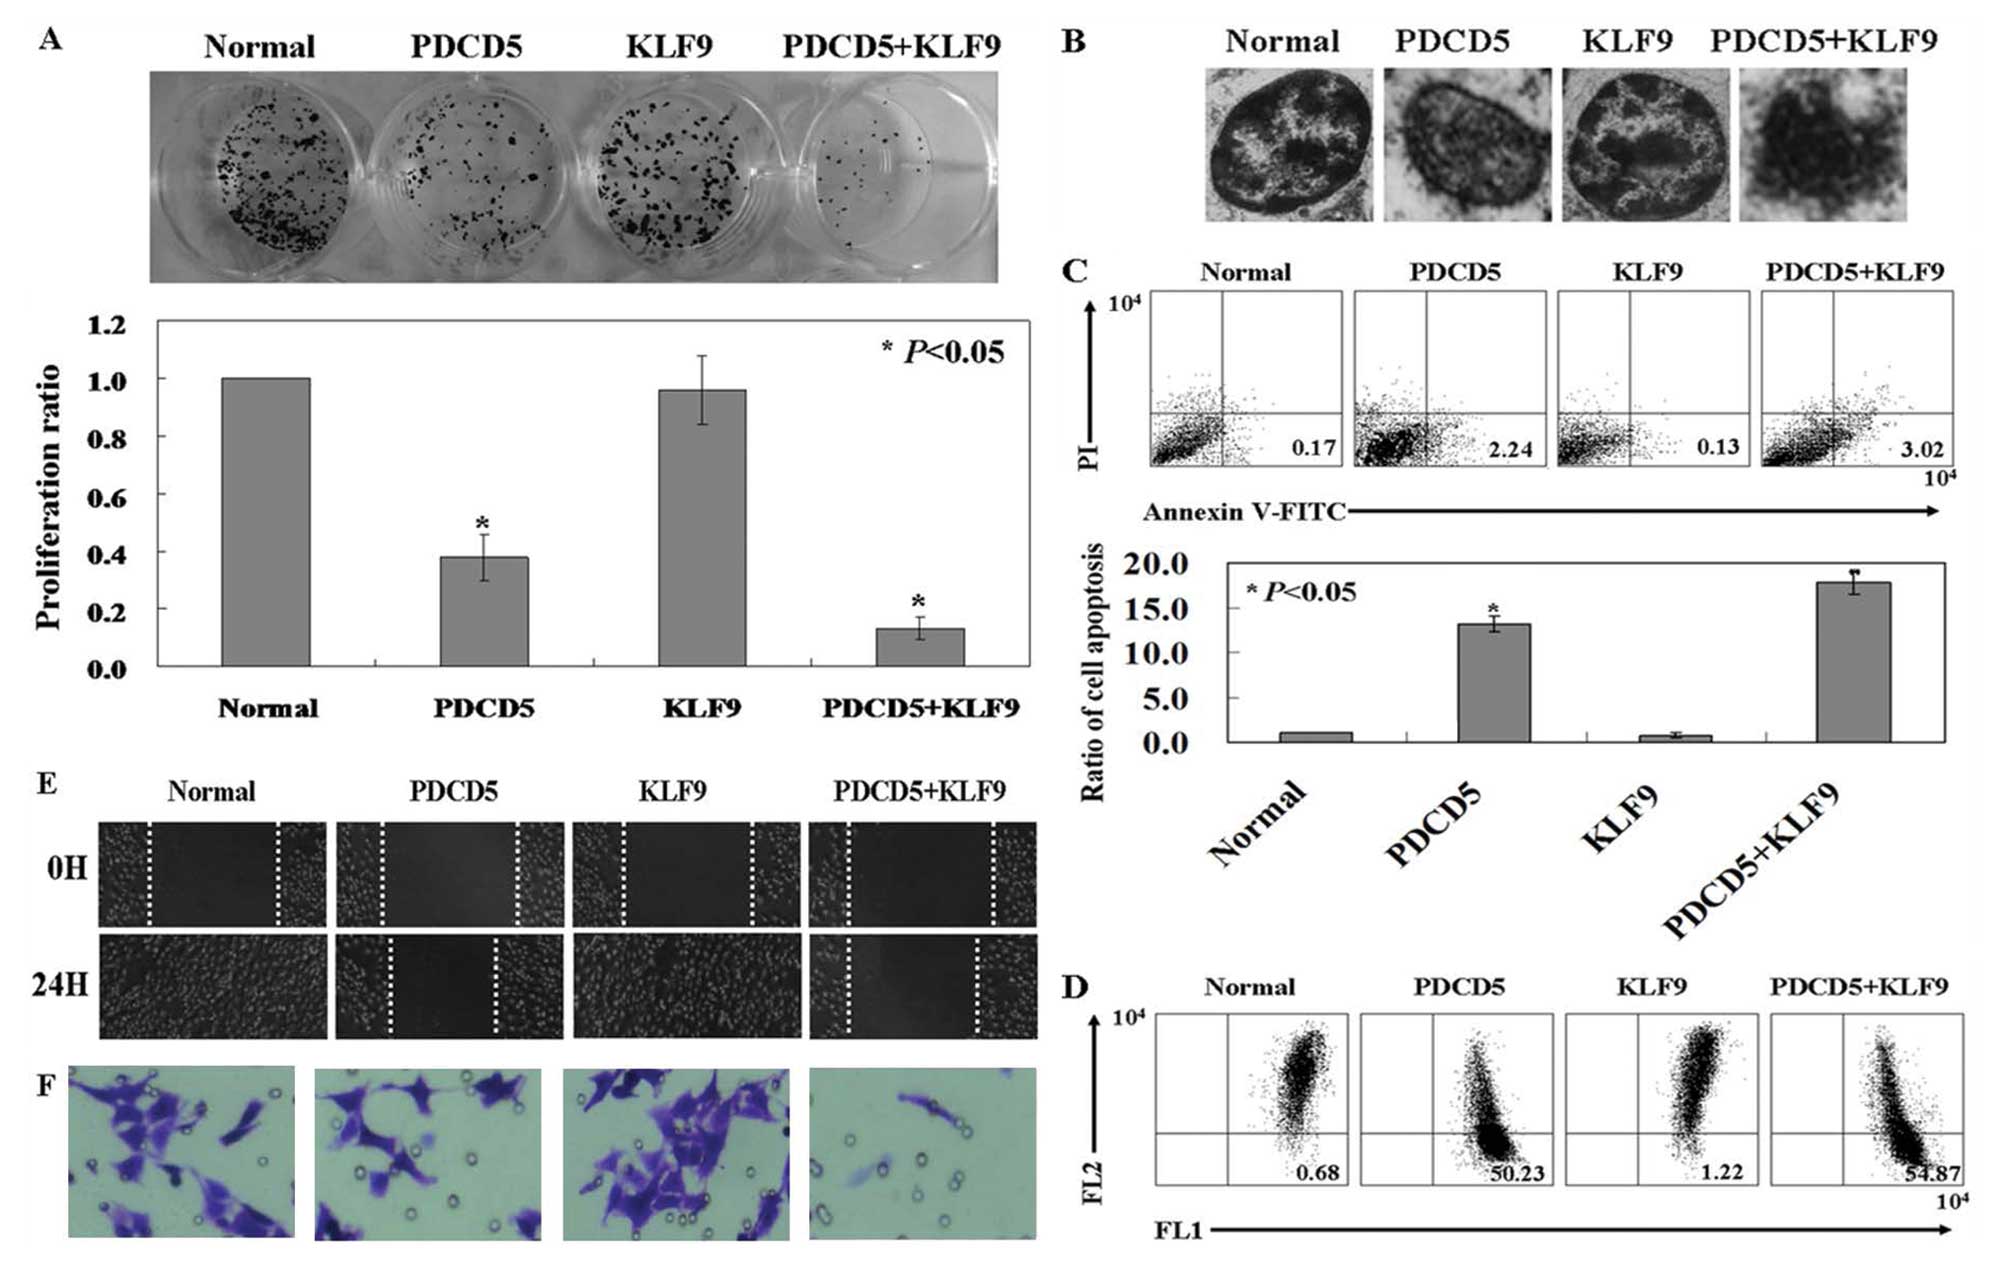
The proliferation rate of PDCD5-expressing HepG2
cells was significantly lower than untreated HepG2 cells by using a
colony formation assay (Fig. 3A;
P<0.05). KLF9-expressing HepG2 cells showed no changes compared
with untreated ones. Interesting, KLF9 inhibited the proliferation
rate of PDCD5-expressing HepG2 cells (Fig. 3A; P<0.05). Therefore, it is
likely that PDCD5 expression would restore KLF9 antitumor
activities in HepG2 cells. Condensed and fragmented nuclei and
condensed chromatin was observed in co-expression of PDCD5 and KLF9
cells by using transmission electron microscopy (TEM) assay
(Fig. 3B). The ratio of apoptotic
cells in each group was determined by Annexin V and PI
double-staining. PDCD5 and KLF9 expressing cells (3.02±0.14%)
exhibited an increased apoptosis compared to PDCD5 expressing ones
(2.24±0.08%), KLF9 expressing ones (0.13±0.04%) and untreated ones
(0.17±0.03%) (Fig. 3C; P<0.05).
As shown in Fig. 3D, the loss of
membrane potential was indicated by the fluorescence emission shift
from red to green. The ratio of red/green in the KLF9-expressing
cells (1.22% green) was reversed after co-transfected with PDCD5
(54.87% green). The effect of KLF9 and PDCD5 expression on the
motility of HepG2 cells was determined by wound-healing assay and
transwell assay. The wound closure of the KLF9 and PDCD5 expressing
cells was decreased when compared to the PDCD5 expressing ones,
KLF9 expressing ones and untreated ones (Fig. 3E). The invasion of KLF9 and PDCD5
expressing cells was also significantly inhibited by comparing with
the other three groups (Fig.
3F).
Analysis of interaction between PDCD5 and
KLF9 by FRET, co-IP and luciferase assays
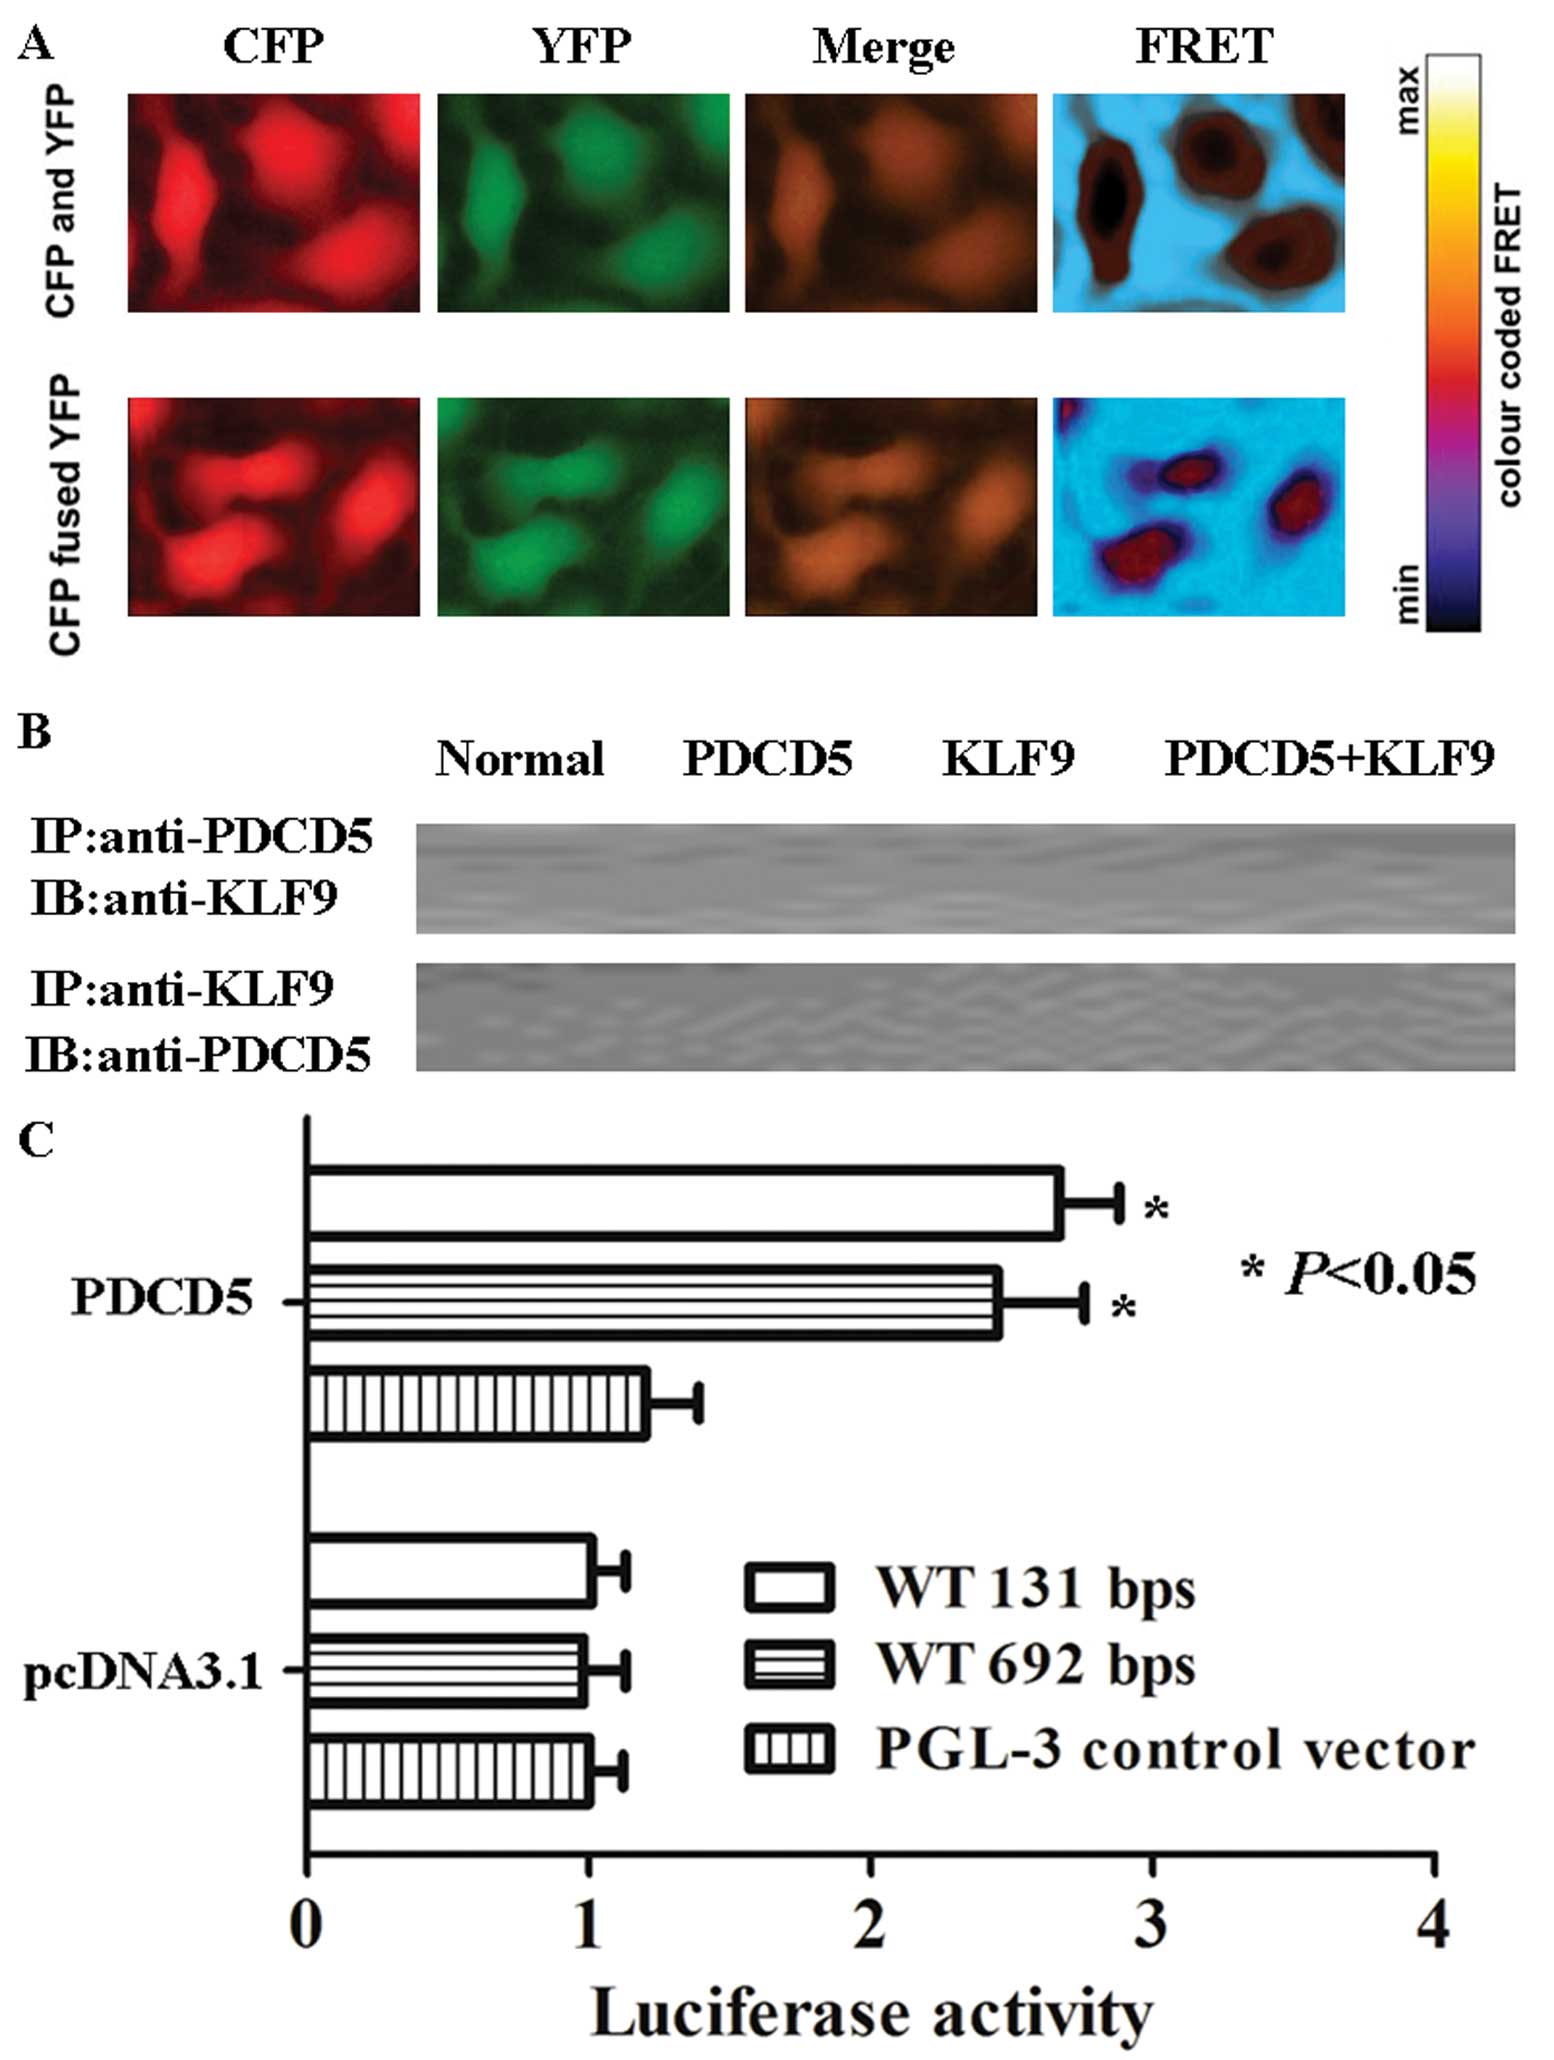
The interaction between CFP- and YFP-fused PDCD5
proteins is measured by the distance-dependent energy transfer from
the excited donor CFP to the acceptor YFP. As shown in Fig. 4A, the FRET ratio (emission ratio
527:475 nm) remained steady in KLF9 and PDCD5 expressing cells. The
results indicated that PDCD5 protein had no interaction with KLF9
protein. Furthermore, we performed co-IP and western blot analysis.
Consistent with the result of FRET, no interaction of PDCD5 and
KLF9 was found (Fig. 4B).
Interesting, in luciferase assays, expression driven by the 692-bp
pGL3-control-KLF9 sequence was 2.3 times increased when PDCD5 was
co-transfected in HepG2 cells. The smaller, 131-bp
pGL3-control-KLF9 sequence resulted in an increase in luciferase
expression induced by PDCD5 (Fig.
4C; P<0.05).
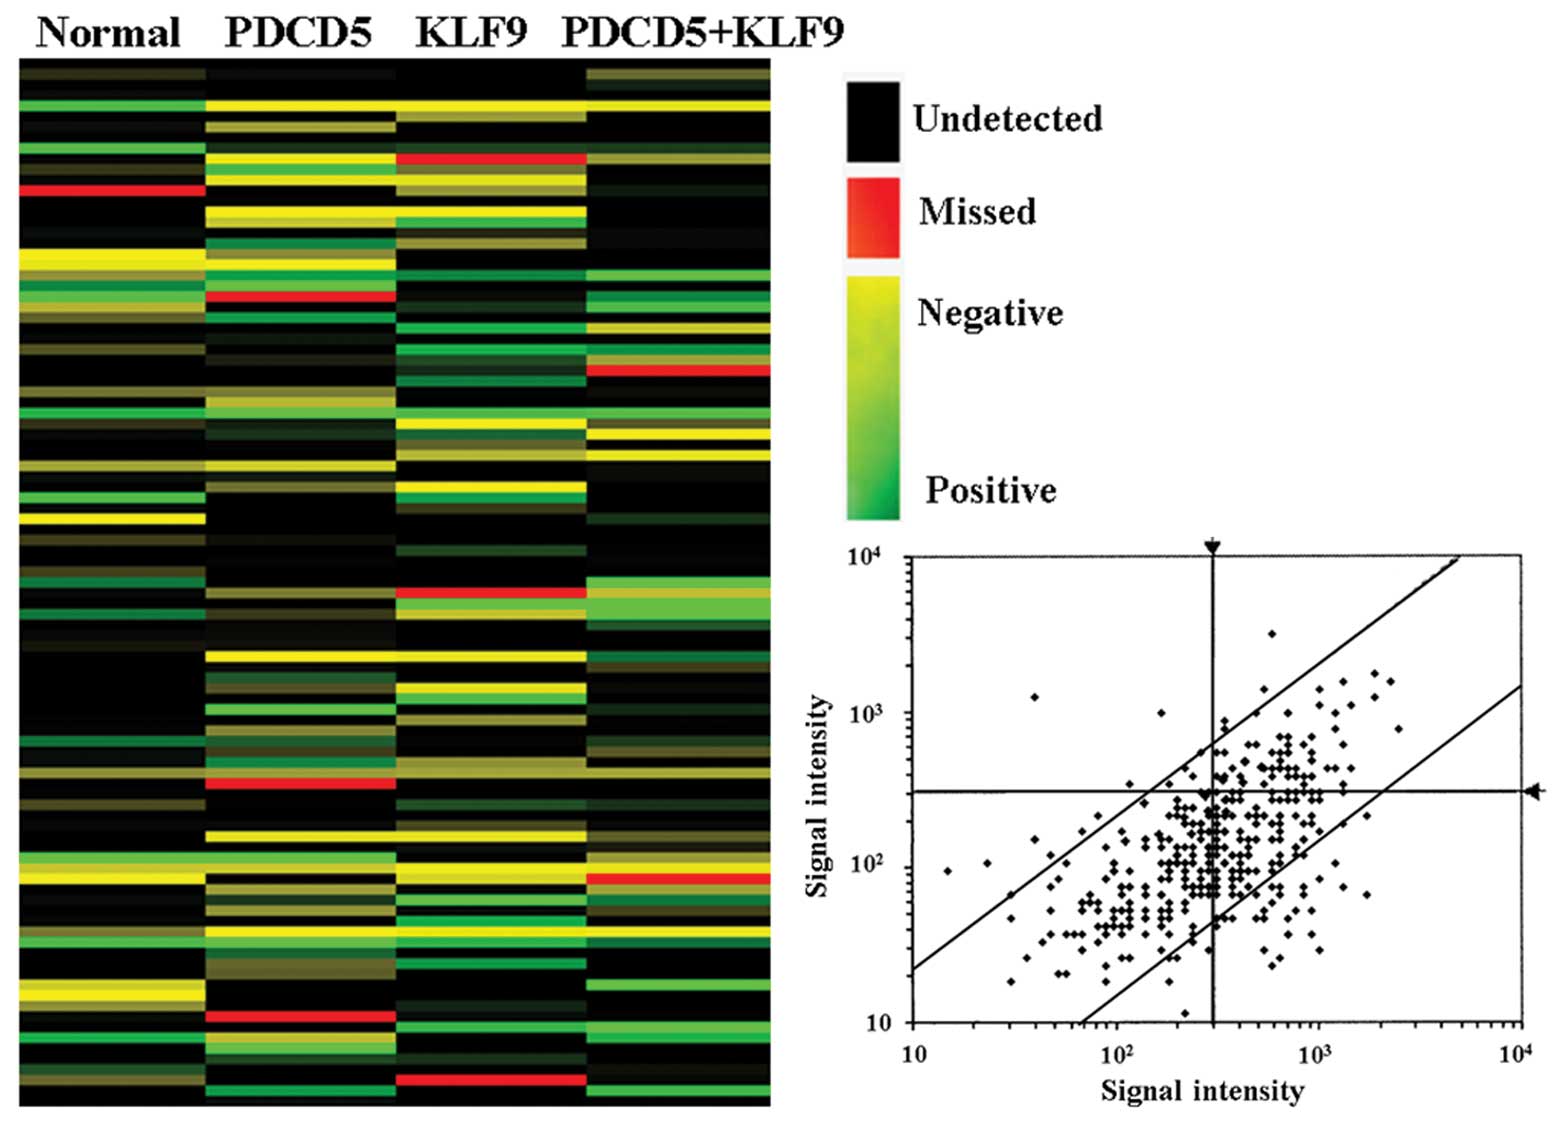
Affymetrix GeneChip analysis
The expression of 3440 human transcripts was
assessed using the Affymetrix® human expression array.
We found that the expression of 236 genes was upregulated and the
expression of 224 genes was downregulated in HepG2 cells with PDCD5
expression compared with untreated ones (Fig. 5; P<0.05). Upregulated expression
of 121 genes and downregulated expression of 287 genes were found
in HepG2 cells with KLF9 expression compared with untreated ones
(Fig. 5; P<0.05). Both PDCD5
and KLF9-induced upregulated expression of 253 genes and
downregulated expression of 456 genes was observed in HepG2 cells
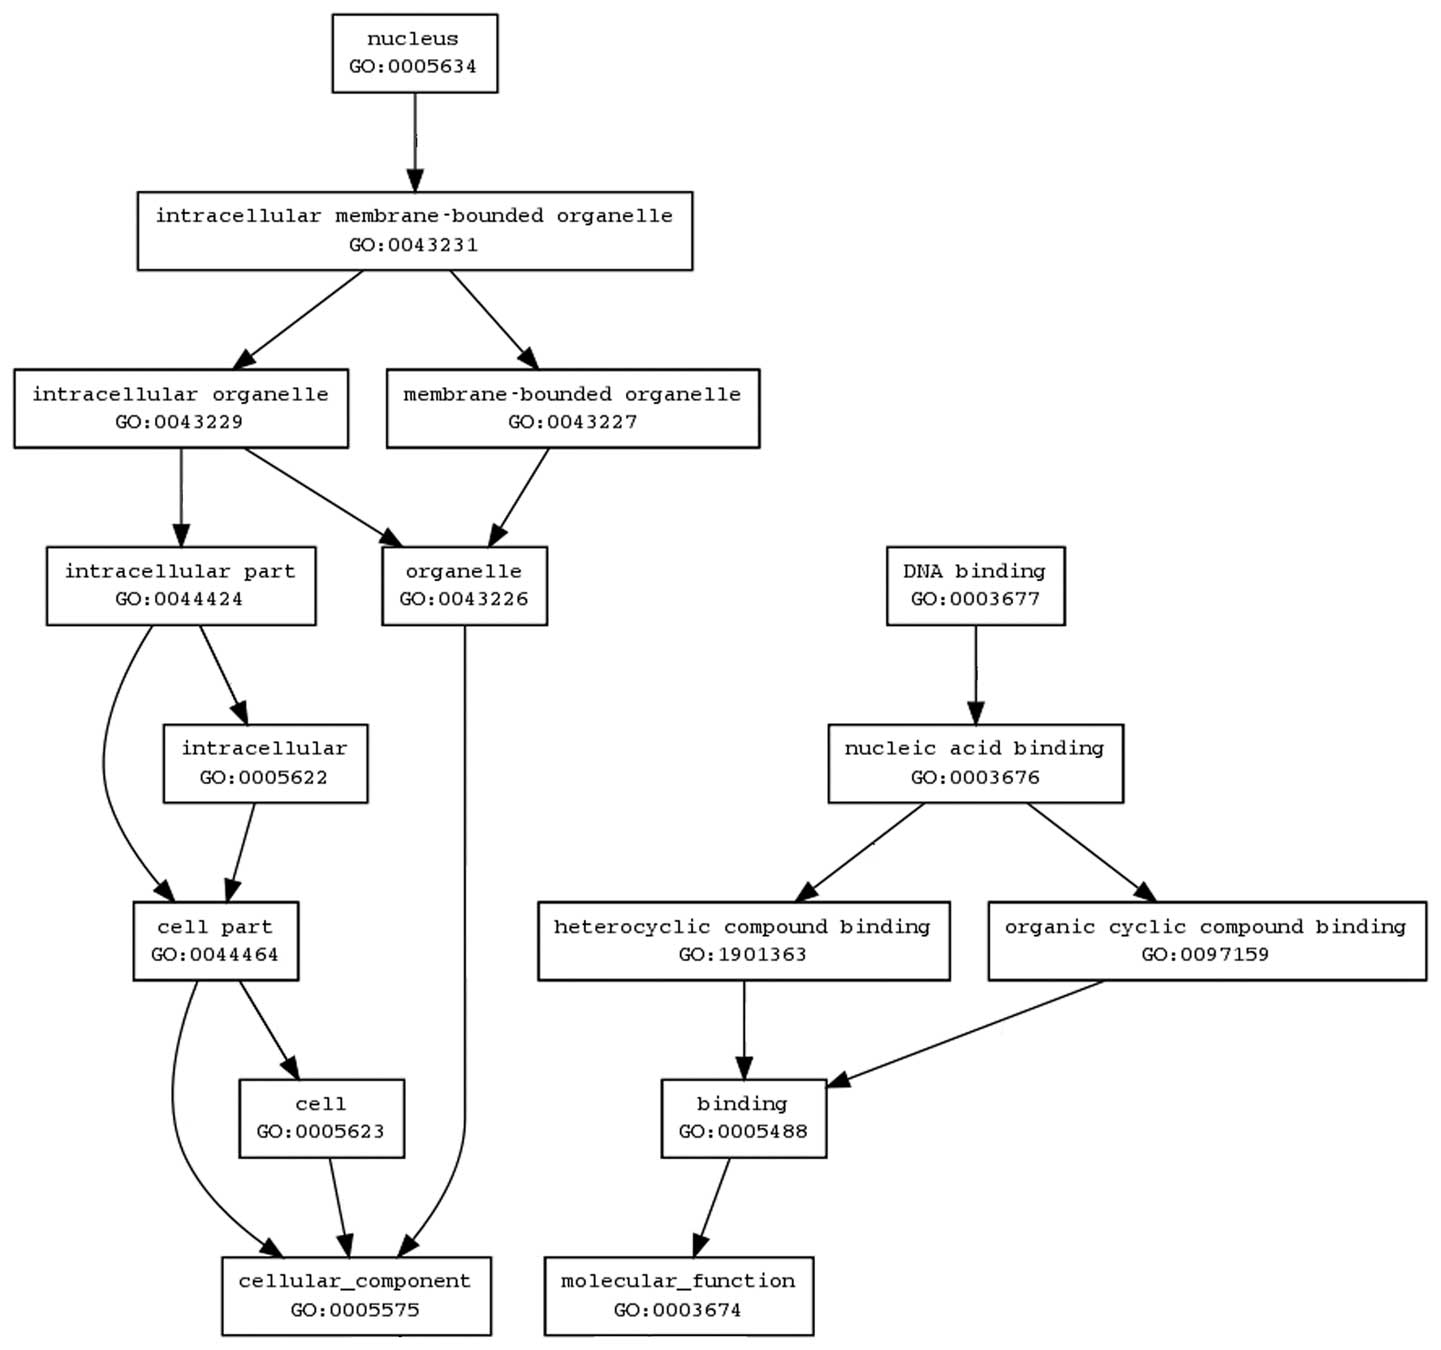
(Fig. 5; P<0.05). We next
investigated the biological interactions using the Bio MAS
(molecule annotation system) 3.0 software and found the genes to
map to genetic networks with functional relationships. The map is
very complex and could not be elucidated in this study. Until now,
we only arranged the network of PDCD5 and found the results were
consistent with the results that were predicted by using the Gene
Ontology (GO) software (http://www.geneontology.org/) (Fig. 6).
Discussion
The present study demonstrates for the first time
that KLF9 mRNA and protein is downregulated in HCC samples,
compared with matched normal tissues. Similar results were observed
in the study of Kang et al (8) by detecting CRC tissues. Recent
evidence suggests an association between KLF9 and human endometrial
tumor pathology, with significantly higher KLF9 transcript levels
in normal endometrium and stage I endometrial tumors when compared
to more aggressive stage II–IV tumors (17). In our study, we confirmed that KLF9
expression was associated with the sex and lymph node metastasis of
the patients.
One of the main findings of this study was that KLF9
played its role in HepG2 cells depending on PDCD5 expression.
Simmen et al (18) noted a
regulatory role for KLF9 in crypt cell proliferation, villus cell
migration, and Paneth and goblet cell differentiation in mice.
However, we did not find antitumor activities of KLF9 in
PDCD5-negative HepG2 cells. Therefore, we assumed that PDCD5
promotes KLF9-induced apoptosis in HepG2 cells. This hypothesis was
demonstrated by using colony formation assay, Annexin V-FITC/PI
double staining and transwell assay. PDCD5 is an
apoptosis-promoting molecule that is upregulated in cells
undergoing apoptosis (19,20). Consistent with previous studies, in
this study, we provide new evidence for PDCD5 as an
apoptosis-promoting molecule.
Furthermore, we detected the possible mechanisms of
KLF9 and PDCD5 in HepG2 cells. Although previous studies have
reported the interaction of KLF1 and GATA1 in erythroid cells
(21) and KLF13 and GATA4 in the
heart (22), whether there is
interaction between KLF9 and PDCD5 remains unclear. To study the
protein interaction, we applied a non-invasive technique, FRET, in
our study. Fluorescence (or Förster) resonance energy transfer
(FRET) is based upon the transfer of energy from an excited donor
fluorophor to a close-by acceptor fluorophor, resulting in enhanced
fluorescence emission of the acceptor (23). We did not find any association of
PDCD5 and KLF9. The result was confirmed by using co-IP assay.
However, we demonstrated that the PDCD5-binding sites in the KLF9
promoter directly upregulate KLF9 expression. In the KLF9 promoter
region, PDCD5-binding sites were clustered to 131-bp region and
692-bp region.
We applied gene expression profiling studies to
explore the changes of KLF9 and PDCD5 expressing cells. As noted in
the Results, the network of KLF9 and PDCD5 is very complex. We will
find the canonical signaling pathways that are influenced by KLF9
and PDCD5 and confirm these pathways by using corresponding
inhibitors in our future studies.
Acknowledgements
We thank Dr Miao Yu for technical
assistance.
References
|
1.
|
Jemal A, Bray F, Center MM, et al: Global
cancer statistics. CA Cancer J Clin. 6:69–90. 2011. View Article : Google Scholar
|
|
2.
|
Bosch FX, Ribes J, Diaz M and Cléries R:
Primary liver cancer: worldwide incidence and trends.
Gastroenterology. 127:S5–S16. 2004. View Article : Google Scholar : PubMed/NCBI
|
|
3.
|
Ratziu V, Lalazar A, Wong L, et al: Zf9, a
Kruppel-like transcription factor up-regulated in vivo during early
hepatic fibrosis. Proc Natl Acad Sci USA. 95:9500–9505. 1998.
View Article : Google Scholar : PubMed/NCBI
|
|
4.
|
Wang N, Liu ZH, Ding F, Wang XQ, Zhou CN
and Wu M: Down-regulation of gut-enriched Kruppel-like factor
expression in esophageal cancer. World J Gastroenterol. 8:966–970.
2002.PubMed/NCBI
|
|
5.
|
Ghaleb AM, Aggarwal G, Bialkowska AB,
Nandan MO and Yang VW: Notch inhibits expression of the
Kruppel-like factor 4 tumor suppressor in the intestinal
epithelium. Mol Cancer Res. 6:1920–1927. 2008. View Article : Google Scholar : PubMed/NCBI
|
|
6.
|
Narla G, Heath KE, Reeves HL, et al: KLF6,
a candidate tumor suppressor gene mutated in prostate cancer.
Science. 294:2563–2566. 2001. View Article : Google Scholar : PubMed/NCBI
|
|
7.
|
Mukai S, Hiyama T, Tanaka S, Yoshihara M,
Arihiro K and Chayama K: Involvement of Kruppel-like factor 6
(KLF6) mutation in the development of nonpolypoid colorectal
carcinoma. World J Gastroenterol. 13:3932–3938. 2007. View Article : Google Scholar : PubMed/NCBI
|
|
8.
|
Kang L, Lü B, Xu J, Hu H and Lai M:
Downregulation of Krüppel-like factor 9 in human colorectal cancer.
Pathol Int. 58:334–338. 2008.
|
|
9.
|
Suske G, Bruford E and Philipsen S:
Mammalian SP/KLF transcription factors: bring in the family.
Genomics. 85:551–556. 2005. View Article : Google Scholar : PubMed/NCBI
|
|
10.
|
Imataka H, Sogawa K, Yasumoto K, et al:
Two regulatory proteins that bind to the basic transcription
element (BTE), a GC box sequence in the promoter region of the rat
P-4501A1 gene. EMBO J. 11:3663–3671. 1992.PubMed/NCBI
|
|
11.
|
Ohe N, Yamasaki Y, Sogawa K, et al:
Chromosomal localization and cDNA sequence of human BTEB, a GC box
binding protein. Somat Cell Mol Genet. 19:499–503. 1993. View Article : Google Scholar : PubMed/NCBI
|
|
12.
|
Jiang J, Chan YS, Loh YH, et al: A core
Klf circuitry regulates self-renewal of embryonic stem cells. Nat
Cell Biol. 10:353–360. 2008. View
Article : Google Scholar : PubMed/NCBI
|
|
13.
|
Nikolcheva T, Pyronnet S, Chou SY,
Sonenberg N, Song A, Clayberger C and Krensky AM: A translational
rheostat for RFLAT-1 regulates RANTES expression in T lymphocytes.
J Clin Invest. 110:119–126. 2002. View Article : Google Scholar : PubMed/NCBI
|
|
14.
|
Good KL and Tangye SG: Decreased
expression of Kruppel-like factors in memory B cells induces the
rapid response typical of secondary antibody responses. Proc Natl
Acad Sci USA. 104:13420–13425. 2007. View Article : Google Scholar : PubMed/NCBI
|
|
15.
|
Fu DZ, Cheng Y, He H, Liu HY and Liu YF:
PDCD5 expression predicts a favorable outcome in patients with
hepatocellular carcinoma. Int J Oncol. 43:821–830. 2013.PubMed/NCBI
|
|
16.
|
Du H, Sarno J and Taylor HS: HOXA10
inhibits Kruppel-like factor 9 expression in the human endometrial
epithelium. Biol Reprod. 83:205–211. 2010. View Article : Google Scholar : PubMed/NCBI
|
|
17.
|
Simmen RC, Pabona JM, Velarde MC, et al:
The emerging role of Kruppel-like factors in endocrine-responsive
cancers of female reproductive tissues. J Endocrinol. 204:223–231.
2010. View Article : Google Scholar : PubMed/NCBI
|
|
18.
|
Simmen FA, Xiao R, Velarde MC, et al:
Dysregulation of intestinal crypt cell proliferation and villus
cell migration in mice lacking Krüppel-like factor 9. Am J Physiol
Gastrointest Liver Physiol. 292:G1757–G1769. 2007.PubMed/NCBI
|
|
19.
|
Wang Y, Li X, Wang L, et al: An
alternative form of paraptosis like cell death, triggered by
TAJ/TROYand enhanced by PDCD5 overexpression. J Cell Sci.
117:1525–1532. 2004. View Article : Google Scholar : PubMed/NCBI
|
|
20.
|
Chen Y, Sun R, Han W, et al: Nuclear
translocation of PDCD5 (TFAR19): an early signal for apoptosis?
FEBS Lett. 509:191–196. 2001. View Article : Google Scholar : PubMed/NCBI
|
|
21.
|
Cantor AB and Orkin SH: Transcriptional
regulation of erythropoiesis: an affair involving multiple
partners. Oncogene. 21:3368–3376. 2002. View Article : Google Scholar : PubMed/NCBI
|
|
22.
|
Lavallée G, Andelfinger G, Nadeau M,
Lefebvre C, Nemer G, Horb ME and Nemer M: The Kruppel-like
transcription factor KLF13 is a novel regulator of heart
development. EMBO J. 25:5201–5213. 2006.PubMed/NCBI
|
|
23.
|
Selvin PR: The renaissance of fluorescence
resonance energy transfer. Nat Struct Biol. 7:730–734. 2000.
View Article : Google Scholar : PubMed/NCBI
|