Introduction
Prostate cancer is the most common male malignant
disease and the second leading cause of male cancer death in
developed countries (1). Although
current treatment strategies based on androgen ablation can produce
very effective initial results, the majority of cases relapse in
<2 years with a more aggressive hormone independent form
(2). Currently, there is no
curative treatment for androgen-independent prostate cancer.
Development of more effective treatment strategies, particularly
for androgen-independent cancer, relies on understanding further
the molecular mechanisms responsible for malignant progression.
Thus, identification of cancer-related genes and understanding how
these genes function inside cancer cells to promote or to suppress
tumorigenicity are important initial steps for either better
diagnosis or prognosis and for the identification of better
therapeutic targets in the future.
The gene C-FABP, also named FABP5,
PA-FABP and E-FABP, encodes a small cytosolic protein,
initially identified in skin (3).
When the gene C-FABP was first discovered to be
overexpressed in prostate cancer cells, it was demonstrated to
induce metastasis when rat benign R37 model cells were transfected
with its expression vector and transplanted into syngeneic rats
(4,5). Forced expression of C-FABP in the
weakly malignant prostate cancer cell line LNCaP, which did not
express C-FABP prior to transfection, exhibited
significantly increased tumorigenicity of gene-recipient cells both
in vitro and in vivo (6). Conversely, suppression of
C-FABP expression in the highly malignant prostate cancer
cell line PC3M reduced its tumorigenicity in vivo and in
vivo (7–9). However, molecular mechanisms involved
in its cancer-promoting activity are not fully understood. Since an
important activity of C-FABP is to bind and transport intracellular
fatty acids into cells (3), its
cancer-promoting activity may be related to its fatty acid-binding
function or to an alternative, hitherto undefined function. A
precedent for such a proposition is found in several different
roles of succinate dehydrogenase (10). Not only are fatty acids important
energy sources, they are also signalling molecules in their own
right (11,12) that may stimulate their nuclear
receptor PPARs which are ligand specific transcription factors
(13). Thus it was hypothesized
that the increased C-FABP may transport large amount of
intracellular fatty acids into cancer cells to activate their
nuclear peroxisome proliferative-activated receptors (PPARs) which
may then activate the downstream cancer-promoting genes (6,7).
PPARs are transcription factors that bind to DNA and regulate
transcription in a ligand-dependent manner (14,15).
PPARs consist of 3 main subtypes: PPARα (NR1C1), PPARβ (also called
PPARδ, NUC1 and FAAR) and PPARγ (NR1C3). PPARα is highly expressed
in tissues with a high rate of mitochondrial fatty acid oxidation,
such as liver, muscle, heart, kidney and cells of arterial walls
(16,17). PPARα regulates expression of the
genes involved in lipoprotein metabolism and thus raises the level
of apolipoprotein. PPARβ/δ is found in most tissues and is only
weakly activated by fatty acids (18). Recently, PPARβ/δ was shown to be
expressed in cancers of many different organs, including lung,
prostate, bladder, colon, breast, duodenum, thyroid and may play a
key role in their carcinogenesis (19). PPARγ which is highly expressed in
adipose tissues is a critical regulator of adipocyte
differentiation and is implicated in a variety of neoplastic
processes (20). PPARα is unlikely
to be related to the biological activity of C-FABP, since it is not
expressed in prostate (21). Thus
possible receptors receiving fatty acids delivered by C-FABP could
be either PPARβ/δ or PPARγ, or both of them.
To identify how the proposed C-FABP-PPAR axis
exerts cancer-promoting activity, we first assessed the expression
of C-FABP, PPARβ/δ and PPARγ in a series of benign and malignant
prostatic epithelial cell lines and in an archival set of
well-characterised benign and malignant prostate tissues. The
relationship between the increased expression of these three
proteins and the grade of malignancy within the tissues and patient
survival was assessed. The prognostic significance of these factors
(individually and jointly) on patient outcome was analysed and
compared with those factors currently in use.
Materials and methods
Cell lines and culture conditions
The following five human prostate epithelial cell
lines were used in this study: benign prostate epithelial cell line
PNT2 (22,23), weakly malignant cell line LNCaP
(24), highly malignant cell lines
DU145 (25), PC3 (26) and PC3M which was derived from the
most malignant metastatic population of PC3 (27). Cells were cultured and maintained
in RPMI-1640 medium (Invitrogen, Paisley, UK) supplemented with 10%
(v/v) FCS (Biosera, East Sussex, UK), penicillin (100 U/ml) and
stereptomycin (100 μg/ml) (Invitrogen). Sodium pyruvate (100
μg/ml) (Sigma, Grillingham, UK) was added into the culture
medium of LNCaP cells.
Tissue samples and patient data
Human prostate tissues, the same as those used in
our previous studies (28–31), were selected from an archival set
with follow-up data held in Department of Molecular and Clinical
Cancer Medicine (originally named Department of Pathology),
University of Liverpool, UK. Patients who were originally diagnosed
with prostate cancer, but who died from other causes were excluded.
Tissues were taken from 35 benign prostatic hyperplasia (BPH)
patients and from 97 prostate adenocarcinoma patients with an
average age of 67. 5 and 73 years, respectively. All patients
studied were treated by trans-urethral resection of the prostate
(TURP) in the Royal Liverpool University Hospital between 1995 and
2001. Since all tissue samples were kept anonymously and most of
the patients have passed away, our local NHS ethics committee
waived the need for consent. This study was approved by the
National Science Ethics Committee in accordance with the Medical
Research Council guidelines (project reference number: Ke; 02/019).
Specimens had been fixed in 10% (v/o) formalin and embedded in
paraffin wax. Cut histological sections were examined independently
by two qualified pathologists and classified as BPH and carcinomas
and further classified according to their combined Gleason scores
(GS) (32).
Western blotting
Levels of C-FABP, PPARβ/δ and PPARγ in prostate cell
lines was detected by western blot analysis using an ECL detection
system (29,33). The blot was first incubated with a
primary antibody, which was either anti-human C-FABP rabbit
polyclonal antibody (Hycolt Biotech; HP-9030; 1:500 dilution),
anti-PPARβ/δ rabbit polyclonal antibody (Thermo; A1-86845; 1:1,000
dilution) or anti-PPARγ rabbit polyclonal antibody (Santa Cruz;
SC-7196; 1:100 dilution), then incubated with secondary antibody,
swine anti-rabbit IgG (Dako; 1:10,000 dilution) conjugated with
horseradish peroxidase. Antibody-bound proteins were visualized by
exposure to Kodak XAR-5 film at room temperature. Sizes of the
bands were quantified by measuring the intensity of peak areas
using an Alpha Imager 2000 densitometer (Alpha Innotech, Cannock,
UK). The same blots were incubated with anti-β-actin antibody to
correct for possible loading discrepancies.
Histological and immunohistochemical
staining
Histological sections (4-μm) were cut from
formalin-fixed paraffin-embedded tissues (29,34),
incubated at 37°C overnight, deparaffinised with xylene and stained
with hematoxylin and eosin with an automated Varistain 24-4 machine
(Thermo Scientific, USA). For immunohistochemical staining, tissue
sections were deparaffinised and rehydrated in xylene and ethanol,
respectively and then incubated in methanol and hydrogen peroxide
(3% v/v) for 12 min before being washed (28). Immunohistochemical staining was
performed with the following commercial antibodies at the stated
dilution: anti-rabbit polyclonal antibody against C-FABP (HP-9030,
Hycolt Biotech, The Netherlands), 1:500; anti-goat polyclonal
antibody against PPARβ/δ (SC-1987, Santa Cruz Biotechnology Inc.;
Santa Cruz, CA, USA), 1:100; anti-goat polyclonal antibody against
PPARγ (SC-1984, Santa Cruz Biotechnology Inc.), 1:50; and
monoclonal anti-human antibody against androgen receptor (AR) (Dako
Ltd., Ely, UK), 1:100. Sections were incubated with C-FABP antibody
and AR antibody at room temperature for 1 h and with PPARβ/δ and
PPARγ antibodies in a humid chamber at 4°C overnight. Sections were
then incubated with a rabbit anti-goat IgG linker (Vector
Laboratories, Burlingame, CA, USA) for 30 min. Bound antibodies
were detected by incubation with 200 μl of EnVision FLEX/HRP
(Dakocytomation, Ely, UK) for 30 min and visualized with DAB
(3-3′-diamonobenzidine) for 10 min. All sections were
counterstained with hematoxylin and mounted with dibutyl phthalate
xylene (DPX). One prostate cancer with GS 10, a benign colon tissue
and an oral squamous epithelium were used as a positive control for
C-FABP, PPARβ/δ, PPARγ antibodies, respectively.
Scoring immunoreactivity
Evaluation of C-FABP, AR, PPARβ/δ and PPARγ
immunoreactivity was performed in high power fields (×400) using a
standard light microscope. Cytoplasmic and nuclear
immunoreactivities were independently reviewed by two separate
observers. Cytoplasmic staining was classified into 4 categories
according to the intensities: unstained, weakly, moderately and
strongly stained which were expressed as 0 (−), 1 (+), 2 (++) and 3
(+++), respectively. Nuclear staining was first assessed by the
number of stained nuclei to obtain a percentage score which was 1
(≤30), 2 (31–60), or 3 (≥61); then by the intensity of staining to
obtain an intensity score which was 1 (+), 2 (++), or 3 (+++). The
staining index or final scores for nuclear staining was obtained by
multiplying the percentage score and intensity score. The final
nuclear stains, which scored from 1 to 9, were further classified
into 3 groups: weakly positive (1–3),
moderately positive (4–6) and strongly positive (7–9), as
described previously (35). The
differences in scoring categories between 2 observers were <5%
of the samples.
Statistical analysis
Statistical analysis was performed using the
Statistical Package for Social Sciences (SPSS), version 20 (SPSS
Inc., Chicago, IL, USA). Correlation between PPARβ/δ and PPARγ,
C-FABP and AR expression and the nature of prostate tissue (benign
or malignant) were assessed by 2-sided Fisher’s exact test and
χ2 analysis. Correlation between survival and expression
of individual factors was plotted as Kaplan-Meier survival curves
and significance of their difference was analysed by log-rank test.
Cox’s multiple regression was used for analysis of the effect of
multiple factors on patient survival. In all statistical analyses,
results were regarded as significant when p<0.05.
Results
Detection of PPARβ/δ, PPARγ and C-FABPin
prostatic cell lines
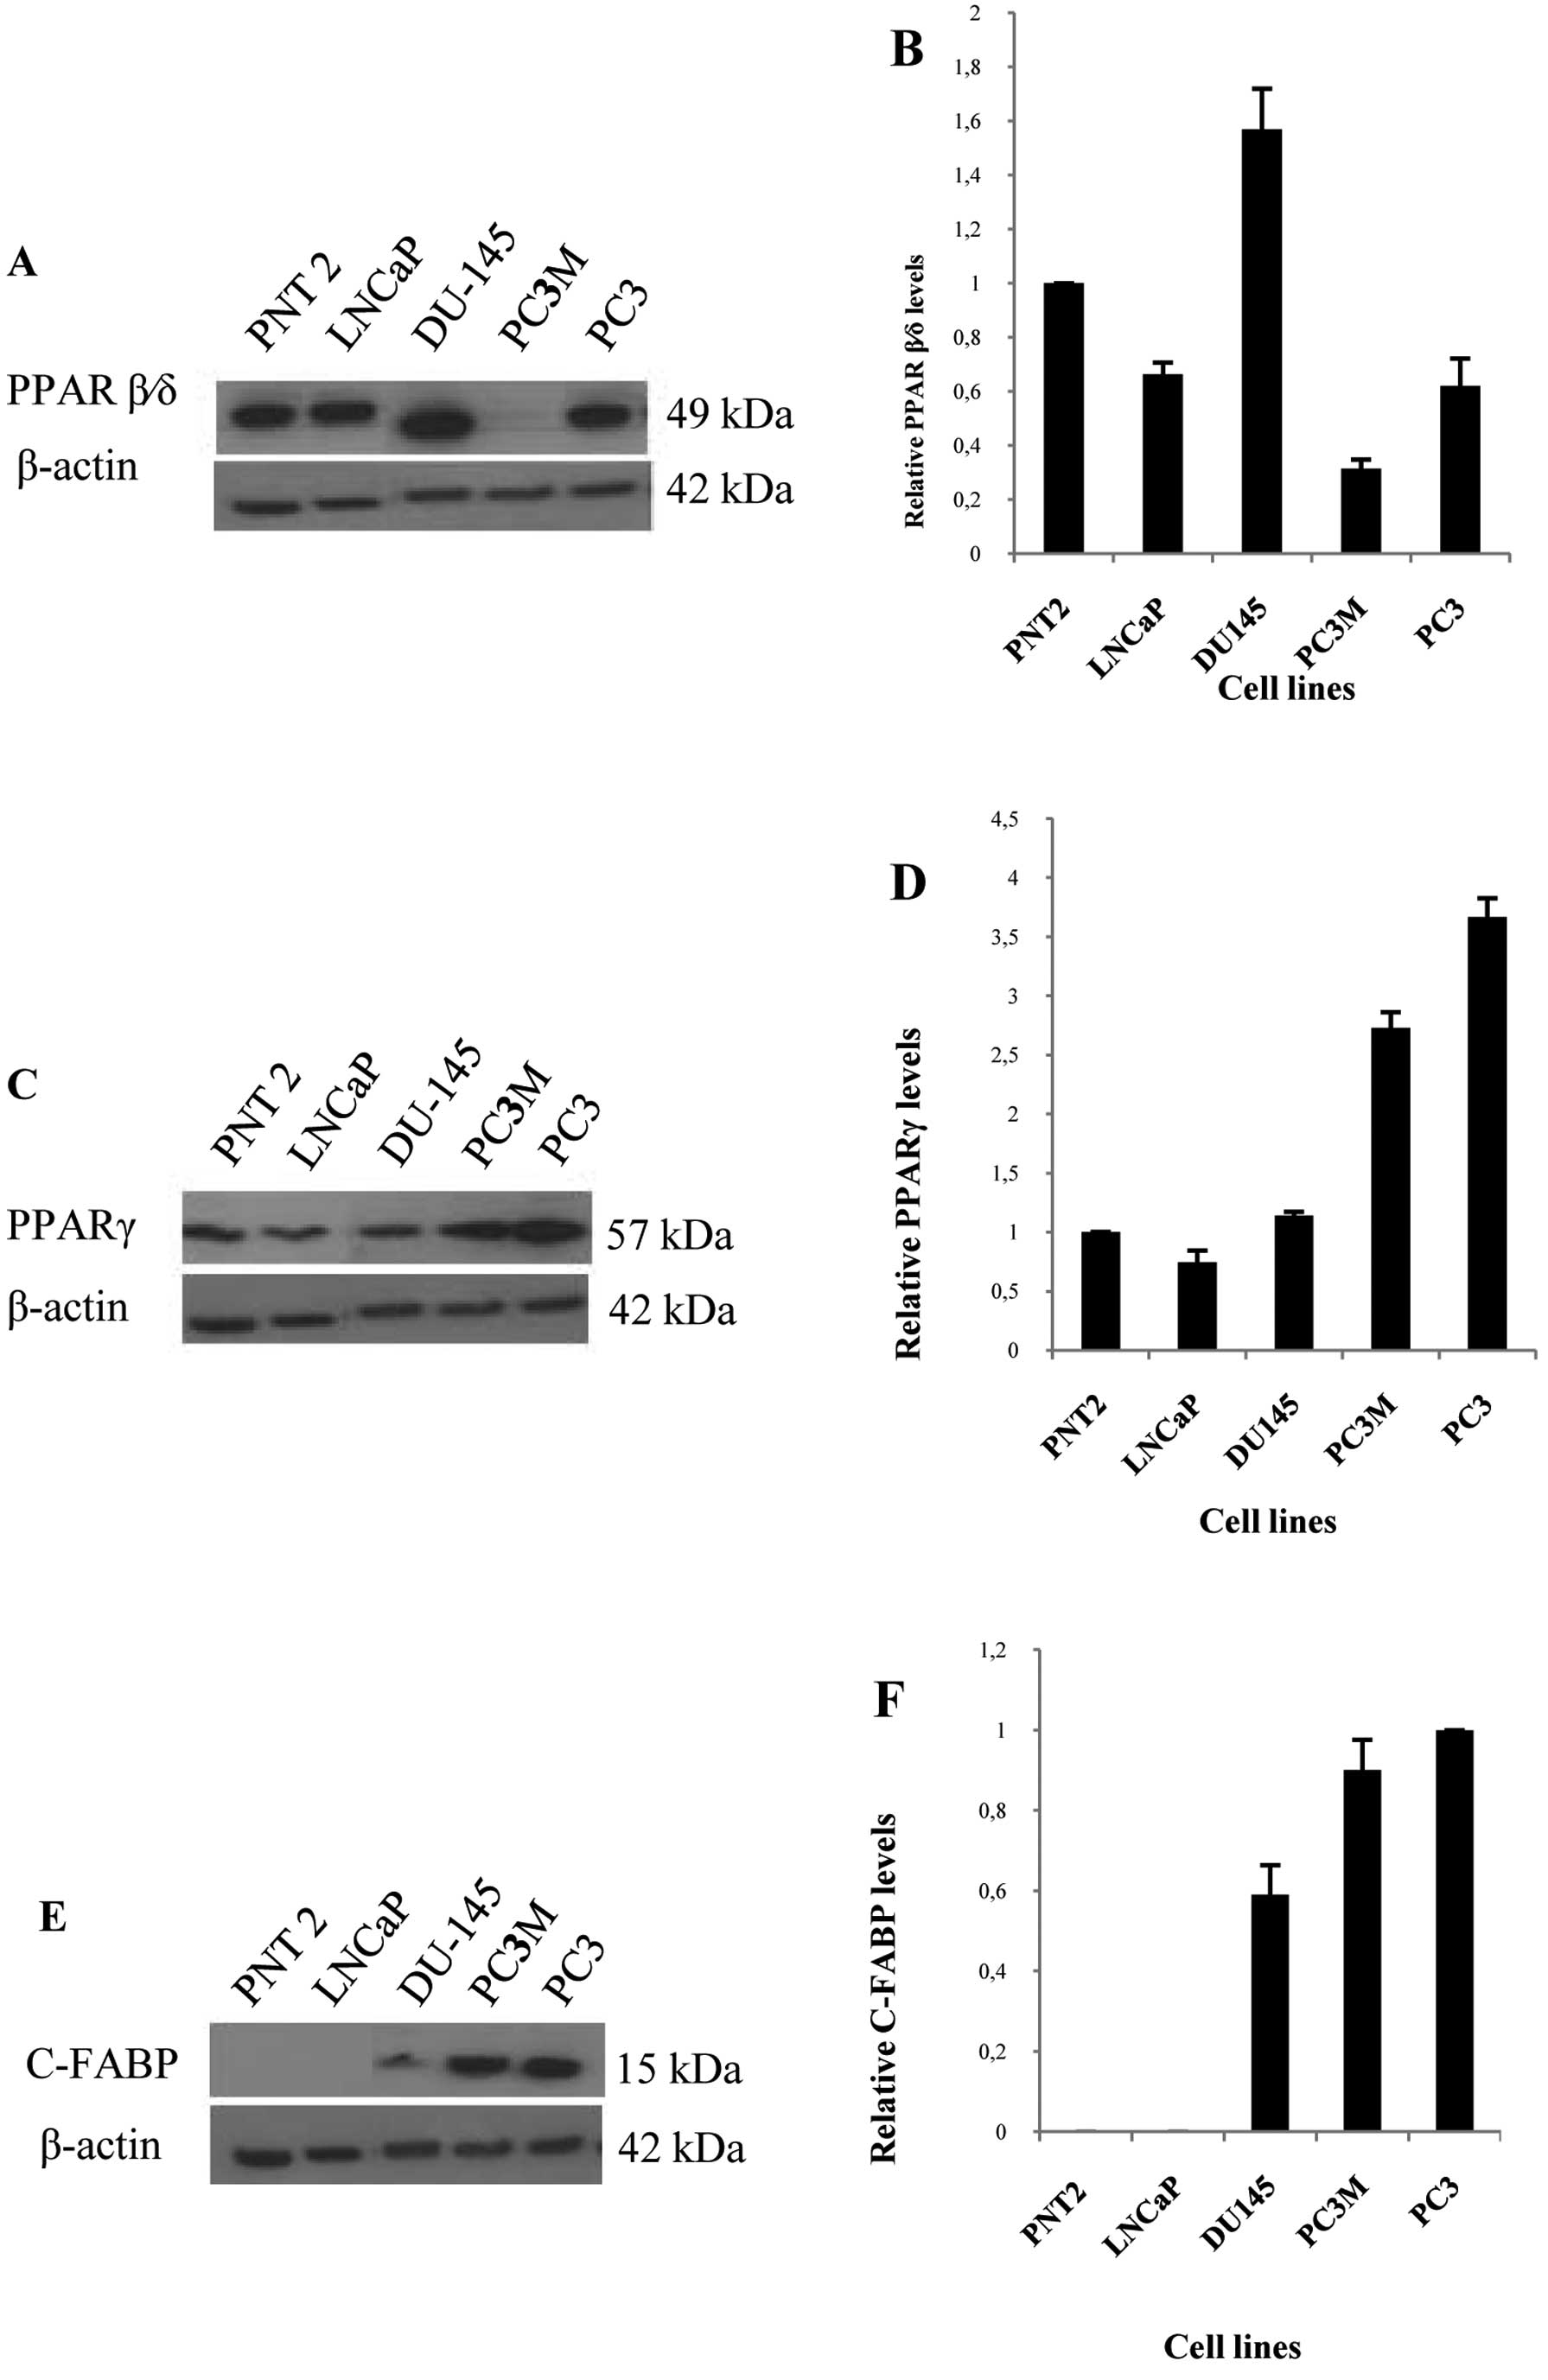
Western blots showed that a single PPARβ/δ band of
52 kDa was detected in benign PNT2 cells, weakly malignant LNCaP
cells, and highly malignant PC3 and DU145 cells, but was barely
detectable in the highly malignant PC3M cells (Fig. 1A). A single PPARγ band of 57 kDa
was detected in all 5 cell lines (Fig.
1C). In contrast C-FABP expression was not detected in benign
PNT2 and weakly malignant LNCaP cells, but a strong 15 kDa C-FABP
band was detected in highly malignant cell lines DU145, PC3M and
PC3 cells (Fig. 1E). When the
densitometric level of PPARβ/δ in PNT2 was set at 1 (Fig. 1B), the level in weakly malignant
LNCaP cells was 0.66±0.04; levels in highly malignant DU145, PC3M
and PC3 cells were 1.57±0.15, 0.31±0.03 and 0.61±0.1, respectively.
The changes in levels of PPARβ/δ did not appear to be related to
changes in malignant characteristics. However, a very different
pattern was observed in PPARγ levels in these cell lines. When the
level of PPARγ in PNT2 was set at 1 (Fig. 1D), the level in weakly malignant
LNCaP cells was 0.74±0.09; levels in highly malignant DU145, PC3M
and PC3 cells were 1.14±0.16, 2.73±0.28 and 3.66±0.23,
respectively. Thus the level of PPARγ increased with increasing
malignancy in these prostatic cells. A similar pattern of C-FABP
expression was detected. When the level of C-FABP in PC3 was set at
1 (Fig. 1F), levels expressed in
other malignant PC3M and DU145 were reduced to 0.9±0.07 and
0.59±0.07, respectively. In contrast levels in the benign PNT2 and
weakly malignant LNCaP cells were not detectable.
Detection of PPARβ/δ, PPARγ and C-FABP in
prostate tissues
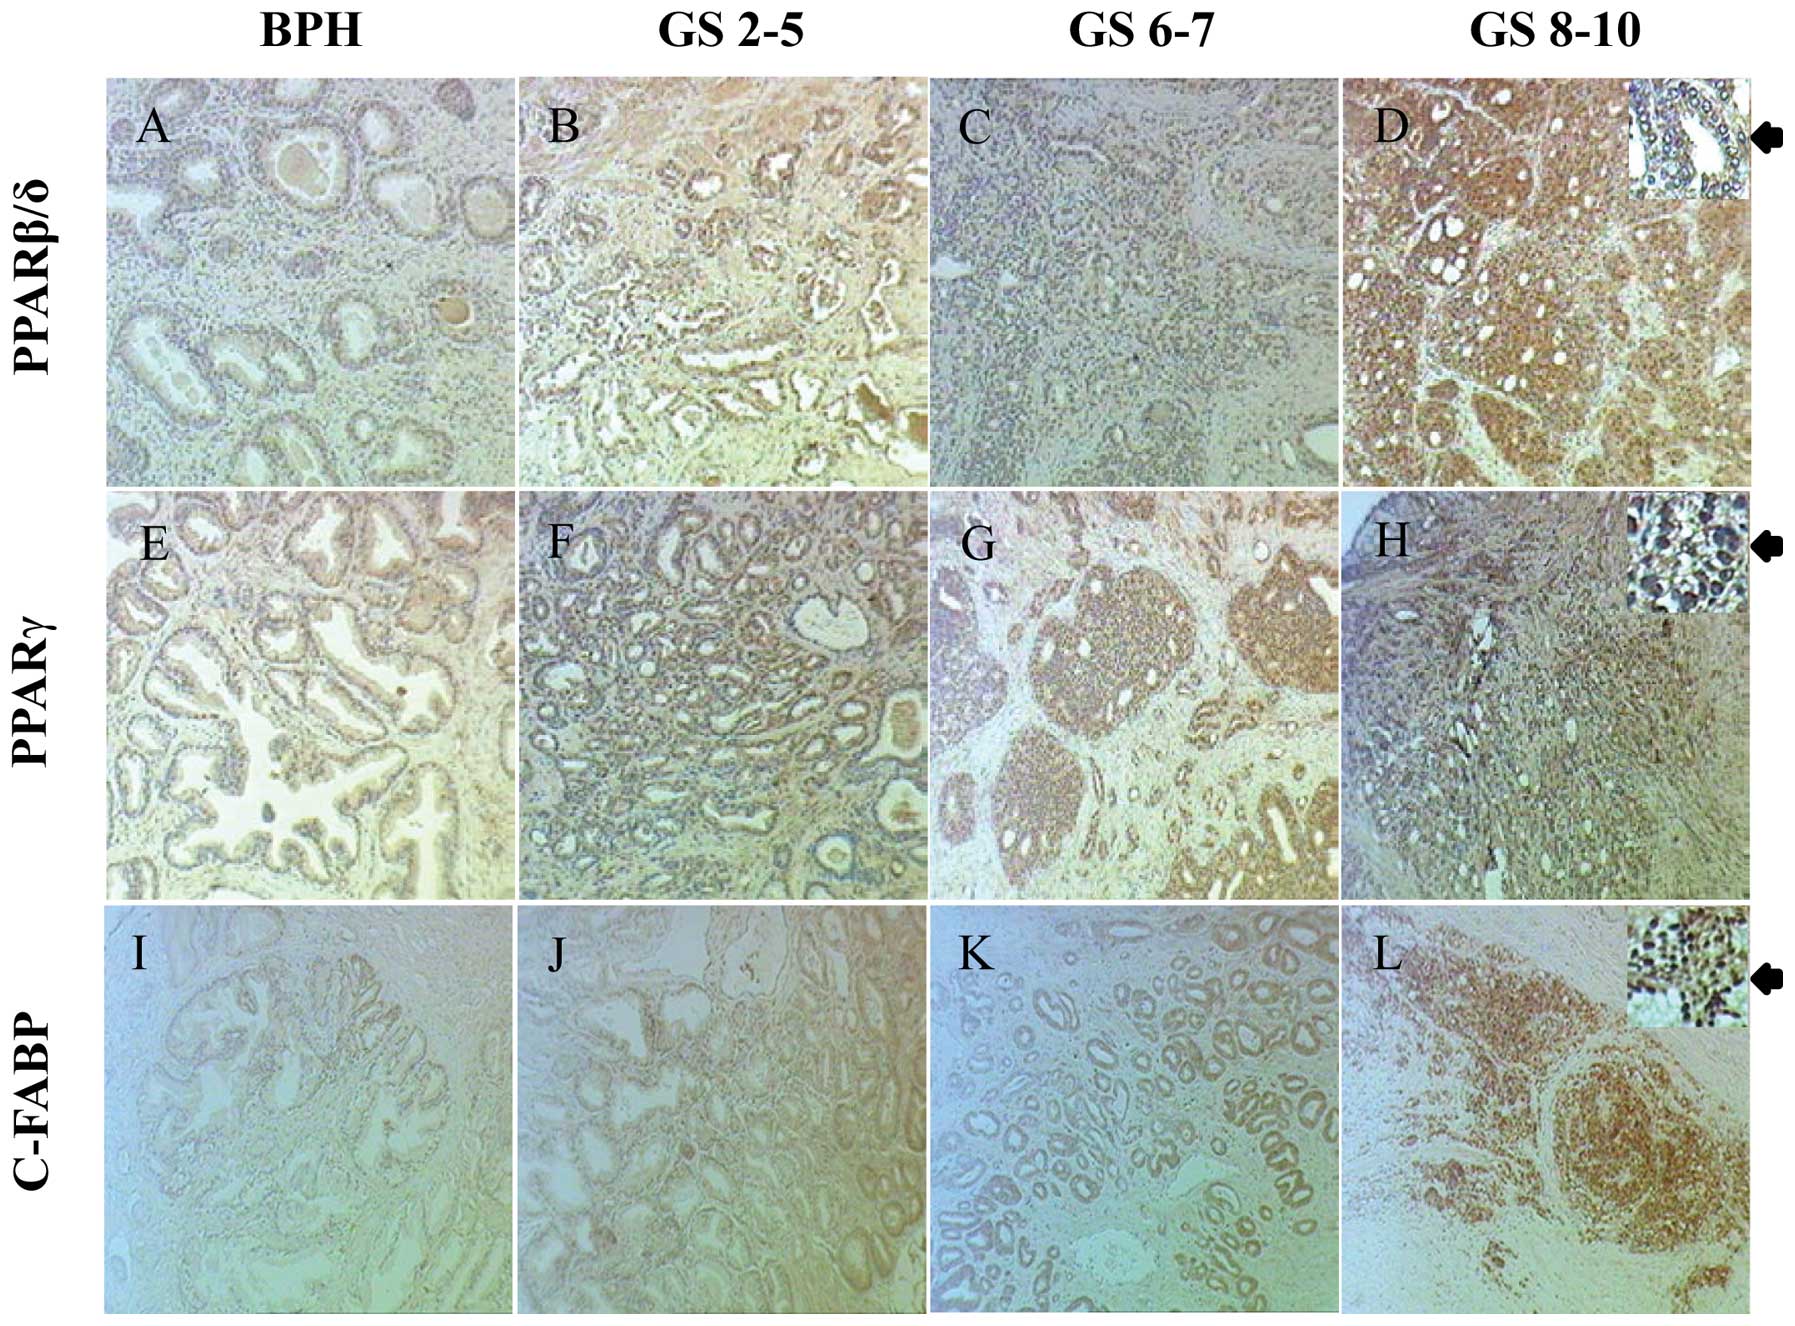
Staining for PPARβ/δ in BPH and carcinomas was
detected in both cytoplasm and nucleus (Fig. 2AD) (Table IA). Among 32 stained BPH cases, 28
(88%) were stained weakly and 4 (12%) moderately positive in both
cytoplasm and nucleus (Fig. 2A).
Among 94 stained adenocarcinoma cases, both cytoplasmic and nuclear
staining was observed. Cytoplasmic staining was weak in 32 (34%),
moderate in 50 (53%) and strong in 12 (13%) cases and in the
nucleus, staining was weak in 13 (14%), moderate in 65 (69%) and
strong in 16 (17%) cases (Fig.
2B–D). The levels of both cytoplasmic (χ2 test,
p<0.001) and nuclear (χ2 test, p<0.001) staining
for PPARβ/δ were significantly higher in carcinomas than those in
BPH (Table IA).
 | Table I.Cytoplasmic and nuclear expression of
different PPARs in benign and malignant prostate tissues. |
Table I.
Cytoplasmic and nuclear expression of
different PPARs in benign and malignant prostate tissues.
A, PPAR β/δ stain
|
Cytoplasmic stain
intensities
| No. of cases | Nuclear stain
intensity and percentage score
|
| Tissues | + | ++ | +++ | ≤3 | 4–6 | ≥7 |
|
| BPH | 28 | 4 | 0 | 32a | 28 | 4 | 0 |
| Carcinomas
(total) | 32 | 50 | 12 | 94a | 13 | 65 | 16 |
| Scoresb ≤5 | 6 | 6 | 2 | 14 | 4 | 9 | 3 |
| Scoresb 6–7 | 12 | 18 | 5 | 35 | 5 | 25 | 5 |
| Scoresb 8–10 | 14 | 26 | 5 | 45 | 6 | 31 | 8 |
|
B, PPARγ stain
|
Cytoplasmic stain
intensities
| No. of cases | Nuclear stain
intensity and percentage score
|
| Tissues | + | ++ | +++ | ≤3 | 4–6 | ≥7 |
|
| BPH | 31 | 1 | 0 | 32a | 30 | 2 | 0 |
| Carcinomas
(total) | 35 | 45 | 10 | 90a | 12 | 57 | 21 |
| Scoresb ≤5 | 5 | 7 | 1 | 13 | 4 | 8 | 1 |
| Scoresb 6–7 | 13 | 18 | 3 | 34 | 4 | 21 | 9 |
| Scoresb 8–10 | 17 | 20 | 6 | 43 | 4 | 28 | 11 |
Staining for PPARγ was detected in both cytoplasm
and nucleus of cells in BPH and carcinoma tissues (Fig. 2E–H and Table IB). In 32 analysed BPH samples, 31
(97%) stained weakly and 1 (3%) stained moderately in the
cytoplasm; 30 (94%) stained weakly and 2 (6%) stained moderately in
the nucleus (Fig. 2E). Among a
total of 90 stained carcinomas, 35 (39%) stained weakly, 45 (50%)
stained moderately and 10 (11%) stained strongly in the cytoplasm;
12 (13%) stained weakly, 57 (63%) stained moderately and 21 (24%)
stained strongly in the nucleus (Fig.
2F–H). Staining for PPARγ in both cytoplasm (χ2
test, p<0.001) and nucleus (χ2 test, p<0.001) of
carcinomas was significantly higher than those in BPH (Table IB).
Immunohistochemical staining for C-FABP was observed
in both cytoplasm and nucleus of BPH and carcinoma cells (Fig. 2I–L) (Table II). Among 35 BPH cases, 33 (94%)
were unstained and 2 (6%) stained weakly in the cytoplasm. In the
nucleus, 25 (71%) were unstained, 7 (20%) stained weakly, 5 (14%)
stained moderately and 3 (8%) stained strongly (Fig. 2I). Among 97 analysed
adenocarcinomas, cytoplasmic and nuclear staining was observed in
94 (96%) and 88 (91%) of cases, respectively (Fig. 2J–L). Cytoplasmic staining was weak
in 23 (24%), moderate in 54 (56%) and strong in 17 (18%) cases. In
the nucleus, 20 (21%) cases stained weakly, 32 (33%) moderately and
36 (37%) strongly. Intensities of both cytoplasmic (χ2
test, p<0.001) and nuclear (χ2 test, p<0.001)
staining for C-FABP were significantly higher in carcinomas than
those in BPH (Table II).
| Table II.C-FABP cytoplasmic and nuclear
expression in benign and malignant prostate tissues. |
Table II.
C-FABP cytoplasmic and nuclear
expression in benign and malignant prostate tissues.
Cytoplasmic stain
intensities
| No. of cases | Nuclear stain
intensity and percentage score
|
|---|
| Tissues | 0 | + | ++ | +++ | 0 | + | ++ | +++ |
|---|
| BPH | 33 | 2 | 0 | 0 | 35 | 25 | 7 | 5 | 3 |
| Carcinomas
(total) | 3 | 23 | 54 | 17 | 97 | 9 | 20 | 32 | 36 |
| Scoresa ≤5 | 2 | 8 | 5 | 1 | 16 | 2 | 6 | 4 | 4 |
| Scoresa 6–7 | 0 | 12 | 17 | 8 | 37 | 4 | 7 | 12 | 14 |
| Scoresa 8–10 | 1 | 3 | 32 | 8 | 44 | 3 | 7 | 16 | 18 |
Correlations between C-FABP, PPARβ/δ,
PPARγ and GS
When the relationship among the staining levels for
PPARβ/δ, PPARγ and C-FABP in carcinomas was assessed, that
increased levels of PPARβ/δ in both cytoplasm and nucleus were not
significantly correlated with either staining for PPARγ or C-FABP
(Fisher’s exact test, p>0.05), although cytoplasmic staining for
PPARβ/δ was significantly correlated with its nuclear levels
(χ2 test, p<0.001). The increased cytoplasmic level
of PPARγ was positively correlated with that in the nucleus
(χ2 test, p<0.001), and similarly for staining for
C-FABP (χ2 test, p<0.05). While increased nuclear
staining for C-FABP was significantly correlated with increased
nuclear staining for PPARγ (Fisher’s exact test, p<0.05),
increased cytoplamic staining for C-FABP was not significantly
correlated with cytoplasmic staining for PPARγ (χ2 test,
p>0.05). Interestingly, the increased cytoplasmic staining for
C-FABP was significantly correlated with nuclear staining for PPARγ
(Fisher’s exact test, p<0.05), whereas the increased cytoplasmic
staining for PPARγ was not significantly correlated with nuclear
staining for C-FABP (χ2 test, p>0.05). To correlate
the staining for PPARβ/δ and GS, carcinomas were divided into low
(≤5), moderate (6–7) and high (8–10) GS
groups. Neither nuclear (χ2 test, p>0.05) nor
cytoplasmic (χ2 test, p>0.05) staining for PPARβ/δ
was significantly correlated with increased GS in these cases. When
staining for PPARγ was assessed in a similar way, increased nuclear
staining for PPARγ was significantly correlated with the increased
GS of the carcinomas (Fisher’s exact test, p=0.05), but the
correlation between its cytoplasm staining and the increased GS was
not significant (Fisher’s exact test, p>0.05). When correlation
between staining for C-FABP and GS was assessed, increased
cytoplasmic staining for C-FABP was significantly correlated with
the increased GS of the carcinomas (χ2 test, p<0.05),
but the correlation between its increased nuclear staining and
increased GS was not significant (χ2 test,
p>0.05).
PPARβ/δ, PPARγ, C-FABP and patient
survival
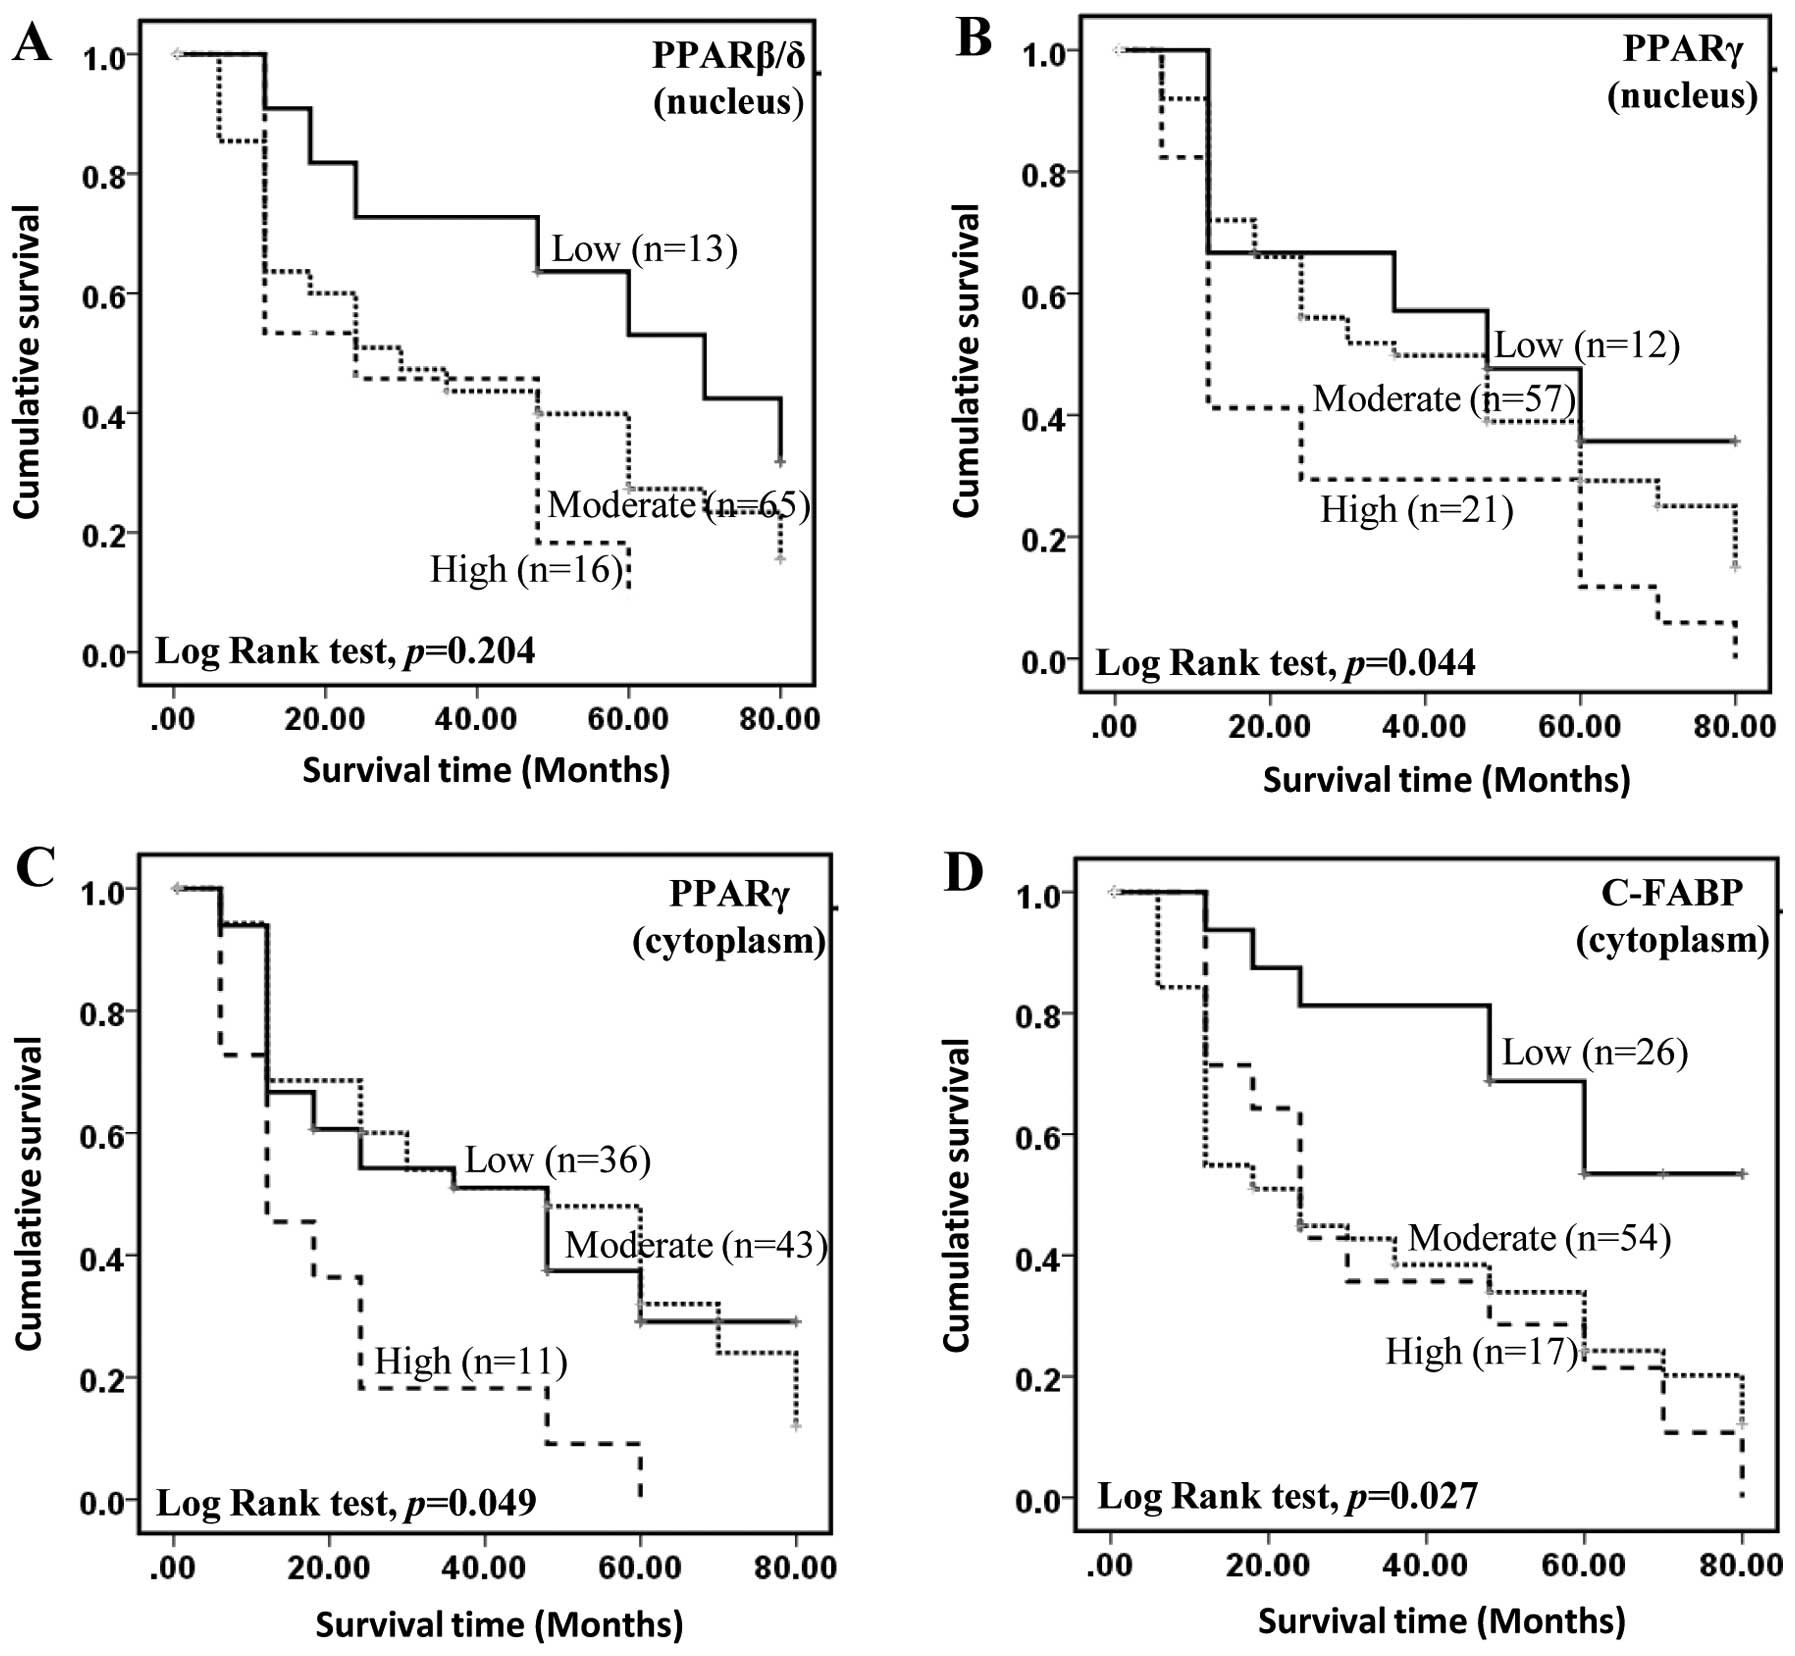
The level of PPARβ/δ, PPARγ or C-FABP and the
duration of patients’ overall survival time (the length of survival
time from initial diagnosis) was plotted using Kaplan-Meier
survival curves and the significance of the differences was
assessed by log-rank test (Fig.
3). For patients with a strongly positive nuclear staining for
PPARβ/δ, the median survival time was 24 months (Fig. 3A). Although this was shorter than
30 and 70 months which were the median survival times for
moderately and weakly stained cases, respectively, correlation
between the level of staining for nuclear and cytoplasmic (data not
shown) PPARβ/δ and patient survival time was not significant
(log-rank test p≥0.204). When the correlation between nuclear
staining for PPARγ (Fig. 3B) and
patient survival was assessed, the median survival time for the
patients with weak nuclear staining was 48 months, this was reduced
to 36 months (log-rank test p= 0.422) and significantly reduced to
12 months (log-rank test p=0.035) for patients with moderate and
strong staining, respectively. Overall, nuclear staining for PPARγ
was significantly associated with patient survival (log-rank test
p=0.044). For cytoplasmic staining for PPARγ, although the median
survival time for the cases with low staining (48 months) was not
significantly (log-rank test p=0.995) different from those cases
with moderate staining (48 months), it was significantly (log-rank
test p=0.010) reduced to 12 months for cases with strong staining.
Similar to nuclear staining for PPARγ, overall reduced survival
time was significantly associated with the increased cytoplasmic
staining for PPARγ (Fig. 3C)
(log-rank test, p=0.049). For the patients with both strong and
moderate staining for cytoplasmic C-FABP, the median survival time
was 24 months, this was significantly shorter than that of 80
months for patients with weak staining and those unstained
(log-rank test, p=0.002) (Fig.
3D). While increased cytoplasmic staining for C-FABP was
significantly associated with a reduced patient survival time
(log-rank test, p=0.027) (Fig.
3D), no significant correlation between nuclear C-FABP levels
and patient survival time was observed (data not shown).
Patient survival and Gleason scores,
androgen receptor and PSA
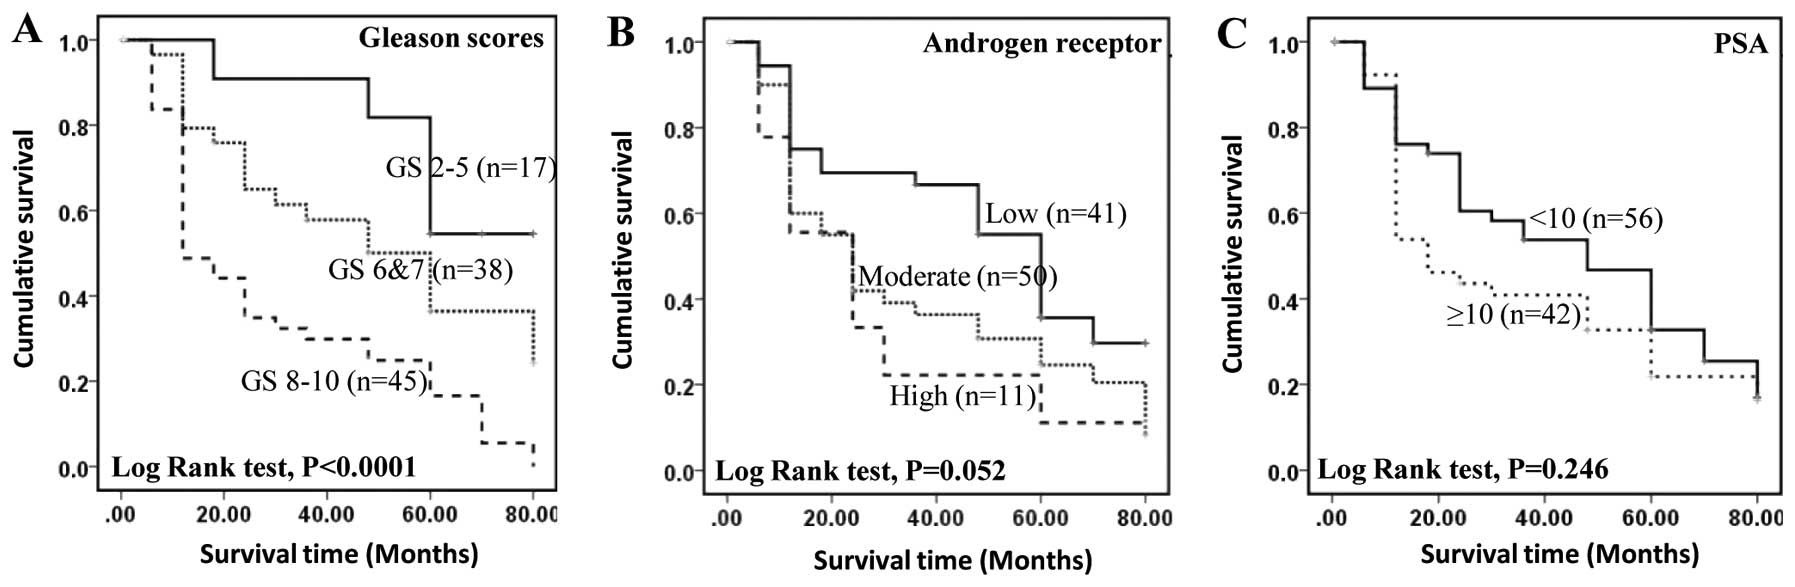
To assess the relationship between the GS and
patient survival, 97 carcinoma cases were divided into three
groups: weakly malignant with GS ≤5, moderately malignant with GS
6–7 and highly malignant with GS 8–10. The median survival time of
patient with highly, moderately and weakly malignant carcinomas was
12, 60 and 80 months, respectively. The increased GS was
significantly (log-rank test p=0.0001) associated with reduced
survival time (Fig. 4A). The
correlation between patient survival time and staining for AR
showed that the median survival time for patients with weak,
moderate and strong staining was 60, 24 and 24 months,
respectively. Overall survival time was not significantly reduced
by the increased staining for AR (log-rank test, p=0.052) (Fig. 4B). The correlation between patient
survival and blood PSA showed that the median survival time for
patients with low (<10 ng/ml) and high (≥10) levels of PSA was
48 and 18 months, respectively (Fig.
4C) but the difference was not statistically significant
(log-rank test, p=0.246).
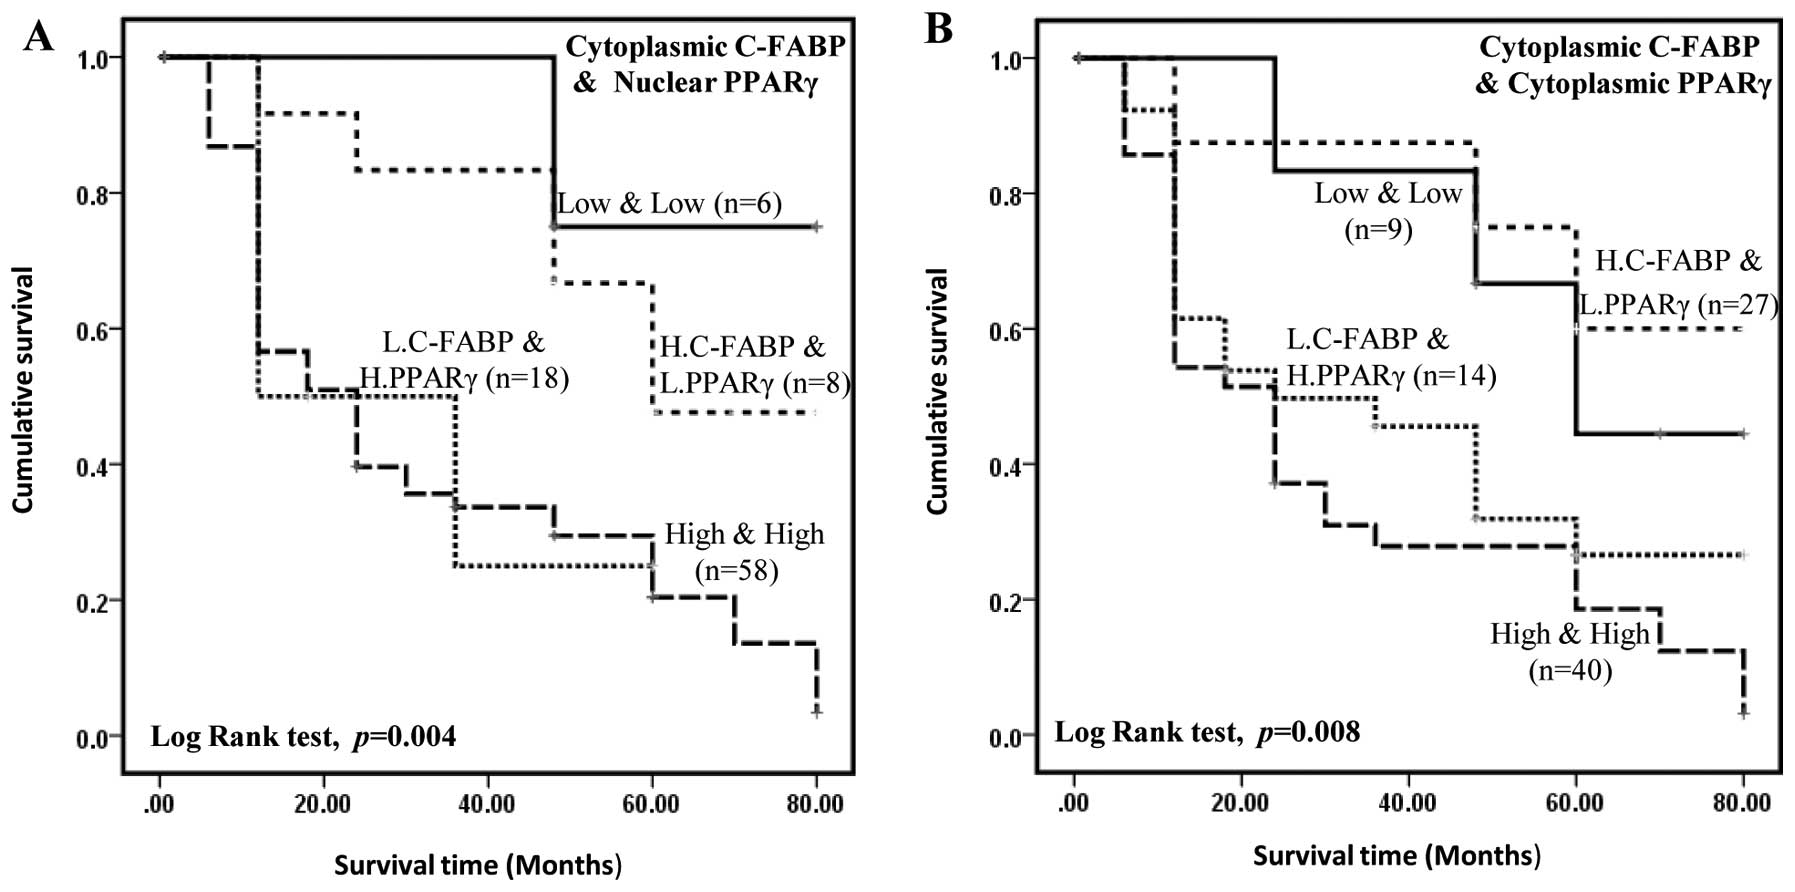
Inter-relationship of C-FABP and PPARγ in
predicting patient survival
To assess the possible effect of staining for C-FABP
and PPARγ of both cytoplasm and nucleus in associated with patient
survival, 90 carcinoma cases were divided into 4 groups: low
C-FABP, low PPARγ; low C-FABP, high PPARγ; high C-FABP, low PPARγ;
and high C-FABP, high PPARγ. For cytoplasmic C-FABP and nuclear
PPARγ, Kaplan-Meier plot (Fig. 5A)
show that the median survival time for patients with high C-FABP,
high PPARγ or high C-FABP, low PPARγ levels (33 and 30 months,
respectively) were significantly shorter than whose had low C-FABP,
low PPARγ or low C-FABP, high PPARγ levels (60 and 72 months,
respectively). Similar results were obtained when dividing up the
carcinomas into cytoplasmic staining for C-FABP and cytoplasmic
staining for PPARγ. Kaplan-Meier plot (Fig. 5B) show that the median survival
time for the patient with high C-FABP, high PPARγ or high C-FABP,
low PPARγ levels (31 and 39 months, respectively) were
significantly shorter than whose had low C-FABP, low PPARγ or low
C-FABP, high PPARγ levels (64 and 60 months, respectively). When
subjected to Cox’s multivariate regression analysis (Table III), staining for cytoplasmic
C-FABP still showed a significant association with patient survival
(p=0.048), but increased staining for PPARγ in the nucleus was not
significantly independently associated with clinical survival (p=
0.143). Similar results were obtained when analysing cytoplasmic
staining for C-FABP and cytoplasmic staining for PPARγ in relation
to patient survival (p= 0.362). Overall these results show that the
significant association of staining for PPARγ with patient survival
was confounded by that for staining for C-FABP when tested
together. These results suggest that although staining for
cytoplasmic C-FABP can be considered as an independent prognostic
marker in prostate cancer that for nuclear staining for PPARγ is
dependent on staining for cytoplasmic C-FABP. When nuclear staining
of C-FABP and nuclear staining of PPARγ was analysed (data not
shown), high level of C-FABP and high level of PPARγ was not
significantly associated with shorter survival of the patients
(log-rank test, p= 0.195).
| Table III.Results of multiple Cox regression
test between levels of C-FABP, PPARs and patient survival. |
Table III.
Results of multiple Cox regression
test between levels of C-FABP, PPARs and patient survival.
| Univariate analysis
(log-rank test) | Multivariate
analysis (Cox regression test) |
|---|
| C-FABP
(cytoplasm) | p=0.027 | p=0.048 |
| PPARγ
(nucleus) | p=0.044 | p=0.143 |
| PPARγ
(cytoplasm) | p=0.059 | p=0.362 |
| PPARβ/δ
(nucleus) | p=0.204 | - |
Discussion
C-FABP is a 15-kDa cytosolic protein that belongs to
the fatty acid binding protein family (3) and binds to long chain fatty acids
with high affinity. In addition to skin, C-FABP is detected in
endothelial cells of placenta, heart, skeletal muscle, small
intestine, renal medulla and in Clara and goblet cells of lung
(36). Apart from prostate cancer,
C-FABP has been implicated in malignancies of bladder and
pancreas (37–39) and its expression is associated with
poor survival in breast cancer (40) and glioblastoma (41). Thus it is possible that large
amount of fatty acids transported by elevated levels of C-FABP may
generate enhanced signals through their PPAR receptors to cause a
chain of molecular events leading to increased activities of
cancer-promoting genes and thereby enhance malignant progression
(6,42).
There are three nuclear PPARs (PPARα, PPARβ/δ and
PPARγ) that could act as fatty acid receptors (42). Since PPARα is not expressed in
prostate (18, 21), it is unlikely to be involved with
C-FABP in prostate cancer. Although our data showed that PPARβ/δ is
expressed in cultured prostate cells, its level was not
demonstrably different between benign and malignant cell lines.
However, expression of PPARβ/δ in tissue samples appeared to be
different from that in the cell lines. While staining for PPARβ/δ
was detected in BPH and carcinoma cases, levels detected in
malignant tissues were significantly higher than those in BPH
(Table IA). These results suggest
that expression of PPARβ/δ in cultured cell lines measured by
western blot analysis may not reflect the levels in human tissues
measured by immunohistochemical staining. However, increased
nuclear staining for PPARβ/δ was not significantly correlated with
increased cytoplasmic staining for C-FABP, indicating that elevated
PPARβ/δ may not be directly related to C-FABP and hence fatty acid
stimulation in prostate cancer cells.
In contrast to the other PPARs, the levels for
PPARγ, its patterns of expression in cell lines measured by western
blot analysis and in tissues measured by immunohistochemistry were
very similar to those of C-FABP. Thus the levels of C-FABP and
PPARγ in malignant cells were significantly higher than those in
benign PNT2 cells and elevated levels of PPARγ and C-FABP were
associated with increasing malignancy of the prostatic cancer cells
(Fig. 1C and E). Similarly in
immunohistochemical analysis, the staining levels for PPARγ and
C-FABP were significantly higher in carcinomas than in BPH and the
enhanced staining levels in the carcinomas were significantly
associated with GS (χ2 test, p<0.001). Furthermore,
increased cytoplasmic staining for C-FABP was significantly
correlated with increased nuclear staining for PPARγ in the
carcinomas. These findings are in line with our separate work, in
which we found that C-FABP acted with PPARγ in a coordinated manner
to promote malignant progression in prostatic cancer cells
(6) and hence, PPARγ is more
likely to be the receptor for the fatty acids transported by C-FABP
than PPARβ/δ. PPARγ and PPARγ ligands inhibit growth and produce
terminal differentiation of the human tumor cells (43). PPARγ expression is significant in
predicting the outcome of breast carcinomas and is correlated with
ER-α status (44,45). PPARγ was found to induce VEGF in
colorectal tumor cells (46,47).
Thus it was suggested that C-FABP, together with fatty acids, PPARγ
and VEGF should be considered as key factors in a proposed fatty
acid signaling pathway that promotes metastasis of prostatic cancer
cells (6,11). Therefore, the C-FABP-PPARγ axis may
be a novel therapeutic target for prostatic cancer.
In prostate cancer management, a major problem is
the lack of reliable biomarkers to predict the aggressiveness or
potential therapeutic response of an individual prostate cancer.
Results in this work suggested that AR (Fig. 4B) and PSA (Fig. 4C) are not significant prognostic
markers in our patient group although the number of patients is
relatively small. It is also suggested that PSA, the most commonly
employed biomarker cannot be used to predict patient outcomes, as
previously suggested to be unreliable (48). Our current data show that increased
levels of nuclear PPARγ and cytoplasmic C-FABP (Tables IB and II) are significantly correlated with GS
(Fisher’s exact test, p<0.05) and significantly associated with
reduced survival time (log-rank test, p<0.05). These findings
suggest that increased levels of nuclear PPARγ and cytoplasmic
C-FABP may be alternative objective biomarkers for reduced cellular
differentiation (GS), as well as reliable prognostic factors to
predict patient survival. Multivariate survival analysis revealed
that conjoined cytoplasmic C-FABP and nuclear PPARγ expression may,
together, have better prognostic value than when these parameters
are used separately. In contrast, no correlation was found between
cytoplasmic or nuclear levels of PPARβ/δ and patient survival
(Fig. 3A). Increased levels of
PPARβ/δ were not significantly associated with increased Gleason
scores (Fisher’s exact test, p>0.05). Therefore, PPARβ/δ was not
considered a suitable biomarker to assess the degree of malignancy
of a prostate cancer or a marker that would predict patient
outcome.
Our results also showed that the level of staining
for PPARγ in the cytoplasm was also increased. Although this
increase was not correlated with an increased GS, it was
significantly associated with a shorter survival time of patients.
While the increase of C-FABP in the cytoplasm is significantly
associated with GS or patient survival, the increased nuclear
C-FABP is not significantly associated with either factor. This
suggests that transporting fatty acids to PPARγ through C-FABP may
be a short delivery process, after which C-FABP may return to the
cytoplasm, rather than staying on the nuclear membrane. More study
is therefore needed to find out exactly how the fatty acids are
delivered to PPARγ by C-FABP.
As a steroid hormone receptor, activated PPARγ
should be theoretically localized in the nuclear membrane. However,
many previous studies revealed that the cellular distribution of
PPARγ was predominantly cytoplasmic in a number of cancer types
(49–52). The reason for the cytoplasmic
staining for PPARγ is not known and current opinions on this are
inconsistent (53,54). In line with a previous study
(55), results in this work showed
that the level of PPARγ expressed in the cytoplasm of prostatic
carcinoma cells is significantly higher than that in BPH.
Furthermore, for cytoplasmic staining, the median survival times
for patients with high PPARγ plus low C-FABP, or high C-FABP plus
high PPARγ levels were significantly shorter than those who had low
C-FABP plus low PPARγ or low C-FABP plus high PPARγ levels
(Fig. 5A). More study is needed to
understand the biological significance of the increase in
cytoplasmic PPARγ and its interaction with C-FABP in prostate
cancer cells.
This study has extended our previous work to show
that co-operation between C-FABP and PPARγ may provide a novel
mechanism responsible, in part, for promoting the malignant
behavior of human prostate cancer cells and thus supporting our
original hypothesis (6,8,56).
Such a mechanism would provide a novel opportunity for developing
new therapeutic approaches to regulate the malignant phenotype and
to switch prostatic cancer cells from an aggressive to indolent
behavior, as previously proposed (57,58).
Acknowledgements
This study was supported by a research
project grant from North West Cancer Research. The authors would
like to thank Mrs. Carol Beesley, Mrs. Sharon Forest, Mr. Timothy
Dickinson, Mrs. Patricia Gerard and Mr. Andrew Dodson for their
expert help and support.
References
|
1.
|
Ferlay J, Parkin DM and Steliarova-Foucher
E: Estimates of cancer incidence and mortality in Europe in 2008.
Eur J Cancer. 46:765–781. 2010. View Article : Google Scholar : PubMed/NCBI
|
|
2.
|
Lee JT, Lehmann BD, Terrian DM, et al:
Targeting prostate cancer based on signal transduction and cell
cycle pathways. Cell Cycle. 7:1745–1762. 2008. View Article : Google Scholar : PubMed/NCBI
|
|
3.
|
Madsen P, Rasmussen HH, Leffers H, Honore
B and Celis JE: Molecular cloning and expression of a novel
keratinocyte protein (psoriasis-associated fatty acid-binding
protein [PA-FABP]) that is highly up-regulated in psoriatic skin
and that shares similarity to fatty acid-binding proteins. J Invest
Dermatol. 99:299–305. 1992.PubMed/NCBI
|
|
4.
|
Jing C, Beesley C, Foster CS, et al:
Identification of the messenger RNA for human cutaneous fatty
acid-binding protein as a metastasis inducer. Cancer Res.
60:2390–2398. 2000.PubMed/NCBI
|
|
5.
|
Jing C, Beesley C, Foster CS, et al: Human
cutaneous fatty acid-binding protein induces metastasis by
up-regulating the expression of vascular endothelial growth factor
gene in rat Rama 37 model cells. Cancer Res. 61:4357–4364.
2001.PubMed/NCBI
|
|
6.
|
Bao ZZ, Malki MI, Forootan SS, et al: A
novel cutaneous fatty acid-binding protein-related signaling
pathway leading to malignant progression in prostate cancer cells.
Genes Cancer. Sep 18–2013.(Epub ahead of print). View Article : Google Scholar
|
|
7.
|
Adamson J, Morgan EA, Beesley C, et al:
High-level expression of cutaneous fatty acid-binding protein in
prostatic carcinomas and its effect on tumorigenicity. Oncogene.
22:2739–2749. 2003. View Article : Google Scholar : PubMed/NCBI
|
|
8.
|
Forootan SS, Bao ZZ, Forootan FS, et al:
Atelocollagen-delivered siRNA targeting the FABP5 gene as an
experimental therapy for prostate cancer in mouse xenografts. Int J
Oncol. 36:69–76. 2010.PubMed/NCBI
|
|
9.
|
Morgan EA, Forootan SS, Adamson J, et al:
Expression of cutaneous fatty acid-binding protein (C-FABP) in
prostate cancer: potential prognostic marker and target for
tumourigenicity-suppression. Int J Oncol. 32:767–775. 2008.
|
|
10.
|
Gebert N, Gebert M, Oeljeklaus S, et al:
Dual function of Sdh3 in the respiratory chain and TIM22 protein
translocase of the mitochondrial inner membrane. Mol Cell.
44:811–818. 2011. View Article : Google Scholar : PubMed/NCBI
|
|
11.
|
Xu HE, Lambert MH, Montana VG, et al:
Molecular recognition of fatty acids by peroxisome
proliferator-activated receptors. Mol Cell. 3:397–403. 1999.
View Article : Google Scholar : PubMed/NCBI
|
|
12.
|
Santos CR and Schulze A: Lipid metabolism
in cancer. FEBS J. 279:2610–2623. 2012. View Article : Google Scholar : PubMed/NCBI
|
|
13.
|
Matsuyama M and Yoshimura R: Peroxisome
proliferator-activated receptor-gamma is a potent target for
prevention and treatment in human prostate and testicular cancer.
PPAR Res. 2008:2498492008. View Article : Google Scholar : PubMed/NCBI
|
|
14.
|
Kliewer SA, Xu HE, Lambert MH and Willson
TM: Peroxisome proliferator-activated receptors: from genes to
physiology. Rec Prog Horm Res. 56:239–263. 2001. View Article : Google Scholar : PubMed/NCBI
|
|
15.
|
Qi C, Zhu Y and Reddy JK: Peroxisome
proliferator-activated receptors, coactivators, and downstream
targets. Cell Biochem Biophys. 32:187–204. 2000. View Article : Google Scholar : PubMed/NCBI
|
|
16.
|
Sterchele PF, Sun H, Peterson RE and
Vanden Heuvel JP: Regulation of peroxisome proliferator-activated
receptor-alpha mRNA in rat liver. Arch Biochem Biophys.
326:281–289. 1996. View Article : Google Scholar : PubMed/NCBI
|
|
17.
|
Lemberger T, Saladin R, Vazquez M, et al:
Expression of the peroxisome proliferator-activated receptor alpha
gene is stimulated by stress and follows a diurnal rhythm. J Biol
Chem. 271:1764–1769. 1996. View Article : Google Scholar : PubMed/NCBI
|
|
18.
|
Braissant O, Foufelle F, Scotto C, Dauca M
and Wahli W: Differential expression of peroxisome
proliferator-activated receptors (PPARs): tissue distribution of
PPAR-alpha, -beta, and -gamma in the adult rat. Endocrinology.
137:354–366. 1996.
|
|
19.
|
Mansure JJ, Nassim R and Kassouf W:
Peroxisome proliferator-activated receptor gamma in bladder cancer:
a promising therapeutic target. Cancer Biol Ther. 8:6–15. 2009.
View Article : Google Scholar : PubMed/NCBI
|
|
20.
|
Chawla A, Barak Y, Nagy L, Liao D,
Tontonoz P and Evans RM: PPAR-gamma dependent and independent
effects on macrophage-gene expression in lipid metabolism and
inflammation. Nat Med. 7:48–52. 2001. View
Article : Google Scholar : PubMed/NCBI
|
|
21.
|
Segawa Y, Yoshimura R, Hase T, et al:
Expression of peroxisome proliferator-activated receptor (PPAR) in
human prostate cancer. Prostate. 51:108–116. 2002. View Article : Google Scholar : PubMed/NCBI
|
|
22.
|
Berthon P, Cussenot O, Hopwood L, Leduc A
and Maitland N: Functional expression of sv40 in normal human
prostatic epithelial and fibroblastic cells - differentiation
pattern of nontumorigenic cell lines. Int J Oncol. 6:333–343.
1995.
|
|
23.
|
Cussenot O, Berthon P, Berger R, et al:
Immortalization of human adult normal prostatic epithelial cells by
liposomes containing large T-SV40 gene. J Urol. 146:881–886.
1991.PubMed/NCBI
|
|
24.
|
Horoszewicz JS, Leong SS, Kawinski E, et
al: LNCaP model of human prostatic carcinoma. Cancer Res.
43:1809–1818. 1983.
|
|
25.
|
Stone KR, Mickey DD, Wunderli H, Mickey GH
and Paulson DF: Isolation of a human prostate carcinoma cell line
(DU 145). Int J Cancer. 21:274–281. 1978. View Article : Google Scholar : PubMed/NCBI
|
|
26.
|
Kaighn ME, Lechner JF, Narayan KS and
Jones LW: Prostate carcinoma: tissue culture cell lines. Natl
Cancer Inst Monogr. 17–21. 1978.
|
|
27.
|
Kozlowski JM, Fidler IJ, Campbell D, Xu
ZL, Kaighn ME and Hart IR: Metastatic behavior of human tumor cell
lines grown in the nude mouse. Cancer Res. 44:3522–3529.
1984.PubMed/NCBI
|
|
28.
|
Forootan SS, Foster CS, Aachi VR, et al:
Prognostic significance of osteopontin expression in human prostate
cancer. Int J Cancer. 118:2255–2261. 2006. View Article : Google Scholar : PubMed/NCBI
|
|
29.
|
Forootan SS, Wong YC, Dodson A, et al:
Increased Id-1 expression is significantly associated with poor
survival of patients with prostate cancer. Hum Pathol.
38:1321–1329. 2007. View Article : Google Scholar : PubMed/NCBI
|
|
30.
|
Jing C, El-Ghany MA, Beesley C, et al:
Tazarotene-induced gene 1 (TIG1) expression in prostate carcinomas
and its relationship to tumorigenicity. J Natl Cancer Inst.
94:482–490. 2002. View Article : Google Scholar : PubMed/NCBI
|
|
31.
|
Zhang Y, Forootan SS, Liu D, et al:
Increased expression of anterior gradient-2 is significantly
associated with poor survival of prostate cancer patients. Prostate
Cancer Prostatic Dis. 10:293–300. 2007. View Article : Google Scholar : PubMed/NCBI
|
|
32.
|
Gleason DF and Mellinger GT: Prediction of
prognosis for prostatic adenocarcinoma by combined histological
grading and clinical staging. J Urol. 111:58–64. 1974.
|
|
33.
|
Keller H, Dreyer C, Medin J, Mahfoudi A,
Ozato K and Wahli W: Fatty acids and retinoids control lipid
metabolism through activation of peroxisome proliferator-activated
receptor-retinoid X receptor heterodimers. Proc Natl Acad Sci USA.
90:2160–2164. 1993. View Article : Google Scholar
|
|
34.
|
Foster CS, Gosden CM and Ke YQ: Primer:
tissue fixation and preservation for optimal molecular analysis of
urologic tissues. Nat Clin Pract Urol. 3:268–278. 2006. View Article : Google Scholar : PubMed/NCBI
|
|
35.
|
Remmele W and Stegner HE: Recommendation
for uniform definition of an immunoreactive score (IRS) for
immunohistochemical estrogen receptor detection (ER-ICA) in breast
cancer tissue. Pathologe. 8:138–140. 1987.(In German).
|
|
36.
|
Masouye I, Saurat JH and Siegenthaler G:
Epidermal fatty-acid-binding protein in psoriasis, basal and
squamous cell carcinomas: an immunohistological study. Dermatology.
192:208–213. 1996. View Article : Google Scholar : PubMed/NCBI
|
|
37.
|
Celis A, Rasmussen HH, Celis P, et al:
Short-term culturing of low-grade superficial bladder transitional
cell carcinomas leads to changes in the expression levels of
several proteins involved in key cellular activities.
Electrophoresis. 20:355–361. 1999. View Article : Google Scholar
|
|
38.
|
Ostergaard M, Rasmussen HH, Nielsen HV, et
al: Proteome profiling of bladder squamous cell carcinomas:
identification of markers that define their degree of
differentiation. Cancer Res. 57:4111–4117. 1997.PubMed/NCBI
|
|
39.
|
Sinha P, Hutter G, Kottgen E, Dietel M,
Schadendorf D and Lage H: Increased expression of epidermal fatty
acid binding protein, cofilin, and 14-3-3-sigma (stratifin)
detected by two-dimensional gel electrophoresis, mass spectrometry
and microsequencing of drug-resistant human adenocarcinoma of the
pancreas. Electrophoresis. 20:2952–2960. 1999. View Article : Google Scholar
|
|
40.
|
Liu RZ, Graham K, Glubrecht DD, Germain
DR, Mackey JR and Godbout R: Association of FABP5 expression with
poor survival in triple-negative breast cancer: implication for
retinoic acid therapy. Am JPathol. 178:997–1008. 2011.PubMed/NCBI
|
|
41.
|
Barbus S, Tews B, Karra D, et al:
Differential retinoic acid signaling in tumors of long- and
short-term glioblastoma survivors. J Natl Cancer Inst. 103:598–606.
2011. View Article : Google Scholar : PubMed/NCBI
|
|
42.
|
Lemberger T, Desvergne B and Wahli W:
Peroxisome proliferator-activated receptors: a nuclear receptor
signaling pathway in lipid physiology. An Rev Cell Dev Biol.
12:335–363. 1996. View Article : Google Scholar : PubMed/NCBI
|
|
43.
|
Roberts-Thomson SJ: Peroxisome
proliferator-activated receptors in tumorigenesis: targets of
tumour promotion and treatment. Immunol Cell Biol. 78:436–441.
2000. View Article : Google Scholar : PubMed/NCBI
|
|
44.
|
Jiang Y, Zou L, Zhang C, et al: PPARgamma
and Wnt/beta-catenin pathway in human breast cancer: expression
pattern, molecular interaction and clinical/prognostic
correlations. J Cancer Res Clin Oncol. 135:1551–1559. 2009.
View Article : Google Scholar
|
|
45.
|
Papadaki I, Mylona E, Giannopoulou I,
Markaki S, Keramopoulos A and Nakopoulou L: PPARgamma expression in
breast cancer: clinical value and correlation with ERbeta.
Histopathology. 46:37–42. 2005. View Article : Google Scholar : PubMed/NCBI
|
|
46.
|
Rohrl C, Kaindl U, Koneczny I, et al:
Peroxisome-proliferator-activated receptors gamma and beta/delta
mediate vascular endothelial growth factor production in colorectal
tumor cells. J Cancer Res Clin Oncol. 137:29–39. 2011. View Article : Google Scholar
|
|
47.
|
Bishop-Bailey D: PPARs and angiogenesis.
Biochem Soc Trans. 39:1601–1605. 2011. View Article : Google Scholar
|
|
48.
|
Roobol MJ, Haese A and Bjartell A: Tumour
markers in prostate cancer III: biomarkers in urine. Acta Oncol.
50(Suppl 1): 85–89. 2011. View Article : Google Scholar : PubMed/NCBI
|
|
49.
|
Theocharis S, Giaginis C, Parasi A, et al:
Expression of peroxisome proliferator-activated receptor-gamma in
colon cancer: correlation with histopathological parameters, cell
cycle-related molecules, and patients’ survival. Dig Dis Sci.
52:2305–2311. 2007.PubMed/NCBI
|
|
50.
|
Han SW, Greene ME, Pitts J, Wada RK and
Sidell N: Novel expression and function of peroxisome
proliferator-activated receptor gamma (PPARgamma) in human
neuroblastoma cells. Clin Cancer Res. 7:98–104. 2001.PubMed/NCBI
|
|
51.
|
Zhang GY, Ahmed N, Riley C, et al:
Enhanced expression of peroxisome proliferator-activated receptor
gamma in epithelial ovarian carcinoma. Br J Cancer. 92:113–119.
2005. View Article : Google Scholar : PubMed/NCBI
|
|
52.
|
Lee TW, Chen GG, Xu H, et al: Differential
expression of inducible nitric oxide synthase and peroxisome
proliferator-activated receptor gamma in non-small cell lung
carcinoma. Eur J Cancer. 39:1296–1301. 2003. View Article : Google Scholar : PubMed/NCBI
|
|
53.
|
Jiang WG, Redfern A, Bryce RP and Mansel
RE: Peroxisome proliferator activated receptor-gamma (PPAR-gamma)
mediates the action of gamma linolenic acid in breast cancer cells.
Prostaglandins Leukot Essent Fatty Acids. 62:119–127. 2000.
View Article : Google Scholar : PubMed/NCBI
|
|
54.
|
Katagiri Y, Takeda K, Yu ZX, Ferrans VJ,
Ozato K and Guroff G: Modulation of retinoid signalling through
NGF-induced nuclear export of NGFI-B. Nat Cell Biol. 2:435–440.
2000. View Article : Google Scholar : PubMed/NCBI
|
|
55.
|
Jiang M, Shappell SB and Hayward SW:
Approaches to understanding the importance and clinical
implications of peroxisome proliferator-activated receptor gamma
(PPARgamma) signaling in prostate cancer. J Cell Biochem.
91:513–527. 2004. View Article : Google Scholar
|
|
56.
|
Morgan E, Kannan-Thulasiraman P and Noy N:
Involvement of Fatty acid binding protein 5 and PPARbeta/delta in
prostate cancer cell growth. PPAR Res. 2010.Article No. 234629.
View Article : Google Scholar
|
|
57.
|
Foster CS, Dodson AR, Ambroisine L, et al:
Hsp-27 expression at diagnosis predicts poor clinical outcome in
prostate cancer independent of ETS-gene rearrangement. Br J Cancer.
101:1137–1144. 2009. View Article : Google Scholar : PubMed/NCBI
|
|
58.
|
Yao S, Bee A, Brewer D, et al: PRKC-ζ
expression promotes the aggressive phenotype of human prostate
cancer cells and is a novel target for therapeutic intervention.
Genes Cancer. 1:444–464. 2010.
|