Introduction
Cis-diamminedichloroplatinum or cisplatin is an
inorganic compound that is widely used as a therapy of cancers. The
biochemical mechanisms of cisplatin cytotoxicity involve the
binding of the drug to DNA and non-DNA targets and the subsequent
induction of cell death through apoptosis, necrosis, or both
(1). It follows that altered
expression of regulatory proteins involved in signal transduction
pathways that control the apoptosis, necrosis or cell defense
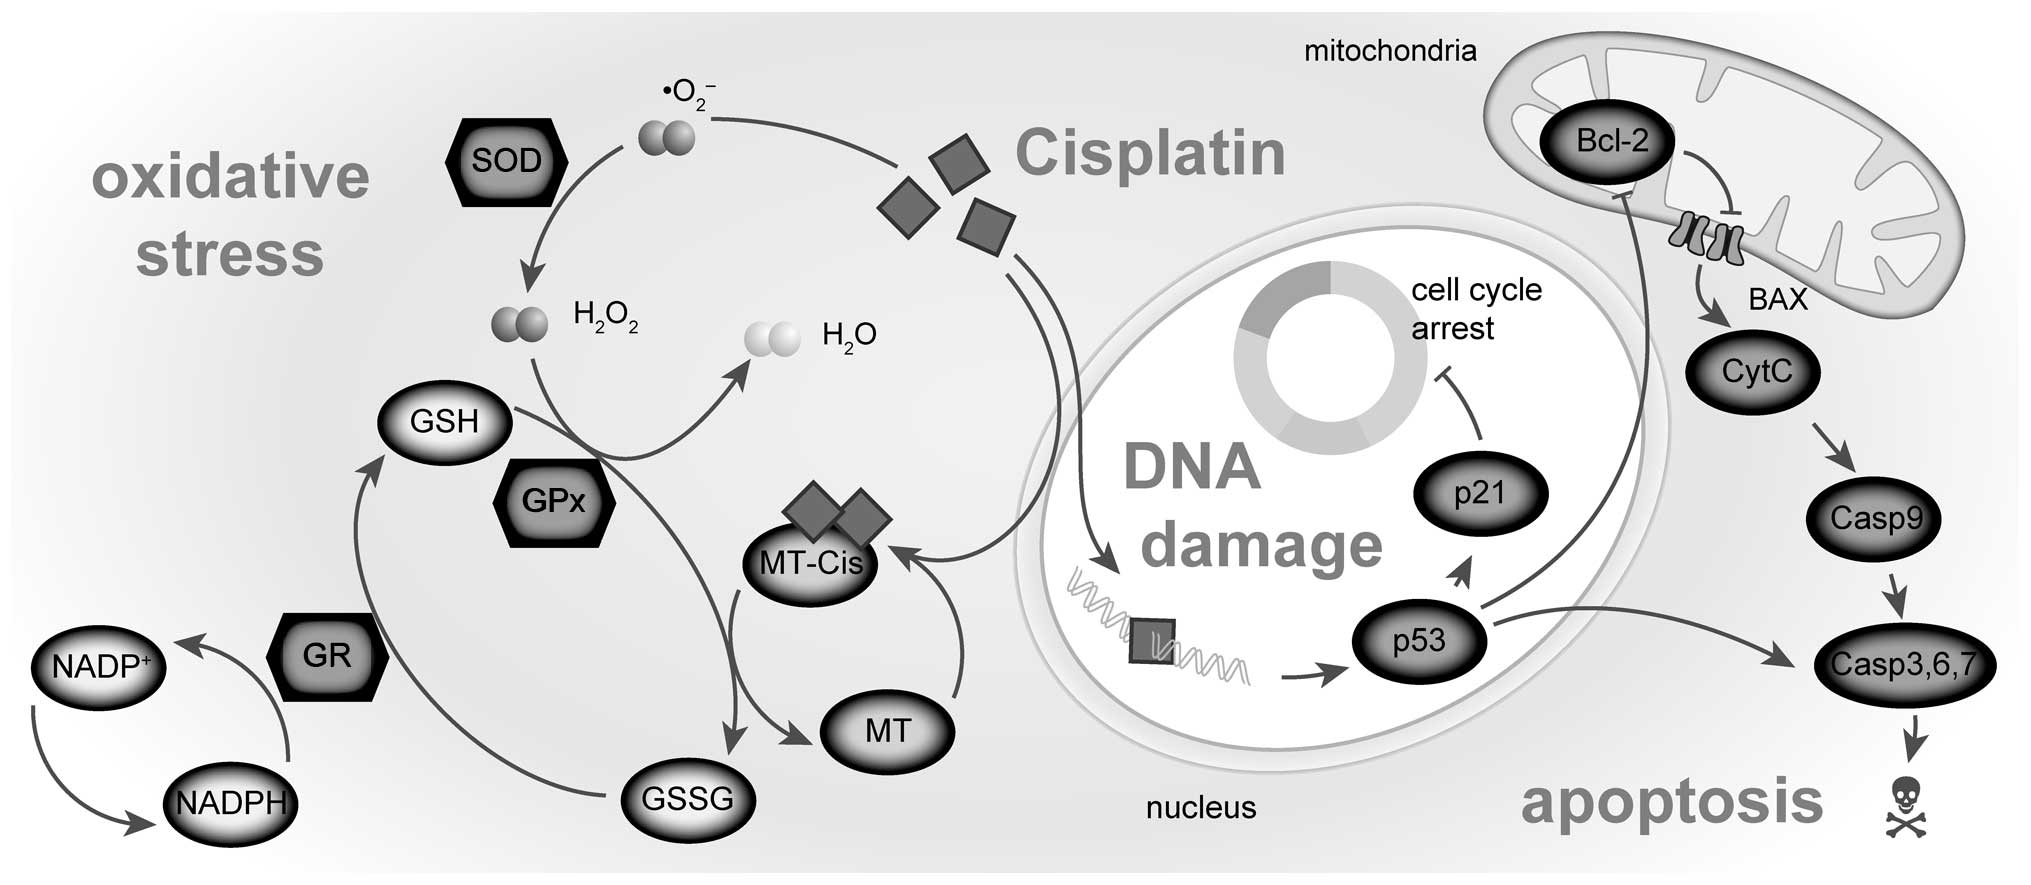
mechanisms (Fig. 1) can
additionally make certain types of cancer rather insensitive to
cytotoxic effects of cisplatin (2,3),
which is, among others, case of later stages of prostate cancer.
Cellular mechanisms of resistance to cisplatin are multifactorial
and result in severe limitations in clinical use (4–6).
Therefore, cisplatin resistance model was formed from prostatic
cell lines PNT1A, PC-3, and 22Rv1 in this study. The PC-3 cell line
was derived from a metastasis of a high grade androgen irresponsive
prostate cancer. Cisplatin resistance is presumed in these cells
due nonfunctional p53 (7). Tumor
suppressor protein p53 plays a critical role in regulating cell
cycle arrest, DNA repair and apoptosis (8). Accordingly, tumor cells lacking
functional p53 were found more resistant to cisplatin than cells
that contained functional p53 and the resistant cell lines were
sensitized to cisplatin upon reconstitution with wild-type p53
(9).
Among other alterations in cellular response to the
cisplatin, oxidative stress might be triggered (10,11).
In previous studies, the central role of mitochondria damage in the
cisplatin-induced toxicity was demonstrated and it is suggested
that it probably occurs due to augmented ROS (reactive oxygen
species) generation, with consequent impairment of mitochondrial
function and structure, depletion of the key components of the
mitochondrial antioxidant defense system (GSH and NADPH) and
cellular death by apoptosis (12,13).
Therefore, understanding the expression of anti- and pro-apoptotic
proteins and their relationship to redox system in the cells upon
cisplatin treatment will provide valuable insight into the
development of cisplatin resistance (11). Therefore, the expression of key
apoptosis signaling genes (Bax and Bcl-2) and cell defensive
thiol-containing molecule metallothionein (MT) were investigated in
this study in different cisplatin concentrations and length of
treatment. Additionally, main antioxidant enzymes superoxide
dismutase (SOD), glutathione peroxidase (GPx) and glutathione
reductase (GR) and antioxidant capacity with respect to the
cisplatin treatment were analyzed in this study. MT binds rapidly
to platinum and thus sequester cisplatin and remove it from the
cells. This binding has primarily been associated with the
development of resistance (9).
However, there is still a level of inconsistence between studies.
In some cases, the levels of MT are higher in cisplatin-resistant
cells, but in other cases, the MT levels are unaffected (2).
In summary, differences in antioxidant system,
apoptotic mechanism and in cell cycle between prostatic cell lines
could partially elucidate the development of cisplatin resistance.
Thus, the aim of this study was: i) to identify the most
characteristic parameter for particular cell line and/or particular
cisplatin treatment using general regression model and ii) to
assess, whether it is possible to use measured parameters as
markers of cisplatin resistance.
Materials and methods
Chemical and biochemical reagents
RPMI-1640 medium, Ham’s F12 medium, fetal bovine
serum (FBS) (mycoplasma-free), penicillin/streptomycin and trypsin
were purchased from PAA Laboratories GmbH (Pasching, Austria).
Phosphate-buffered saline (PBS) was purchased from Invitrogen Corp.
(Carlsbad, CA, USA). Ethylenediaminetetraacetic acid (EDTA),
cisplatin 0.5 mg/ml solution (Medac, Germany), RIPA buffer and all
other chemicals of ACS purity were purchased from Sigma-Aldrich Co.
(St. Louis, MO, USA), unless noted otherwise.
Cell cultures
Three human prostatic cell lines were used in this
study: i) PNT1A human cell line established by immortalization of
normal adult prostatic epithelial cells by transfection with a
plasmid containing SV40 genome with a defective replication origin.
The primary culture was obtained from the prostate of a 35-year-old
male post mortem; ii) 22Rv1 is a human prostate carcinoma
epithelial cell line derived from a xenograft that was serially
propagated in mice after castration-induced regression and relapse
of the parental, androgen-dependent CWR22 xenograft. iii) PC-3
human cell line established from a grade 4 androgen independent and
unresponsive prostatic adenocarcinoma from 62-year-old Caucasian
male and derived from metastatic site in bone. All cell lines used
in this study were purchased from Health Protection Agency Culture
Collections (Salisbury, UK).
Culture conditions
PNT1A and 22Rv1 cells were cultured in RPMI-1640
medium with 10% FBS. PC-3 cells were cultured in Ham’s F12 medium
with 7% FBS. All media were supplemented with penicillin (100 U/ml)
and streptomycin (0.1 mg/ml), and the cells were maintained at 37°C
in a humidified incubator (Sanyo, Japan) with 5%
CO2.
Cisplatin treatment
The cisplatin treatment was initiated after cells
reached ∼50% confluence. The concentration range 0, 10, 25, 50,
100, 150 μmol/l was used for all cell lines. Time points for
cell harvest and thus for all subsequent analyses were set
subsequently: 12, 24, 48 and 72 h. Thus, 6 (concentrations) × 4
(time points) lyzates were created. Cells were then harvested and
washed four times with 1X PBS, pH 7.4.
Cell content quantification
Total cell content was analyzed using Casy model TT
system (Roche Applied Science, USA) using following protocol:
first, calibration was performed from samples of viable and
necrotic cells. For necrotic cells, 100 μl cell suspension
and 800 μl Casy Blue solution was mixed and left for 5 min
in room temperature. Subsequently, 9 ml Casy Tone was added. To
prepare viable cell standard, 100 μl cell suspension was
mixed with 10 ml Casy Tone. All subsequent measurements were
performed on 100× diluted 100 μl cell suspension. Prior each
measurement, background was subtracted. All samples were measured
in duplicates.
Measurements of cell viability - MTT
test
The suspension of 5,000 cells was added to each well
of standard microtiter plates. Volume of 200 A was transferred to
2–11 wells. Medium (200 μl) was added to the first and to
the last column (1 and 12, control). Plates were incubated for 2
days at 37°C to ensure cell growth. Medium was removed from columns
2 to 11. Columns 3–10 were filled with 200 μl of medium
containing increasing concentration of cisplatin (0–150
μmol/l). As control, columns 2 and 11 were filled with
medium without cisplatin. Plates were incubated for 12, 24, 48 and
72 h; then, media were removed and replaced by a fresh medium,
three times a day. Columns 1–11 were filled with 200 μl of
medium containing 50 μl of MTT (5 mg/ml in PBS) and
incubated in a humidified atmosphere for 4 h at 37°C, wrapped in
aluminium foil. After the incubation, MTT-containing medium was
replaced by 200 μl of 99.9% dimethyl sulphoxide (DMSO) to
dissolve MTT-formazan crystals. Then, 25 μl of glycine
buffer was added to all wells and absorbance was immediately
determined at 570 nm (VersaMax microplate reader, Molecular
Devices, Sunnyvale, CA, USA).
Cell growth and proliferation assay using
impedance measurement with xCELLigence system
The xCELLigence system (Roche Applied Science and
ACEA Biosciences, San Diego, CA, USA) consists of four main
components: the RTCA analyzer, the RTCA station, the RTCA computer
with integrated software and disposable E-plate 16. Firstly, the
optimal seeding concentration for proliferation and cytotoxic assay
was determined. After seeding the total number of cells in 200
μl medium to each well in E-plate 16, the attachment,
proliferation and spreading of the cells was monitored every 15
min. All experiments were carried out for 250 h. The results are
expressed as relative impedance using the manufacturer’s software
(Roche Applied Science and ACEA Biosciences).
Flow cytometric analysis of cell
cycle
The cells were harvested and fixed with ice-cold 70%
ethanol for 30 min. After washing with 1X PBS, the cells were
incubated with DNA staining solution consisting of propidium iodide
(PI; 50 μg/ml) and RNase (100 μg/ml) for 30 min at
37°C in the dark. Samples were analyzed with FACSVerse flow
cytometer (BD Biosciences, USA) and the data obtained were analyzed
using FACSuite software (BD Biosciences).
RNA isolation and reverse
transcription
High pure total-RNA isolation kit (Roche, Basel,
Switzerland) was used for isolation. The medium was removed and
samples were twice washed with 5 ml of ice-cold PBS. Cells were
scraped off, transferred to clean tubes and centrifuged at 20,800 ×
g for 5 min at 4°C. After this step, lysis buffer was added and RNA
isolation was carried out according to manufacturer’s instructions.
Isolated RNA was used for cDNA synthesis. RNA (600 ng) was
transcribed using transcriptor first strand cDNA synthesis kit
(Roche, Switzerland) was used according to manufacturer’s
instructions. Prepared cDNA (20 μl) from total-RNA was
diluted with RNase-free water to 100 μl and 5 μl was
directly analyzed by 7500 RT-PCR system (Applied Biosystems).
Quantitative polymerase chain reaction
(q-PCR)
q-PCR was performed in triplicate using the TaqMan
gene expression assay system with the 7500 RT-PCR system (Applied
Biosystems) and the amplified DNA was analyzed by the comparative
Ct method using β-actin as an endogenous control for
metallothionein MT2A, Bax, Bcl-2 and p53 gene expression
quantification. The primer and probe sets for β-actin (assay ID:
Hs99999903_m1), MT2A (Hs02379661_g1) Bcl-2 (Hs99999018_m1), p53
(Hs01034649_m1), and Bax (Hs00180269_m1) were selected from TaqMan
gene expression assays (Life Technologies, USA). q-PCR was
performed under the following amplification conditions: total
volume of 20 μl, initial incubation 50°C/2 min followed by
denaturation 95°C/10 min, then 45 cycles 95°C/15 sec, 60°C/1
min.
Electrochemical detection of
metallothionein
Electrochemical detection was used for
quantification of metallothionein. Detection was carried out using
AUTOLAB Analyser (EcoChemie, The Netherlands) with classical
three-electrode arrangement using of differential pulse voltammetry
Brdicka reaction. Analysed sample was accumulated on the surface of
a working electrode which is represented by hanging mercury drop
electrode. After accumulation, detection proceeded in a supporting
electrolyte containing cobaltic (cobalt3+) salt in
ammonia buffer of pH 9.6 (14).
Spectrophotometric measurement
Spectrophotometric measurements were carried out
using an automated chemical analyser BS-400 (Mindray, P.R. China).
It is composed of cuvette space tempered to 37±1°C, reagent space
with a carousel for reagents (tempered to 4±1°C), sample space with
a carousel for preparation of samples, and an optical detector.
Transfer of samples and reagents is provided by robotic arm
equipped with a dosing needle (error of dosage up to 5% of volume).
Cuvette contents are mixed by an automatic mixer including a
stirrer immediately after addition of reagents or samples.
Contamination is reduced due to its rinsing system, including
rinsing of the dosing needle as well as the stirrer by MilliQ
water. For detection itself, the following range of wavelengths can
be used - 340, 380, 412, 450, 505, 546, 570, 605, 660, 700, 740,
and 800 nm.
Determination of SOD
Kit 19160 SOD (Sigma Aldrich, USA) was used for
assay of SOD, EC 1.15.1.1. First, 200 μl volume of reagent
R1 (WTS solution 20 times diluted with buffer) was pipetted into a
plastic cuvette and agent was incubated at 37°C for 108 sec.
Afterwards, 20 μl volume of sample was pipetted and in 378
sec, the reaction was started by adding 20 μl volume of
reagent R2 (enzyme solution 167 times diluted with buffer). It was
incubated for 72 sec and then absorbance was measured at λ=450 nm.
Kinetic reaction was measured for 108 sec and absorbance was read
every 9 sec.
Determination of glutathione reductase
and peroxidase
A glutathione reductase and peroxidase cellular
activity assay kits (Sigma Aldrich) were used for GR and GPx
activity determination. Reagents R1 and R2 were prepared by
dissolving in an assay buffer (100 mmol/l potassium phosphate
buffer, pH 7.5, with 1 mmol/l EDTA). The reagent R1 of 260
μl volume (1.15 mmol/l oxidized glutathione in the assay
buffer) was poured with 10 μl of sample and 30 μl
volume of reagent R2 (1 mmol/l NADPH in GR assay buffer) into a
plastic cuvette. The decrease in absorbance was measured at 340 nm
using kinetic program for 126 sec.
Determination of antioxidant activity by
the FRAP method
The FRAP method (ferric reducing antioxidant power)
is based on the reduction of complexes of
2,4,6-tripyridyl-s-triazine with ferric chloride hexahydrate
(FeCl3·6H2O); these substances are almost
colorless, and eventually slightly brownish. After the reduction,
blue ferrous complexes are formed. Procedure for the determination
was used as in Sochor et al (15). After 150 μl volume of
reagent is injected into a plastic cuvette with subsequent addition
of a 3-μl sample, absorbance is measured at 605 nm for 12
min. Difference between absorbance at the last (the 12th) min and
the 2nd min of the assay procedure was used for calculating of the
antioxidant activity.
Determination of antioxidant activity by
the free radicals method
This method is based on ability of chlorophyllin
(the sodium-copper salt of chlorophyl) to accept and donate
electrons with a stable change of maximum absorption. This effect
is conditioned by an alkaline environment and the addition of
catalyst.
Procedure for the determination was used as in
Sochor et al (15). Reagent
of 150 μl volume is injected into a plastic cuvette with
subsequent addition of a 6-μl sample. Absorbance is measured
at 450 nm in the second min of assay and the last (the 12th) min.
Difference of the two absorbances is considered as an outputting
value.
Statistical analysis
First, data were tested for normality using
χ2-test and log-normal fitted data were recalculated to
log scale. General regression model method was used to reveal
relationships between multiple continuous and categorical
variables.
Prior to regression analysis, Pearson’s correlation
was performed to verify concordant trends among cell lines.
Subsequently, partial correlations were used to analyze residuals
of time/concentration after adjustment of all other variables. To
reveal differences between cell lines, Tukey’s post-hoc test within
homogeneous groups was employed after adjustment of all other
variables. Prior to these analyses, residuals were tested for
outliers (no-normally distributed data with outliers was excluded
from subsequent analyses). Hierarchical clustering on standardized
data was used to determine similar trends within determined
parameters. Unless noted otherwise, p<0.05 was considered
statistically significant. Software Statistica 10 (StatSoft, Inc.,
USA) was used for analysis.
Results
Effect of treatment on cell viability -
comparison of MTT and impedance-based data
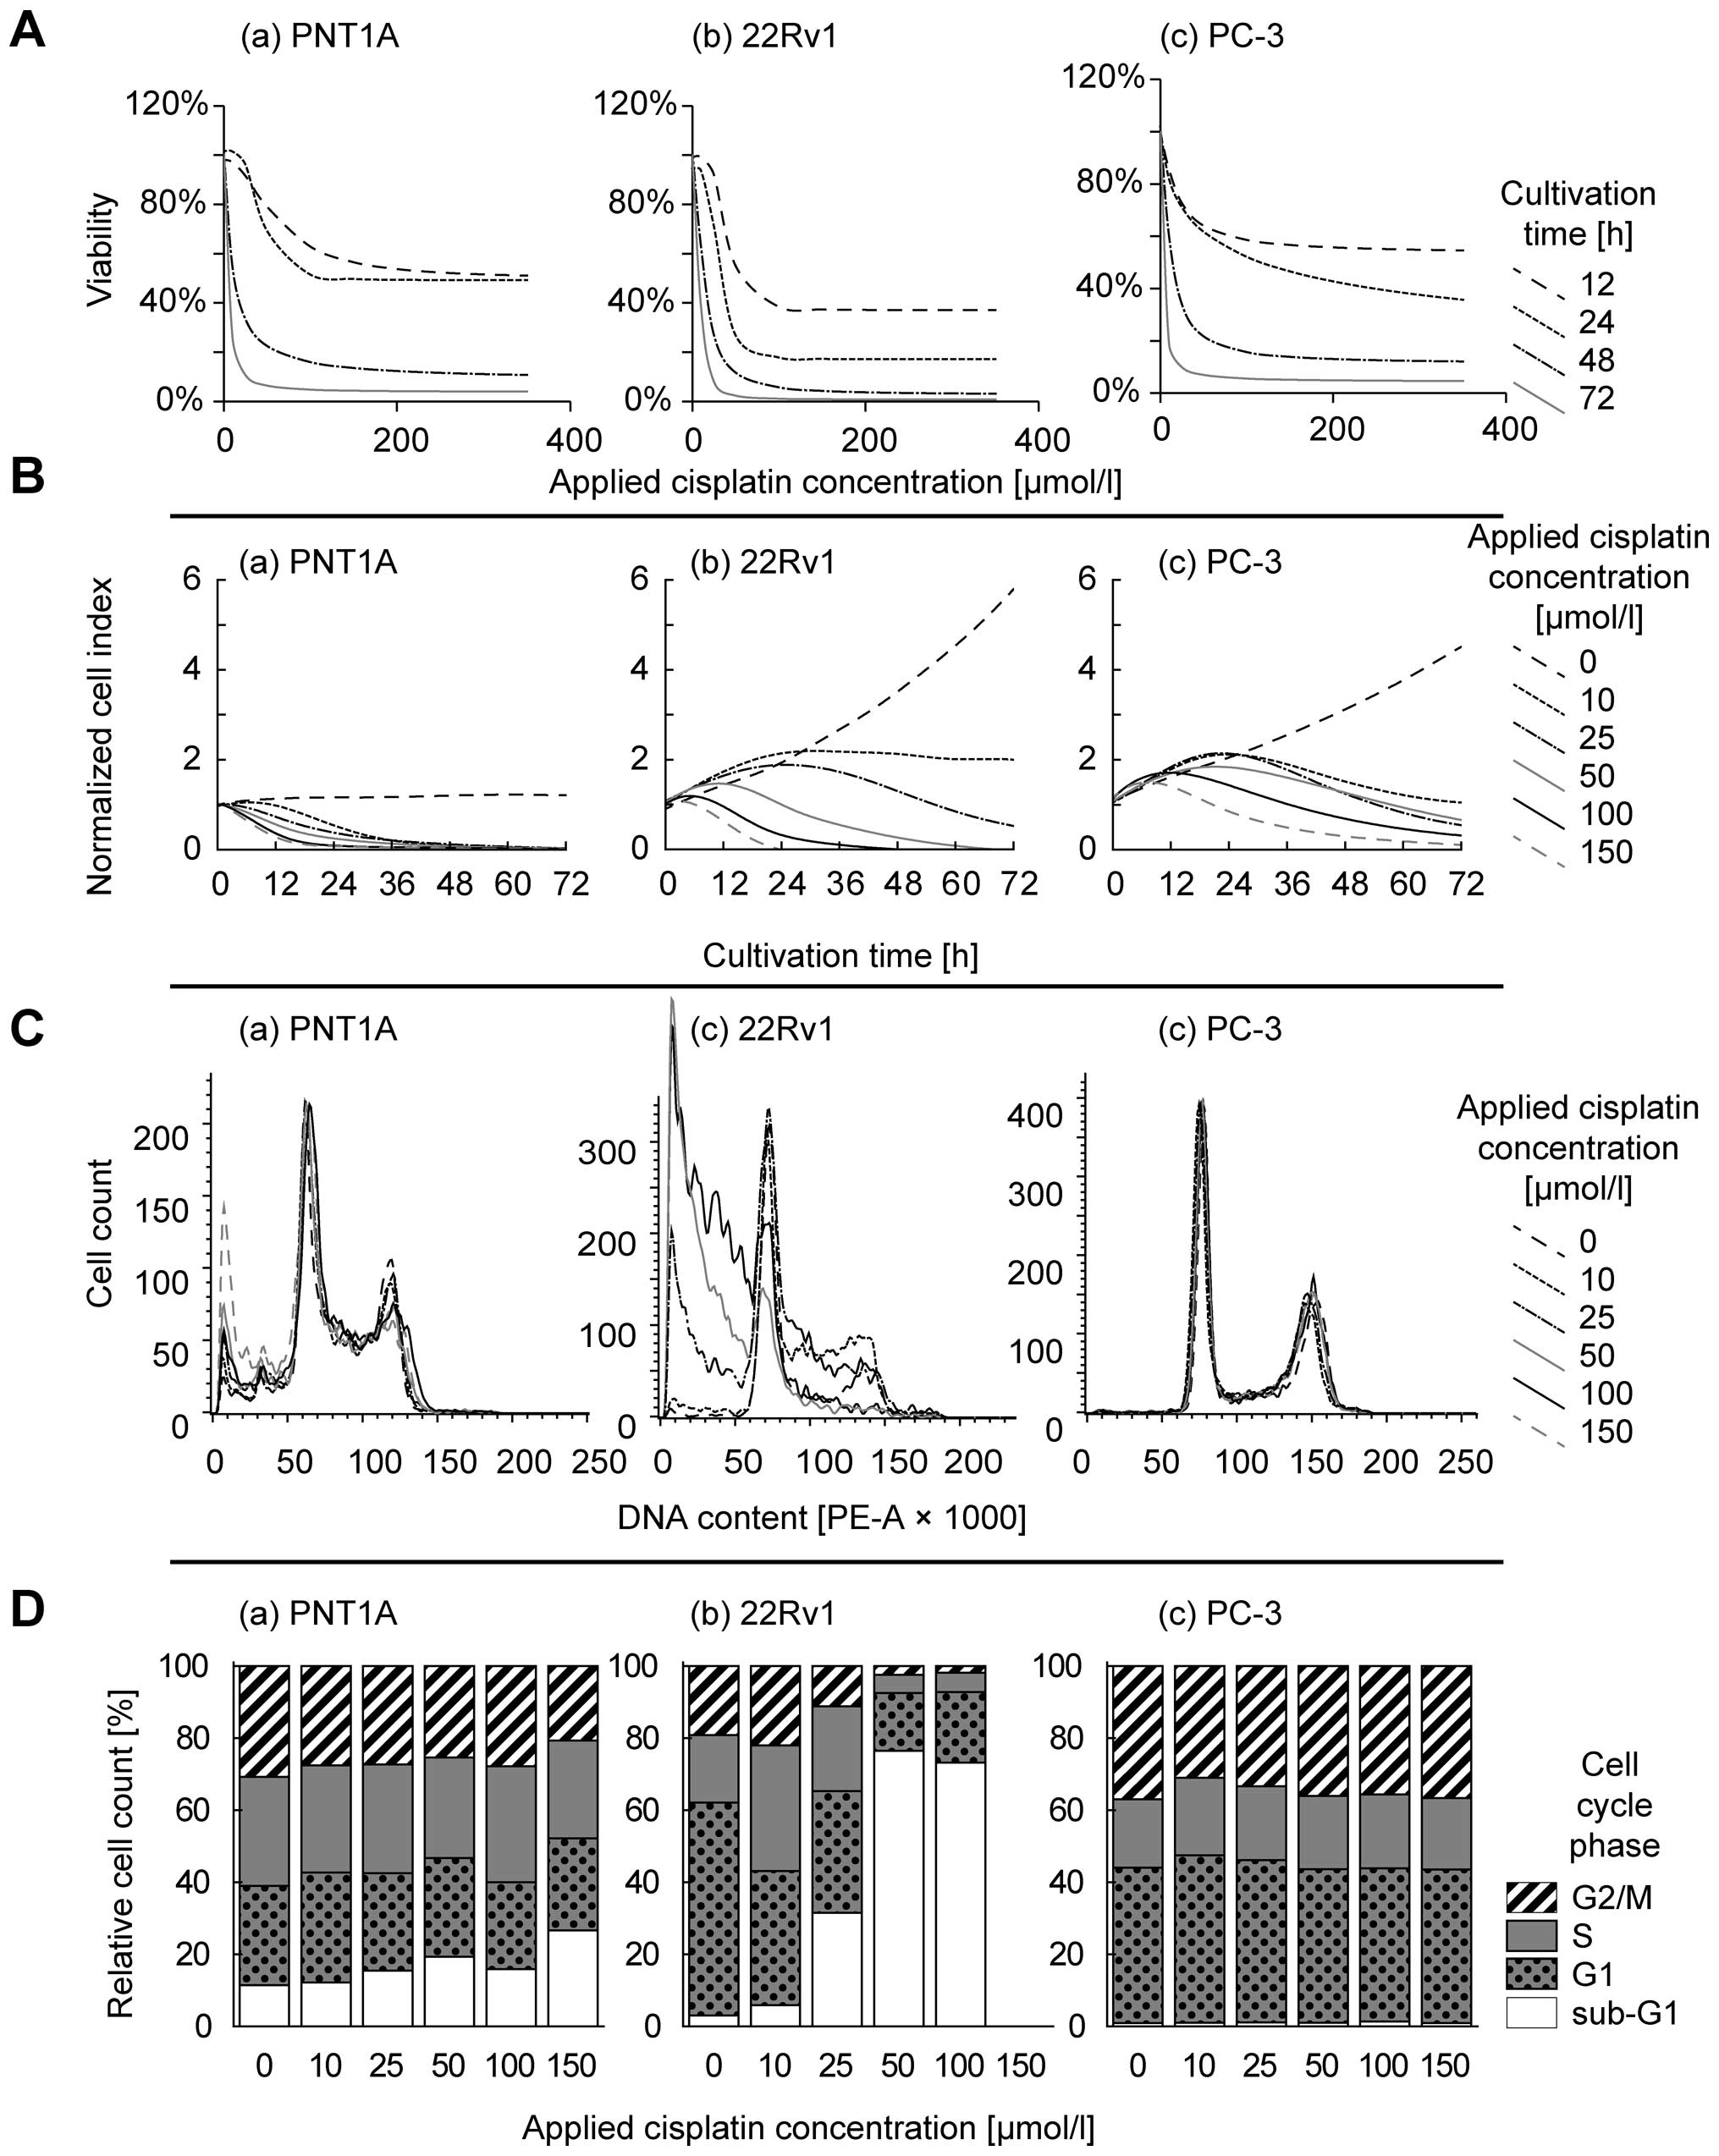
To assess the cytotoxic effect of cisplatin on
prostate cell lines, and to select concentrations for further
analyses, MTT test was performed with concentrations 0 (no drug
added), 10, 25, 50, 100, 150, 200 and 250 μmol/l on all cell
lines (Fig. 2A). Using logistic
regression, IC50 concentrations were determined at time
points 12, 24, 48 and 72 h. As expected, cisplatin cytotoxicity
increases in time-dependent manner (Table I). To understand these temporal
changes, real-time cell growth monitoring was employed with the
same cisplatin concentrations. Using this method, transient
increase in impedance resulting in peaks on growth curves was
determined in the first 24 h of treatment (Fig. 2B). This method also showed a
similar time-dependent cytotoxicity increase as seen by MTT.
However, IC50 values calculated by this method were on
average 1.3-fold higher compared to MTT and no significant
correlation was observed between MTT- and impedance-based
IC50 values (r=0.13 at p=0.70).
 | Table I.Half-maximal concentrations.a |
Table I.
Half-maximal concentrations.a
| Cell line/time | MTT IC50
(μmol/l)
| xCELLigence
IC50 (μmol/l)
|
|---|
| 12 h | 24 h | 48 h | 72 h | 12 h | 24 h | 48 h | 72 h |
|---|
| PC-3 | 18.3 | 74.9 | 10.6 | 1.0 | 339.6 | 77.4 | 25.6 | 7.0 |
| 22Rv1 | 40.4 | 30.8 | 12.7 | 7.9 | Undet. | 2413.8 | 10.5 | 2.6 |
| PNT1A | 61.5 | 44.0 | 7.9 | 3.7 | 185.7 | 97.1 | 12.1 | 2.7 |
Flow cytometric analysis of the cell
cycle
To reveal the impact of cisplatin on the cell cycle,
flow cytometric analysis was performed after the confluence of
cells was ∼50%. This confluence was reached within 24 to 48 h of
treatment. Cisplatin-induced effects on cell cycle is evident in
PNT1A and 22Rv1 cell lines (Fig. 2C
and D). In these cells, 100 μM cisplatin dose increases
the proportion of sub-G1 stage cells; up to 26.7% and 73.2% in
PNT1A and 22Rv1, respectively. Flow cytometric analysis of 22Rv1
cells exposed 150 μmol/l cisplatin was below the detection
limits due to the low cell counts in the sample. In contrast, PC-3
cell line does not show cell cycle arrest, maintaining <1.3% of
cells in sub-G1 in all concentrations without significant increase
or decrease.
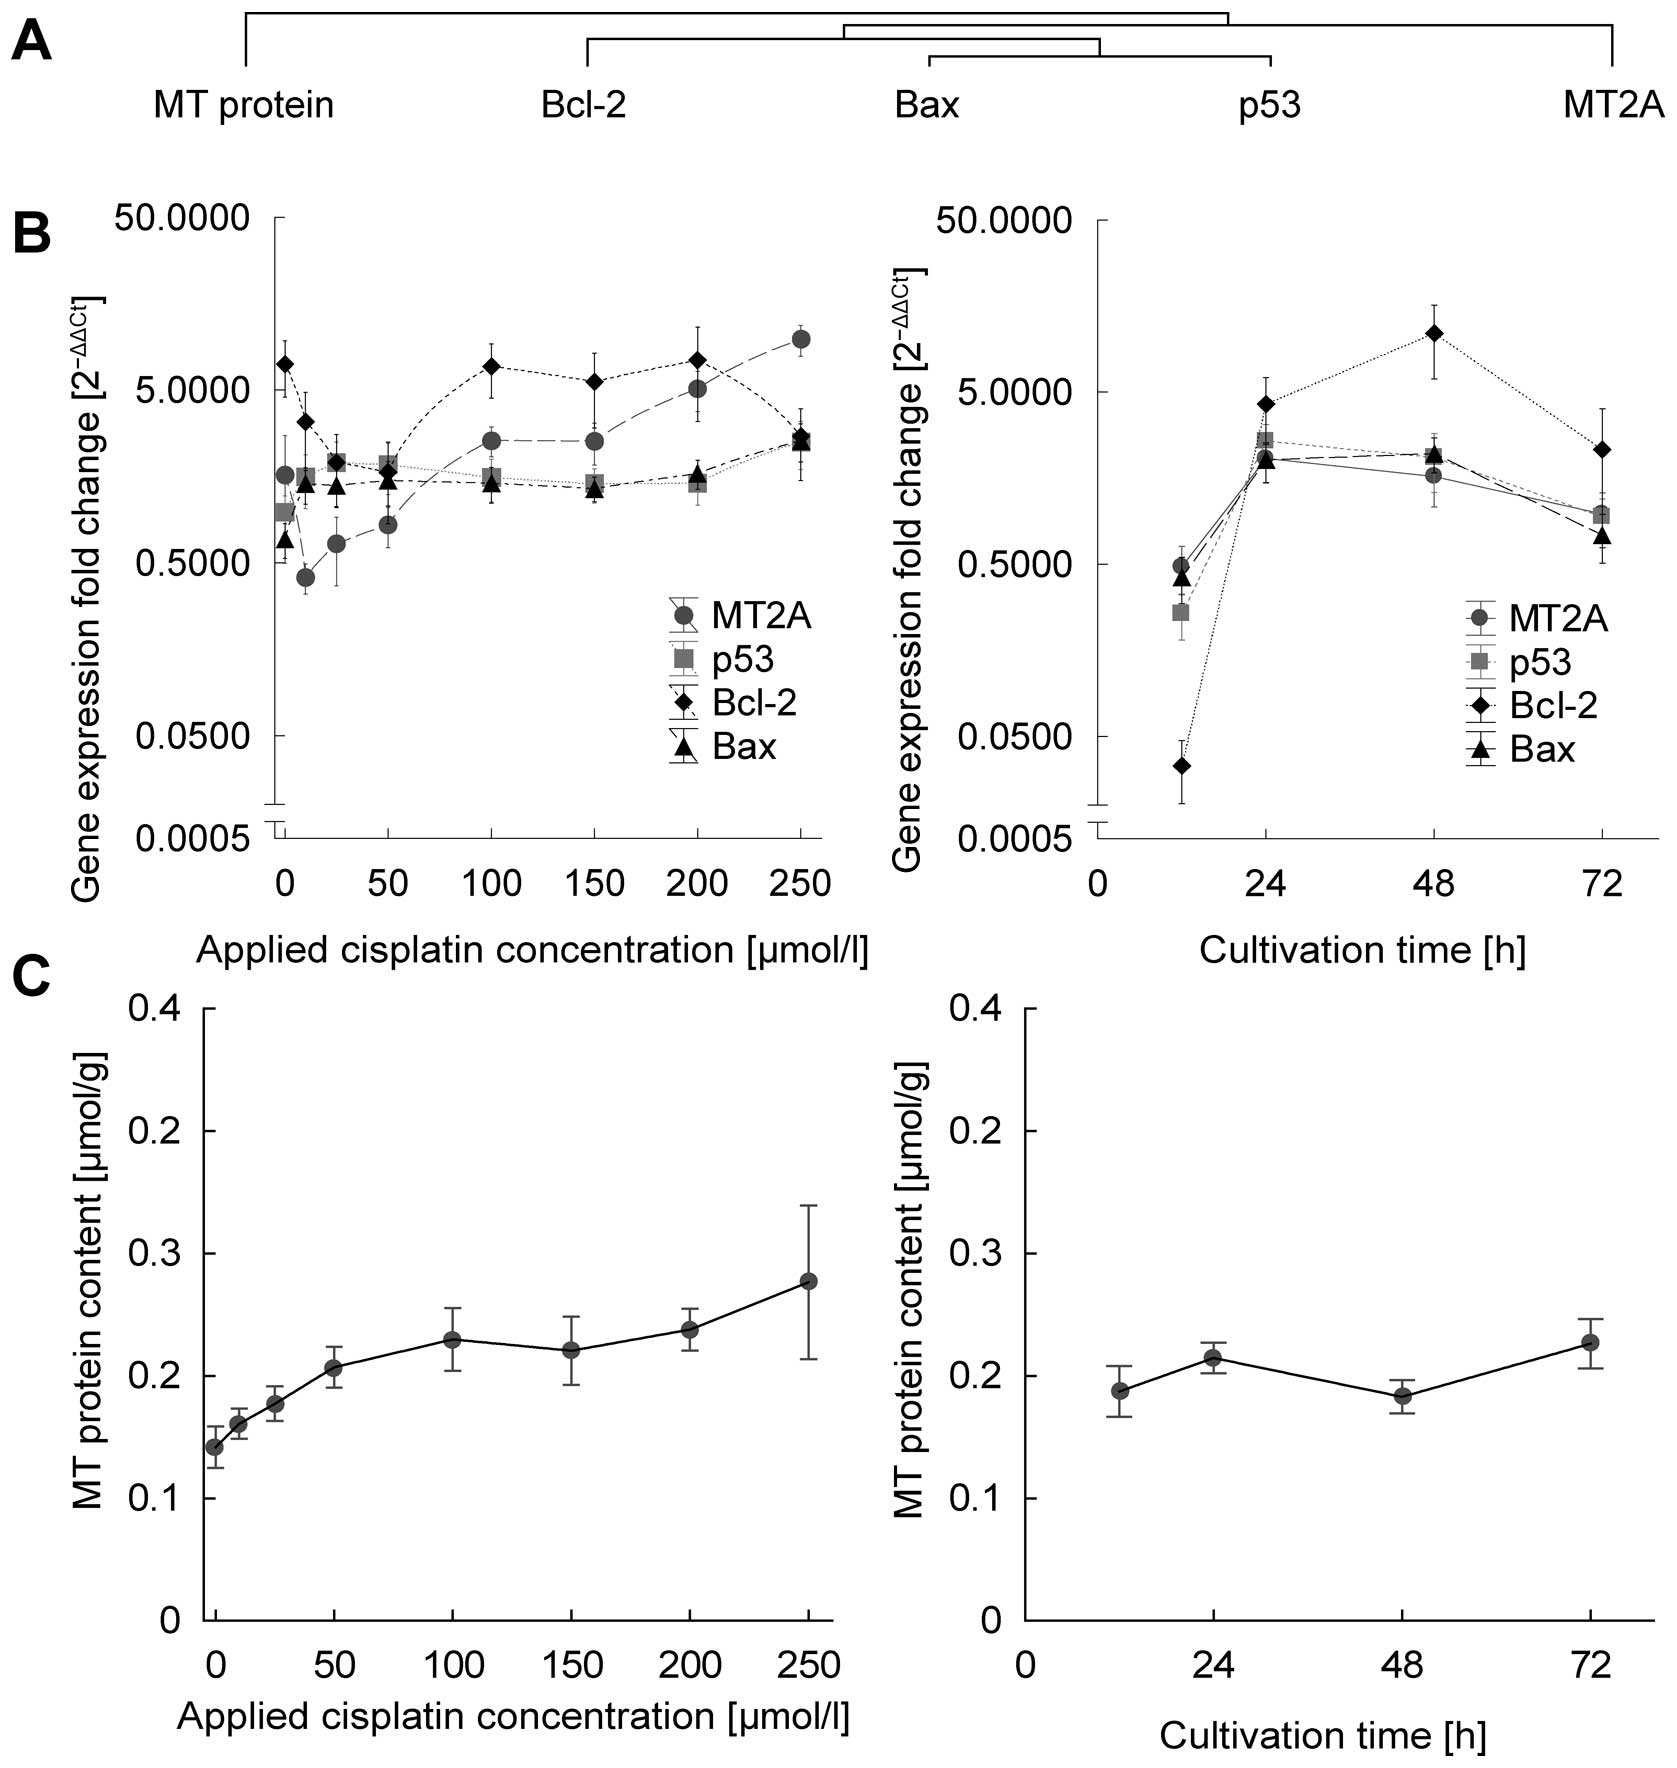
Effect of treatment on gene
expression
Subsequently, dose- and time-dependent response of
apoptosis- and oxidative stress-related genes was analyzed. First,
the level of metallo-thionein isoform 2A (RNA and protein),
cellular tumor antigen p53 (RNA and protein), apoptosis regulators
Bcl-2 and Bcl-2-associated X protein (Bax, RNA only) were analyzed
(Fig. 3).
All detected RNAs and proteins were affected in
treatment time-, dose- or cell line-dependent manner to some
extent. For a more comprehensive understanding, residual analysis
of treatment time and cisplatin dose after adjustment of other
variables is desirable. Conditions for such residual analysis are
met, because all lines showed consistently significant
increasing/decreasing trends for all substances, the difference was
seen only in the extent of increase/decrease. Partial correlations
of time-, cell line-, and dose-adjusted residuals were determined
to elucidate the unique contribution of the treatment time and dose
individually (Table II). To
analyze redundant trends, hierarchical cluster analysis of
oxidative markers and RNA and protein was performed. As seen in
Fig. 3A and B, Bcl-2, Bax and p53
show similar time- and dose-dependent response are thus clustered
together.
| Table II.Dependence of parameters on time,
cisplatin concentration and cell lines.a |
Table II.
Dependence of parameters on time,
cisplatin concentration and cell lines.a
| Correlation
coefficients (r) | MT protein | MT RNA | p53 RNA | Bcl-2 RNA | Bax RNA | SOD | GR | GPx | FR | FRAP | ABTS |
|---|
| Simple
correlation | | | | | | | | | | | |
| Time (h) | 0.03 | 0.09 | 0.12 | 0.36c | 0.05 | −0.14 | −0.26b | 0.23b | 0.22b | 0.18 | 0.09 |
| Cisplatin
(μmol/l) | 0.43d | 0.71d | 0.03 | 0.02 | 0.24b | −0.18 | −0.59d | 0.25b | 0.82d | 0.64d | 0.79d |
| Multiple
regression | | | | | | | | | | | |
| Overall | 0.59d | 0.73d | 0.84d | 0.69d | 0.61d | 0.53d | 0.82d | 0.64d | 0.89d | 0.76d | 0.85d |
| Time | 0.07 | 0.22 | 0.24b | 0.49d | 0.13 | −0.20 | −0.43d | 0.36c | 0.52d | 0.36c | 0.26b |
| Cisplatin
(μmol/l) | 0.45d | 0.73d | 0.17 | 0.12 | 0.34c | −0.21 | −0.72d | 0.34c | 0.88d | 0.71d | 0.82d |
| 22Rv1 cells | −0.14 | 0.10 | 0.34c | 0.63d | 0.46d | −0.22 | 0.59d | 0.48d | −0.36c | 0.40d | −0.39d |
| PC-3 cells | 0.43d | −0.13 | −0.82d | −0.46d | −0.56d | −0.29b | −0.03 | 0.06 | 0.36c | −0.01 | 0.40d |
First, the unique contribution of cisplatin dose
after adjustment of all other variables (treatment time and cell
line) is presented here. Significant elevation (i.e., significant
partial correlation r>0) was determined in Bax (partial r=0.34
at p<0.01) and metallothionein (partial r=0.73 at p<0.001 and
r=0.45 at p<0.001 for RNA and protein, respectively). Second,
unique contribution of treatment duration was analyzed. p53 and
Bcl-2 showed time-dependent increasing trends, r=0.34 at p<0.01
and r=0.63 at p<0.001, respectively. The remaining RNAs are not
dose- or cultivation time-dependent. Despite this fact,
time-dependent analysis of all genes exhibit biphasic relation
(Fig. 3B). Cisplatin dramatically
increases the expression, in particular in first 24 h; up to
60-fold in Bcl-2, 10-fold in p53 and 5-fold in Bax and MT2A genes.
However, after 24 h a plateau in expression is observed. As a
result, the relation of MT RNA and protein shows weak, but
significant positive correlation (r=0.24 at p=0.016).
Apart from gene expression analysis, protein level
of MT was studied (Fig. 3C).
Significant positive correlation was observed between MT protein
and applied cisplatin dose (r=0.59 at p<0.001) and no
correlation was observed in relation to cultivation time.
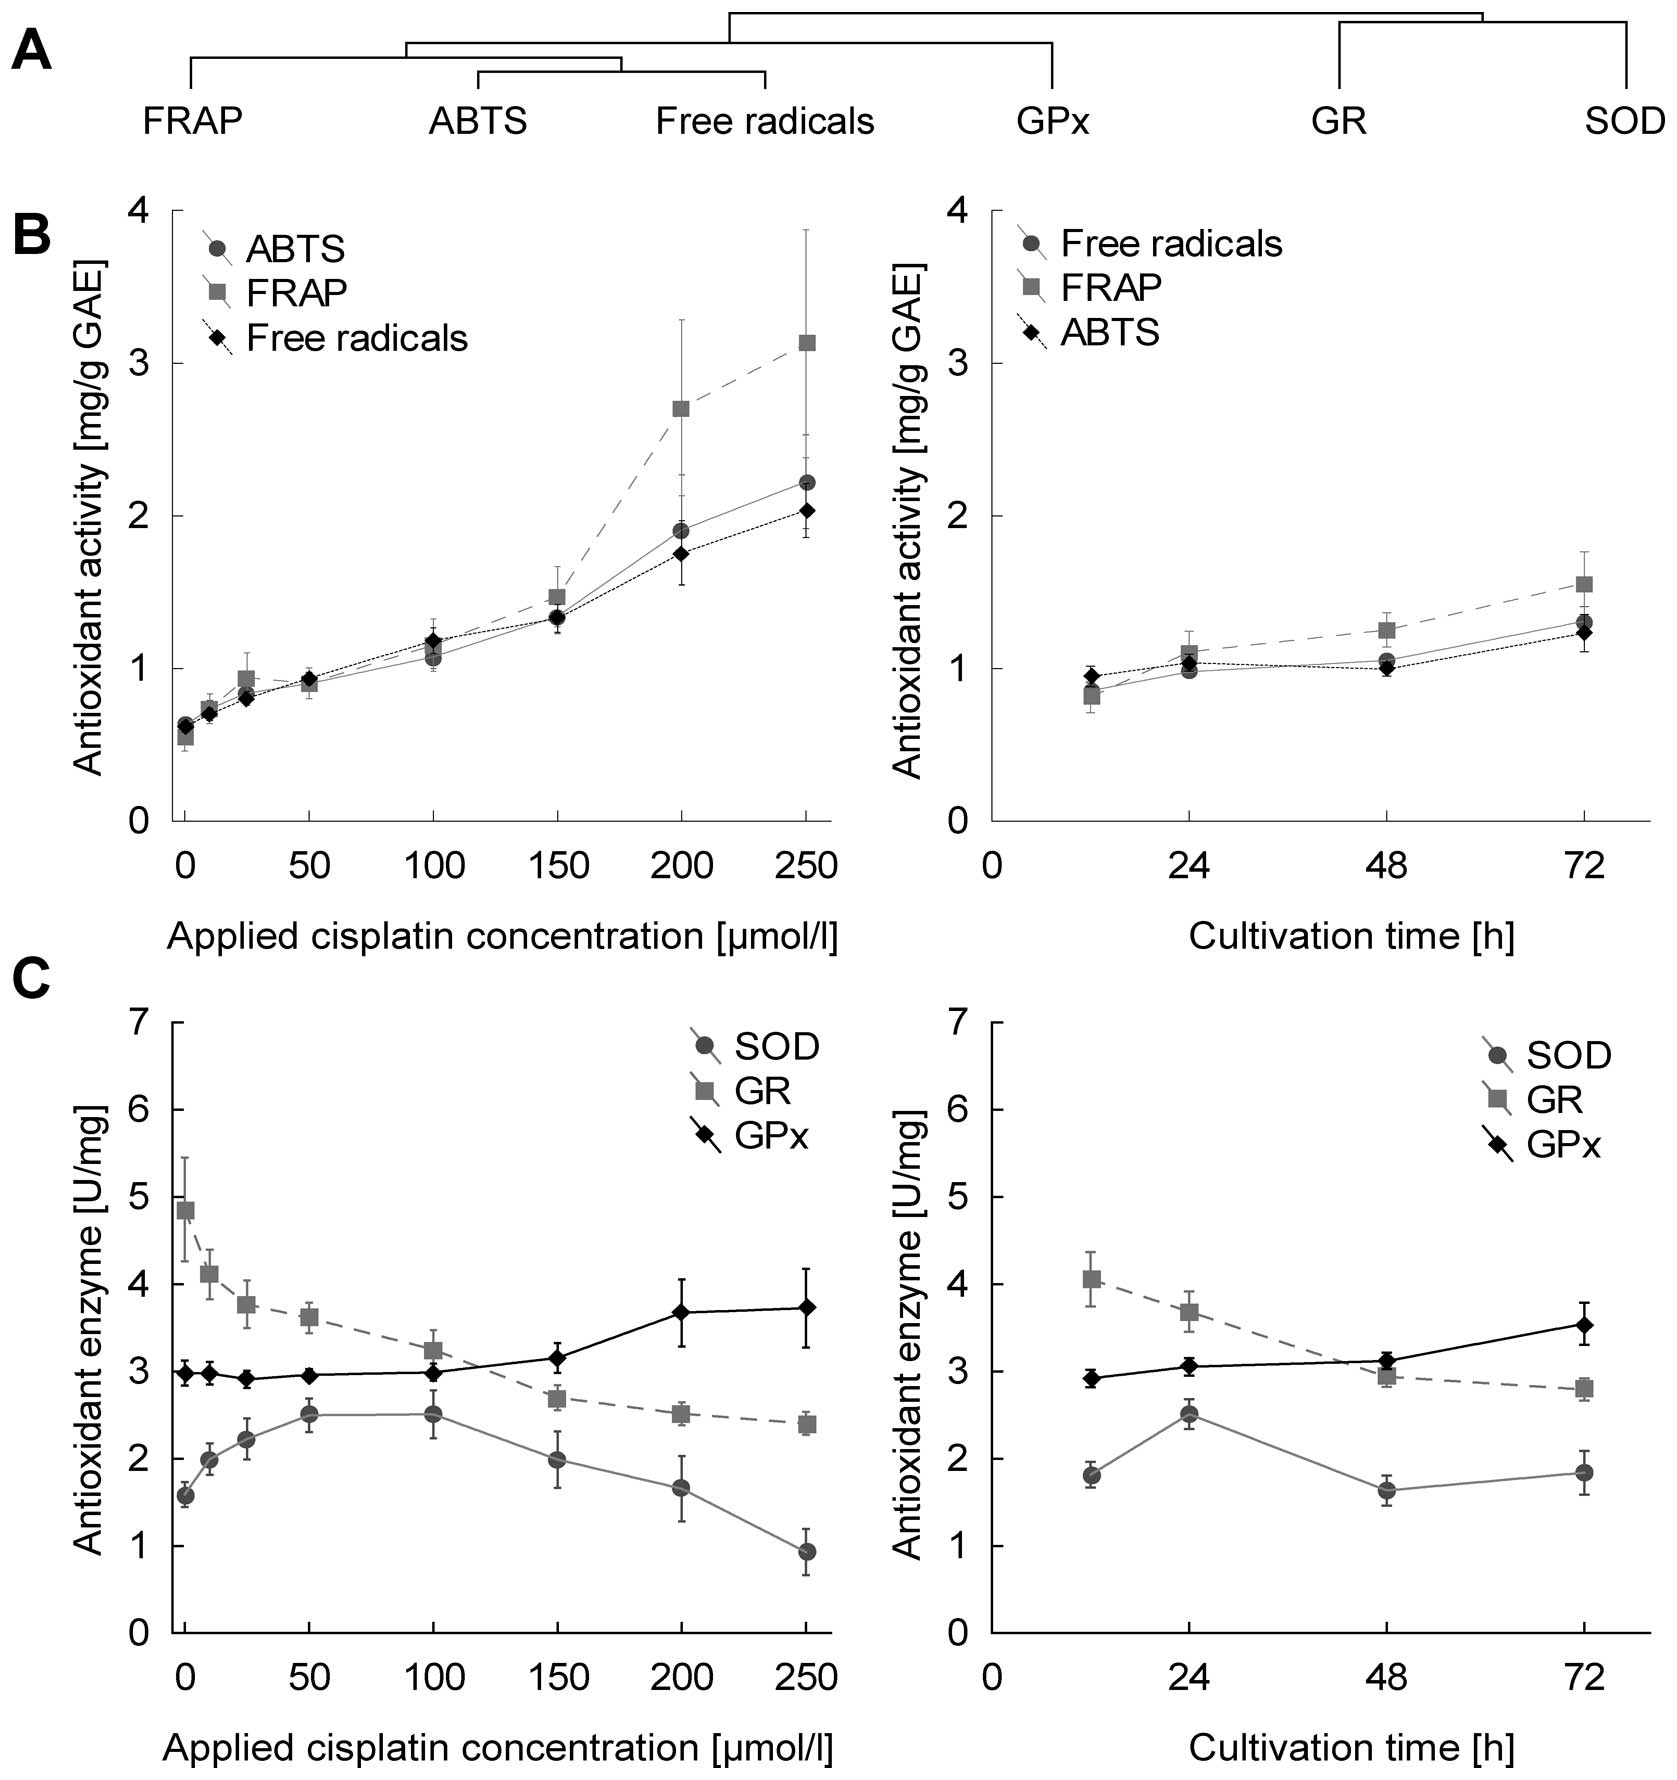
Effect of treatment on antioxidant
capacity
All markers of antioxidant capacity correlate with
each other significantly (data not shown). This is well evident in
Fig. 4B and corresponds to cluster
analysis, where these markers are closely clustered (Fig. 4A). In terms of statistical
significance, all markers of antioxidant capacity increased
significantly in dose-dependent manner, r=0.88, 0.71 and 0.82 for
free radicals, FRAP and ABTS, respectively, at p<0.001. The
duration of treatment affects parameters at lower levels of
significance with r=0.52, 0.36 and 0.26 for free radicals, FRAP and
ABTS (Fig. 4B).
With regard to glutathione-related enzymes,
increasing dose- and time-dependent trend is shown only by
glutathione peroxidase (r=0.34 and 0.36 for concentration and time
at p<0.01), in contrast, glutathione reductase decrease in both
time- and dose-dependent manner (at r=−0.72 for concentration and
r=−0.43 for time at p<0.001). Superoxide dismutase showed no
time- or concentration-dependent trends (Fig. 4C).
Effect of cell lines
Subsequently, the effect of cell lines was analyzed
after adjustment of all other variables. Using Tukey’s test for
homogeneous groups, no significant difference, except in
metallothionein RNA, between cell lines was identified. All other
parameters showed significantly higher/lower trends between cell
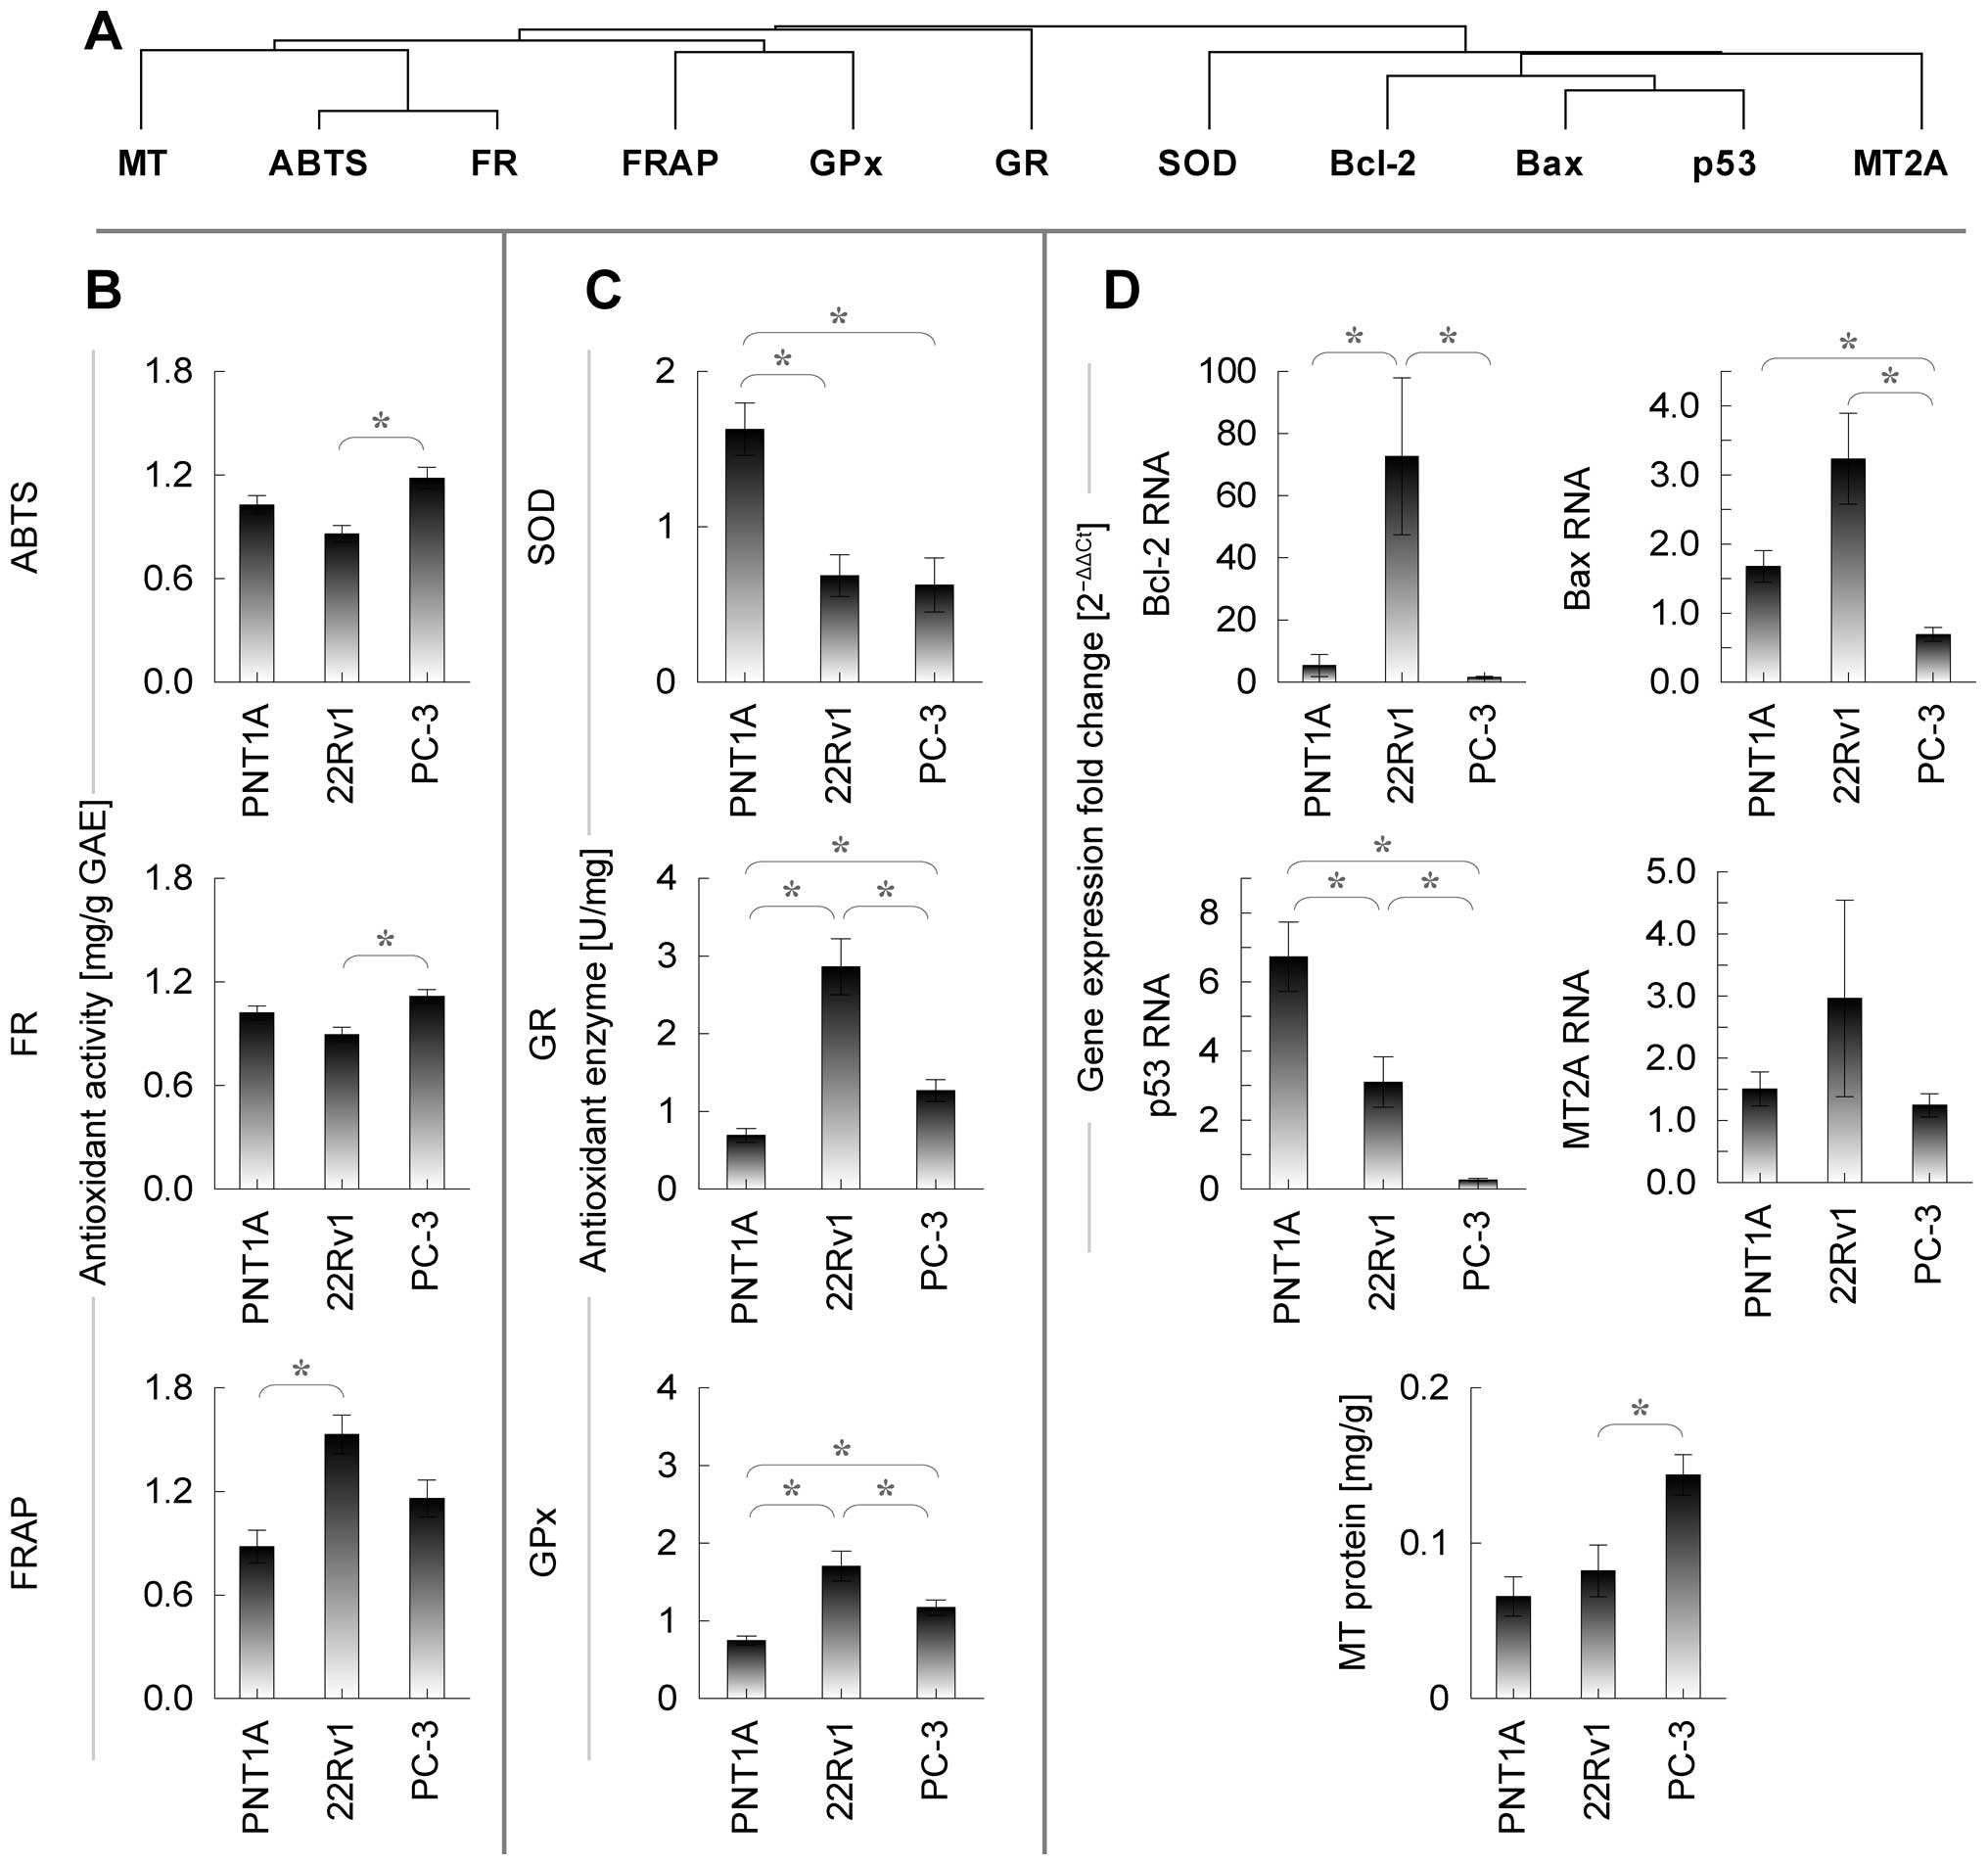
lines to some extent.
To identify similar patterns between cell lines,
cluster analysis was employed, creating two characteristic
branches. The first branch comprises markers of antioxidant
capacity, glutathione-related enzymes and metallothionein, in
contrast, the second branch includes apoptosis-related genes and
SOD (Fig. 5A).
Close similarity is observed between ABTS and FR,
showing significant difference between tumorous cell lines only
(higher in PC-3). MT, similarly to ABTS and FR, shows significant
difference between tumorous lines only. Glutathione peroxidase
shows significant difference between all cell lines, while lowest
level was observed in healthy cell line, thus, showing similarity
to glutathione reductase. Similar trend is observed also in FRAP,
where only PNT1A and 22Rv1 differ significantly.
With regard to apoptosis-related genes and
superoxide dismutase, no difference can be seen in MT mRNA,
significantly increased Bax in PC-3 cell line, significantly
increased SOD in healthy PNT1A, significant difference between all
cell lines in case of p53 (lowest in PC-3, highest in PNT1A) and
significantly increased Bcl-2 in tumorous 22Rv1.
Discussion
This study provides time- and dose-dependent
description of cisplatin-induced changes in antioxidant properties,
apoptosis and cell cycle regulation on prostate cancer cell lines.
These approaches clearly illustrate the development of resistance
in advanced forms of prostate cancer, represented by the PC-3 cell
line.
Cell growth, cell cycle
The results of viability assays distinctly show that
the cytostatic effect of cisplatin is unpredictable in first hours
of treatment, showing low cytotoxic potential, in particular, when
detected using impedance-based method (Fig. 2A). This method provides transient
increase in growth curves in particular in the first 24 h of
treatment. Inasmuch as this detection method is influenced not only
by the number of cells, but also by their size and adhesivity
(16,17) and while these transient changes
cannot be caused by cell count increase in such a short interval,
here we provide evidence of cisplatin-influenced change of cell
morphology and/or adhesivity. The steady state stabilization occurs
between 24–48 h.
Even after stabilization, high level of disagreement
was observed between metabolic-based MTT and impedance-based
viability assays. While MTT test demonstrates the most toxic effect
on ‘aggressive metastatic’ PC-3 cells, impedance-based (cell
amount-, size- and adhesivity-dependent) technique demonstrates, in
contrast, least toxic effects on this cell line (compare MTT- and
impedance-based IC50 values in Table I, Fig.
2). To find an answer for this seemingly conflicting finding it
is appropriate to relate it to the changes in cell cycle and
apoptosis in these cell lines.
PC-3 cells are hemizygous for chromosome 17p, and
their single copy of the p53 gene has a deletion at codon
138 that has caused a frameshift and a new in-frame stop codon at
position 169 (18). As a result,
PC-3 cells do not express p53 protein (19). Our results are in agreement with
these findings (20): level of p53
RNA was almost under the detection limits in PC-3 cell line
(Fig. 4). P53 acts as a tumor
suppressor through the induction of growth arrest and apoptosis
(8). PNT1A cell line, which was
used in this experiment as a non-tumor model, was transfected using
simian virus 40 (SV40) vector. However, SV40 induces T-antigen
expression, which, on the other hand, inhibits the activity of p53
(21). Therefore, cell lines
transfected using this vector have limited predictive value in
terms of p53-dependent effects. Nevertheless, T-antigen p53
inhibition can be disrupted using oxidants (22), including cisplatin. The objective
of the p53 detection in this study was neither to describe subtle
concentration-dependent trends in p53 levels nor to describe
p53-dependent cascades in detail, but rather to demonstrate a
detectable induciblity of p53 expression when exposed to oxidative
stress. The fact that detectable p53 content was determined in
PNT1A under cisplatin load indicates p53-dependent pathways can be
triggered in this cell line. Therefore, PNT1A might be used as
model to study p53-dependent pathways, however, only if exposed to
oxidative stress. The differences between p53-positive and negative
cells are evident in our flow cytometric results: whereas both
p53-expressing cells PNT1A and 22Rv1 show cisplatin-induced cell
cycle changes accompanied by an increased proportion of sub-G1
phase cells, PC-3 cell does not show similar phenomenon (Fig. 2C and D). Similar phenomenon was
demonstrated and linked with cisplatin resistance in non-small cell
lung cancer cell line, for instance (23). It has been repeatedly demonstrated
that apoptosis is the major mechanism for eliminating damaged cells
in cisplatin-induced cells injury (24–26).
Thus, PC-3 cells without functional p53 signaling cascade may
divide and grow when treated with cisplatin or other p53-targeting
cytostatic drug. Because PC-3 is derived from an aggressive
metastatic form of prostate cancer, using the description of the
monitored genes and parameters, this study provides a good model of
cisplatin resistance. In addition, similarly to cisplatin, more
pronounced apoptosis in 22Rv1 compared to PC-3 was observed by
Gravina et al when exposed to 5-azacitine or bicalutamide
(27). Taken together,
contradictory results of MTT assay and an impedance-based method
can be caused by false reduced viability of PC-3, which could be
caused by low metabolic activity of cells in autophagy status. The
main principle of MTT assay is the tetrazolium salt reduction to
formazan, which is quantified photometrically, by mitochondrial
succinate dehydrogenase (SDH). SDH is only active in cells with an
intact metabolism and respiratory chain. Fasting and oxidative
stress, which is present by cisplatin treatment, was associated
with a significant decrease of SDH activity, and the reduction was
proportional with the decrease in the amount of SDH total protein
(28,29). Blocking apoptosis was found to
promote autophagy in PC-3 and DU145 cells (30).
In accordance with this finding, we propose an
impedance-based method as more reliable for growth monitoring of
cytostatic-induced cells. Similar changes between these assays were
reported also in our previous study (31).
Cisplatin effects - model of cisplatin
resistance?
To obtain initial insight into how all the markers
and substances mentioned herein change after the exposure to
cisplatin, 3-axis dependency graphs were visualized and calculated
the simple correlations for each cell line. However, such analysis
provides weak correlations and has limited power to emphasize
complex multi-dimensional relations (Table II). Based on these graphs it is
possible to draw the following conclusions: first, cisplatin
concentration or treatment time clearly results in either increase
or decrease in the levels of detected substances in all cell lines.
Thus, none of the parameters increase in one cell line and decrease
in the other in time- or dose-dependent manner. Second, both time
and concentration cause more or less distinct changes in the levels
of almost all monitored markers and substances. Third, some markers
or substances rather increase, while others decrease, depending on
the time or concentration.
Inasmuch as representation of graphs with their
correlation coefficients would be confusing, statistically
insufficiently powerful and, most importantly, such analysis would
not refer to the obvious connection between the parameters, general
regression model was used to show the effect of cell lines,
concentrations of cisplatin and time of measurement simultaneously.
This method provides benefits of both multiple linear regression
and ANOVA and thus provide a more comprehensive view of all
detected substances together. In this context, we focused on the
identification of the most characteristic parameter for particular
cell line and/or particular cisplatin treatment. Additionally, a
hypothesis was verified, whether all measured markers may be used
to describe cisplatin resistance.
To evaluate the effect of cisplatin concentration,
duration of this cytotoxic effect or combination of these, partial
correlations were calculated after the adjustment of all other
variables. Partial correlations obtained by general regression
model were subsequently compared to initially performed Pearson
correlation results. Because significant trends were found mainly
after adjusting using general regression model and no parameter
correlated only before adjusting (i.e., in Pearson correlations),
it is evident, that just variables ‘concentration’, ‘time’ and
‘cell line’ contribute to elucidate the variability (i.e., affect
the level of detected substances). This manner explained up to 80%
of the variability in data attributing it to the change in
detection time, cisplatin concentration or cell line
(R2=0.80 in ‘free radicals’ method, for instance).
In this context, a hypothesis was formulated,
whether all the measured parameters are rather influenced by the
duration of the stress conditions (treatment time), or by the
stress intensity (drug concentration). Whereas the markers of
antioxidant capacity FRAP, ABTS and FR and GPx increase in dose-
and time-dependent manner, p53 and Bcl-2 are time-dependent and BAX
and MT are dose-dependent only. Interestingly, GR shows a
decreasing time- and concentration-dependence. These findings are
in agreement with what is inherently predictable: the increased p53
level contributes to apoptosis through Bax-cytochrome C
mitochondrial apoptotic pathway by inhibition of Bcl-2 (8,32)
(Fig. 1). As a result of such
balance, Bax level follows analogous trends in dose-, time- and
cell line-dependent manner (Figs.
3 and 5). An agreement with
these findings was observed by Kharaziha et al (33). Agreement with our data was also
provided by Li et al demonstrating a simultaneous increase
in ROS, p53 and caspases in response to another platinum-based
cytostatic drug dicycloplatin (34).
Metallothionein protein level increases with
increasing cisplatin concentration due to its (cisplatin-induced)
reactive-oxygen-species buffering properties. In contrast,
metallothionein is not affected by the duration of cisplatin
treatment due to the fact that the concentration of this drug (and
thus cisplatin-generated oxidative stress) remain relatively stable
after steady state stabilization (Fig.
3). The highest MT levels are determined in an aggressive,
metastasis-derived PC-3 cells. Similar finding was observed by
several research teams (35–37).
These data suggest MT is an important protective mechanism in
cisplatin-induced stress and thus an important mechanism in the
development and progression of cytostatic resistance. Such finding
was already reported (35). No
observed metallothionein RNA-protein match may appear to be a
surprising result. However, it cannot be assumed, that significant
RNA-protein correlation must be present. A pool of metallothionein
capable to buffer limited amounts of oxidative stress is present
more or less in all cells and thus RNA-response may not be apparent
(38,39).
With regard to the activity of enzymes included in
oxidative stress buffering (SOD, GR and GPx), a specific pattern is
observed. Whereas non-tumor cell line shows higher activity of SOD
and lower activity of GR and GPx, tumorous cells show an inverse
trend. When exposed to cisplatin, GPx increases, GR decreases and
SOD does not show any significant trend. The decreasing dose- and
time-dependent trends in glutathione reductase may seem surprising
at first glance. Generally, one would assume that the increase in
oxidative stress will also increase oxidized glutathione and thus
the activity of glutathione reductase. However, cisplatin causes a
depletion of the key components of the mitochondrial antioxidant
defense system, including NADPH (13). Because of NADPH oxidation, GR
activity is expected to decrease. Similar finding with GR and GPx
when treated with cisplatin is reported by Pratibha et al in
a rat model (40). The authors
propose a cisplatin-induced alteration in enzymatic antioxidant
status with an increase in lipid peroxidation indicating that these
enzymes play an important role in combating oxidative stress
induced by free radicals (40).
With regard to markers of antioxidant capacity, it
is worth mentioning that all radical scavenging activity detection
methods correlate, showing an increase after cisplatin treatment.
More pronounced increase is observed in tumorous cell lines
particularly in the PC-3. These data suggest an increased ability
of tumorous cells to cope with such conditions. There is no
evidence on using these methods to describe antioxidant capacity on
prostate cancer cell lines. This finding, together with elevated
MT, decreased p53 and Bax suggest that the PC-3 cell line has
unique features to cope with stress conditions and thus to be
resistant to natural regulatory mechanisms such as apoptosis and
cell cycle arrest and to stress cytostatics. Thus, this cell line
may further be utilized as a model of cytostatic resistance, and
markers and substances detected herein illustrate resistance
development as well.
In this study, the cell-growth, cell cycle,
apoptosis and oxidative stress-related methods were analyzed to
describe the development of cisplatin resistance in prostate
cancer. In p53-defective PC-3 cells no cisplatin-induced cell cycle
arrest and reduced apoptosis was observed. In addition, higher free
radical scavenging activity and higher metallothionein was observed
in these cells. In contrast to impedance-based real-time cell
growth analysis, reduced MTT-based viability suggests reduced
metabolic activity and thus cells are expected to turn to
autophagy. Thus, we propose an impedance-based method as more
reliable for growth monitoring of cytostatic-treated cells.
Taken together, results of this study clearly
illustrate, that the prostate cancer cell line PC-3 shows signs of
resistance to cytostatics accompanied by an increase in antioxidant
capacity, by increased metallothionein expression, by inhibition of
cell cycle arrest, and by decreased expression of proapoptic genes.
Therefore, PC-3 cell line may be used for further analyses as a
model for cytostatic resistance as well as protocols used in this
study. However, precise mechanisms affecting the orientation of
cells toward autophagy or apoptosis are open topics for further
research.
Acknowledgements
The authors gratefully acknowledge
financial support from the following projects: the Grant Agency of
the Czech Republic (CYTORES GA CR P301/10/0356), Center of
Experimental Biomedicine (CZ.1.07/2.3.00/20.0183) and the Central
European Institute of Technology (CEITEC
CZ.1.05/1.1.00/02.0068).
References
|
1.
|
Gonzalez VM, Fuertes MA, Alonso C and
Perez JM: Is cisplatin-induced cell death always produced by
apoptosis? Mol Pharmacol. 59:657–663. 2001.PubMed/NCBI
|
|
2.
|
Kartalou M and Essigmann JM: Mechanisms of
resistance to cisplatin. Mutat Res. 478:23–43. 2001. View Article : Google Scholar : PubMed/NCBI
|
|
3.
|
Niedner H, Christen R, Lin X, Kondo A and
Howell SB: Identification of genes that mediate sensitivity to
cisplatin. Mol Pharmacol. 60:1153–1160. 2001.PubMed/NCBI
|
|
4.
|
Herraez E, Gonzalez-Sanchez E, Vaquero J,
et al: Cisplatin-induced chemoresistance in colon cancer cells
involves FXR-dependent and FXR-independent up-regulation of ABC
proteins. Mol Pharm. 9:2565–2576. 2012. View Article : Google Scholar : PubMed/NCBI
|
|
5.
|
Liu YB, Bernauer AM, Yingling CM and
Belinsky SA: HIF1 alpha regulated expression of XPA contributes to
cisplatin resistance in lung cancer. Carcinogenesis. 33:1187–1192.
2012. View Article : Google Scholar : PubMed/NCBI
|
|
6.
|
Wu YC, Ling TY, Lu SH, et al:
Chemotherapeutic sensitivity of testicular germ cell tumors under
hypoxic conditions is negatively regulated by SENP1-controlled
sumoylation of OCT4. Cancer Res. 72:4963–4973. 2012. View Article : Google Scholar : PubMed/NCBI
|
|
7.
|
Skjoth IHE and Issinger OG: Profiling of
signaling molecules in four different human prostate carcinoma cell
lines before and after induction of apoptosis. Int J Oncol.
28:217–229. 2006.PubMed/NCBI
|
|
8.
|
Faria MHG, Neves EHC, Alves MKS, Burbano
RMR, De Moraes MO and Rabenhorst SHB: TP53 mutations in astrocytic
gliomas: an association with histological grade, TP53 codon 72
polymorphism and p53 expression. APMIS. 120:882–889. 2012.
View Article : Google Scholar : PubMed/NCBI
|
|
9.
|
Fuertes MA, Alonso C and Perez JM:
Biochemical modulation of cisplatin mechanisms of action:
enhancement of antitumor activity and circumvention of drug
resistance. Chem Rev. 103:645–662. 2003. View Article : Google Scholar : PubMed/NCBI
|
|
10.
|
Righetti SC, Perego P, Carenini N, et al:
Molecular alterations of cells resistant to platinum drugs: role of
PKC alpha. Biochim Biophys Acta. 1763:93–100. 2006. View Article : Google Scholar : PubMed/NCBI
|
|
11.
|
Brozovic A, Ambriovic-Ristov A and Osmak
M: The relationship between cisplatin-induced reactive oxygen
species, glutathione, and BCL-2 and resistance to cisplatin. Crit
Rev Toxicol. 40:347–359. 2010. View Article : Google Scholar : PubMed/NCBI
|
|
12.
|
Santos NAG, Catao CS, Martins NM, Curti C,
Bianchi MLP and Santos AC: Cisplatin-induced nephrotoxicity is
associated with oxidative stress, redox state unbalance, impairment
of energetic metabolism and apoptosis in rat kidney mitochondria.
Arch Toxicol. 81:495–504. 2007. View Article : Google Scholar
|
|
13.
|
Martins NM, Santos NAG, Curti C, Bianchi
MLP and Santos AC: Cisplatin induces mitochondrial oxidative stress
with resultant energetic metabolism impairment, membrane
rigidification and apoptosis in rat liver. J Appl Toxicol.
28:337–344. 2008. View
Article : Google Scholar
|
|
14.
|
Kizek R, Trnkova L and Palecek E:
Determination of metallothionein at the femtomole level by constant
current stripping chronopotentiometry. Anal Chem. 73:4801–4807.
2001. View Article : Google Scholar : PubMed/NCBI
|
|
15.
|
Sochor J, Ryvolova M, Krystofova O, et al:
Fully automated spectrometric protocols for determination of
antioxidant activity: advantages and disadvantages. Molecules.
15:8618–8640. 2010. View Article : Google Scholar : PubMed/NCBI
|
|
16.
|
Quereda JJ, Martinez-Alarcon L, Mendoca L,
et al: Validation of xCELLigence real-time cell analyzer to assess
compatibility in xenotransplantation with pig-to-baboon model.
Transplant Proc. 42:3239–3243. 2010. View Article : Google Scholar : PubMed/NCBI
|
|
17.
|
Vistejnova L, Dvorakova J, Hasova M, et
al: The comparison of impedance-based method of cell proliferation
monitoring with commonly used metabolic-based techniques.
Neuroendocrinol Lett. 30:121–127. 2009.PubMed/NCBI
|
|
18.
|
Carroll AG, Voeller HJ, Sugars L and
Gelmann EP: p53 oncogene mutations in 3 human prostate-cancer
cell-lines. Prostate. 23:123–134. 1993. View Article : Google Scholar : PubMed/NCBI
|
|
19.
|
Rubin SJ, Hallahan DE, Ashman CR, et al: 2
prostate carcinoma cell-lines demonstrate abnormalities in tumor
suppressor genes. J Surg Oncol. 46:31–36. 1991. View Article : Google Scholar
|
|
20.
|
Sztalmachova M, Hlavna M, Gumulec J, et
al: Effect of zinc(II) ions on the expression of pro- and
anti-apoptotic factors in high-grade prostate carcinoma cells.
Oncol Rep. 28:806–814. 2012.PubMed/NCBI
|
|
21.
|
Schmieg FI and Simmons DT:
Characterization of the in vitro interaction between SV40 T-antigen
and p53: mapping the p53 binding-site. Virology. 164:132–140. 1988.
View Article : Google Scholar : PubMed/NCBI
|
|
22.
|
Gonin S, Diaz-Latoud C, Richard MJ, et al:
p53/T-antigen complex disruption in T-antigen transformed NIH3T3
fibroblasts exposed to oxidative stress: correlation with the
appearance of a Fas/APO-1/CD95 dependent, caspase independent,
necrotic pathway. Oncogene. 18:8011–8023. 1999. View Article : Google Scholar
|
|
23.
|
Barr MP, Gray SG, Hoffmann AC, et al:
Generation and characterisation of cisplatin-resistant non-small
cell lung cancer cell lines displaying a stem-like signature. Plos
One. 8:1–19. 2013.PubMed/NCBI
|
|
24.
|
Liu J, Liu YP, Habeebu SSM and Klaassen
CD: Metallothionein (MT)-null mice are sensitive to
cisplatin-induced hepatotoxicity. Toxicol Appl Pharmacol.
149:24–31. 1998. View Article : Google Scholar : PubMed/NCBI
|
|
25.
|
Siddik ZH: Cisplatin: mode of cytotoxic
action and molecular basis of resistance. Oncogene. 22:7265–7279.
2003. View Article : Google Scholar : PubMed/NCBI
|
|
26.
|
Wang D and Lippard SJ: Cellular processing
of platinum anti-cancer drugs. Nat Rev Drug Discov. 4:307–320.
2005. View Article : Google Scholar
|
|
27.
|
Gravina GL, Marampon F, Di Staso M, et al:
5-Azacitidine restores and amplifies the bicalutamide response on
preclinical models of androgen receptor expressing or deficient
prostate tumors. Prostate. 70:1166–1178. 2010. View Article : Google Scholar
|
|
28.
|
Aitken RJ, Whiting S, De Iuliis GN,
McClymont S, Mitchell LA and Baker MA: Electrophilic aldehydes
generated by sperm metabolism activate mitochondrial reactive
oxygen species generation and apoptosis by targeting succinate
dehydrogenase. J Biol Chem. 287:33048–33060. 2012. View Article : Google Scholar
|
|
29.
|
Komatsu M, Waguri S, Ueno T, et al:
Impairment of starvation-induced and constitutive autophagy in
Atg7-deficient mice. J Cell Biol. 169:425–434. 2005. View Article : Google Scholar : PubMed/NCBI
|
|
30.
|
Cao C, Subhawong T, Albert JM, et al:
Inhibition of mammalian target of rapamycin or apoptotic pathway
induces autophagy and radiosensitizes PTEN null prostate cancer
cells. Cancer Res. 66:10040–10047. 2006. View Article : Google Scholar : PubMed/NCBI
|
|
31.
|
Masarik M, Gumulec J, Hlavna M, et al:
Monitoring of the prostate tumour cells redox state and real-time
proliferation by novel biophysical techniques and fluorescent
staining. Integr Biol. 4:672–684. 2012. View Article : Google Scholar : PubMed/NCBI
|
|
32.
|
Kuwana T and Newmeyer DD: Bcl-2-family
proteins and the role of mitochondria in apoptosis. Curr Opin Cell
Biol. 15:691–699. 2003. View Article : Google Scholar : PubMed/NCBI
|
|
33.
|
Kharaziha P, Rodriguez P, Li Q, et al:
Targeting of distinct signaling cascades and cancer-associated
fibroblasts define the efficacy of Sorafenib against prostate
cancer cells. Cell Death Dis. 3:1–10. 2012. View Article : Google Scholar : PubMed/NCBI
|
|
34.
|
Li GQ, Chen XG, Wu XP, et al: Effect of
dicycloplatin, a novel platinum chemotherapeutical drug, on
inhibiting cell growth and inducing cell apoptosis. Plos One.
7:1–13. 2012.PubMed/NCBI
|
|
35.
|
Kondo Y, Kuo SM, Watkins SC and Lazo JS:
Metallothionein localization and cisplatin resistance in human
hormone-independent prostatic tumor-cell lines. Cancer Res.
55:474–477. 1995.PubMed/NCBI
|
|
36.
|
Suzuki Y, Kondo Y, Himeno S, Nemoto K,
Akimoto M and Imura N: Role of antioxidant systems in human
androgen-independent prostate cancer cells. Prostate. 43:144–149.
2000. View Article : Google Scholar : PubMed/NCBI
|
|
37.
|
Yamasaki M, Nomura T, Sato F and Mimata H:
Metallothionein is up-regulated under hypoxia and promotes the
survival of human prostate cancer cells. Oncol Rep. 18:1145–1153.
2007.PubMed/NCBI
|
|
38.
|
Costello LC, Fenselau CC and Franklin RB:
Evidence for operation of the direct zinc ligand exchange mechanism
for trafficking, transport, and reactivity of zinc in mammalian
cells. J Inorg Biochem. 105:589–599. 2011. View Article : Google Scholar : PubMed/NCBI
|
|
39.
|
Bell SG and Vallee BL: The
metallothionein/thionein system: an oxidoreductive metabolic zinc
link. Chembiochem. 10:55–62. 2009. View Article : Google Scholar : PubMed/NCBI
|
|
40.
|
Pratibha R, Sameer R, Rataboli PV,
Bhiwgade DA and Dhume CY: Enzymatic studies of cisplatin induced
oxidative stress in hepatic tissue of rats. Eur J Pharmacol.
532:290–293. 2006. View Article : Google Scholar : PubMed/NCBI
|