Introduction
Rhabdomyosarcoma (RMS) is a rare form of cancer with
an incidence of 0.50 per 100,000 in children 0–14 years old, and
0.23 per 100,000 for the overall population in 2010 according to
Surveillance, Epidemiology, and End Results (SEER) statistics
(1). RMS is commonly seen in
children and adolescents and accounts for 3% of all pediatric
tumors (2). The median age at
diagnosis is only ~5 years. RMS originates from striated muscle
cells or their mesenchymal precursors (3). Because of this origin in embryonic
mesenchyme, RMS can arise anywhere in the body.
Survival has been improved greatly with
multidisciplinary management including surgery and multiagent
chemotherapy with or without radiation. Since 1972, the Intergroup
Rhabdomyosarcoma Study Group (IRSG) has conducted a series of
clinical trials aimed at improving survival, and has published a
series of treatment guidelines for different primary sites. Such
efforts have resulted in significant improvements in prognosis,
with a cure rate of ~70% for localized RMS among children and
adolescents (4). The 5-year
overall survival (OS) rate for patients with RMS has increased from
approximately 35% in the 1970s to ~50% in the 2000s, according to
SEER statistics (1).
Surgery is an important component of the local
management of RMS. The goal of surgery is not only to remove the
tumor, but also to help determine risk stratification in the form
of surgical-pathological group, stage, histology and age at initial
diagnosis.
Multi-agent chemotherapy is required in the
treatment of all patients with RMS to decrease the chance of
relapse. Vincristine, dactinomycin and cyclophosphamide (VAC)
represent the backbone of chemotherapy. Variations on VAS depends
on the clinical group and site of disease based on the results of
the Intergroup RMS studies (5).
Radiotherapy is another critical component of
multimodal management for patients with RMS. Adjuvant radiotherapy
is recommended for patients with microscopically positive margins
or gross residual disease after surgery or distant metastases on
initial diagnosis, and for all patients with alveolar histology
according to the IRSG (6,7).
With improving survival, there is increasing
recognition of the late sequelae of treatment among long-term
survivors of childhood cancer (8).
Many of these late sequelae relate to local therapy. Systematically
using radiotherapy as a primary treatment for RMS might increase
the rate of local control, but can result in important long-term
problems, particularly in very young children (9).
In addition, analyses of data from the Cooperative
Soft Tissue Sarcoma Study Group (CWS)-81, -86, -91 and -96 trials
have indicated that although radiotherapy improved local control in
patients with microscopically positive margins after surgery,
radiotherapy did not improve OS except in patients with unfavorable
histology (10). Studies comparing
the Malignant Mesenchymal Tumors (MMT) 89 trial with other clinical
studies have shown similar results (11,12).
The MMT trials were designed to reduce local treatment using
initial front-line chemotherapy followed by second-line therapy in
patients with poor response. Subsequent surgical resection was
preferred over radiotherapy. Radiation was used only after
incomplete resection, documented regional lymph node involvement or
poor clinical response to initial chemotherapy. Although event-free
survival in the MMT-89 was significantly lower than in other
studies, OS rate was consistent with the results of other
collaborative groups, with a 5-year survival rate of 71% (13). These results imply that the local
control benefits from radiotherapy may not translate into improved
long-term survival in some subgroups. Toxic death, secondary
leukemia and relapse beyond the local site may affect OS in
patients with adjuvant radiotherapy. The decision on whether to
administer radiotherapy after surgery thus represents a challenge
for the radiologist and pediatrician.
The aim of this study was to provide a decision aid
to the clinician that can give an individual estimation of the
prognostic benefit of adjuvant radiotherapy, to facilitate the
decision of whether adjuvant radiotherapy is appropriate. To
achieve this objective, we constructed a prognostic model using a
cohort derived from SEER, a population-based database. We also
developed nomograms based on the model we built to predict the
benefit of adjuvant radiotherapy for patients with RMS.
Materials and methods
Data source and study population
The study cohort was obtained from the registry of
the SEER program of the National Cancer Institute (14). The SEER program collects
information on incidence, prevalence and survival. Currently,
registry in SEER covers approximately 28% of the US population, and
the characteristics of the SEER population are comparable with the
general US population (1).
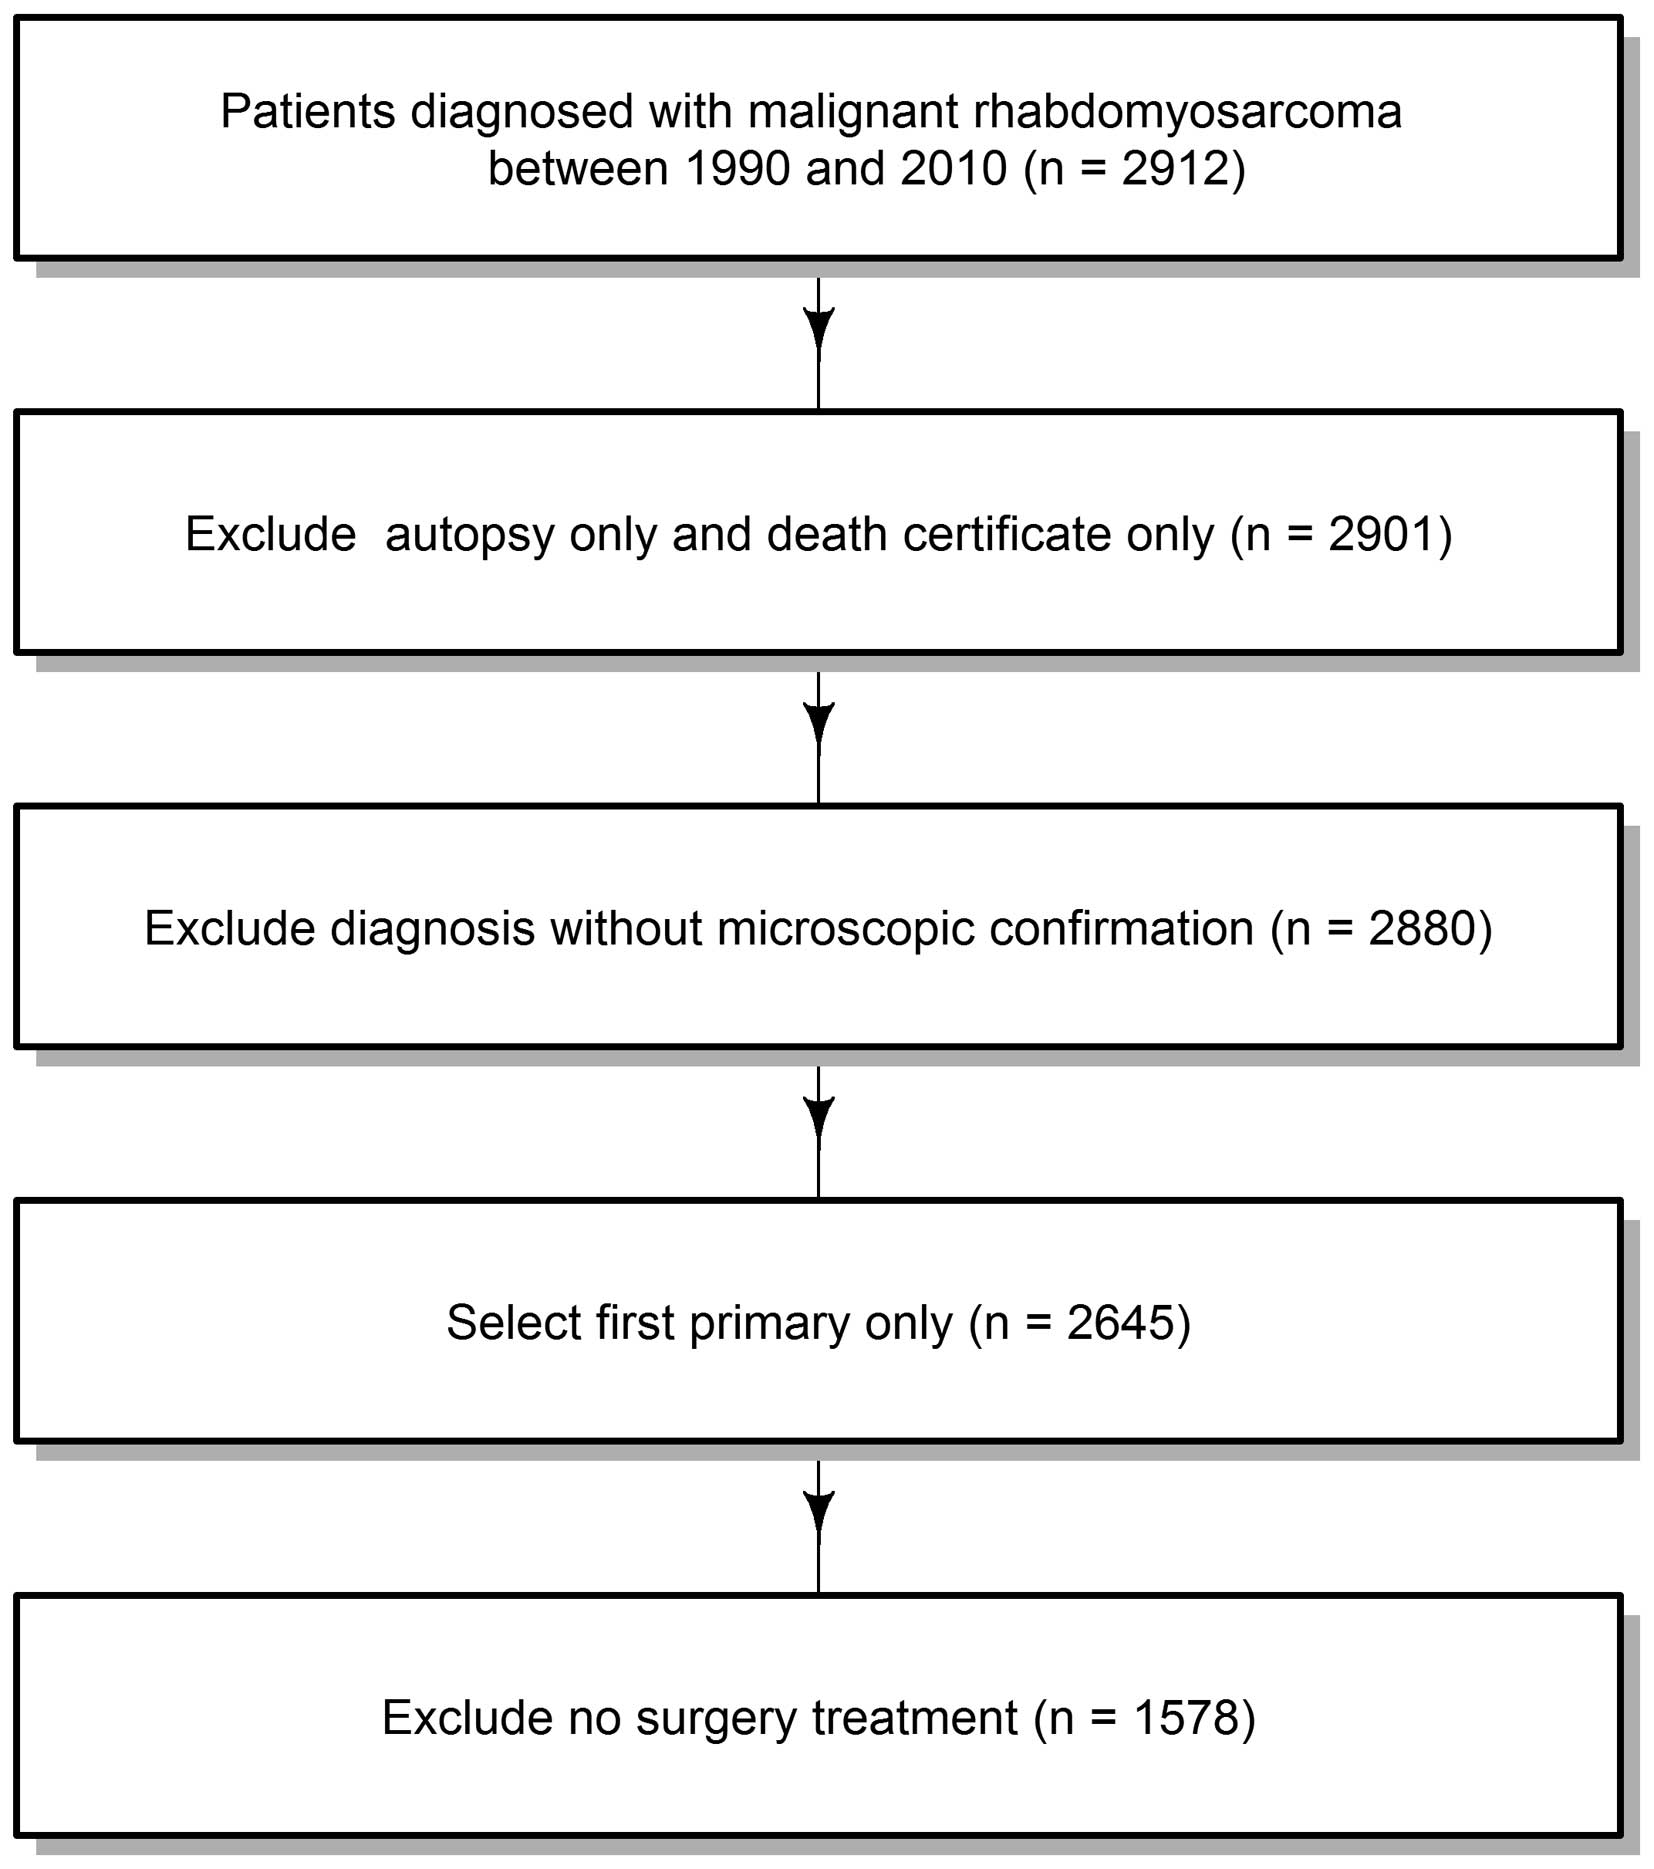
The study population comprised all patients with a
diagnosis of RMS between 1990 and 2010. Patients eligible for this
analysis with ICO-O-3 morphology codes comprised: i) RMS not
otherwise specified 8900/3; ii) pleomorphic RMS adult-type 8901/3;
iii) mixed-type RMS 8902/3; iv) embryonal RMS 8910/3; v)
spindle-cell RMS 8912/3; vi) alveolar RMS 8920/3; and vii)
embryonal sarcoma 8991/3. Only patients diagnosed with the first
primary malignant tumor were included in this study. Patients
diagnosed at autopsy or by death certificate only and patients with
no microscopic confirmation of the diagnosis were excluded. After
applying the exclusion criteria, the study population comprised
1578 patients with RMS. The flow chart for data selection is shown
in Fig. 1.
Demographic and clinical characteristics
in analysis
Demographic variables in the analyses included age
at diagnosis, gender and race. Age at diagnosis was assessed as a
categorical variable in the description of variables and the
calculation of cause-specific survival (CS). In other analyses, age
at diagnosis was treated as a continuous variable. Clinical
characteristics in the analysis included tumor site, histological
subtype, tumor stage, tumor size, positive regional nodes and
radiotherapy. Tumor site was collapsed to favorable and unfavorable
sites according to the criteria for the staging of pediatric tumors
(15).
The head and neck (non-parameningeal), genitourinary
(non-bladder/prostate) and bile duct regions were defined as
favorable sites. All other sites were regarded as unfavorable, and
‘unknown’ was regarded as missing. We used ‘SEER Historic Stage A’
to define tumor stage. ‘Localized’ was defined as a tumor confined
entirely within the organ of origin. ‘Regional’ was defined as a
neoplasm that had extended beyond the limits of the organ of origin
directly into surrounding organs or tissues, or into regional lymph
nodes by way of the lymphatic system, or by a combination of
extension and regional lymph nodes. ‘Distant’ was defined as a
tumor that had spread to parts of the body remote from the primary
tumor either by direct extension or by discontinuous metastasis
(14). Tumor size was truncated at
30 cm. Tumor size was divided into categories for both character
description and calculation of CS.
In other modeling processes, size was treated as a
continuous variable. Histology was classified as embryonal,
alveolar, pleomorphic and other histological subtypes. Histology
with RMS not otherwise specific (NOS) were treated as missing
values. Positive regional nodes were grouped into ‘pathologic node
negative’, ‘1–3 positive nodes’, ‘≥4 positive nodes’ and ‘no nodes
examined’. Radiation treatment was defined by SEER Item
‘RX-Summ-Radiation’ with codes of 0 and 7 as no radiation and 1–6
as radiotherapy. Other codes (8 and 9) were regarded as missing
values.
Statistical methods
Missing values were imputed with the ‘transcan’
function provided from the rms package (16). Patients in the cohort were followed
until: i) death; ii) last contact if before December 31, 2010; and
iii) December 31, 2010, if the date of last contact was after
December 31, 2010. Death from RMS was chosen as an end point. The
Kaplan-Meier (KM) product-limited method was used to estimate CS,
and the log-rank test was used to examine differences in survival
between patient groups.
We used an inverse-probability weighting (IPW) with
propensity scores method to balance observed covariates between
treatment and observation groups (17). IPW can reduce treatment selection
bias in nonrandomized observational studies. To obtain propensity
scores, a logistic regression model was fitted in which treatment
status was regressed on the baseline characteristics. Prior
research for propensity score suggests that it is preferable to
include either variables affecting the outcome, or variables
affecting both treatment selection and outcome (18). We weighted the entire study cohort
with inverse probability of treatment weights obtained from the
propensity score. If Z denotes treatment status (0 or 1) and e
denotes the estimated propensity score, IPW is defined by Z/e +
(1-Z)/(1-e).
A multivariate Cox proportional hazard model was
built to model CS. Covariates included in the prediction model were
chosen based on known clinically prognostic factors and
availability in the SEER registry. To allow flexibility in
representing nonlinear covariate effects on outcomes, we fitted the
restricted cubic splines with three knots at the 10, 50 and 90%
empirical quantiles for the variables of age at diagnosis and tumor
size. Interaction terms between radiotherapy and positive regional
nodes, histological subtype and stage were pre-specified in the
model. The proportional hazard assumption was verified by examining
residual plots. To avoid overfitting of the model, we used a model
selection technique with the Akaike information criterion (AIC) to
reduce variables in the model. A nomogram was then created with the
beta coefficients of variables in the reduced model.
The prognostic prediction model was internally
validated by evaluating both calibration and discrimination.
Discriminating was measured using the concordance index (c-index)
(19). A c-index of 0.5 indicates
a random predictor, while 1.0 indicates a perfect predictor.
Calibration represents the ability of a model to make unbiased
estimates of outcome. A perfectly accurate nomogram would result in
a plot where predictions should fall along a 45° diagonal line.
Both discrimination and calibration were evaluated using
bootstrapping with 200 resamples.
All statistical analyses were performed using R
version 3.0.0 software (Institute for Statistics and Mathematics,
Vienna, Austria; www.r-project.org) (20). The R package rms was used for
modeling and establishing the nomogram (16). All statistical tests were
two-sided, and values of P<0.05 were considered statistically
significant.
Results
Patient characteristics
A total 1578 patients met the inclusion criteria and
were included in the study. Demographic and tumor characteristics
are listed in Table I. In this
cohort, embryonal subtype was present in 51.0% of all patients.
SEER stage was localized in 42.9% of patients, regional in 36.9%
and distant in 20.2%. More than half (52.0%) of patients had
received radiotherapy.
 | Table IPatient demographics and
cause-specific survival. |
Table I
Patient demographics and
cause-specific survival.
| | 5-year | 10-year | |
|---|
| |
|
| |
|---|
| Characteristics | No. (events) | CS% (95% CI) | CS% (95% CI) | P-value |
|---|
| Entire cohort | 1578 (513) | 64.3 (61.7–66.9) | 61.4 (58.7–64.2) | |
| Age (years) |
| <2 | 157 (34) | 77.4 (70.1–85.2) | 73.7 (66.0–82.3) | <0.001 |
| 2–5 | 309 (51) | 82.7 (78.2–87.5) | 79.8 (74.8–85.1) | |
| 6–11 | 232 (48) | 77.4 (71.5–83.7) | 73.2 (66.8–80.4) | |
| 12–17 | 226 (68) | 66.4 (59.9–73.5) | 64.7 (58.0–72.1) | |
| 18–44 | 303 (134) | 52.7 (47.0–59.2) | 48.8 (42.9–55.6) | |
| 45–64 | 180 (87) | 45.1 (37.7–54.0) | 45.1 (37.7–54.0) | |
| ≥65 | 171 (91) | 36.7 (29.1–46.2) | 33.4 (24.8–44.9) | |
| Size (cm) | | | | <0.001 |
| <5 | 594 (109) | 80.2 (76.7–83.8) | 77.5 (73.7–81.5) | |
| 5–9 | 537 (174) | 64.2 (59.8–68.9) | 60.3 (55.6–65.3) | |
| ≥10 | 447 (230) | 42.2 (37.4–47.7) | 40.2 (35.3–45.8) | |
| Gender | | | | 0.08 |
| Male | 914 (283) | 66.2
(62.9–69.7) | 63.1
(59.6–66.8) | |
| Female | 664 (230) | 61.5
(57.6–65.8) | 59.0
(54.8–63.4) | |
| Race | | | | 0.98 |
| White | 1192 (387) | 64.7
(61.8–67.7) | 61.2
(58.1–64.5) | |
| Black | 254 (83) | 62.7
(56.5–69.6) | 62.7
(56.5–69.6) | |
| Others | 132 (43) | 63.0
(54.2–73.3) | 60.2
(51.2–70.9) | |
| Site | | | | <0.001 |
| Unfavorable | 940 (358) | 57.9
(54.5–61.5) | 54.2
(50.6–58.1) | |
| Favorable | 638 (155) | 73.3
(69.6–77.1) | 71.5
(67.7–75.5) | |
| Stage | | | | <0.001 |
| Localized | 677 (130) | 78.7
(75.4–82.3) | 75.7
(72.0–79.6) | |
| Regional | 583 (184) | 65.7
(61.5–70.1) | 62.3
(57.9–67.0) | |
| Distant | 318 (199) | 31.2
(26.0–37.3) | 29.4
(24.3–35.6) | |
| Histology | | | | <0.001 |
| Embryonal | 806 (196) | 73.4
(70.1–76.8) | 71.1
(67.6–74.7) | |
| Alveolar | 356 (146) | 55.4
(49.9–61.4) | 51.1
(45.4–57.4) | |
| Pleomorphic | 258 (125) | 44.6
(38.3–51.9) | 43.2
(36.6–50.9) | |
| Others | 158 (46) | 69.2
(61.5–77.8) | 63.1
(54.4–73.2) | |
| Positive regional
nodes | | | | <0.001 |
| Pathologic node
negative | 328 (80) | 75.0
(70.1–80.4) | 69.0
(63.1–75.4) | |
| 1–3 positive
nodes | 103 (35) | 62.0
(52.5–73.2) | 60.4
(50.8–71.8) | |
| ≥4 positive
nodes | 25 (13) | 44.5
(27.4–72.4) | 39.0
(22.4–67.7) | |
| No nodes
examined | 1122 (385) | 61.7
(58.7–65.0) | 59.6
(56.5–63.0) | |
| Treatment | | | | 0.01 |
| Surgery alone | 757 (260) | 62.3
(58.6–66.2) | 59.8
(55.9–63.9) | |
| Adjuvant RT | 821 (253) | 66.1
(62.6–69.8) | 62.9
(59.2–66.8) | |
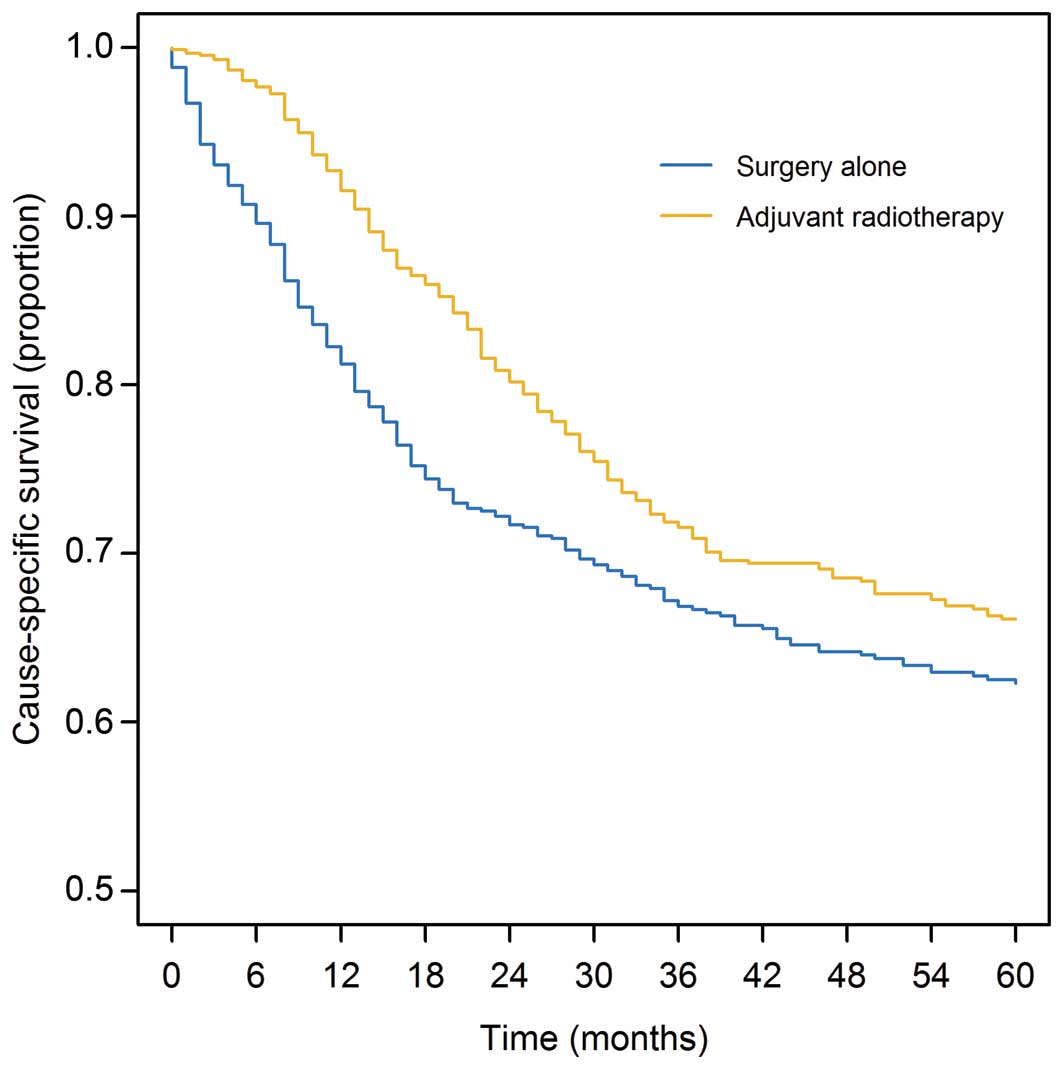
The 5-year CS rate was 64.3% (95% CI, 61.7–66.9%)
and 10-year CS rate was 61.4% (95% CI, 58.7–64.2%) for the entire
cohort. Five- and 10-year CS rates by characteristic are shown in
Table I. Five-year CS rates were
62.3% (95% CI, 58.6–66.2%) and 66.1% (95% CI, 62.6–69.8%) for
patients with surgery alone and adjuvant radiotherapy, respectively
(P<0.01) (Fig. 2).
Multivariate regression model and
nomograms
Of the total 1578 patients, 821 patients (52%)
received adjuvant radiotherapy. Table
II shows a comparison of baseline characteristics between
patients who received adjuvant radiotherapy and those who did not.
Compared with the untreated group, the treated group included more
patients with unfavorable site, positive regional nodes, alveolar
histological type and non-localized stage. After propensity score
weighting, all variables were balanced, and significant differences
in distributions of variables between treated and untreated groups
disappeared.
| Table IIPatient characteristics before and
after propensity score weighting to balance covariates between
surgery alone and adjuvant radiation groups. |
Table II
Patient characteristics before and
after propensity score weighting to balance covariates between
surgery alone and adjuvant radiation groups.
| Original | PS-weighted |
|---|
|
|
|
|---|
|
Characteristics | Surgery alone | ART | P-value | Surgery alone | ART | P-value |
|---|
| Mean, age
(years) | 26.6 | 21.3 | <0.001 | 23.8 | 24.0 | 0.79 |
| Mean, size
(mm) | 88.2 | 70.8 | <0.001 | 78.9 | 79.0 | 0.98 |
| Gender (%) | | | 0.80 | | | 0.88 |
| Male | 58.3 | 57.6 | | 58.6 | 58.9 | |
| Female | 41.7 | 42.4 | | 41.4 | 41.1 | |
| Race (%) | | | 0.11 | | | 1.00 |
| White | 76.5 | 74.7 | | 75.6 | 75.6 | |
| Black | 16.6 | 15.6 | | 16.3 | 16.3 | |
| Other | 6.9 | 9.7 | | 8.1 | 8.1 | |
| Site (%) | | | 0.004 | | | 0.90 |
| Unfavorable | 55.9 | 63.0 | | 60.7 | 60.5 | |
| Favorable | 44.1 | 37.0 | | 39.3 | 39.5 | |
| Stage (%) | | | <0.001 | | | 0.89 |
| Localized | 49.7 | 36.7 | | 42.4 | 43.2 | |
| Regional | 30.4 | 43.0 | | 38.0 | 37.2 | |
| Distant | 19.9 | 20.3 | | 19.6 | 19.5 | |
| Histology (%) | | | <0.001 | | | 0.95 |
| Embryonal | 52.8 | 49.5 | | 50.8 | 51.3 | |
| Alveolar | 14.1 | 30.3 | | 22.7 | 22.5 | |
| Pleomorphic | 17.8 | 15.0 | | 16.7 | 16.9 | |
| Others | 15.2 | 5.2 | | 9.8 | 9.2 | |
| Positive regional
nodes (%) | | | 0.001 | | | 0.72 |
| Pathologic
node-negative | 24.4 | 17.4 | | 20.3 | 19.8 | |
| 1–3 positive
nodes | 4.8 | 8.2 | | 7.7 | 6.8 | |
| ≥4 positive
nodes | 1.7 | 1.5 | | 1.5 | 1.5 | |
| No nodes
examined | 69.1 | 73.0 | | 70.5 | 71.9 | |
We built a COX proportional hazard model with the
variables listed in Table I. The
assumption of proportional hazards was supported. After model
selection, we obtained a reduced model including the variables age,
size, stage, histological type, positive regional nodes and
adjuvant radiotherapy. Beta coefficients for this reduced model are
listed in Table III.
| Table IIICox proportional hazards multivariate
regression model parameters. |
Table III
Cox proportional hazards multivariate
regression model parameters.
| Covariate | Beta
coefficient | Hazard ratio | 95% CI | P-value |
|---|
| Age | 0.05 | -a | - | <0.001 |
| Age′ | −0.05 | -a | - | 0.02 |
| Size | 0.13 | -a | - | <0.001 |
| Size′ | −0.12 | -a | - | 0.02 |
| Histology |
| Alveolar | 0.68 | 1.98 | 1.36–2.88 | <0.001 |
| Pleomorphic | 0.10 | 1.11 | 0.73–1.70 | 0.63 |
| Others | −0.20 | 0.81 | 0.52–1.26 | 0.36 |
| Stage |
| Regional | 0.71 | 2.04 | 1.44–2.92 | <0.001 |
| Distant | 1.64 | 5.16 | 3.51–7.56 | <0.001 |
| Positive regional
nodes |
| 1–3 positive
nodes | 0.11 | 1.12 | 0.56–2.22 | 0.74 |
| ≥4 positive
nodes | 0.29 | 1.34 | 0.62–2.87 | 0.45 |
| No nodes
examined | 0.42 | 1.52 | 1.08–2.16 | 0.02 |
| Received RT | 0.70 | 2.00 | 1.11–3.62 | 0.02 |
| Interaction
term |
| Alveolar × RT | −0.24 | 0.78 | 0.49–1.26 | 0.32 |
| Pleomorphic ×
RT | −0.59 | 0.55 | 0.33–0.92 | 0.02 |
| Others × RT | 0.18 | 1.19 | 0.59–2.41 | 0.62 |
| Regional × RT | −0.67 | 0.51 | 0.32–0.83 | 0.01 |
| Distant × RT | −0.67 | 0.51 | 0.31–0.84 | 0.01 |
| 1–3 positive nodes
× RT | −0.23 | 0.79 | 0.32–1.93 | 0.60 |
| ≥4 positive nodes
× RT | −1.00 | 0.37 | 0.08–1.79 | 0.21 |
| No nodes examined
× RT | −0.41 | 0.66 | 0.39–1.12 | 0.12 |
Nomograms to predict 5- and 10-year CS rates were
developed based on the beta coefficients from the reduced model
(Fig. 3). To use the nomogram, we
first draw a vertical line to the point row to obtain point values
for each variable, then add up the point values for each variable
to obtain total points, and drop a vertical line from the total
points row to obtain the 5- and 10-year CS rates. Fig. 3A predicts CS with surgery alone,
and Fig. 3B predicts CS with
adjuvant radiotherapy. The survival benefit of adjuvant
radiotherapy can be estimated using the difference between these
two predictions.
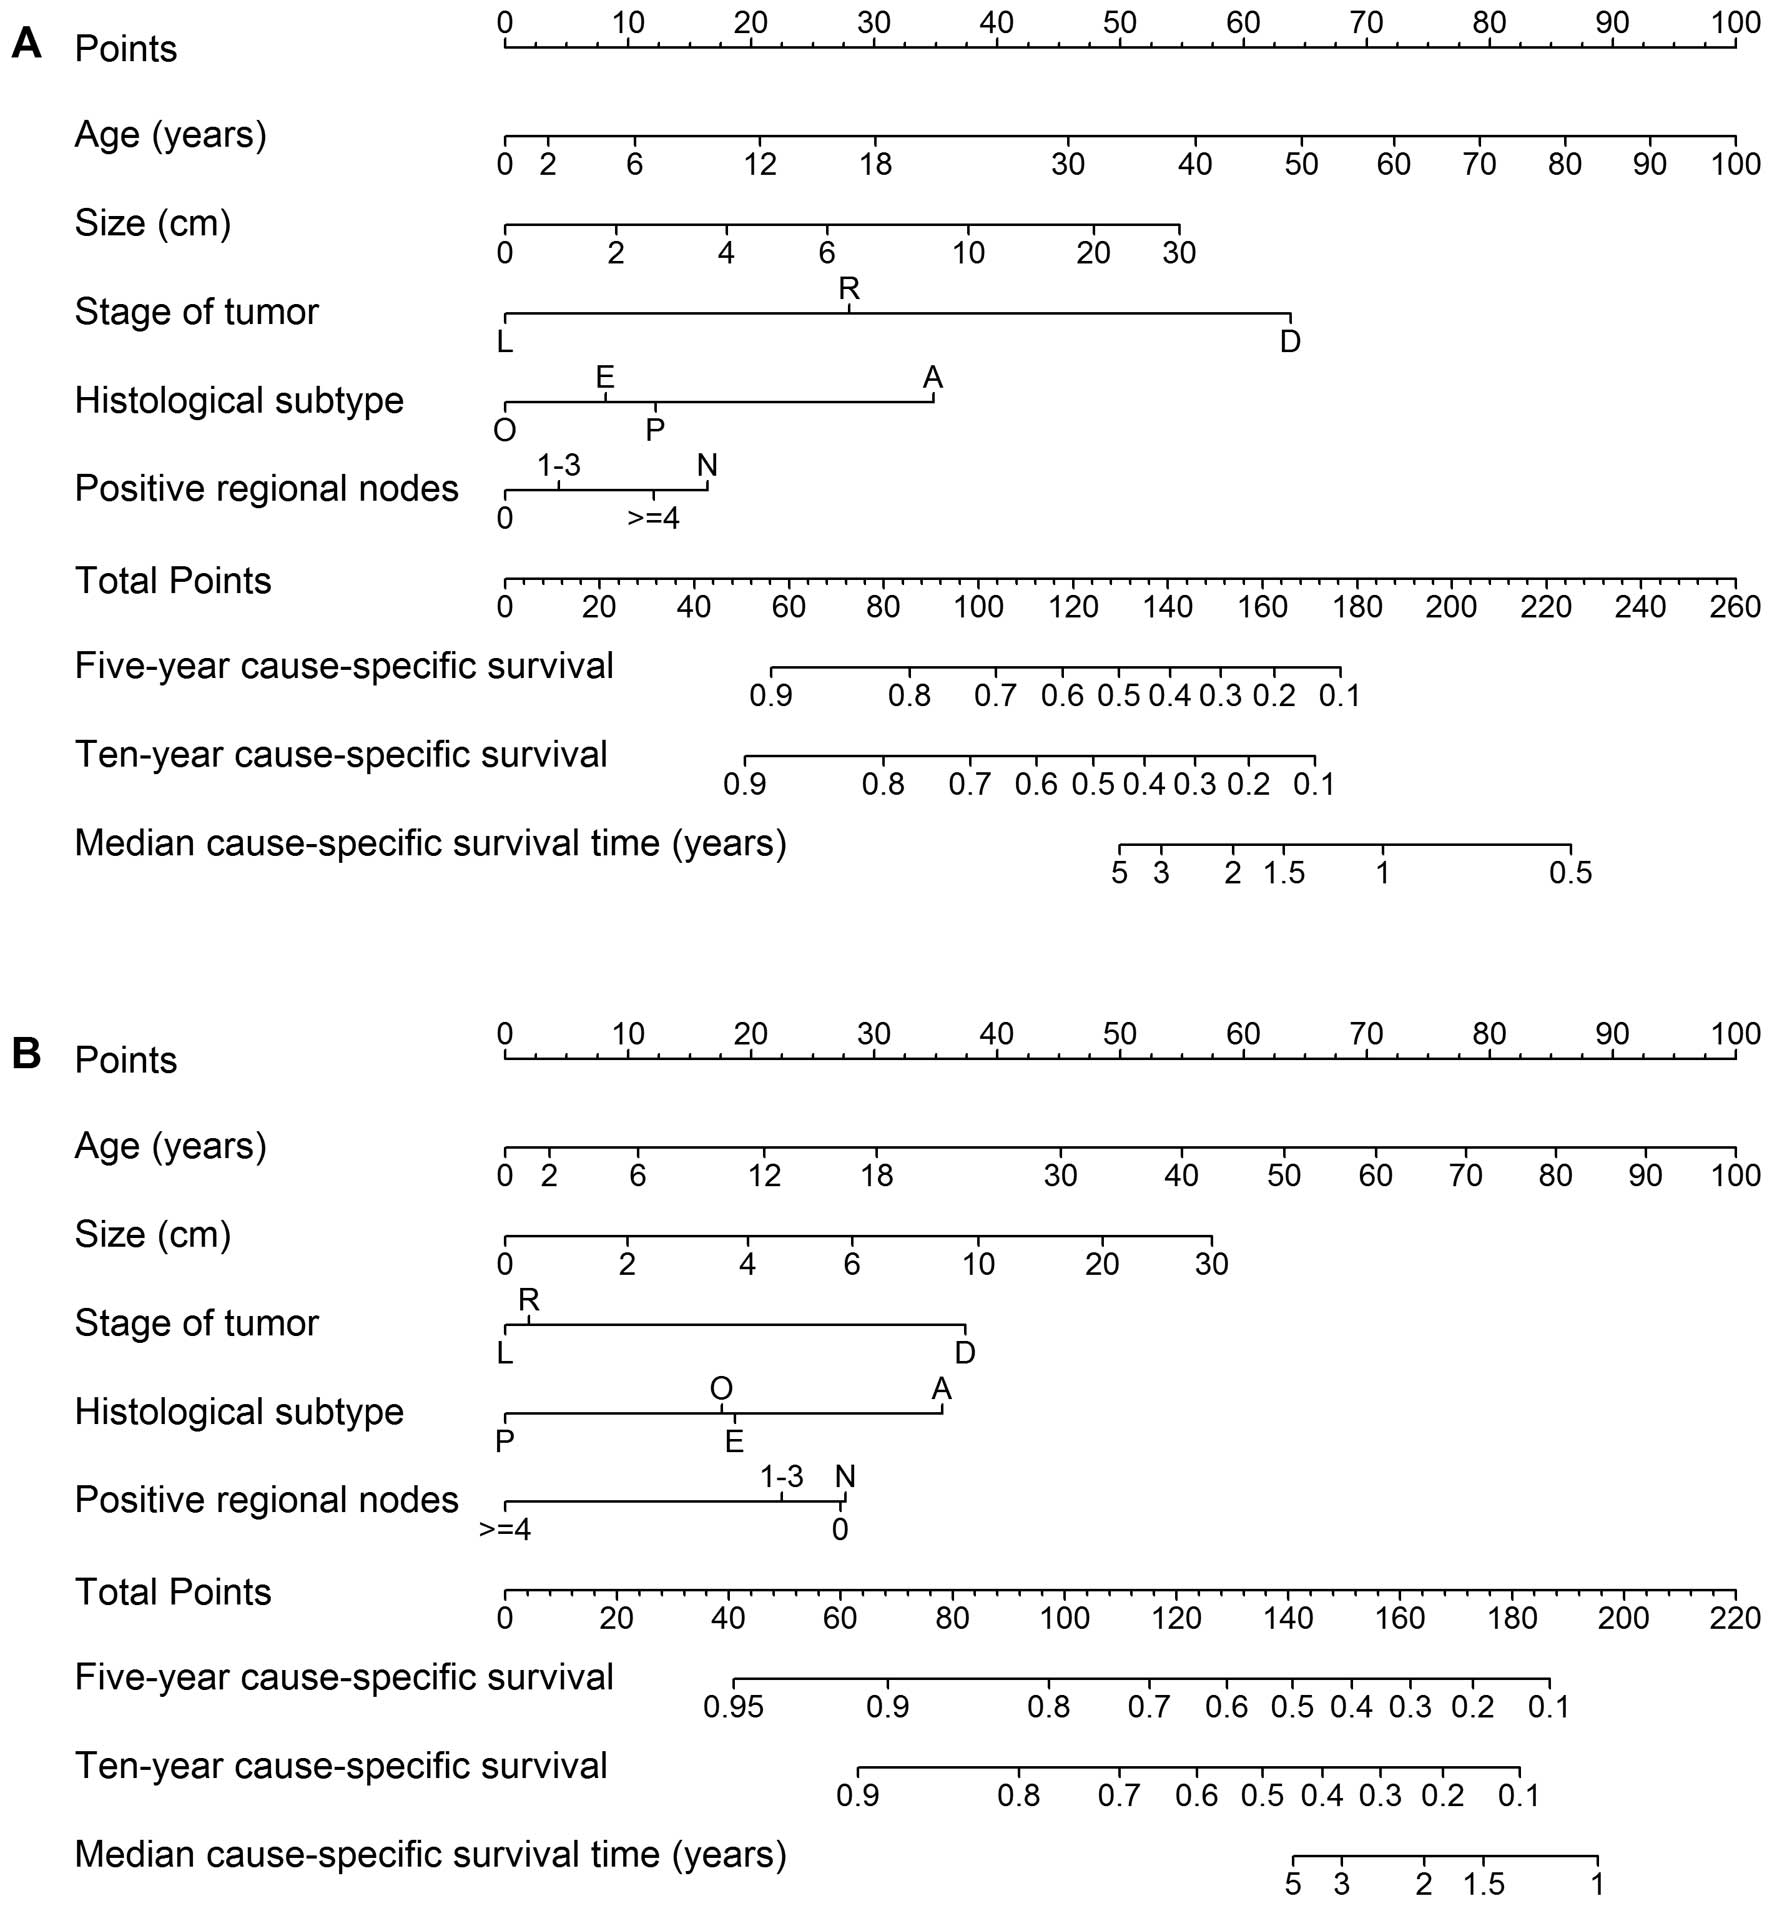 | Figure 3Nomogram for predicting 5- and 10-year
cause-specific survival and median survival time. (A) Prediction
for patients with surgery alone. (B) Prediction for patients with
adjuvant radiotherapy (RT). Stage of tumor: L, localized; R,
regional; D, distant. Gender: M, male; F, female. Histological
subtype: E, embryonal; A, alveolar; P, pleomorphic; O, others.
Positive regional nodes: N, no nodes examined. For an individual
patient, first use (A) to calculate the expected survival without
adjuvant RT, then use (B) to obtain the expected survival with
adjuvant RT. The difference between these two estimates shows the
survival benefit that a patient is predicted to obtain from
adjuvant RT. |
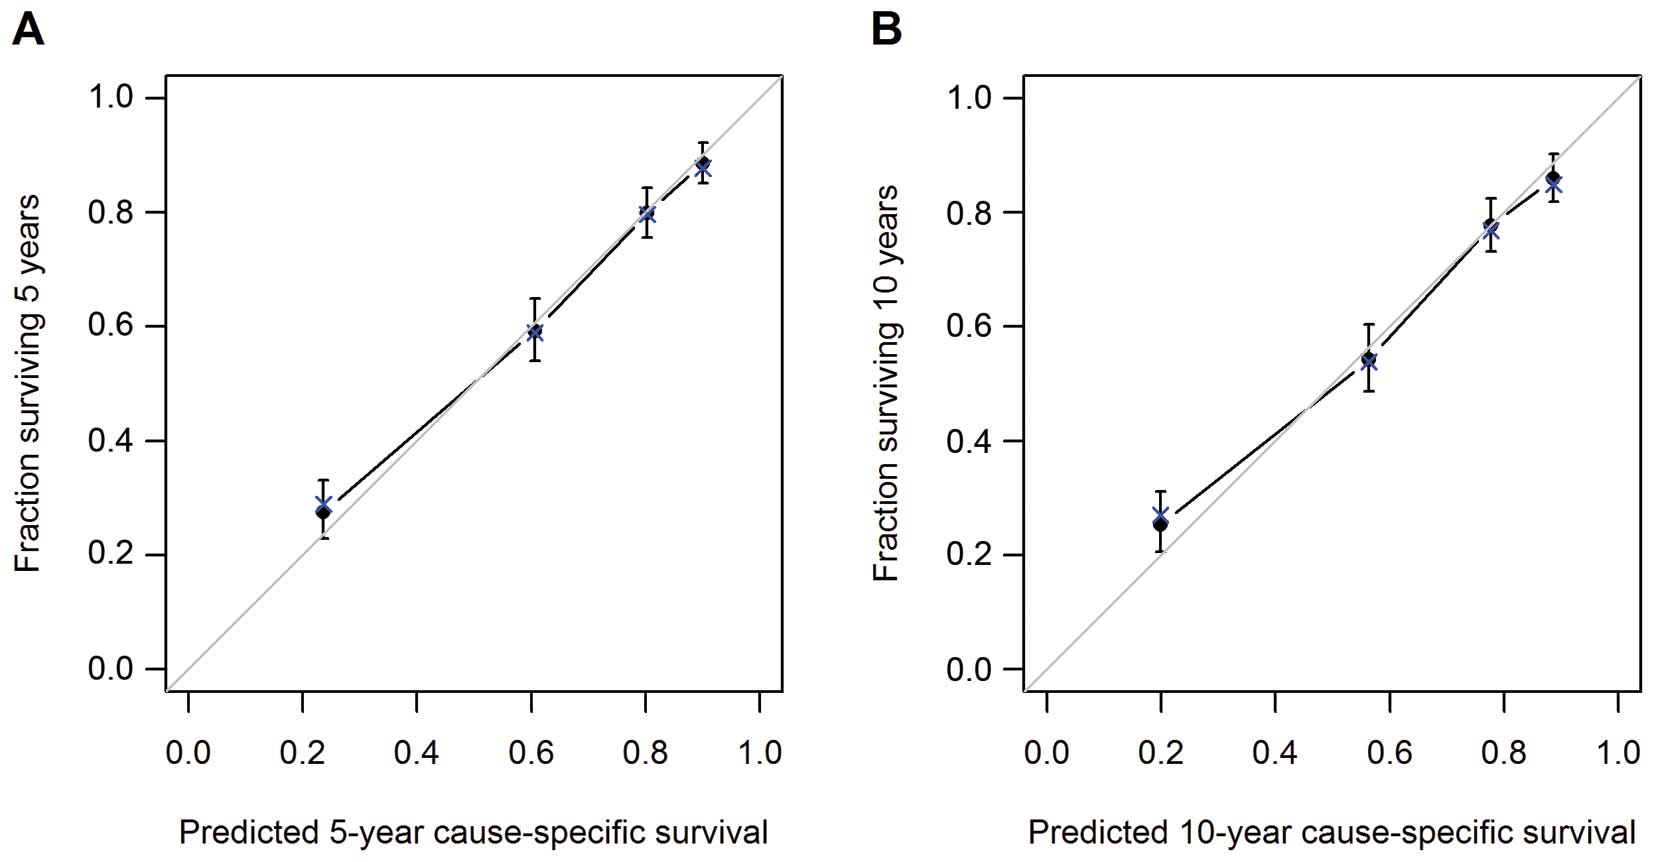
Model performance was evaluated by internal
validation. The model demonstrated reasonable accuracy, with a
c-index of 0.78 (95% CI, 0.76–0.80). The calibration plots for 5-
and 10-year CS are shown in Fig.
4. Points close to the 45° line show good agreement between CS
estimates from the model and those derived from Kaplan-Meier
estimates.
Discussion
Individual estimation of prognosis for a patient
with cancer is useful to guide treatment selection. The present
study reports a model for estimating the survival benefit of
adjuvant radiotherapy in a patient after resection of RMS, and this
model can easily be applied in the clinic. For example, given a
5-year-old patient with distant alveolar RMS, tumor size of 5 cm
and 2 positive lymph nodes, our nomograms predict that 5-year CS
rate would improve from 48% with surgery alone to 60% with adjuvant
radiotherapy.
A number of nomograms have been published, including
for cancers of the prostate, pancreas, breast and other sites
(21–26). The first soft-tissue sarcoma
nomogram for predicting sarcoma-specific mortality was published by
Kattan et al in 2002 (27).
More recently, Gronchi et al reported two nomograms to
predict OS and disease-free survival in patients after resection of
retroperitoneal soft tissue sarcoma (28). In addition, Chisholm et al
published a nomogram for patients with relapsed RMS to define
patients who can be salvaged with further therapy (29). In terms of treatment evaluation,
Wang et al reported two models for predicting the benefit of
adjuvant radiation and adjuvant chemoradiotherapy in patients with
resected gallbladder cancer using SEER (30) and SEER-Medicare data (31). Recently, Albert et al used
the SEER-Medicare dataset to develop a nomogram predicting the
benefit of radiation for older patients with breast cancer treated
using conservative surgery (32).
To the best of our knowledge, the nomograms presented here
represent the first to estimate the benefit of radiotherapy for
individual RMS patients after surgery.
Given the low incidence of RMS, recruiting
sufficient numbers of participants for randomized clinical trials
to estimate the benefit of adjuvant radiotherapy may be difficult.
Most studies have described results from single institutions, or
from retrospective analysis of clinical trial data. Given the short
follow-up period and the rarity of this disease, reports from a
single institution often do not have sufficient power to identify
true associations between prognosis and risk factors. SEER data
provide a powerful tool for evaluating prognosis, particularly for
rare diseases.
The use of radiotherapy has benefited many patients,
but has also resulted in many adverse effects that must be
considered carefully when selecting a treatment plan. For example,
radiotherapy to the head may result in brain damage. In particular,
the brains of small children are very sensitive to radiotherapy.
Several studies have attempted to define subgroups for which
adjuvant radiotherapy can be omitted to avoid late effects. In the
European MMT84 protocol, radiotherapy was not provided for complete
responders to chemotherapy. Although a high incidence of local
relapse was seen in patients without radiotherapy, there was also a
good chance of successful salvage therapy with additional treatment
due to not receiving local control (33). Schuck et al analyzed group
II RMS using data from CWS trials to evaluate local control and the
survival benefit of radiotherapy. They found that it was possible
to cure some patients with microscopically incomplete resection
without additional radiotherapy. Although a subset of group II
patients who may be spared radiotherapy was not defined, they
suggested that omission can be justified in patients with favorable
histology where the side effects from radiotherapy would be severe,
such as extremely young patients or patients with tumor at
sensitive sites (10). Although
the present study could not compare results with these studies
directly due to a lack of detailed information on surgical margins,
and did not identify a specific subgroup for which adjuvant therapy
should be omitted, the nomograms we report here can quantify the
survival benefit of adjuvant radiotherapy. Customized predictions
are more relevant to individual patients than recommendations based
on coarse groupings, because they can identify whether the
individual patient is likely to benefit and calculate the likely
magnitude of such benefit.
This study used observational data to estimate
treatment effects. Unlike well-designed clinical trials, selection
bias will be present between treated and untreated groups in
observational studies, because the distribution of covariates is
unlikely to be balanced between groups. Propensity score methods
allow such biases to be minimized. Different propensity score
methods can be used to adjust for selection bias, such as
propensity score matching, stratification according to propensity
score, propensity score weighting and covariate adjustment using
the propensity score. A previous study compared the performance of
these methods and indicated that both propensity score matching and
inverse probability of treatment weighting using propensity score
allow for the estimation of marginal hazard ratios with minimal
bias when estimating effects of treatment on time-to-event outcomes
(34). We therefore used the
inverse probability of treatment weighting to adjust for selection
bias in this analysis.
Although validation of the nomograms demonstrated
good accuracy for predicting survival benefit from adjuvant
radiation, caution is warranted when using these nomograms. It is
not possible to include all risk factors in a nomogram, so the
survival benefit predicted from a nomogram cannot represent the
sole basis for treatment selection. The final decision of whether
to use adjuvant radiotherapy should be made with careful
consideration of multiple prognostic factors, quality of life and
the wishes of the patient.
Some other limitations must also be mentioned.
First, the study used SEER data, so the predictive factors included
in the model are limited to those variables included in the SEER
database. Factors such as comorbidities, use of chemotherapy and
status of surgical margins are known to influence survival outcomes
in RMS, but such information is not available from SEER and so
could not be included in our model. Most children with RMS in
America are treated according to national cooperative protocols,
and every patient treated for RMS should receive chemotherapy based
on those protocols, so predictions from our nomograms were
considered biased toward those treated according to RMS protocols
and receiving adjuvant chemotherapy, particularly for the pediatric
population. The lack of a central review of pathology represents a
second limitation to our investigation. Finally, internal
validation was used to evaluate model building due to the small
sample size. External validation is still needed. Despite these
limitations, the SEER dataset provided sufficient patients to build
a reasonably predictive model. Furthermore, the c-index of 0.78
(95% CI, 0.76–0.80) shows a model statistically better than chance
(P<0.001), and suggests a sufficient level of accuracy, given
the lack of published nomograms in this setting.
In summary, we have developed a survival model to
evaluate the benefit of radiotherapy for resected RMS using a
population-based database. Model performance was tested and found
to be good. Our model and nomograms can quantify the benefit of
adjuvant radiotherapy, and provides patients and clinicians with
assistance in making treatment decisions.
Acknowledgements
The authors would like to thank SEER for open access
to database.
References
|
1
|
No authors listed: Surveillance,
Epidemiology, and End Results (SEER) Program (www.seer.cancer.gov) SEER*Stat Database: Incidence -
SEER 9 Regs Research Data, Nov 2011 Sub (1973–2010)
<Katrina/Rita Population Adjustment> - Linked To County
Attributes - Total U.S., 1969–2010 Counties, National Cancer
Institute, DCCPS, Surveillance Research Program, Surveillance
Systems Branch, released April 2013, based on the November 2012
submission.
|
|
2
|
Miller RW, Young JL Jr and Novakovic B:
Childhood cancer. Cancer. 75:395–405. 1995. View Article : Google Scholar : PubMed/NCBI
|
|
3
|
Jha P, Frölich AM, McCarville B, et al:
Unusual association of alveolar rhabdomyosarcoma with pancreatic
metastasis: emerging role of PET-CT in tumor staging. Pediatr
Radiol. 40:1380–1386. 2010. View Article : Google Scholar : PubMed/NCBI
|
|
4
|
Raney RB, Maurer HM, Anderson JR, et al:
The Intergroup Rhabdomyosarcoma Study Group (IRSG): major lessons
from the IRS-I through IRS-IV studies as background for the current
IRS-V treatment protocols. Sarcoma. 5:9–15. 2001. View Article : Google Scholar : PubMed/NCBI
|
|
5
|
Terezakis SA and Wharam MD: Radiotherapy
for rhabdomyosarcoma: indications and outcome. Clin Oncol.
25:27–35. 2013. View Article : Google Scholar : PubMed/NCBI
|
|
6
|
Wolden SL, Anderson JR, Crist WM, et al:
Indications for radiotherapy and chemotherapy after complete
resection in rhabdomyosarcoma: A report from the Intergroup
Rhabdomyosarcoma Studies I to III. J Clin Oncol. 17:3468–3475.
1999.PubMed/NCBI
|
|
7
|
Regine WF, Fontanesi J, Kumar P, et al:
Local tumor control in rhabdomyosarcoma following low-dose
irradiation: comparison of group II and select group III patients.
Int J Radiat Oncol Biol Phys. 31:485–491. 1995. View Article : Google Scholar : PubMed/NCBI
|
|
8
|
Schwartz CL: Long-term survivors of
childhood cancer: the late effects of therapy. Oncologist. 4:45–54.
1999.PubMed/NCBI
|
|
9
|
Stevens MC: Treatment for childhood
rhabdomyosarcoma: the cost of cure. Lancet Oncol. 6:77–84. 2005.
View Article : Google Scholar : PubMed/NCBI
|
|
10
|
Schuck A, Mattke AC, Schmidt B, et al:
Group II rhabdomyosarcoma and rhabdomyosarcoma-like tumors: is
radiotherapy necessary? J Clin Oncol. 22:143–149. 2004. View Article : Google Scholar : PubMed/NCBI
|
|
11
|
Raney RB, Anderson JR, Barr FG, et al:
Rhabdomyosarcoma and undifferentiated sarcoma in the first two
decades of life: a selective review of intergroup rhabdomyosarcoma
study group experience and rationale for Intergroup
Rhabdomyosarcoma Study V. J Pediatr Hematol Oncol. 23:215–220.
2001. View Article : Google Scholar
|
|
12
|
Koscielniak E, Harms D, Henze G, et al:
Results of treatment for soft tissue sarcoma in childhood and
adolescence: a final report of the German Cooperative Soft Tissue
Sarcoma Study CWS-86. J Clin Oncol. 17:3706–3719. 1999.PubMed/NCBI
|
|
13
|
Stevens MC, Rey A, Bouvet N, et al:
Treatment of nonmetastatic rhabdomyosarcoma in childhood and
adolescence: third study of the International Society of Paediatric
Oncology - SIOP Malignant Mesenchymal Tumor 89. J Clin Oncol.
23:2618–2628. 2005. View Article : Google Scholar : PubMed/NCBI
|
|
14
|
No authors listed: Surveillance,
Epidemiology, and End Results (SEER) Program (www.seer.cancer.gov) Research Data (1973–2010),
National Cancer Institute, DCCPS, Surveillance Research Program,
Surveillance Systems Branch, released April 2013, based on the
November 2012 submission.
|
|
15
|
Sultan I, Qaddoumi I, Yaser S,
Rodriguez-Galindo C and Ferrari A: Comparing adult and pediatric
rhabdomyosarcoma in the surveillance, epidemiology and end results
program, 1973 to 2005: an analysis of 2,600 patients. J Clin Oncol.
27:3391–3397. 2009. View Article : Google Scholar : PubMed/NCBI
|
|
16
|
Harrell FE: rms: Regression Modeling
Strategies. R package version 3.6–3. http://CRAN.R-project.org/package=rms.
|
|
17
|
Austin PC: The relative ability of
different propensity score methods to balance measured covariates
between treated and untreated subjects in observational studies.
Med Decis Making. 29:661–677. 2009. View Article : Google Scholar
|
|
18
|
Austin PC, Grootendorst P and Anderson GM:
A comparison of the ability of different propensity score models to
balance measured variables between treated and untreated subjects:
a Monte Carlo study. Stat Med. 26:734–753. 2007. View Article : Google Scholar
|
|
19
|
Harrell FE: Regression Modeling
Strategies. Springer-Verlag; New York, New York: 2001, View Article : Google Scholar
|
|
20
|
R Core Team. 2013, R: A language and
environment for statistical computing. R Foundation for Statistical
Computing; Vienna, Austria: URL http://www.R-project.org/.
|
|
21
|
Stephenson AJ, Scardino PT, Kattan MW, et
al: Predicting the outcome of salvage radiation therapy for
recurrent prostate cancer after radical prostatectomy. J Clin
Oncol. 25:2035–2041. 2007. View Article : Google Scholar : PubMed/NCBI
|
|
22
|
Rouzier R, Pusztai L, Delaloge S, et al:
Nomograms to predict pathologic complete response and
metastasis-free survival after preoperative chemotherapy for breast
cancer. J Clin Oncol. 23:8331–8339. 2005. View Article : Google Scholar : PubMed/NCBI
|
|
23
|
Brennan MF, Kattan MW, Klimstra D and
Conlon K: Prognostic nomogram for patients undergoing resection for
adenocarcinoma of the pancreas. Ann Surg. 240:293–298. 2004.
View Article : Google Scholar : PubMed/NCBI
|
|
24
|
Kattan MW, Karpeh MS, Mazumdar M and
Brennan MF: Postoperative nomogram for disease-specific survival
after an R0 resection for gastric carcinoma. J Clin Oncol.
21:3647–3650. 2003. View Article : Google Scholar : PubMed/NCBI
|
|
25
|
Yang L, Shen W and Sakamoto N:
Population-based study evaluating and predicting the probability of
death resulting from thyroid cancer and other causes among patients
with thyroid cancer. J Clin Oncol. 31:468–474. 2013. View Article : Google Scholar : PubMed/NCBI
|
|
26
|
Kutikov A, Egleston BL, Wong YN and Uzzo
RG: Evaluating overall survival and competing risks of death in
patients with localized renal cell carcinoma using a comprehensive
nomogram. J Clin Oncol. 28:311–317. 2010. View Article : Google Scholar : PubMed/NCBI
|
|
27
|
Kattan MW, Leung DH and Brennan MF:
Postoperative nomogram for 12-year sarcoma-specific death. J Clin
Oncol. 20:791–796. 2002.PubMed/NCBI
|
|
28
|
Gronchi A, Miceli R, Shurell E, et al:
Outcome prediction in primary resected retroperitoneal soft tissue
sarcoma: histology-specific overall survival and disease-free
survival nomograms built on major sarcoma center data sets. J Clin
Oncol. 31:1649–1655. 2013. View Article : Google Scholar
|
|
29
|
Chisholm JC, Marandet J, Rey A, et al:
Prognostic factors after relapse in nonmetastatic rhabdomyosarcoma:
a nomogram to better define patients who can be salvaged with
further therapy. J Clin Oncol. 29:1319–1325. 2011. View Article : Google Scholar
|
|
30
|
Wang SJ, Fuller CD, Kim JS, Sittig DF,
Thomas CR Jr and Ravdin PM: Prediction model for estimating the
survival benefit of adjuvant radiotherapy for gallbladder cancer. J
Clin Oncol. 26:2112–2117. 2008. View Article : Google Scholar : PubMed/NCBI
|
|
31
|
Wang SJ, Lemieux A, Kalpathy-Cramer J, et
al: Nomogram for predicting the benefit of adjuvant
chemoradiotherapy for resected gallbladder cancer. J Clin Oncol.
29:4627–4632. 2011. View Article : Google Scholar : PubMed/NCBI
|
|
32
|
Albert JM, Liu DD, Shen Y, et al: Nomogram
to predict the benefit of radiation for older patients with breast
cancer treated with conservative surgery. J Clin Oncol.
30:2837–2843. 2012. View Article : Google Scholar : PubMed/NCBI
|
|
33
|
Flamant F, Rodary C, Rey A, et al:
Treatment of non-metastatic rhabdomyosarcomas in childhood and
adolescence. Results of the second study of the International
Society of Paediatric Oncology: MMT84. Eur J Cancer. 34:1050–1062.
1998. View Article : Google Scholar : PubMed/NCBI
|
|
34
|
Austin PC: The performance of different
propensity score methods for estimating marginal hazard ratios.
Stat Med. 32:2837–2849. 2013. View
Article : Google Scholar : PubMed/NCBI
|