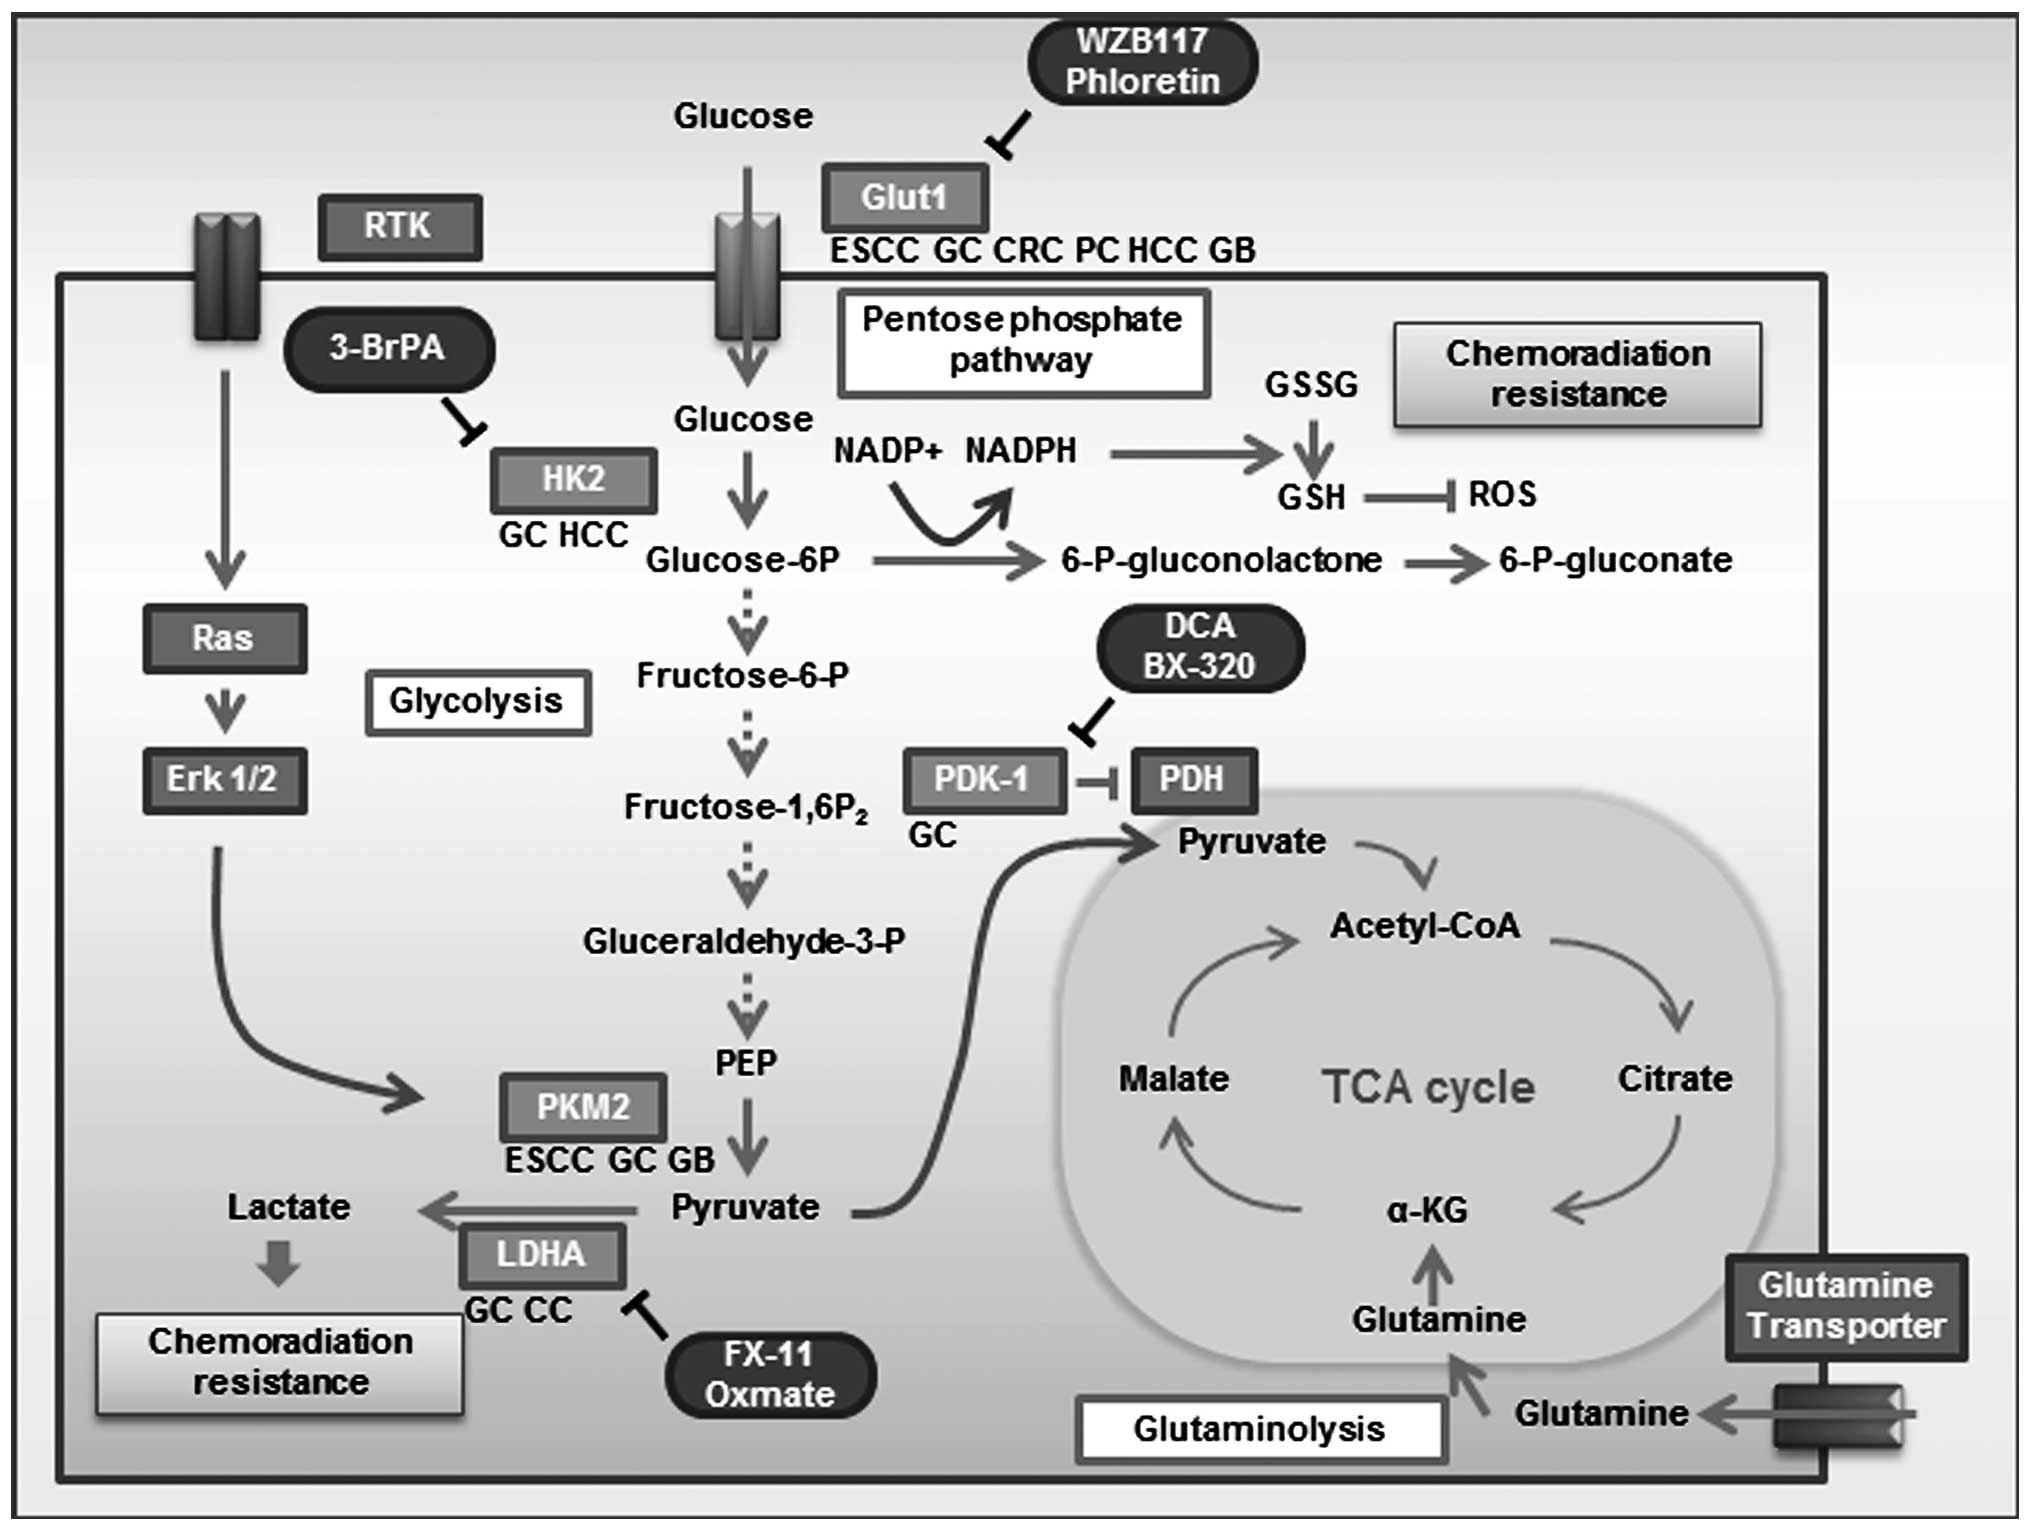
The direct mechanistic link between an activated
oncogene and altered glucose metabolism is regulated by
phosphoinositide 3-kinase (PI3K) (5), Akt (6), p53 (7,8),
AMP-activated protein kinase (AMPK) (9,10),
c-Myc and hypoxia-inducible factor (HIF). c-Myc and HIF1A
transcription factors target many of the same glycolytic enzyme
genes, including hexokinase 2 (HK2), pyruvate kinase type M2
(PKM2), lactate dehydrogenase A (LDHA), and pyruvate dehydrogenase
kinase, isozyme 1 (PDK1). Recent investigations using genetic and
metabolic analyses have provided insights into the molecular
mechanisms of these genes that contribute to the Warburg effect and
tumorigenesis (Fig. 1).
In this review, significant molecular insights into
clinical impacts of the Warburg effect, such as oncogenic
alterations and overexpression of glycolytic enzymes and metabolite
transporters, will be discussed.
HIF-1A and c-Myc cooperatively induce a
transcriptional program for glycolysis. HIF plays a crucial role in
cellular adaptation to hypoxia and regulates the expression of
genes responsible for glucose metabolism, angiogenesis, and cell
survival (11). Cellular HIF
levels are regulated by both an oxygen-dependent pathway and an
oxygen-independent pathway. HIF contains two key regulatory
subunits, HIF1A and endothelial PAS domain protein 1 (EPAS1;
HIF-2), and the genes encoding these proteins are overexpressed in
human cancers (12,13). Many studies have assessed the
significance of HIF-1A positive expression in the prediction of
clinical outcome of gastrointestinal cancer. HIF-1A expression is
associated with poor prognosis in esophageal squamous cell
carcinoma (ESCC) (14,15), gastric cancer (16,17),
colorectal cancer (CRC) (18) and
hepatocellular carcinoma (HCC) (19). Low expression of HIF1A may be
associated with a favorable effect of 5-FU-based adjuvant
chemotherapy in gastric cancer patients (20,21).
HIF-2A is associated with poor survival in gastric cancer patients
(22) but not CRC patients
(18,23).
Glut1 is composed of 492 amino acid residues and
possesses a single site of N-linked glycosylation at N45 (31). Multiple glucose transporter-like
proteins have been identified and characterized (32) with sequence similarity to Glut1,
and these genes appear to belong to the family of solute carriers
2A (SLC2A, protein symbol Glut). The 14 Gluts are categorized into
three classes based on sequence similarity: Class 1 (Gluts 1–4 and
14), Class 2 (Gluts 5, 7, 9 and 11), and Class 3 (Gluts 6, 8, 10,
12, and HMIT) (32). Glut families
were evaluated with the GEO data set in silico (http://www.ncbi.nlm.nih.gov/gds/). Glut1 mRNA
levels were remarkably upregulated in tumor lesions compared with
normal lesions in CRC (GDS 4382), ESCC (GDS 3838) and pancreatic
cancer (GDS 4336) (Table II).
Several studies have been published on Glut family members,
especially Glut3 (33–35), but Glut1 has been the main focus of
investigation. A previous study evaluating Glut1 by IHC in tissue
microarray slides comprising 1,955 samples detected Glut1
positivity in 47% prostate adenocarcinomas, 29% thyroid cancer, 10%
gastric cancer, 5% breast adenocarcinomas, 36% head and neck SCC,
42% uterine cervix SCC, 18.6% glioblastomas and 9.4%
retinoblastomas (36).
Glut1 expression is generally absent in normal
tissue, but in multiple gastrointestinal cancer cell types, Glut1
expression is remarkably enhanced. Glut1 positivity is associated
with poor prognosis in diverse gastrointestinal cancers, ESCC
(15,42,43),
gastric cancer (44,45), CRC (46,47),
pancreatic cancer, HCC (48), and
gallbladder cancer (49,50) (Table
III).
Glut1 expression has the potential to serve as a
biomarker for cancer. Anticancer therapies, such as radiation and
several chemotherapeutic drugs, induce oxidative stress in targeted
cells. Reactive oxygen species (ROS) are required for the fixation
of radiation-induced DNA damage (51). Therefore, an accumulation of
antioxidants (e.g., lactate) may induce or enhance resistance to
radiation and may cause chemoresistance (52). Glut1 positivity was associated with
tumor regression grade (TRG) and may be a useful predictive marker
of response to chemoradiotherapy in rectal cancer (47,53).
Phloretin, a natural product found in apples and
pears with Glut inhibitory activity, exerts antitumor effects in
HCC and color cancer cell lines (54,55).
The WZB117 small molecule inhibitor of Glut1 was effective in
inhibiting cancer cell growth both in vitro and in
vivo (56) (Table IV).
Hexokinases catalyze the phosphorylation of glucose
to glucose-6-phosphate. This is the first and rate-limiting step in
glucose metabolism. HK2 is one of four members of the hexokinase
family. The four isoenzymes (HK1, HK2, HK3, and glucokinase) are
structurally similar, but only HK1 and HK2 are functionally
similar. HK2, but not HK1, is overexpressed in several cancer types
compared with normal tissue. HK2 localizes to the outer membrane of
the mitochondria and is the major hexokinase isoform expressed in
cancer cells (57). High
expression of HK2 confers a poor prognosis in HCC and gastric
cancer (Table II), and HK2
positivity was associated with poor differentiation and advanced
stage in HCC (58,59). Tumor differentiation in HCC
correlated with FDG uptake (60),
and the cellular retention of FDG may be mediated by HK2 (58).
Pyruvate kinase (PK) is a glycolytic enzyme that
catalyzes a reaction generating pyruvate and ATP from
phosphoenolpyruvate (PEP) and ADP. Four isoforms of PK (L, R, M1,
and M2) have been identified in mammals. Splicing of PKM is
controlled by splicing repressors, and the expression of the
repressors is upregulated by c-Myc oncoprotein (62,63).
M2 is expressed in embryonic cells, adult stem cells, and cancer
cells and is necessary for aerobic glycolysis. This metabolic
phenotype provides a selective growth advantage for tumor cells
in vivo (64,65). PKM2 expression is associated with
poor prognosis in ESCC, gallbladder cancer and signet ring cell
carcinoma of gastric cancer (Table
III). Small molecule inhibitors that selectively target PKM2
have been identified, suggesting that inhibition of PKM2 could be
synergistic with other targeted therapies, including gefitinib.
However, small molecule activation of PKM2 that promotes PKM2
tetramer formation interferes with anabolic metabolism and
suppresses tumorigenesis (66).
Mutation of the ERK-phosphorylation site S37 in PKM2 blocked
translocation of PKM2 to the nucleus (40), suggesting that PKM2 moves into the
nucleus as a monomer. Tumor cells have multiple ways to regulate
PKM2 that are favorable to cell growth and survival, including PKM2
expression, localization, post-translational modification, and
allosteric regulation. PKM2 also regulates non-metabolic functions
as a transcriptional coactivator and protein kinase. PKM2 is
considered an attractive target for cancer treatment (67). Further studies are needed before
inhibitors and activators of PKM2 can be used as therapeutic
interventions (68).
PDK regulates the mitochondrial gatekeeper pyruvate
dehydrogenase (PDH), which links glycolysis to the TCA cycle by
reversible phosphorylation. Phosphorylation of PDH by PDK inhibits
the action of PDH and halts pyruvate use in the TCA cycle (69). Four PDK isoforms have been verified
in human tissue, and the expressions of the isoforms are organ
specific. PDK-1 positivity was associated with poor prognosis in
gastric cancer (70), but
expression of PDK-1 was decreased in colon cancer compared with
normal tissue. PDK-3 expression was detected in colon cancer, and
PDK-3 positivity was associated with poor prognosis (71). Several studies reported the
relationship between PDK positivity and prognosis in
gastrointestinal cancer, but the clinical significance of PDK
expression has remained unclear. Many small molecule PDK-1
inhibitors have been identified (72). DCA, a PDK-1 inhibitor, reduced
lactate production and increased responsiveness to 5-FU in MKN45
cells (70) and CRC cell lines
(73). DCA treatment exerts
anti-proliferative effects and sorafenib resistance in HCC cell
lines in vivo (74).
Lactate dehydrogenase is a tetrameric enzyme
comprising two major subunits, A and/or B, resulting in five
isozymes (A4, A3B1, A2B2, A1B3 and B4) that can catalyze the
forward and backward conversion of pyruvate to lactate. LDHA
(LDH-5, MLDH, or A4), which is the predominant form in skeletal
muscle, kinetically favors the conversion of pyruvate to lactate,
controlling the conversion of pyruvate to lactate in the cellular
glycolytic process (75). Many
human cancers have higher LDHA levels than normal tissues (76). LDHA is specifically phosphorylated
at Y10 in various cancer cell lines, head and neck SCC, lung
cancer, breast cancer, and prostate cancer cells and by diverse
oncogenic tyrosine kinases, including FGFR1, ABL, JAK2, and FLT3
(77).
LDHA reduction can suppress the tumorigenicity of
intestinal- type gastric cancer (ITGC) cells, colon cancer
(78) and HCC (79). A previous study of 661 ITGC
specimens showed that low LDHA expression exhibited better overall
survival than high LDHA expression (80).
Similar to small interfering RNA (siRNA) reduction
of LDHA expression, the FX11 small molecule inhibitor for LDHA
could increase cellular oxygen consumption, increase ROS
production, and induce cell death that could be partially rescued
by the antioxidant NAC in a lymphoma cell line (81). Oxmate, a lactate dehydrogenase
inhibitor, combined with phenformin exhibited cytotoxic effects in
diverse cancer cell lines, including colon cancer (82).
This review describes the significance of protein
expression of the transcriptional factors, glycolytic enzymes and
metabolite transporters involved in the Warburg effect as potential
biomarkers. The functional and therapeutic importance of the
Warburg effect is increasingly recognized, and glycolysis has
become a target of anticancer strategies. Novel small molecule
inhibitors targeting enzymes that function in the Warburg effect
have been developed and anti-proliferative effects on diverse
cancer cells have been demonstrated. The gene expressions of
molecular factors involved in the Warburg effect are associated
with poor prognosis and may be associated with chemoradiotherapy
resistance in gastrointestinal cancers. Novel small molecules exert
anti-proliferative effects and may reduce chemoradiotherapy
resistance in gastrointestinal cancer, breast cancer (83) and lung cancer (56) (Table
IV).
Future studies should examine whether inhibitors of
glycolytic enzymes and metabolite transporters are useful in
gastrointestinal cancer and evaluate adverse effect and feasibility
for clinical practice. Furthermore, validation of imaging
techniques, which establish glucose metabolism and predict response
to drugs, is required for optimal patient selection.
|
1
|
Warburg O: On respiratory impairment in
cancer cells. Science. 124:269–270. 1956.PubMed/NCBI
|
|
2
|
Younes M, Lechago LV, Somoano JR, Mosharaf
M and Lechago J: Wide expression of the human erythrocyte glucose
transporter Glut1 in human cancers. Cancer Res. 56:1164–1167.
1996.PubMed/NCBI
|
|
3
|
Warburg O: On the origin of cancer cells.
Science. 123:309–314. 1956. View Article : Google Scholar : PubMed/NCBI
|
|
4
|
Plathow C and Weber WA: Tumor cell
metabolism imaging. J Nucl Med. 49(Suppl 2): S43–S63. 2008.
View Article : Google Scholar
|
|
5
|
Plas DR and Thompson CB: Akt-dependent
transformation: there is more to growth than just surviving.
Oncogene. 24:7435–7442. 2005. View Article : Google Scholar : PubMed/NCBI
|
|
6
|
Elstrom RL, Bauer DE, Buzzai M, et al: Akt
stimulates aerobic glycolysis in cancer cells. Cancer Res.
64:3892–3899. 2004. View Article : Google Scholar : PubMed/NCBI
|
|
7
|
Vousden KH and Ryan KM: p53 and
metabolism. Nat Rev Cancer. 9:691–700. 2009. View Article : Google Scholar
|
|
8
|
Stambolic V, MacPherson D, Sas D, et al:
Regulation of PTEN transcription by p53. Mol Cell. 8:317–325. 2001.
View Article : Google Scholar : PubMed/NCBI
|
|
9
|
Jones RG, Plas DR, Kubek S, et al:
AMP-activated protein kinase induces a p53-dependent metabolic
checkpoint. Mol Cell. 18:283–293. 2005. View Article : Google Scholar : PubMed/NCBI
|
|
10
|
Shackelford DB and Shaw RJ: The LKB1-AMPK
pathway: metabolism and growth control in tumour suppression. Nat
Rev Cancer. 9:563–575. 2009. View
Article : Google Scholar : PubMed/NCBI
|
|
11
|
Lu H, Forbes RA and Verma A:
Hypoxia-inducible factor 1 activation by aerobic glycolysis
implicates the Warburg effect in carcinogenesis. J Biol Chem.
277:23111–23115. 2002. View Article : Google Scholar : PubMed/NCBI
|
|
12
|
Zhong H, De Marzo AM, Laughner E, et al:
Overexpression of hypoxia-inducible factor 1alpha in common human
cancers and their metastases. Cancer Res. 59:5830–5835.
1999.PubMed/NCBI
|
|
13
|
Talks KL, Turley H, Gatter KC, et al: The
expression and distribution of the hypoxia-inducible factors
HIF-1alpha and HIF-2alpha in normal human tissues, cancers, and
tumor-associated macrophages. Am J Pathol. 157:411–421. 2000.
View Article : Google Scholar : PubMed/NCBI
|
|
14
|
Matsuyama T, Nakanishi K, Hayashi T, et
al: Expression of hypoxia-inducible factor-1alpha in esophageal
squamous cell carcinoma. Cancer Sci. 96:176–182. 2005. View Article : Google Scholar : PubMed/NCBI
|
|
15
|
Ogane N, Yasuda M, Shimizu M, et al:
Clinicopathological implications of expressions of hypoxia-related
molecules in esophageal superficial squamous cell carcinoma. Ann
Diagn Pathol. 14:23–29. 2010. View Article : Google Scholar : PubMed/NCBI
|
|
16
|
Zhang ZG, Zhang QN, Wang XH and Tian JH:
Hypoxia-inducible factor 1 alpha (HIF-1alpha) as a prognostic
indicator in patients with gastric tumors: a meta-analysis. Asian
Pac J Cancer Prev. 14:4195–4198. 2013. View Article : Google Scholar : PubMed/NCBI
|
|
17
|
Lin S, Ma R, Zheng XY, et al:
Meta-analysis of immunohistochemical expression of hypoxia
inducible factor-1alpha as a prognostic role in gastric cancer.
World J Gastroenterol. 20:1107–1113. 2014. View Article : Google Scholar : PubMed/NCBI
|
|
18
|
Baba Y, Nosho K, Shima K, et al: HIF1A
overexpression is associated with poor prognosis in a cohort of 731
colorectal cancers. Am J Pathol. 176:2292–2301. 2010. View Article : Google Scholar : PubMed/NCBI
|
|
19
|
Zheng SS, Chen XH, Yin X and Zhang BH:
Prognostic significance of HIF-1alpha expression in hepatocellular
carcinoma: a meta-analysis. PloS One. 8:e657532013. View Article : Google Scholar : PubMed/NCBI
|
|
20
|
Nakamura J, Kitajima Y, Kai K, et al:
Hypoxia-inducible factor-1alpha expression predicts the response to
5-fluorouracil-based adjuvant chemotherapy in advanced gastric
cancer. Oncol Rep. 22:693–699. 2009.
|
|
21
|
Nakamura J, Kitajima Y, Kai K, et al:
HIF-1alpha is an unfavorable determinant of relapse in gastric
cancer patients who underwent curative surgery followed by adjuvant
5-FU chemotherapy. Int J Cancer. 127:1158–1171. 2010. View Article : Google Scholar : PubMed/NCBI
|
|
22
|
Griffiths EA, Pritchard SA, McGrath SM, et
al: Hypoxia-associated markers in gastric carcinogenesis and
HIF-2alpha in gastric and gastro-oesophageal cancer prognosis. Br J
Cancer. 98:965–973. 2008. View Article : Google Scholar : PubMed/NCBI
|
|
23
|
Rasheed S, Harris AL, Tekkis PP, et al:
Hypoxia-inducible factor-1alpha and -2alpha are expressed in most
rectal cancers but only hypoxia-inducible factor-1alpha is
associated with prognosis. Br J Cancer. 100:1666–1673. 2009.
View Article : Google Scholar : PubMed/NCBI
|
|
24
|
Dang CV, Le A and Gao P: MYC-induced
cancer cell energy metabolism and therapeutic opportunities. Clin
Cancer Res. 15:6479–6483. 2009. View Article : Google Scholar : PubMed/NCBI
|
|
25
|
Calcagno DQ, Leal MF, Assumpcao PP, Smith
MA and Burbano RR: MYC and gastric adenocarcinoma carcinogenesis.
World J Gastroenterol. 14:5962–5968. 2008. View Article : Google Scholar : PubMed/NCBI
|
|
26
|
Liu Y, Gong LP, Dong XL and Liu HG:
Detection of C-MYC oncogene translocation and copy number change in
the normal-dysplasia- carcinoma sequence of the larynx by
fluorescence in situ hybridization. Diagn Cytopathol. 41:515–519.
2013. View
Article : Google Scholar : PubMed/NCBI
|
|
27
|
Tuupanen S, Yan J, Turunen M, et al:
Characterization of the colorectal cancer-associated enhancer
MYC-335 at 8q24: the role of rs67491583. Cancer Genet. 205:25–33.
2012. View Article : Google Scholar : PubMed/NCBI
|
|
28
|
Amente S, Lania L and Majello B:
Epigenetic reprogramming of Myc target genes. Am J Cancer Res.
1:413–418. 2011.PubMed/NCBI
|
|
29
|
de Souza CR, Leal MF, Calcagno DQ, et al:
MYC deregulation in gastric cancer and its clinicopathological
implications. PloS One. 8:e644202013.PubMed/NCBI
|
|
30
|
He C, Jiang H, Geng S, et al: Expression
and prognostic value of c-Myc and Fas (CD95/APO1) in patients with
pancreatic cancer. Int J Clin Exp Pathol. 7:742–750.
2014.PubMed/NCBI
|
|
31
|
Mueckler M, Caruso C, Baldwin SA, et al:
Sequence and structure of a human glucose transporter. Science.
229:941–945. 1985. View Article : Google Scholar : PubMed/NCBI
|
|
32
|
Joost HG and Thorens B: The extended
GLUT-family of sugar/polyol transport facilitators: nomenclature,
sequence characteristics, and potential function of its novel
members (review). Mol Membr Biol. 18:247–256. 2001. View Article : Google Scholar
|
|
33
|
Younes M, Lechago LV, Somoano JR, Mosharaf
M and Lechago J: Immunohistochemical detection of Glut3 in human
tumors and normal tissues. Anticancer Res. 17:2747–2750.
1997.PubMed/NCBI
|
|
34
|
Ayala FR, Rocha RM, Carvalho KC, et al:
GLUT1 and GLUT3 as potential prognostic markers for oral squamous
cell carcinoma. Molecules. 15:2374–2387. 2010. View Article : Google Scholar : PubMed/NCBI
|
|
35
|
Fonteyne P, Casneuf V, Pauwels P, et al:
Expression of hexokinases and glucose transporters in treated and
untreated oesophageal adenocarcinoma. Histol Histopathol.
24:971–977. 2009.PubMed/NCBI
|
|
36
|
Carvalho KC, Cunha IW, Rocha RM, et al:
GLUT1 expression in malignant tumors and its use as an
immunodiagnostic marker. Clinics (Sao Paulo). 66:965–972. 2011.
View Article : Google Scholar : PubMed/NCBI
|
|
37
|
Griffiths EA, Pritchard SA, Welch IM,
Price PM and West CM: Is the hypoxia-inducible factor pathway
important in gastric cancer? Eur J Cancer. 41:2792–2805. 2005.
View Article : Google Scholar : PubMed/NCBI
|
|
38
|
Yun J, Rago C, Cheong I, et al: Glucose
deprivation contributes to the development of KRAS pathway
mutations in tumor cells. Science. 325:1555–1559. 2009. View Article : Google Scholar : PubMed/NCBI
|
|
39
|
Kawada K, Nakamoto Y, Kawada M, et al:
Relationship between 18F-fluorodeoxyglucose accumulation
and KRAS/BRAF mutations in colorectal cancer. Clin Cancer Res.
18:1696–1703. 2012.
|
|
40
|
Yang W, Zheng Y, Xia Y, et al:
ERK1/2-dependent phosphorylation and nuclear translocation of PKM2
promotes the Warburg effect. Nat Cell Biol. 14:1295–1304. 2012.
View Article : Google Scholar : PubMed/NCBI
|
|
41
|
Young CD, Lewis AS, Rudolph MC, et al:
Modulation of glucose transporter 1 (GLUT1) expression levels
alters mouse mammary tumor cell growth in vitro and in vivo. PloS
One. 6:e232052011. View Article : Google Scholar : PubMed/NCBI
|
|
42
|
Sawayama H, Ishimoto T, Watanabe M, et al:
High expression of glucose transporter 1 on primary lesions of
esophageal squamous cell carcinoma is associated with hematogenous
recurrence. Ann Surg Oncol. 21:1756–1762. 2014. View Article : Google Scholar : PubMed/NCBI
|
|
43
|
Tohma T, Okazumi S, Makino H, et al:
Overexpression of glucose transporter 1 in esophageal squamous cell
carcinomas: a marker for poor prognosis. Dis Esophagus. 18:185–189.
2005. View Article : Google Scholar : PubMed/NCBI
|
|
44
|
Kawamura T, Kusakabe T, Sugino T, et al:
Expression of glucose transporter-1 in human gastric carcinoma:
association with tumor aggressiveness, metastasis, and patient
survival. Cancer. 92:634–641. 2001. View Article : Google Scholar
|
|
45
|
Jung JH, Im S, Jung ES and Kang CS:
Clinicopathological implications of the expression of
hypoxia-related proteins in gastric cancer. Int J Med Sci.
10:1217–1223. 2013. View Article : Google Scholar : PubMed/NCBI
|
|
46
|
Haber RS, Rathan A, Weiser KR, et al:
GLUT1 glucose transporter expression in colorectal carcinoma: a
marker for poor prognosis. Cancer. 83:34–40. 1998. View Article : Google Scholar : PubMed/NCBI
|
|
47
|
Korkeila E, Jaakkola PM, Syrjanen K,
Pyrhonen S and Sundstrom J: Pronounced tumour regression after
radiotherapy is associated with negative/weak glucose transporter-1
expression in rectal cancer. Anticancer Res. 31:311–315.
2011.PubMed/NCBI
|
|
48
|
Kitamura K, Hatano E, Higashi T, et al:
Proliferative activity in hepatocellular carcinoma is closely
correlated with glucose metabolism but not angiogenesis. J Hepatol.
55:846–857. 2011. View Article : Google Scholar : PubMed/NCBI
|
|
49
|
Legan M, Tevzic S, Tolar A, Luzar B and
Marolt VF: Glucose transporter-1 (GLUT-1) immunoreactivity in
benign, premalignant and malignant lesions of the gallbladder.
Pathol Oncol Res. 17:61–66. 2011. View Article : Google Scholar : PubMed/NCBI
|
|
50
|
Kim YW, Park YK, Yoon TY and Lee SM:
Expression of the GLUT1 glucose transporter in gallbladder
carcinomas. Hepatogastroenterology. 49:907–911. 2002.PubMed/NCBI
|
|
51
|
Sattler UG and Mueller-Klieser W: The
anti-oxidant capacity of tumour glycolysis. Int J Radiat Biol.
85:963–971. 2009. View Article : Google Scholar : PubMed/NCBI
|
|
52
|
Hirschhaeuser F, Sattler UG and
Mueller-Klieser W: Lactate: a metabolic key player in cancer.
Cancer Res. 71:6921–6925. 2011. View Article : Google Scholar : PubMed/NCBI
|
|
53
|
Brophy S, Sheehan KM, McNamara DA, Deasy
J, Bouchier-Hayes DJ and Kay EW: GLUT-1 expression and response to
chemoradiotherapy in rectal cancer. Int J Cancer. 125:2778–2782.
2009. View Article : Google Scholar : PubMed/NCBI
|
|
54
|
Cao X, Fang L, Gibbs S, et al: Glucose
uptake inhibitor sensitizes cancer cells to daunorubicin and
overcomes drug resistance in hypoxia. Cancer Chemother Pharmacol.
59:495–505. 2007. View Article : Google Scholar : PubMed/NCBI
|
|
55
|
Wu CH, Ho YS, Tsai CY, et al: In vitro and
in vivo study of phloretin-induced apoptosis in human liver cancer
cells involving inhibition of type II glucose transporter. Int J
Cancer. 124:2210–2219. 2009. View Article : Google Scholar : PubMed/NCBI
|
|
56
|
Liu Y, Cao Y, Zhang W, et al: A
small-molecule inhibitor of glucose transporter 1 downregulates
glycolysis, induces cell-cycle arrest, and inhibits cancer cell
growth in vitro and in vivo. Mol Cancer Ther. 11:1672–1682. 2012.
View Article : Google Scholar : PubMed/NCBI
|
|
57
|
Mathupala SP, Ko YH and Pedersen PL:
Hexokinase-2 bound to mitochondria: cancer’s stygian link to the
‘Warburg Effect’ and a pivotal target for effective therapy. Semin
Cancer Biol. 19:17–24. 2009.
|
|
58
|
Kwee SA, Hernandez B, Chan O and Wong L:
Choline kinase alpha and hexokinase-2 protein expression in
hepatocellular carcinoma: association with survival. PloS One.
7:e465912012. View Article : Google Scholar : PubMed/NCBI
|
|
59
|
Paudyal B, Paudyal P, Oriuchi N, Tsushima
Y, Nakajima T and Endo K: Clinical implication of glucose transport
and metabolism evaluated by 18F-FDG PET in
hepatocellular carcinoma. Int J Oncol. 33:1047–1054.
2008.PubMed/NCBI
|
|
60
|
Seo S, Hatano E, Higashi T, et al:
Fluorine-18 fluorodeoxyglucose positron emission tomography
predicts tumor differentiation, P-glycoprotein expression, and
outcome after resection in hepatocellular carcinoma. Clin Cancer
Res. 13:427–433. 2007. View Article : Google Scholar
|
|
61
|
Ganapathy-Kanniappan S, Vali M,
Kunjithapatham R, et al: 3-bromopyruvate: a new targeted
antiglycolytic agent and a promise for cancer therapy. Curr Pharm
Biotechnol. 11:510–517. 2010. View Article : Google Scholar : PubMed/NCBI
|
|
62
|
David CJ, Chen M, Assanah M, Canoll P and
Manley JL: HnRNP proteins controlled by c-Myc deregulate pyruvate
kinase mRNA splicing in cancer. Nature. 463:364–368. 2010.
View Article : Google Scholar : PubMed/NCBI
|
|
63
|
Clower CV, Chatterjee D, Wang Z, Cantley
LC, Vander Heiden MG and Krainer AR: The alternative splicing
repressors hnRNP A1/A2 and PTB influence pyruvate kinase isoform
expression and cell metabolism. Proc Natl Acad Sci USA.
107:1894–1899. 2010. View Article : Google Scholar
|
|
64
|
Christofk HR, Vander Heiden MG, Harris MH,
et al: The M2 splice isoform of pyruvate kinase is important for
cancer metabolism and tumour growth. Nature. 452:230–233. 2008.
View Article : Google Scholar : PubMed/NCBI
|
|
65
|
Christofk HR, Vander Heiden MG, Wu N,
Asara JM and Cantley LC: Pyruvate kinase M2 is a
phosphotyrosine-binding protein. Nature. 452:181–186. 2008.
View Article : Google Scholar : PubMed/NCBI
|
|
66
|
Anastasiou D, Yu Y, Israelsen WJ, et al:
Pyruvate kinase M2 activators promote tetramer formation and
suppress tumorigenesis. Nat Chem Biol. 8:839–847. 2012. View Article : Google Scholar : PubMed/NCBI
|
|
67
|
Yang W and Lu Z: Regulation and function
of pyruvate kinase M2 in cancer. Cancer Lett. 339:153–158. 2013.
View Article : Google Scholar : PubMed/NCBI
|
|
68
|
Tamada M, Suematsu M and Saya H: Pyruvate
kinase M2: multiple faces for conferring benefits on cancer cells.
Clin Cancer Res. 18:5554–5561. 2012. View Article : Google Scholar : PubMed/NCBI
|
|
69
|
Kaplon J, Zheng L, Meissl K, et al: A key
role for mitochondrial gatekeeper pyruvate dehydrogenase in
oncogene-induced senescence. Nature. 498:109–112. 2013. View Article : Google Scholar : PubMed/NCBI
|
|
70
|
Hur H, Xuan Y, Kim YB, et al: Expression
of pyruvate dehydrogenase kinase-1 in gastric cancer as a potential
therapeutic target. Int J Oncol. 42:44–54. 2013.PubMed/NCBI
|
|
71
|
Lu CW, Lin SC, Chien CW, et al:
Overexpression of pyruvate dehydrogenase kinase 3 increases drug
resistance and early recurrence in colon cancer. Am J Pathol.
179:1405–1414. 2011. View Article : Google Scholar : PubMed/NCBI
|
|
72
|
Peifer C and Alessi DR: Small-molecule
inhibitors of PDK1. Chem Med Chem. 3:1810–1838. 2008. View Article : Google Scholar : PubMed/NCBI
|
|
73
|
Tong J, Xie G, He J, Li J, Pan F and Liang
H: Synergistic antitumor effect of dichloroacetate in combination
with 5-fluorouracil in colorectal cancer. J Biomed Biotechnol.
2011:7405642011. View Article : Google Scholar : PubMed/NCBI
|
|
74
|
Shen YC, Ou DL, Hsu C, et al: Activating
oxidative phosphorylation by a pyruvate dehydrogenase kinase
inhibitor overcomes sorafenib resistance of hepatocellular
carcinoma. Br J Cancer. 108:72–81. 2013. View Article : Google Scholar
|
|
75
|
Fantin VR, St-Pierre J and Leder P:
Attenuation of LDH-A expression uncovers a link between glycolysis,
mitochondrial physiology, and tumor maintenance. Cancer Cell.
9:425–434. 2006. View Article : Google Scholar : PubMed/NCBI
|
|
76
|
Goldman RD, Kaplan NO and Hall TC: Lactic
dehydrogenase in human neoplastic tissues. Cancer Res. 24:389–399.
1964.PubMed/NCBI
|
|
77
|
Fan J, Hitosugi T, Chung TW, et al:
Tyrosine phosphorylation of lactate dehydrogenase A is important
for NADH/NAD(+) redox homeostasis in cancer cells. Mol Cell Biol.
31:4938–4950. 2011. View Article : Google Scholar : PubMed/NCBI
|
|
78
|
Koukourakis MI, Giatromanolaki A, Sivridis
E, Gatter KC and Harris AL: Lactate dehydrogenase 5 expression in
operable colorectal cancer: strong association with survival and
activated vascular endothelial growth factor pathway - a report of
the Tumour Angiogenesis Research Group. J Clin Oncol. 24:4301–4308.
2006. View Article : Google Scholar
|
|
79
|
Sheng SL, Liu JJ, Dai YH, Sun XG, Xiong XP
and Huang G: Knockdown of lactate dehydrogenase A suppresses tumor
growth and metastasis of human hepatocellular carcinoma. FEBS J.
279:3898–3910. 2012. View Article : Google Scholar
|
|
80
|
Zhang Y, Zhang X, Wang X, et al:
Inhibition of LDH-A by lentivirus-mediated small interfering RNA
suppresses intestinaltype gastric cancer tumorigenicity through the
downregulation of Oct4. Cancer Lett. 321:45–54. 2012. View Article : Google Scholar : PubMed/NCBI
|
|
81
|
Le A, Cooper CR, Gouw AM, et al:
Inhibition of lactate dehydrogenase A induces oxidative stress and
inhibits tumor progression. Proc Natl Acad Sci USA. 107:2037–2042.
2010. View Article : Google Scholar : PubMed/NCBI
|
|
82
|
Miskimins WK, Ahn HJ, Kim JY, Ryu S, Jung
YS and Choi JY: Synergistic anti-cancer effect of phenformin and
oxamate. PloS One. 9:e855762014. View Article : Google Scholar : PubMed/NCBI
|
|
83
|
Zhou M, Zhao Y, Ding Y, et al: Warburg
effect in chemosensitivity: targeting lactate dehydrogenase-A
re-sensitizes taxol-resistant cancer cells to taxol. Mol Cancer.
9:332010. View Article : Google Scholar : PubMed/NCBI
|
|
84
|
Sumiyoshi Y, Kakeji Y, Egashira A,
Mizokami K, Orita H and Maehara Y: Overexpression of
hypoxia-inducible factor 1alpha and p53 is a marker for an
unfavorable prognosis in gastric cancer. Clin Cancer Res.
12:5112–5117. 2006. View Article : Google Scholar : PubMed/NCBI
|
|
85
|
Isobe T, Aoyagi K, Koufuji K, et al:
Clinicopathological significance of hypoxia-inducible factor-1
alpha (HIF-1alpha) expression in gastric cancer. Int J Clin Oncol.
18:293–304. 2013. View Article : Google Scholar : PubMed/NCBI
|
|
86
|
Theodoropoulos GE, Lazaris AC,
Theodoropoulos VE, et al: Hypoxia, angiogenesis and apoptosis
markers in locally advanced rectal cancer. Int J Colorectal Dis.
21:248–257. 2006. View Article : Google Scholar : PubMed/NCBI
|
|
87
|
Dai CX, Gao Q, Qiu SJ, et al:
Hypoxia-inducible factor-1 alpha, in association with inflammation,
angiogenesis and MYC, is a critical prognostic factor in patients
with HCC after surgery. BMC Cancer. 9:4182009. View Article : Google Scholar : PubMed/NCBI
|
|
88
|
Liu L, Zhu XD, Wang WQ, et al: Activation
of beta-catenin by hypoxia in hepatocellular carcinoma contributes
to enhanced metastatic potential and poor prognosis. Clin Cancer
Res. 16:2740–2750. 2010. View Article : Google Scholar : PubMed/NCBI
|
|
89
|
Couvelard A, O’Toole D, Leek R, et al:
Expression of hypoxia-inducible factors is correlated with the
presence of a fibrotic focus and angiogenesis in pancreatic ductal
adenocarcinomas. Histopathology. 46:668–676. 2005. View Article : Google Scholar : PubMed/NCBI
|
|
90
|
Shen YM, Arbman G, Olsson B and Sun XF:
Overexpression of GLUT1 in colorectal cancer is independently
associated with poor prognosis. Int J Biol Markers. 26:166–172.
2011. View Article : Google Scholar : PubMed/NCBI
|
|
91
|
Pizzi S, Porzionato A, Pasquali C, et al:
Glucose transporter-1 expression and prognostic significance in
pancreatic carcinogenesis. Histol Histopathol. 24:175–185.
2009.PubMed/NCBI
|
|
92
|
Rho M, Kim J, Jee CD, et al: Expression of
type 2 hexokinase and mitochondria-related genes in gastric
carcinoma tissues and cell lines. Anticancer Res. 27:251–258.
2007.PubMed/NCBI
|
|
93
|
Qiu MZ, Han B, Luo HY, et al: Expressions
of hypoxia-inducible factor-1alpha and hexokinase-II in gastric
adenocarcinoma: the impact on prognosis and correlation to
clinicopathologic features. Tumour Biol. 32:159–166. 2011.
View Article : Google Scholar : PubMed/NCBI
|
|
94
|
Gong L, Cui Z, Chen P, Han H, Peng J and
Leng X: Reduced survival of patients with hepatocellular carcinoma
expressing hexokinase II. Med Oncol. 29:909–914. 2012. View Article : Google Scholar
|
|
95
|
Zhan C, Shi Y, Lu C and Wang Q: Pyruvate
kinase M2 is highly correlated with the differentiation and the
prognosis of esophageal squamous cell cancer. Dis Esophagus.
26:746–753. 2013.PubMed/NCBI
|
|
96
|
Lim JY, Yoon SO, Seol SY, et al:
Overexpression of the M2 isoform of pyruvate kinase is an adverse
prognostic factor for signet ring cell gastric cancer. World J
Gastroenterol. 18:4037–4043. 2012. View Article : Google Scholar : PubMed/NCBI
|
|
97
|
Li J, Yang Z, Zou Q, et al: PKM2 and ACVR
1C are prognostic markers for poor prognosis of gallbladder cancer.
Clin Transl Oncol. 16:200–207. 2014. View Article : Google Scholar : PubMed/NCBI
|
|
98
|
Kolev Y, Uetake H, Takagi Y and Sugihara
K: Lactate dehydrogenase- 5 (LDH-5) expression in human gastric
cancer: association with hypoxia-inducible factor (HIF-1alpha)
pathway, angiogenic factors production and poor prognosis. Ann Surg
Oncol. 15:2336–2344. 2008. View Article : Google Scholar
|
|
99
|
Yu SJ, Yoon JH, Yang JI, et al:
Enhancement of hexokinase II inhibitor-induced apoptosis in
hepatocellular carcinoma cells via augmenting ER stress and
anti-angiogenesis by protein disulfide isomerase inhibition. J
Bioenerg Biomembr. 44:101–115. 2012. View Article : Google Scholar
|
|
100
|
Zhou Y, Tozzi F, Chen J, et al:
Intracellular ATP levels are a pivotal determinant of
chemoresistance in colon cancer cells. Cancer Res. 72:304–314.
2012. View Article : Google Scholar : PubMed/NCBI
|
|
101
|
Vander Heiden MG, Christofk HR, Schuman E,
et al: Identification of small molecule inhibitors of pyruvate
kinase M2. Biochem Pharmacol. 79:1118–1124. 2010.PubMed/NCBI
|
|
102
|
Feldman RI, Wu JM, Polokoff MA, et al:
Novel small molecule inhibitors of 3-phosphoinositide-dependent
kinase-1. J Biol Chem. 280:19867–19874. 2005. View Article : Google Scholar : PubMed/NCBI
|