Introduction
Guanine (G)-quadruplexes (G-4) are non-canonical
nucleic acid conformations formed by G-rich sequences based on the
formation of G-quartets, stabilized by Hoogsteen-type hydrogen
bonds between G and by interaction with cations located between the
tetrads. G-4s may assemble into stacked intra- or inter-molecular
four-stranded structures, the latter being more likely to form
in vivo (1). G-4s have been
shown to possess an extremely high degree of polymorphism. The
final adopted structure depends on several factors, including base
sequence, strand orientation, loop connectivity and presence and
type of cations. DNA strands in G-4 take anti-parallel, parallel,
or hybrid conformations, and the nucleotide linkers between
G-quartets can adopt a multitude of loop structures (2,3).
These structures were initially identified in
telomeres, the G-rich DNA sequence located at the ends of
eukaryotic chromosomes (4), and
now it is well known that putative G-4-forming sequences are
present within regulatory elements (e.g., promoter, untranslated
regions) or bodies of several genes, leading to the notion that
G-4s may be involved in several aspects of cell biology (5–7). In
this context, a bioinformatic analysis identified ~370,000
candidate sequences within the human genome that, at least
theoretically, may form G-4 structures. These are frequently found
in proto-oncogenes rather than in tumor suppressor genes (2). In particular, the most well
structurally and functionally characterized G-4-forming sequences
have been found in the promoter region of oncogenes, such as MYC,
KIT, BCL2 (8). According to Brooks
et al (9) it is possible to
recognize one or more factors involved in each hallmark of cancer
(10) the gene sequence of which
may fold into a G-4. In this context, a G-rich region located at
−22 and −90 nucleotides from the transcription start site within
the telomerase reverse transcriptase (TERT) gene promoter
has been documented to contain 12 consecutive G-tracts, embracing
three SP1 binding sites. This sequence is potentially able
to fold into G-4 structures (11),
the formation of which may exert an inhibitory effect on
TERT promoter transcriptional activity and hence resulting
in the suppression of telomerase activity.
Although the physiological role of G-4 structures
still needs to be intensively investigated, a growing body of
evidence suggests that such non-B conformations of DNA may
represent attractive targets for broad-spectrum anticancer
therapies (12). Indeed, G-4s can
be induced and stabilized by small molecules generally presenting
large flat aromatic moieties and cationic side chains. Treatment of
cells with G-4-stabilizing compounds has been shown to alter
expression of many genes harbouring such sequences (5,9,13–16).
To date, a diverse array of G-4 stabilizing compounds has been
identified (17,18). Among them, numerous tri- and
tetra-substituted naphthalene diimides (NDIs) have shown high
affinity for telomeric G-4s and good antiproliferative activity in
different experimental human tumor models (19–24).
During development of hybrid ligand-alkylating
agents, we have recently synthesized a trisubstituted
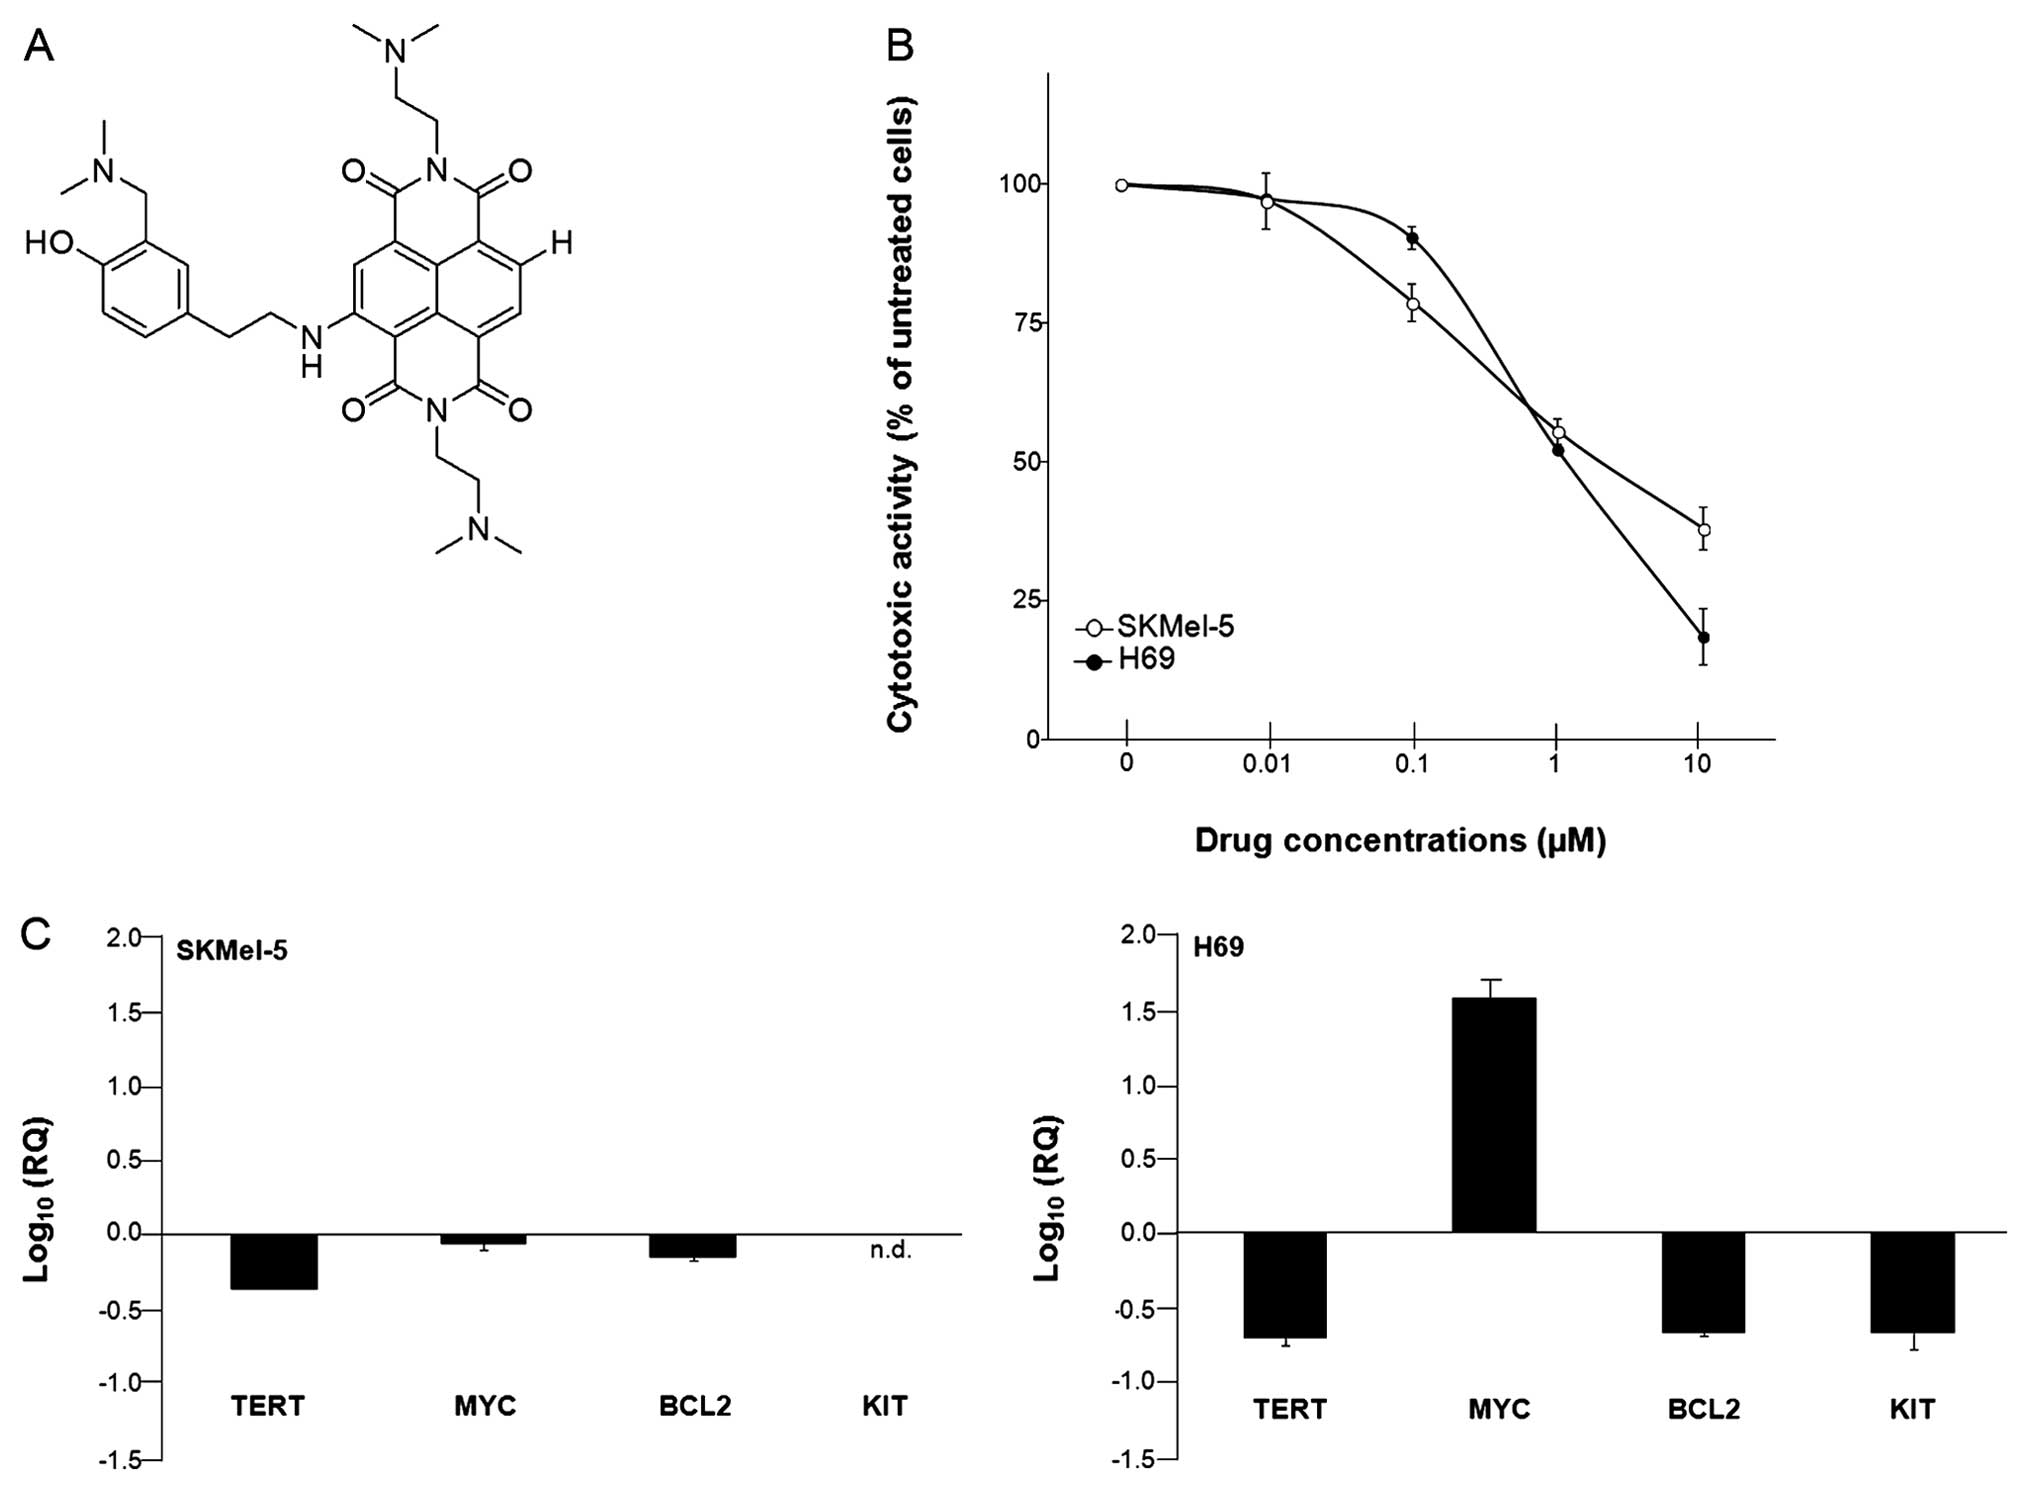
naphtalendiimide compound (H-NDI-NMe2) (Fig. 1A) that displays high affinity and
stabilization properties towards the human telomeric sequence
(21). In addition,
H-NDI-NMe2 was able to significantly impair melanoma
cell growth by causing telomere dysfunction and inhibition of
telomerase activity, likely as a consequence of its interference
with the expression levels of MYC and TERT (21).
In the present study, we further investigated the
mechanism of action of the H-NDI-NMe2 derivative. In
particular, the capability of the molecule to interfere with the
expression levels of genes, such as MYC, TERT,
KIT and BCL2, known to bear G-4 forming sequences
within their promoters, has been investigated in human tumor cell
lines of different histological origin. The exposure to
H-NDI-NMe2 resulted in a cell type-dependent
perturbation of the expression levels of the four selected genes.
Biophysical and molecular analyses revealed that
H-NDI-NMe2 bound with high affinity and effectively
stabilized mainly MYC and BCL2. The mRNA levels of both genes were
affected by NDI treatment. Global gene expression analysis showed
modulation of genes implicated in telomere function and mechanisms
of cancer; however, G-4-mediated regulation of gene expression by
H-NDI-NMe2 was largely dependent on the cell
context.
Materials and methods
H-NDI-NMe2 synthesis
The functionalized naphthalene diimide
H-NDI-NMe2 was synthesized, characterized, and purified
according to a published protocol, optimized by our group (21).
Oligonucleotides
All oligonucleotides were purchased from
Sigma-Aldrich S.r.l. (Milan, Italy). After an initial dilution at 1
mM in purified water, further dilutions were carried out in the
relevant buffer. The sequences of the oligonucleotides used
throughout the study are reported in Table I.
 | Table IG-rich sequences used in this
study. |
Table I
G-rich sequences used in this
study.
| Sequence name | |
Sequence
(5′→3′) and G-tracts |
|---|
|
|
|---|
| I | | II | | III | | IV | | V | | VI | | VII | | VIII | | IX | | X | | XI | | XII | |
|---|
| MYC | T | GGG | GA | GGG | TG | GGG | A | GGG | TG | GGG | AAGG | | | | | | | | | | | | | | |
| BCL2 | A | GGG | GC | GGG | CGC | GGG | AGG
AA | GGG | GGC | GGG | AGCG | GGG | CTG | | | | | | | | | | | | |
| KIT1 | A | GGG | A | GGG | CGCT | GGG | AGGA | GG | | | | | | | | | | | | | | | | | |
| KIT2 | C | GGG | C | GGG | CGC
GA | GGG | A | GGG | G | | | | | | | | | | | | | | | | |
| TERT | TTT
TT | GG
GG | A | GGGG | CT | GGG | A | GGG | CCC
GGA |
GGG
GG | CT | GGG | CCA | GGGG | CCC | GGG | A | GGGG | TC | GGG | AC | GGGG | C | GGGG | TTTT
TTTT |
| hTel22 | A | GGG | TTA | GGG | TTA | GGG | TTA | GGG | | | | | | | | | | | | | | | | | |
| hTel36 | | GGG | TTA | GGG | TTA | GGG | TTA | GGG | TTA | GGG | TTA | GGG | TTA | | | | | | | | | | | | |
Cell lines and culture conditions
Human malignant melanoma (SKMel-5) and small cell
lung cancer (H69) cell lines were obtained from the American Type
Culture Collection. Cells were tested for the absence of Mycoplasma
every 2 weeks and authenticated by the AmpFLSTR Identifiler PCR
amplification kit (PN4322288; Applied Biosystems, Monza, Italy),
according to the manufacturer’s instructions. Cells were maintained
in the logarithmic growth phase at in 5% CO2 at 37°C, in
separate incubators, using appropriate culture media supplemented
with 10% fetal bovine serum.
Analysis of NDI cytotoxic activity
To assess the cytotoxic activity of NDI, cells were
seeded at the appropriate density in 6-well plates and exposed to
increasing concentrations (from 0.01 to 10 μM) of freshly dissolved
compound for 48 h. Adherent cells were then trypsinized, collected
and counted in a particle counter (Coulter Counter; Coulter
Electronics Ltd., Luton, UK). The drug concentrations inhibiting
cell growth by 50% (IC50) were gauged by the cell growth
inhibition curves.
Analysis of the expression levels of
individual genes
Total RNA was obtained from cells either untreated
or exposed to sub-toxic concentrations of H-NDI-NMe2 by
TRIzol® reagent (15596-018; Life Technologies Italia,
Monza, Italy), according to the manufacturer’s instructions. cDNA
was randomly primed from 0.5 μg RNA and amplified using the GeneAmp
RNA PCR Core kit (N8080143; Applied Biosystems), according to the
manufacturer’s instructions. Gene expression levels were analyzed
by RT-qPCR using specific TaqMan® Assay (TERT,
Ms00972656_m1; MYC, Ms00153408_m1; KIT, Hs00174029_m1; BCL2,
Hs99999018_m1; Applied Biosystems). Amplifications were run on the
7900HT Fast Real-Time PCR System. Data were analyzed by SDS 2.2.2
software (Applied Biosystems) and reported as relative quantity
(RQ) with respect to a calibrator sample (i.e., RNA from untreated
cells) according to the 2−ΔΔCt method (25). Ribonuclase P (RNaseP control
reagent, PN4316844; Applied Biosystems) was used as normalizer.
Evaluation of telomerase activity
Telomerase activity was measured on 1 μg of protein
by the telomeric repeat amplification protocol (TRAP) using the
TRAPeze kit (S7700; Millipore S.p.A., Milan, Italy) according to
manufacturer’s protocol. Each reaction product was amplified in the
presence of a 36-bp internal TRAP assay standard (ITAS). A TSR8
quantitation standard (which serves as a standard to estimate the
amount of product extended by telomerase in a given protein
extract) was included for each set of TRAP assays. PCR
amplification products were then resolved by polyacrylamide gel
electrophoresis and visualized by autoradiography.
Western immunoblotting
Total protein extracts were prepared according to
standard methods. Protein extracts (40 μg) were fractioned by
SDS-PAGE and transferred onto Hybond nitrocellulose filters (RPN
303D; GE Healthcare, Milan, Italy). Filters were blocked in
PBS-Tween-20, 5% skim milk and incubated overnight with primary
antibodies raised against MYC (mouse monoclonal, 1:500, ab32;
Abcam, Cabridge, UK), KIT (mouse monoclonal, 1:100, sc17806; Santa
Cruz Biotechnology Inc, Heidelberg, Germany), BCL2 (rabbit
monoclonal, 1:1,000, no. 4223; Cell Signaling Technology, Inc.,
Danvers, MA, USA). The filters were then probed with secondary
peroxidase-linked whole antibodies (NA934V/NA931V; GE Healthcare),
which were subsequently visualized by SuperSignal West Pico
Chemiluminescent detection system. ACTB (mouse monoclonal, 1:1,000,
ab8226; Abcam) was used on each blot to ensure equal protein
loading.
FRET-melting assays
FRET competition assay was performed with FAM
(6-carboxyfluorescein) 5′-end- and Tamra
(6-carboxy-tetramethylrhodamine) 3′-end-labelled hTel22
oligonucleotide (0.25 μM) in the presence of 0.8 μM
H-NDI-NMe2 and of G-quadruplex competitors, namely MYC,
BCL2, KIT (KIT1, KIT2) and TERT (Table
I). The ds26 oligomer [5′-d(CAATCGGATCGAATTCGATCCG ATTG)3′] was
used as control for duplex DNA. Fluorescence melting curves were
determined with a LightCycler II (Roche Diagnostics S.p.A, Monza,
Italy) real-time PCR machine, using a total reaction volume of 20
μl, with 0.25 μM of tagged oligo-nucleotide in a buffer containing
10 mM lithium cacodylate pH 7.4, 50 mM KCl. After a first
equilibration step at 30°C for 2 min, a stepwise increase of 1°C
every minute for 65 cycles to reach 95°C was performed and
measurements were made after each cycle with excitation at 470 nm
and detection at 530 nm. The melting of the G-quadruplex +
H-NDI-NMe2 was monitored alone or in the presence of
various concentrations of competitor oligonucleotides. Final
analysis of data was carried out using Excel and SigmaPlot
software. Emission of FAM was normalized between 0 and 1, and
T1/2 was defined as the temperature at which the
normalized emission was 0.5. T1/2 values were mean of
2–3 experiments and ΔT1/2 was calculated as
T1/2 difference in the presence and absence of
H-NDI-NMe2.
SPR study
Surface plasmon resonance (SPR) measurements were
performed with Biacore T100 System using streptavidin-coated sensor
chips (Series S, Sensor chip SA) (both from GE Healthcare). The
5′-biotinylated sequences (hTel22, TERT, MYC, BCL2) (Table I) were heated to 95°C and annealed
by slow cooling to form quadruplex in filtered and degassed 10 mM
HEPES buffer with 200 mM KCl with 0.005% surfactant Tween-20, at pH
7.4. Two chips were used; in each chip flow cell 1 was left blank
as control to account for any signal generated owing to bulk
solvent effect or any other effect not specific to the DNA
interaction, which was subtracted from the signal obtained in the
sample flow cells. All experiments were performed at 25°C using
running buffer (0.22 μm filtered and degassed 10 mM HEPES with 200
mM KCl and 0.005% surfactant Tween-20) at pH 7.4. Oligonucleotide
immobilized surface was exposed to the running buffer for at least
2 h at a flow rate of 30 μl min−1 for attaining baseline
stability. H-NDI-NMe2 analyte solutions at different
concentrations (1×10⁻⁹–1×10⁻⁶ M) were
prepared in the running buffer and were injected (at 30 μl
min−1 for 120 sec) in series. Following this,
dissociation from the surface was monitored for 300 sec in running
buffer. Regeneration was performed with 10 mM glycine. Analysis of
the binding sensorgrams was carried out using 1:1 binding sites
model in the BIA evaluation software 2.0.3 (GE Healthcare).
Experiments were carried out in triplicates and the standard error
was calculated.
CD analysis
Circular dichroism (CD) experiments were performed
on a Jasco J-810 spectropolarimeter (Jasco Europe S.r.l., Milan,
Italy) equipped with a NESLAB temperature controller (Thermo Fisher
Scientific, Milan, Italy) and interfaced to a PC100. A quartz
cuvette with 5 mm path length was used for spectra recorded from
230 to 350 nm at 2 nm bandwidth, 0.1 nm step size, and 4 sec time
per point. The reported spectrum of each sample represents the
average of two scans. Observed ellipticities were converted to mean
residue ellipticity (θ) = deg × cm2 × dmol−1
(molar ellipticity). The oligomers were diluted from stock to the
final concentration (4 μM) in Li cacodylate buffer (10 mM, pH 7.4)
with 50 mM KCl and then annealed by heating at 95°C for 5 min,
gradually cooled to room temperature, and measured after 24 h.
H-NDI-NMe2 was added at 16 μM final concentration.
For thermal unfolding, CD spectra were recorded from
20 to 95°C, with temperature increase of 5°C, and processed as
above. Tm values were calculated according to the van’t
Hoff equation, applied for a two state transition from a folded to
unfolded state, assuming that the heat capacity of the folded and
unfolded states are equal (26).
Binding stoichiometry was determined by the
continuous variation method (Job plot). Solutions of MYC or BCL2
and H-NDI-NMe2 were mixed in different proportions
maintaining a total concentration of DNA + H-NDI-NMe2 of
10 μM. The mole fractions for DNA/(DNA + H-NDI-NMe2)
were 0.12, 0.15, 0.20, 0.27, 0.31, 0.35, 0.37, 0.46, 0.50, 0.55,
0.60. The mole fraction of the DNA was plotted against the molar
ellipticity at 290 nm of the DNA + H-NDI-NMe2 complex.
In the plot, the mole fraction of the DNA at which the molar
ellipticity of the DNA + H-NDI-NMe2 complex is maximum,
gives the stoichiometry of the complex. The number of
H-NDI-NMe2 binding sites is equivalent to (1 - x)/x,
where x is the DNA fraction at the intersection of the two fitting
straight lines. All samples were allowed to equilibrate overnight.
A buffer baseline was collected in the same cuvette and subtracted
from the sample spectra.
Taq polymerase stop assay
Primer was labelled with [γ-32P]-ATP
(PerkinElmer, Milan, Italy) using T4 polynucleotide kinase (Thermo
Fisher Scientific) for 30 min at 37°C and purified with Illustra
MicroSpin G-25 Column (GE Healthcare). 5′-end-labeled primer (final
concentration 70 nM) [primer MYC Taq
5′-d(ATCGATCGCTTCTCGTCCGCTAACC TTC)-3′; primer BCL2
Taq 5′-d(ATCGATCGCTTCTCGTCAGCCCCGCT)-3′] was annealed to
the template bearing the sequence of interest (final concentration
36 nM, in lithium cacodylate buffer, 10 mM, pH 7.4) [MYC wt Taq
template 5′-d(CTGGGGAGGGTGGGGAGGGTGGGGAAGGTTAG CGG)-3′; BCL2 wt Taq
template 5′-d(AGGGGCGGGCGC GGGAGGAAGGGGGCGGGAGCGGGGCTG)-3′] or a scrambled
non-G-quadruplex forming sequence [MYC scrambled Taq template
5′-d(CTGGAAAGAGTGAAGAGAGAGTGAAGAAGGTTAGCGG)-3′; BCL2
scrambled Taq template 5′-d(AGAAGCGAAAGCGAAAGGAAGAAGAAA
AAGCGGGGCTG)-3′].
Underlined bases indicate complementary bases in the primer and
template strands. Where appropriate, KCl was added and the mixture
was let annealed by heating at 95°C for 5 min, gradually cooled to
room temperature, and incubated at 4°C overnight. Mixtures were
incubated with NDI for 20 min at room temperature in the presence
of 100 mM KCl. Primer extension was conducted with 2 U of AmpliTaq
Gold DNA Polymerase (2 U/reaction; Applied Biosystems, Carlsbad,
CA, USA) at 47°C for 30 min. The reaction was stopped by EtOH
precipitation and primer extension products were separated on a 12%
denaturing gel and visualized by phosphorimaging (Typhoon FLA 9000;
GE Healthcare).
Gene expression analysis
Total RNA was isolated from untreated and
NDI-treated cells using Qiagen RNeasy Mini kit (74104; Qiagen
S.r.l., Milan, Italy) and digested with 20 U RNase-free DNase I
(79254; Qiagen S.r.l.), according to the manufacturer’s
instructions. The expression levels of 28 key genes related to
telomere replication and maintenance (TRM) and of 92 genes
associated with the molecular mechanisms of cancer were assessed
using TaqMan® Arrays (PN4418832 and PN4418806; Applied
Biosystems). The expression values were assessed by RT-qPCR
according to the manufacturer’s instructions. Modulation of gene
expression in treated compared to untreated cells was assessed by
the 2−ΔΔCt method. The 18S housekeeping gene present in
each array was used as norma lizer. Differentially expressed genes
in treated vs. untreated cells were sorted based on P<0.05
(Student’s t-test) and consi dered up- or downregulated by set a
fold-change of 1.5 as cut-off.
Results and Discussion
Effects of H-NDI-NMe2 on the
expression levels of genes known to be affected following G-4
stabilization
Short-term cytotoxic activity of
H-NDI-NMe2 (Fig. 1A)
was first tested against two cancer cell lines of different
histological origin, namely human malignant melanoma SKMel-5 and
small cell lung cancer H69 cells. Results showed a dose-dependent
inhibition of cell growth in both experimental models after a 48-h
exposure to increasing drug concentrations (Fig. 1B). The compound was active in the
micromolar range and no significant differences in the sensitivity
to H-NDI-NMe2 were observed between the two cell lines,
as revealed by the IC50 values (1.75±0.18 μM and
1.18±0.04 μM for SKMel-5 and H69 cells, respectively) obtained from
at least three independent experiments.
As previously reported, H-NDI-NMe2
derivative exerted an inhibitory effect on the catalytic activity
of telomerase in SKMel-5 cells that seemed to primarily occur as a
consequence of drug-mediated decrease of TERT and MYC mRNA
expression levels (21). To
further investigate the capability of the compound to interfere
with the expression of selected genes, we focused on TERT, MYC, KIT
and BCL2, which have been reported to undergo inhibition following
ligand-mediated stabilization of G-4 structures within their
promoters (8).
In this context, dose-response curves were
instrumental to guide the choice of H-NDI-NMe2
concentration to be used for the analysis of gene expression
levels. A 48-h exposure of cells to sub-toxic concentrations of the
ligand (corresponding to ~1/3 of the relative IC50
values) resulted in a cell type-dependent modulation in the
expression levels of selected genes (Fig. 1C). Real-time RT-PCR data showed a
marked reduction of TERT expression levels (Fig. 1C), which was more pronounced in H69
(RQ, 0.20±0.02) compared to SKMel-5 cells (RQ, 0.44±0.002). A
downregulation of BCL2 expression levels (Fig. 1C) was observed in both cell lines.
Again, such a decrease was markedly pronounced in H69 with respect
to melanoma cells (RQ, 0.21±0.01 and 0.73±0.05, respectively). In
addition, small cell lung cancer cells were also characterized by a
pronounced decrease in the expression levels of KIT (RQ,
0.22±0.06), which in turn was not detectable in melanoma cells
(Fig. 1C).
Taking into account that MYC is involved, at least
in part, in the transcriptional control of TERT, its gene
expression levels were assessed in both NDI-treated cells. In
keeping with our previous findings (21), the exposure of SKMel-5 to
H-NDI-NMe2 resulted in a decrease, though minimal, of
MYC expression levels (RQ, 0.89±0.08). Conversely, a pronounced
increase in the level of MYC gene expression (Fig. 1C) was observed in H69 cells
following treatment with H-NDI-NMe2 (RQ, 38.2±8.4). It
should be taken into account that the extent to which MYC
expression levels were increased in H69 cells upon NDI treatment
may simply reflect the fact that its mRNA basal expression levels
were almost undetectable in untreated cells. By real-time RT-PCR,
MYC was detectable at a threshold cycle (Ct) of ~35. This evidence
indeed accounted for the magnification of the differences in the
gene expression levels observed in treated (Ct=29) vs. untreated
samples following the use of the 2−ΔΔCt method. To note,
however, the G-4-mediated increase in MYC expression levels has
already been reported. Polyamines (i.e., spermidine and spermine)
may stabilize and favor quadruplex formation over duplex within the
nuclease hypersensitive element (NHE)III upstream of P1
promoter of MYC (27). The
exposure of HeLa cells to increasing concentration of spermidine
and spermine resulted in a concentration-dependent increase of MYC
transcript levels and abrogated the inhibitory effect of TMPyP4, a
non-selective porphyrin-based G-4 ligand, on MYC transcription,
suggesting that both polyamines and TMPyP4 stabilize MYC G-4, but
cause opposite effects on gene transcription (27). It has been proposed that polyamines
induce a structural transition of MYC G-4 toward a
transcriptionally active motif (probably the parallel conformer),
with likely distinctive molecular recognition properties for
transcription factors, which drives MYC expression. Conversely,
TMPyP4 does not induce any structural change in MYC G-4
conformation, but it simply masks or competes with the binding of
transcription factors, thus resulting in the inhibition of gene
transcription (27). Similarly,
the perturbation of the equilibrium between quadruplex and duplex
structures of MYC induced by a locked nucleic acid trap, which
favors duplex over quadruplex structure, resulted in the silencing
of MYC expression (28). Moreover,
the cellular nucleic-acid-binding protein (CNBP) promotes the
formation of a parallel G-4 within the NHEIII region of
MYC and favors the activation of gene transcription in vitro
(29). A competition between CNBP
and TMPyP4 has been documented. This evidence highlights the
prevalent role of CNBP in inducing structural transitions that
favors parallel G-4 conformers over those stimulated by TMPyP4,
even when these measurements were carried out at CNBP:TMPyP4 molar
ratio of 1:10 (29). Of note, the
basic N-terminal region of CNBP shares biochemical features with
polyamines and it is required for the promotion of G-4 folding
(29).
H-NDI-NMe2 preferentially
binds and greatly stabilizes G-quadruplexes within the promoter of
MYC and BCL2
The binding properties of H-NDI-NMe2 were
investigated towards a panel of G-4-forming oligonucleotides,
corresponding to the promoter regions of MYC, BCL2, KIT (KIT1 and
KIT2) and TERT (Table I) and
compared to the binding properties against the telomeric sequence
(hTel22) (Table I) which have been
previously acquired (21).
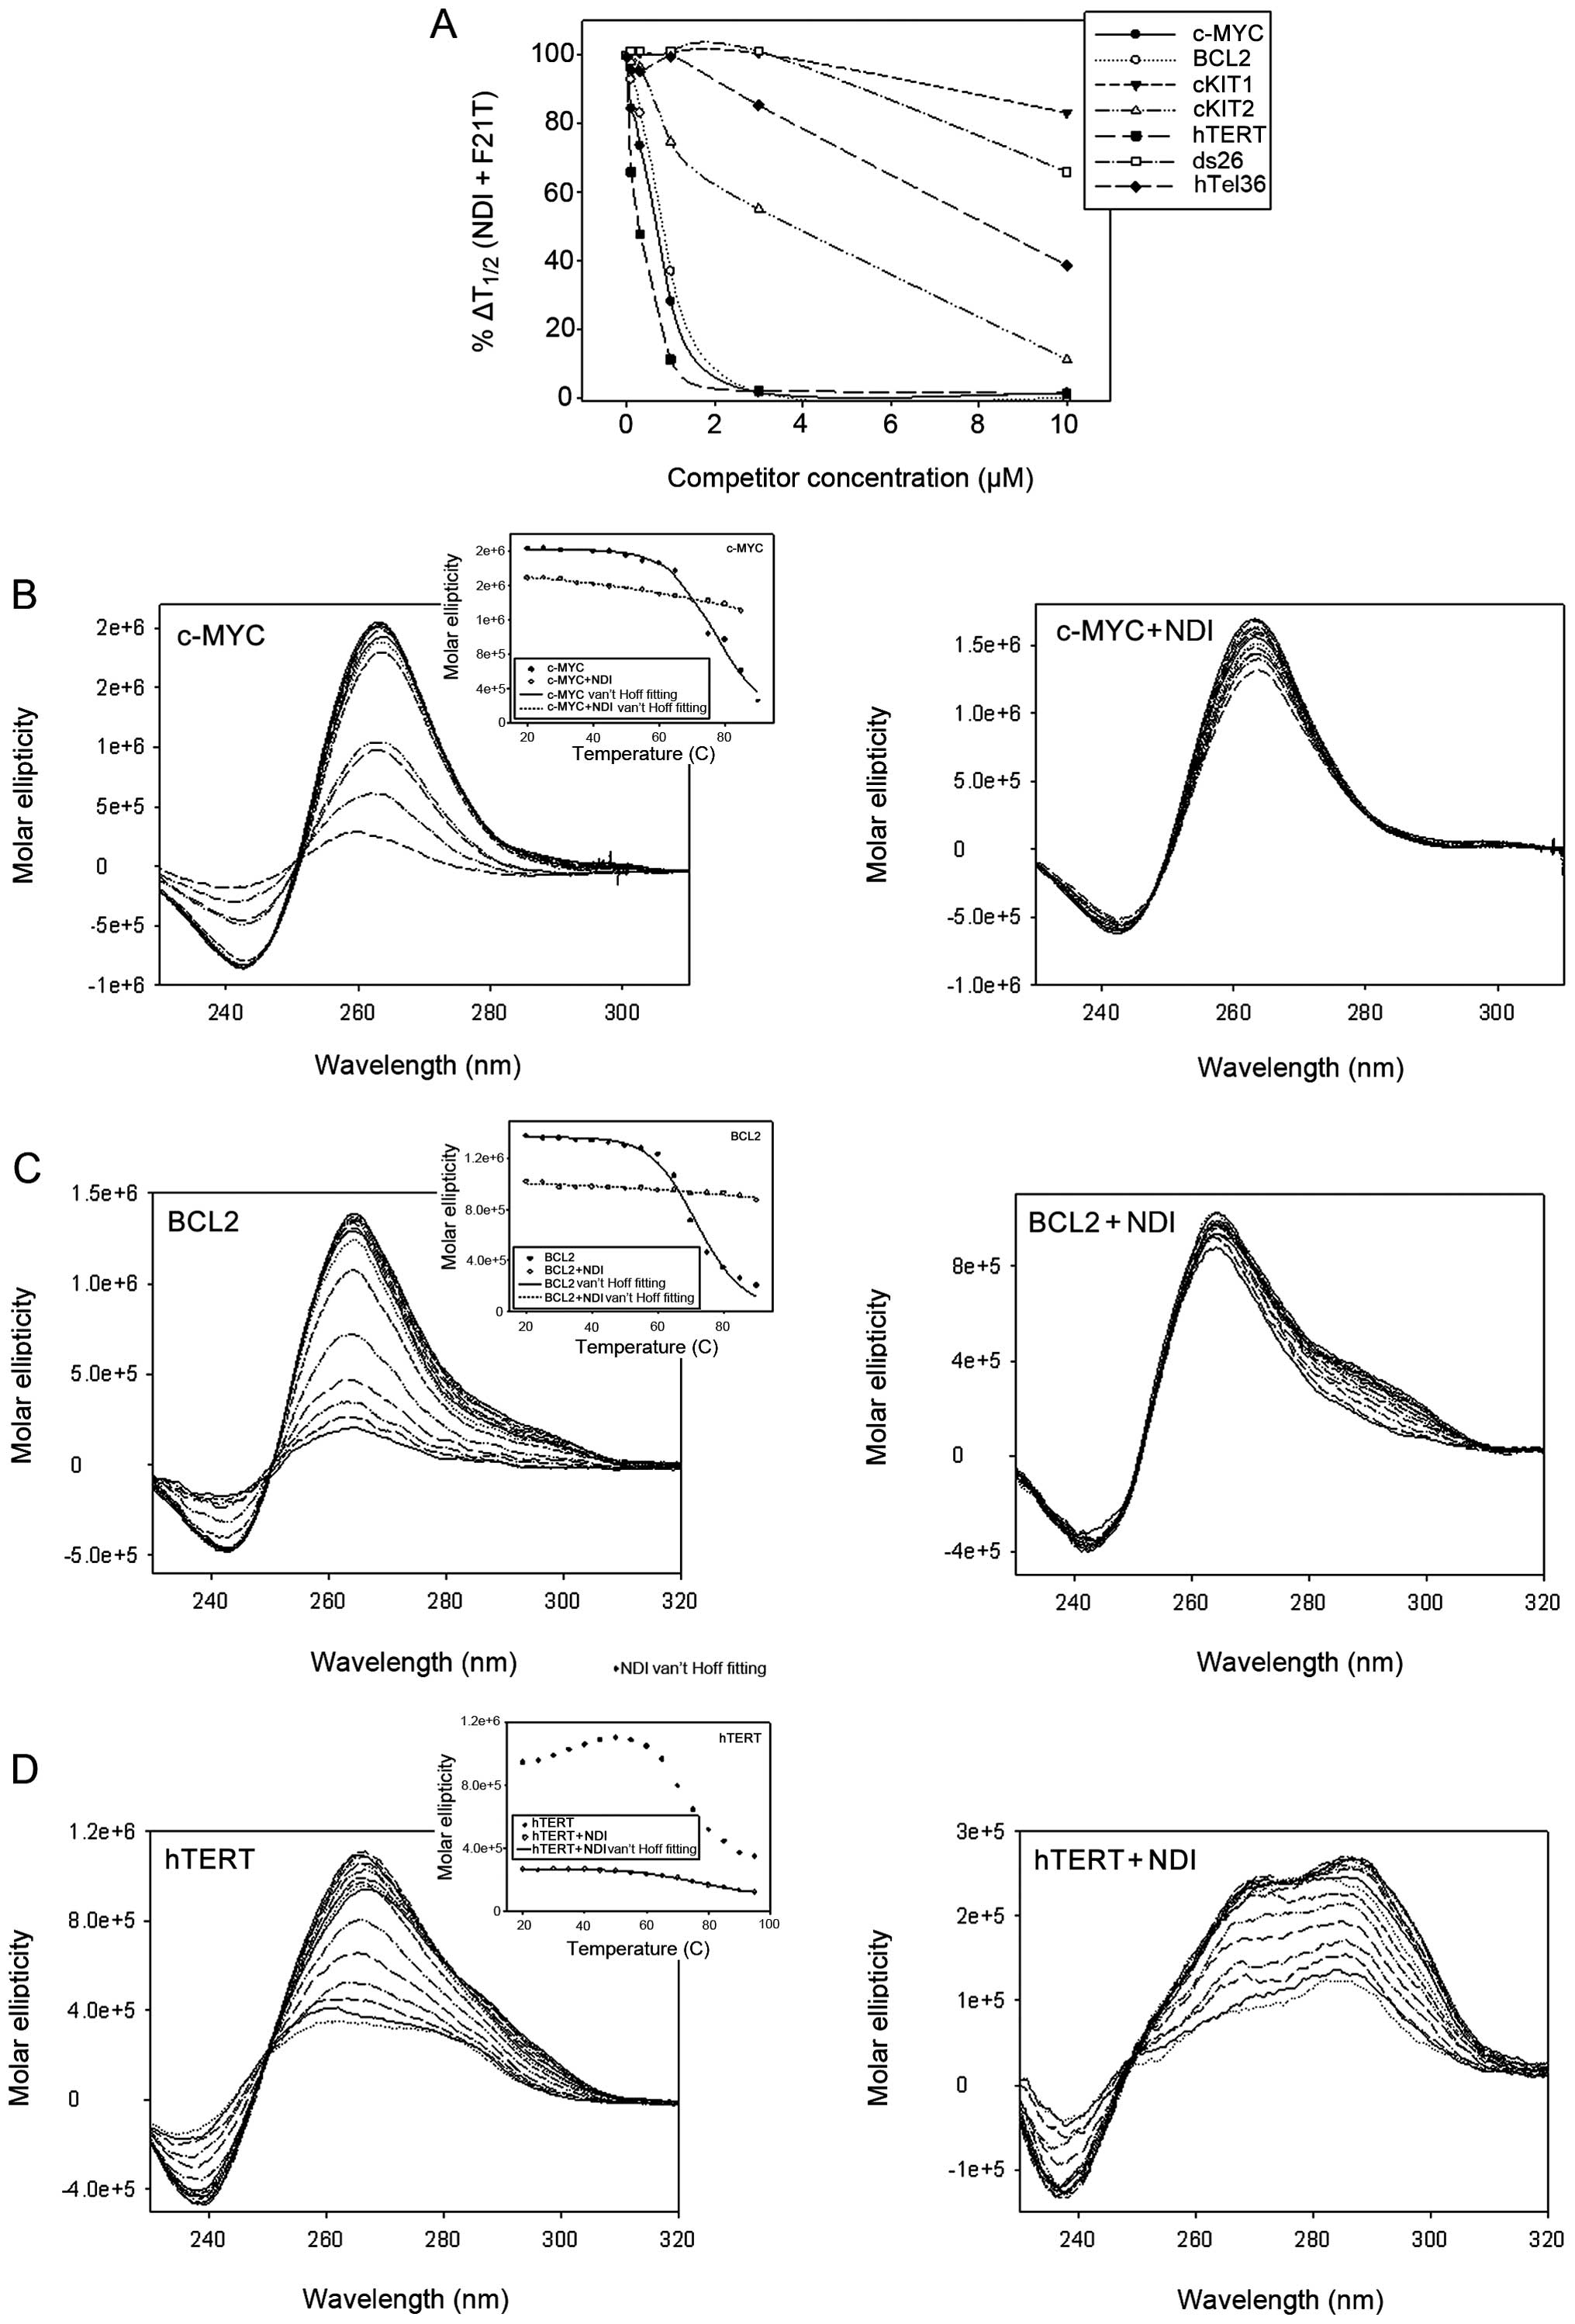
Initially, a FRET competition experiment was
employed to identify the G-4 sequences displaying high affinity for
H-NDI-NMe2. The FAM/TAMRA-labelled hTel22 sequence (0.25
μM) (Table I) was incubated with
H-NDI-NMe2, in the presence of 50 or 150 mM
K+, and exposed to increasing concentrations of
competitor G-4 sequences. In both salt conditions the best
competing sequence was TERT, followed by MYC and BCL2. The KIT2
sequence resulted to be a poor competitor, whereas both KIT1 and
dsDNA were not able to disrupt H-NDI-NMe2 binding to
hTel22 (Table II) (Fig. 2A). Since long oligonucleotides
(i.e., TERT, MYC, BCL2), likely forming multiple G-4 structures,
were the best competitor sequences, a 36-bp-long telomeric sequence
(hTel36) (Table I) was
additionally tested. However, in this case low competition was
obtained (Fig. 2A), indicating
that the efficient competition observed with TERT, MYC and BCL2 was
sequence specific and not simply dependent on steric features.
These data were corroborated by the higher affinity constant (KD)
values at 25°C of H-NDI-NMe2 towards TERT (0.42±0.04
μM), MYC (0.39±0.03 μM) and BCL2 (0.33±0.03 μM) with respect to
hTel22 (3.12±0.04 μM), obtained by SPR analysis.
| Table IIProperties of H-NDI-NMe2
binding and stabilization towards G-4 oncogene promoters and the
control telomeric sequence hTel22. |
Table II
Properties of H-NDI-NMe2
binding and stabilization towards G-4 oncogene promoters and the
control telomeric sequence hTel22.
| G-4 DNA | FRET
CC50 competition (μM) | CD Tm
(°C, 260 nm) | CD Tm
(°C) |
|---|
|
|
| |
|---|
| 50 mM
K+ | 150 mM
K+ | no NDI | NDI (16 μM) | |
|---|
| hTel22 | - | - | 66.1±1.2 | 84.9±0.3 | 18.8 |
| MYC | 0.21±0.01 | 0.51±0.03 | 84.0±0.4 | >100 | >16 |
| BCL2 | 0.46±0.02 | 0.64±0.06 | 72.0±0.7 | >100 | >28 |
| KIT1 | >10 | >10 | 72.8±1.3 | 88.0±0.5 | 15.2 |
| KIT2 | 2.0±0.8 | 3.1±0.08 | 79.0±1.1 | 97.8±1.7 | 18.8 |
| TERT | 0.08±0.01 | 0.20±0.03 | 65.4±0.9 | 77.6±1.2 | 12.2 |
| dsDNA | >10 | >10 | n.d. | n.d. | n.d. |
CD was next employed to analyse both the stability
and prevalent conformation of the G-quadruplex forming
oligonucleotides in the presence of H-NDI-NMe2. We found
that H-NDI-NMe2 maintained a prevalent parallel
conformation in MYC, BCL2, KIT1 and KIT2 (Fig. 2B and C, and data not shown),
whereas it induced a hybrid-like topology in TERT (Fig. 2D). These data are in keeping with
those reported in literature and concerning the biophysical
characterization of G-4 conformers of the selected genes in the
presence or absence of specific ligands (11,29–31).
The evidence that H-NDI-NMe2 maintained a
parallel MYC G-4 conformer deals with the observed increase in the
gene expression levels in H69 cells upon NDI exposure, as also
suggested by the findings that polyamines and CNBP both stimulate
MYC transcriptional activity by favouring the formation of a
parallel G-4 structure within the gene promoter (26,28).
Conversely, the well-known inhibitory activity of the cationic
porphyrin TMPyP4 on MYC expression levels likely resides in the
drug-mediated conformational conversion from parallel into either a
parallel/anti-parallel mixture or anti-parallel-type MYC G-4
(29).
Downregulation of KIT expression levels by
ligand-mediated stabilization of G-4 structures within the gene
promoter have been consistently documented (32–35).
Conversely, different layers of complexity have been reported
regarding the G-4-forming sequences within the BCL2 promoter
(36,37). In fact, it has been demonstrated
that BCL2 may form diverse G-4 structures with a parallel- or
mixed-type conformation, the biological significance of which still
need to be disclosed (31).
However, the existence of G-4-forming sequences within the BCL2
promoter points towards their possible role in modulating gene
expression. Depending on which G-4 conformer is predominant in
vivo variable biological consequences may be expected upon
stabilization by diverse ligands (37).
In addition, both MYC and BCL2 were highly
stabilized by H-NDI-NMe2 binding
(Tm>100°C), whereas treatment of TERT, KIT1 and KIT2
G-4-folded oligonucleotides with H-NDI-NMe2-treated
resulted in Tm<98°C; these latter values are
comparable to the stabilization observed with hTel22 at 260 nm
(Table II) (21). It is noteworthy that in the case of
MYC and BCL2 the molar ellipticity signal was slightly decreased
upon addition of the H-NDI-NMe2 (Fig. 2B and C), whereas a remarkable
decrease along with a variation in the spectral features was
observed for TERT (Fig. 2D),
indicating a significant destabilization of the initial G-4
topology.
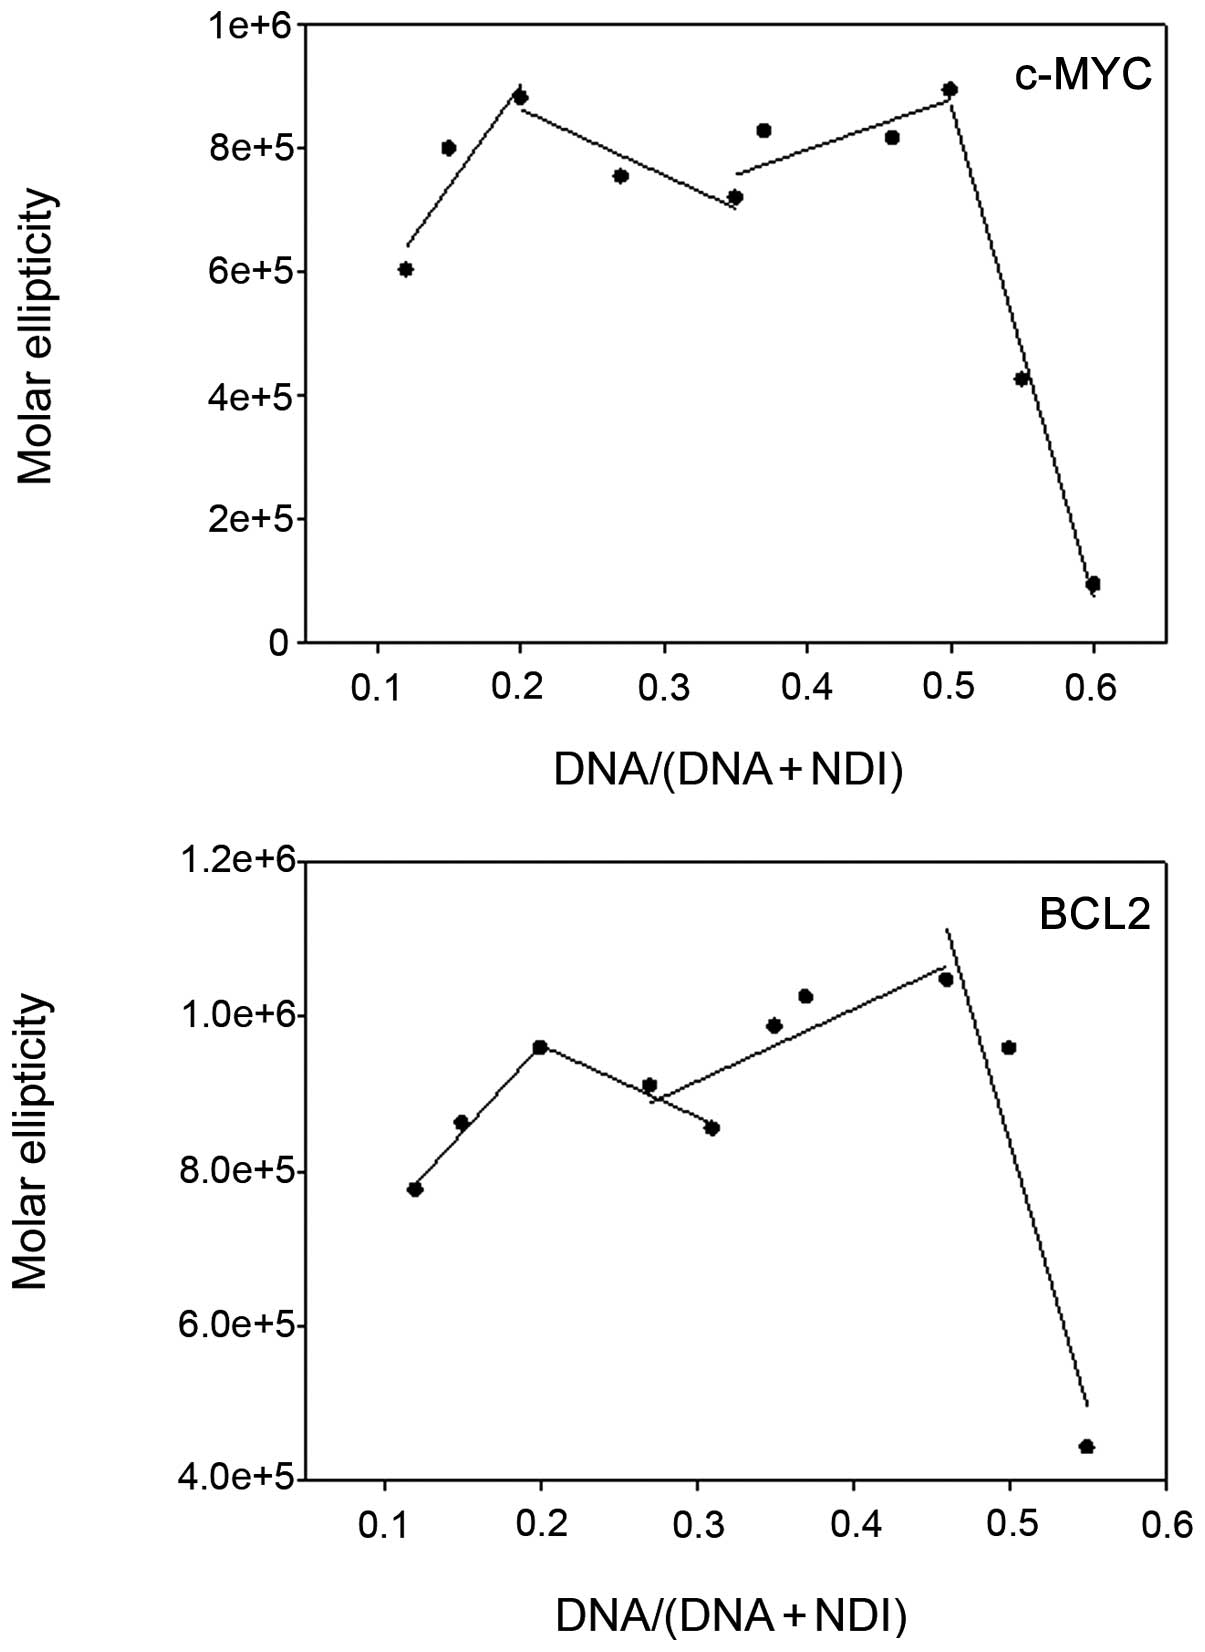
Since the best bound and stabilized G-4s are long
sequences within MYC and BCL2 composed of 5–6 GGG repeats that may
form multiple tetraplexes, H-NDI-NMe2 binding
stoichiometry towards these sequences was investigated by
CD-monitored Job plot analysis. Results showed that a 1:1 complex
was stabilized in both MYC and BCL2 sequences in the presence of
high DNA/(DNA + NDI) ratios, whereas up to four NDI molecules bound
to the G-4 structure, forming a stable complex at low DNA/(DNA +
NDI) ratios (Fig. 3). These data
are in line with the binding stoichiometry observed for hTel22 (up
to four bound molecules) (21),
indicating that the higher affinity of H-NDI-NMe2 for
MYC and BCL2 with respect to hTel22 did not rely on the number of
NDI molecules bound to the G-4.
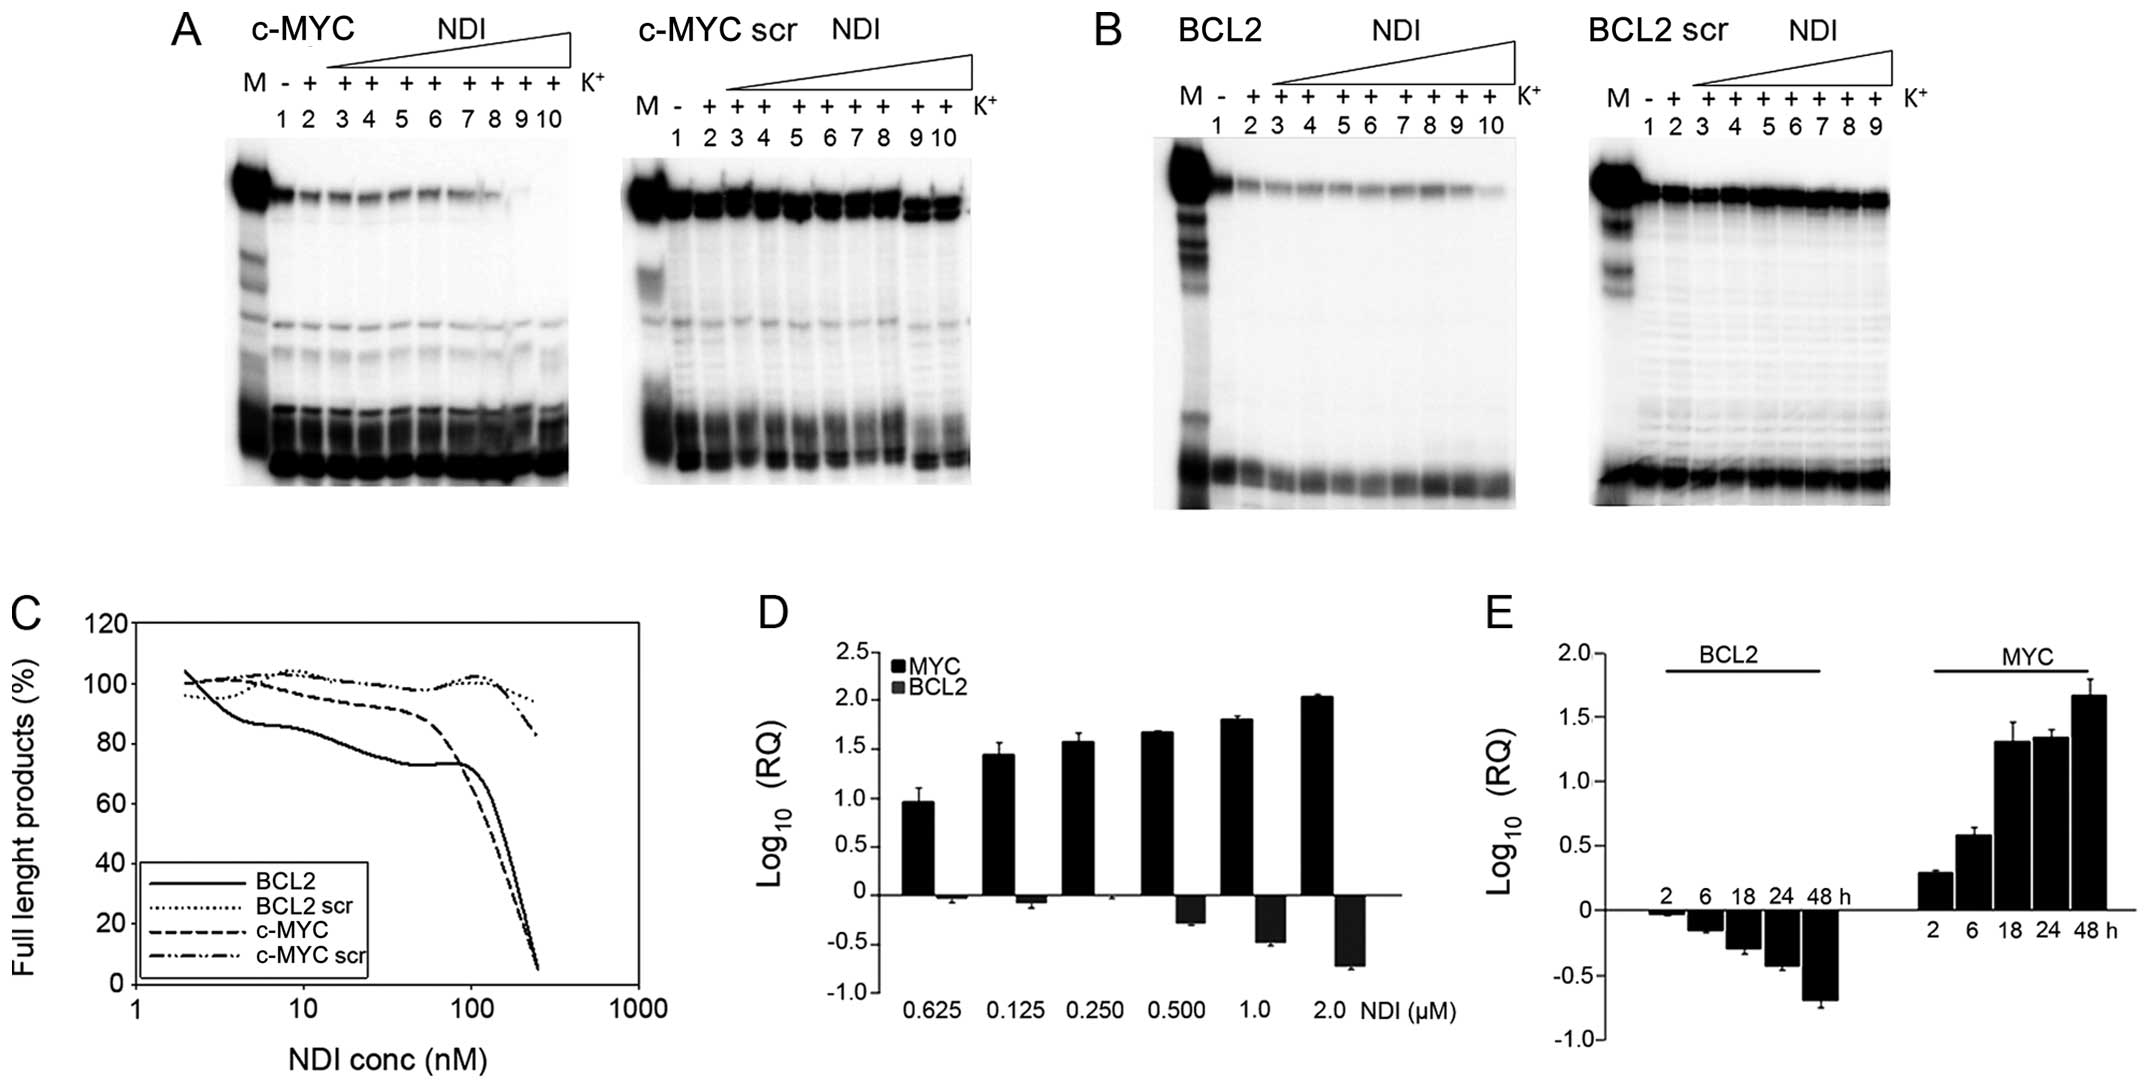
Further evidence of MYC and BCL2 G-4 stabilization
by H-NDI-NMe2 was provided by the Taq polymerase stop
assay. Because primers were designed to anneal in part to the
G-rich sequence involved in G-4 formation, inhibition of the
full-length primer-extended product was expected upon G-4 folding.
As shown in Fig. 4, the strong
inherent MYC and BCL2 G-4 stability in the presence of
K+ partly impaired enzyme processing, even in the
absence of NDI. Indeed, MYC and BCL2 full-length products were
remarkably less in the wild-type compared to scrambled templates,
used as controls to check for the possible G4-independent
inhibition of Taq polymerase mediated by H-NDI-NMe2
(Fig. 4A and B, lane 2).
Similarly, in the absence of K+, full-length run-offs
were less abundant in wild-type than in scrambled templates
(Fig. 4A and B, lane 1), even
though this effect was more evident for MYC than BCL2, thus
confirming the ability of the MYC sequence to fold into G-4
independently of K+. In addition, a dose-dependent
inhibition of the full-length products was observed in the
G-4-forming templates when the assay was performed in the presence
of increasing concentrations of H-NDI-NMe2 (Fig. 4A and B, lanes 1–9/10).
Interestingly, at 50 and 100 nM H-NDI-NMe2 no
full-length product formed in MYC and BCL2, respectively (Fig. 4A–C), indicating an extremely
efficient stabilization of the MYC and BCL2 G-4 topologies upon
H-NDI-NMe2 binding.
This evidence was also mirrored by the
concentration-dependent and the kinetics of the modulation of MYC
and BCL2 mRNA expression levels (Fig.
4D and E). A dose-dependent modulation in the expression levels
of both genes was observed in H69 cells exposed to increasing
concentrations (up to 2 μM) of H-NDI-NMe2 (Fig. 4D). In addition, the increase and
the decrease in MYC and BCL2 expression levels, respectively, was
already appreciable in cells after a 2-h exposure to 0.4 μM
H-NDI-NMe2 and they ranged in a time-dependent manner up
to a 48-h exposure to the drug (Fig.
4E).
Effects of the NDI on the protein amounts
of selected genes
To verify whether the NDI-mediated G-4 stabilization
and the consequent modulation of mRNA expression levels resulted in
perturbation in protein amounts of selected genes, further
investigations were performed in H69 cell line, which showed the
greatest modulation in the expression of selected genes upon
exposure to H-NDI-NMe2 (Fig. 1C). Specifically, no changes in MYC
and BCL2 protein amounts were evidenced by western immunoblotting
in H69 cells after a 48-h exposure to 0.4 μM H-NDI-NMe2,
whereas a pronounced decrease in KIT protein levels was observed
(Fig. 5A). In addition, consistent
with our previous data obtained in SKMel-5 cells (21) we observed in NDI-treated compared
to untreated H69 cells a marked inhibition of telomerase activity
(Fig. 5B), likely due to
drug-induced reduction in TERT expression levels. We cannot exclude
that the lack of correlation between the capability of
H-NDI-NMe2 to stabilize G-4 structures within the
promoter of the selected genes, as assessed by chemo-physical
assays, and the modulation of the relative protein amounts may
depend on compensatory responses activated by cells to cope with
the drug action.
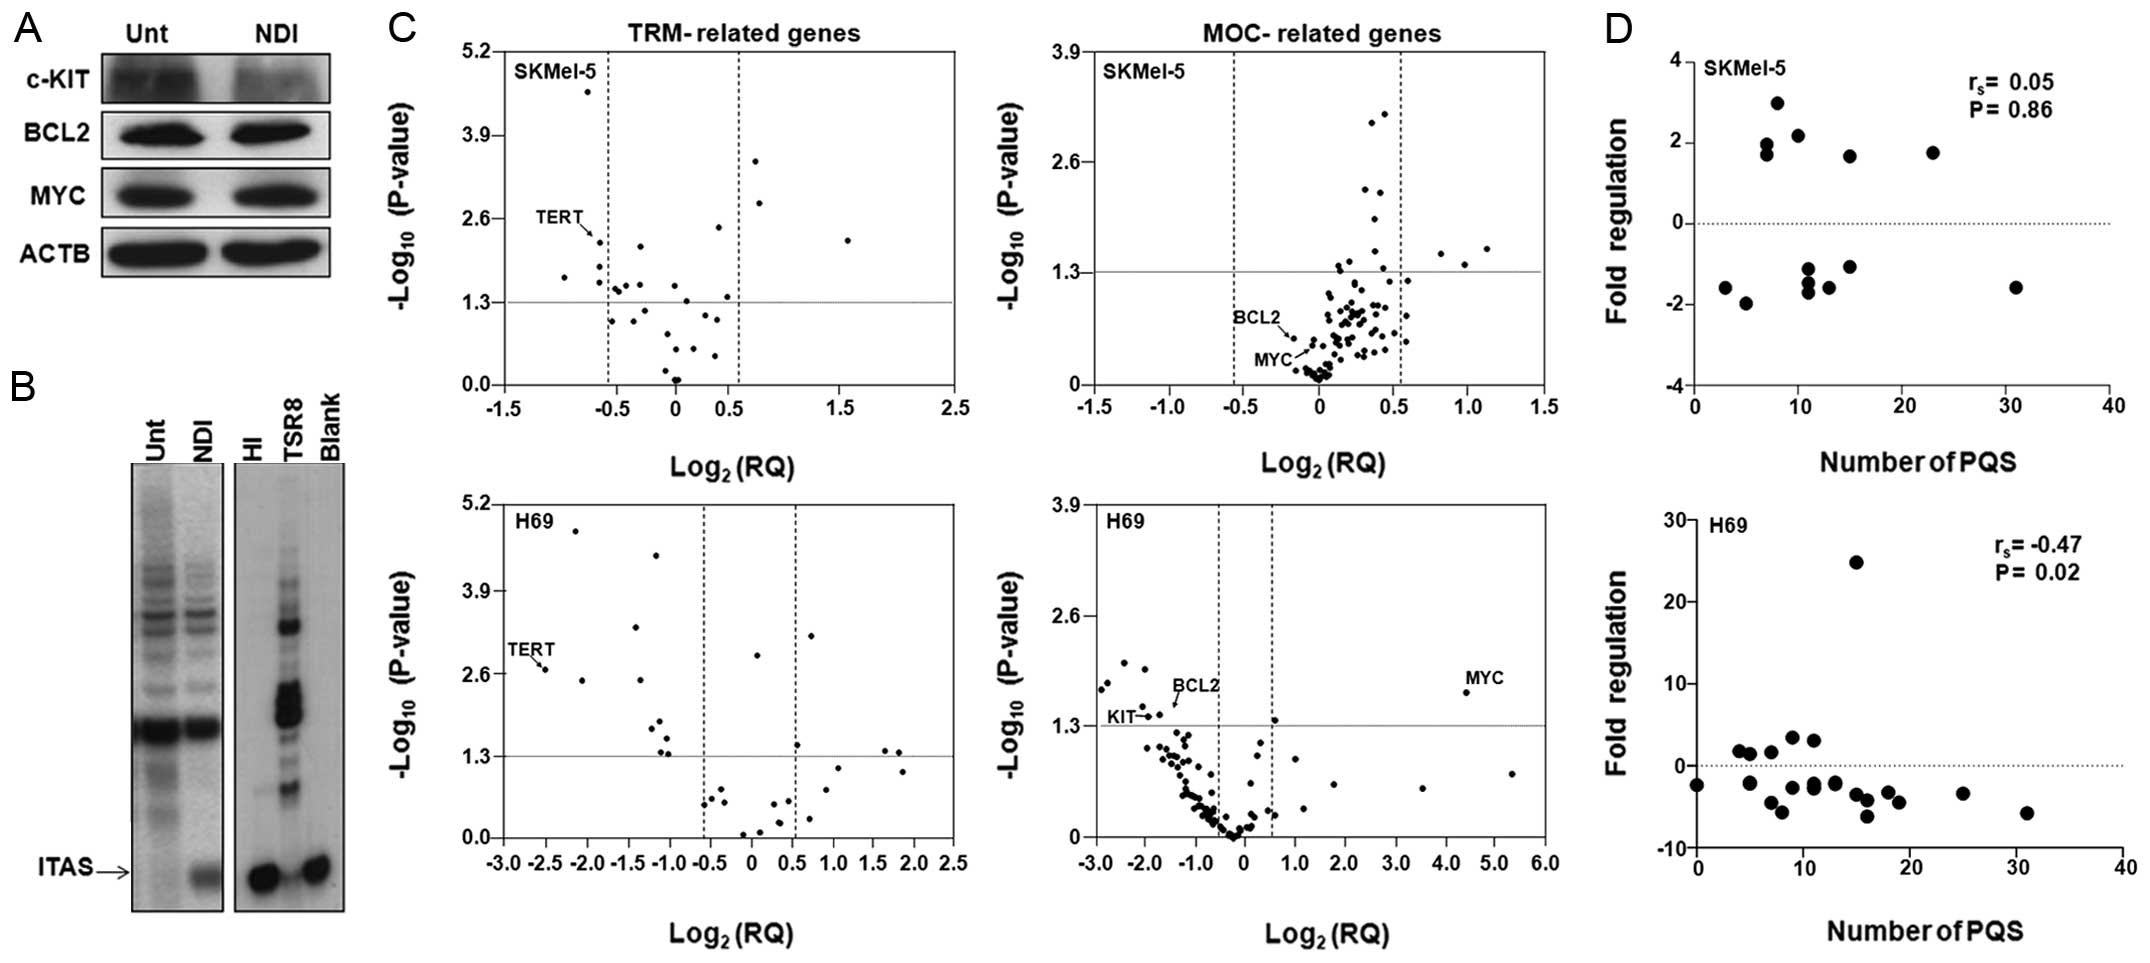 | Figure 5(A) Representative immunoblotting
showing the expression levels of MYC, BCL2 and KIT proteins in H69
cells after a 48-h exposure to 0.4 μM H-NDI-NMe2. ACTB,
β-actin. (B) Representative telomeric repeat amplification protocol
(TRAP) assay showing the inhibition of telomerase activity in
naphthalene diimide (NDI)-treated H69 cells. Unt, untreated cells;
NDI, cells exposed for 48 h to 0.4 μM H-NDI-NMe2; HI,
heat-inactivated sample; TSR8, quantitation standard; Blank, no
protein extract. The arrow indicates the 36-bp internal TRAP assay
standard (ITAS). (C) Volcano plots showing telomere replication and
maintenance (TRM) and molecular mechanisms of cancer (MOC) gene
expression patterns in NDI-treated SKMel-5 and H69 cells compared
to untreated cells. Gene expression data have been plotted as
Log2 [relative quantity (RQ)] vs. -Log10
(P-value) obtained from at least three independent experiments. The
level of statistical significance (round-dotted line, P<0.05)
and the cut-off (dashed line, 1.5-fold up- or downregulation) used
to identify gene differentially expressed in treated- vs. untreated
cells have been indicated. (D) Analysis of the correlation between
the modulation of gene expression levels and the number of putative
quadruplex forming sequences (PQS) within gene promoters in SKMel-5
and H69 cells treated with NDI. rs, Spearman’s
correlation coefficient. |
The NDI induces a global perturbation in
gene expression
To test such a hypothesis, we investigated the gene
expression profiles in both tumor cell lines following exposure to
H-NDI-NMe2. Specifically, we focused on commercially
available TaqMan® Array containing 28 genes related to
the TRM and 92 genes associated to the molecular mechanisms of
cancer (MOC). Results showed that nine out of 28 (32.1%)
TRM-related genes were significantly modulated in SKMel-5 cells
(Fig. 5C): three genes, known as
components of the shelterin complex (TERF1, TERF2 and
TER2IP) were upregulated (Table III) and six genes were
downregulated. Among the down-modulated genes we found TERT,
thus confirming the data obtained using single assays, as well as
GUSB, HMBS, MRE11A, HNRNPA1 and
HNRNPA2B1 (Table III).
However, a more marked perturbation in gene expression was observed
in NDI-treated H69 cells than in SKMel-5 cells, further
corroborating our previous observation (Fig. 1). Specifically, we identified 15
out of 28 (53.6%) differentially expressed genes in the panel of
TRM-related genes in NDI-treated H69 cells compared to untreated
cells. In particular, four (i.e., B2M, POT1,
TERF1 and TFRC) and 11 (TERT, NBN,
RAD50, HMBS, HNRNPF, HNRNPAB,
HNRNPA1, HNRNPD, ACTB, GUSB and
RPLPO) genes were found significantly up- and downregulated,
respectively, in treated cells. Of note, housekeeping genes present
in the array (i.e., ACTB, GUSB and RPLPO) were
found modulated after NDI-treatment in both cell lines. This is not
surprising since all three housekeeping genes are predicted to
contain one or more putative quadruplex forming sequences (PQS)
within their promoter region, as evidenced by two different in
silico PQS prediction tools (Table III).
| Table IIIThe TRM- and MOC-related genes
differentially expressed in NDI-treated vs. -untreated tumor
cells. |
Table III
The TRM- and MOC-related genes
differentially expressed in NDI-treated vs. -untreated tumor
cells.
| | Fold
regulationa | No. of PQSb |
|---|
| |
|
|
|---|
| Detector | Gene name | SKMel-5 | H69 | EuQuad | GQRS |
|---|
| TRM |
| TERT | Telomerase reverse
transcriptase | −1.6 | −5.8 | 6 | 25 |
| NBN | Nibrin | - | −4.2 | 0 | 16 |
| HNRNPD | Heterogeneous
nuclear ribonucleoprotein D | - | −2.0 | 0 | 13 |
| ACTB | Actin, β | - | −4.5 | 7 | 12 |
| TERF2 | Telomeric repeat
binding factor 2 | 1.7 | - | 3 | 12 |
| GUSB | Glucuronidase,
β | −1.6 | −2.3 | 2 | 11 |
| RPLP0 | Ribosomal protein,
large, P0 | - | −2.2 | 0 | 11 |
| B2M |
β-2-microglobulin | - | 3.1 | 1 | 10 |
| HNRNPF | Heterogeneous
nuclear ribonucleoprotein F | - | −2.7 | 0 | 9 |
| HMBS | Hydroxymethylbilane
synthase | −1.5 | −2.6 | 3 | 8 |
| MRE11A | MRE11 meiotic
recombination 11 homolog A | −1.7 | - | 3 | 8 |
| PGK1 | Phosphoglycerate
kinase 1 | - | - | 2 | 8 |
| TERF2IP | Telomeric repeat
binding factor 2, interacting protein | 3.0 | - | 0 | 8 |
| TERF1 | Telomeric repeat
binding factor (NIMA-interacting) 1 | 1.7 | 1.6 | 0 | 7 |
| TFRC | Transferrin
receptor (p90, CD71) | - | 3.5 | 2 | 7 |
| HNRNPA1 | Heterogeneous
nuclear ribonucleoprotein A1 | −2.0 | −2.1 | 0 | 5 |
| POT1 | POT1 protection of
telomeres 1 homolog | - | 1.5 | 0 | 5 |
| RAD50 | RAD50 homolog | - | −2.2 | 0 | 5 |
|
HNRNPA2B1 | Heterogeneous
nuclear ribonucleoprotein A2/B1 | −1.6 | - | 0 | 3 |
| HNRNPAB | Heterogeneous
nuclear ribonucleoprotein A/B | - | −2.3 | 0 | - |
| MOC |
| HRAS | v-Ha-ras Harvey rat
sarcoma viral oncogene homolog | - | - | 20 | 39 |
| CCNE1 | Cyclin E1 | - | −6.2 | 0 | 16 |
| KIT | v-kit
Hardy-Zuckerman 4 feline sarcoma viral oncogene homolog | n.d. | −3.2 | 3 | 15 |
| BAX | BCL2-associated X
protein | - | −3.5 | 0 | 15 |
| AKT1 | v-Akt murine
thymoma viral oncogene homolog 1 | - | −3.4 | 11 | 14 |
| BID | BH3-interacting
domain death agonist | 1.8 | - | 11 | 12 |
| BCAR1 | Breast cancer
antiestrogen resistance 1 | - | - | 5 | 12 |
| RAC1 | Ras-related C3
botulinum toxin substrate 1 | - | - | 4 | 12 |
| BCL2 | B-cell CLL/lymphoma
2 | −1.1 | −2.8 | 0 | 11 |
| FGF2 | Fibroblast growth
factor 2 (basic) | - | - | 3 | 10 |
| MAX | MYC associated
factor X | n.d. | - | 5 | 9 |
| TGFBR2 | Transforming growth
factor, β receptor II | - | - | 2 | 9 |
| MYC | v-MYC
myelocytomatosis viral oncogene homolog | −1.1 | 24.8 | 7 | 8 |
| CDK4 | Cyclin-dependent
kinase 4 | - | - | 6 | 8 |
| AKT2 | v-Akt murine
thymoma viral oncogene homolog 2 | - | - | 0 | 8 |
| PIK3R1 |
Phosphoinositide-3-kinase, regulatory
subunit 1 | - | - | 0 | 8 |
| FADD | Fas
(TNFRSF6)-associated via death domain | - | - | 5 | 7 |
| BCL2L1 | BCL2-like 1 | 2.0 | - | 0 | 7 |
| CDKN1A | Cyclin-dependent
kinase inhibitor 1A (p21, Cip1) | 2.2 | - | 4 | 6 |
| CYCS | Cytochrome
c, somatic | - | −4.5 | 1 | 6 |
| FOS | v-Fos FBJ murine
osteosarcoma viral oncogene homolog | - | - | 4 | 5 |
| FAS | Fas (TNF receptor
superfamily, member 6) | - | - | 0 | 5 |
| TP53 | Tumor protein
p53 | - | 1.8 | 0 | 4 |
| CDC42 | Cell division cycle
42 (GTP binding protein, 25 kDa) | - | −5.7 | 5 | 3 |
The analysis of the expression levels of genes
related to the MOC revealed only three out 92 genes (5.4%)
significantly up-modulated in NDI-treated compared to untreated
SKMel-5 cells (Fig. 5C), which
included BID, BCL2L1 and CDKN1A.
Interestingly, the observed up-modulation of CDKN1A, which
encodes for the cyclin-dependent kinase inhibitor
p21WAF1, is in keeping with our previous data showing a
marked accumulation of p21WAF1 protein in SKMel-5 cells
exposed to NDI (21) or to the G-4
ligand Ant1,5 (38). Conversely,
only a modest downregulation of MYC and BCL2 was observed in
NDI-treated SKMel-5 cells (Table
III), thus corroborating the data obtained by single gene
expression assays (Fig. 1).
Similarly to TRM-related genes, the exposure of H69
cells to H-NDI-NMe2 resulted in a greater number of
differentially expressed genes compared to SKMel-5 cells undergoing
the same treatment (Fig. 5C).
Specifically, nine out of 92 genes (9.8%) were modulated in
H69-treated cells, of which two (MYC and TP53) were
found up-modulated and seven (CCNE1, KIT, BAX,
AKT1, BCL2, CYCS, CDC42) were markedly
down-regulated (Table III).
Altogether, these data show that the possible
G-4-mediated regulation of gene expression is largely dependent on
the cell context. Data obtained from both single assays (Fig. 1C) and array analyses (Fig. 5C) showed a lower number of genes
the expression levels of which are markedly modulated upon
H-NDI-NMe2 exposure in SKMel-5 compared to H69 cells. In
addition, a trend toward a correlation between the number of PQS
within gene promoters and the modulation of gene expression may be
observed in NDI-treated H69 cells only (Fig. 5D). Moreover, the genes that have
modulated expression levels in H69 cells upon treatment with the
G-4 ligand indicate a drug-mediated perturbation in telomere
architecture/function as well as a global defense response
activated by cells likely in their attempt to cope with
drug-induced stress.
Compelling arguments have been provided on the
prominent role of G-4 structures in the modulation of gene
expression (39). The first and
clearest evidence of G-4 structure involved in the regulation of
gene transcription came from studies on MYC. Indeed, the
possibility to inhibit MYC transcription through G-4 stabilization
has been actively pursued thus far in several human cancer models
using specific small molecules (40).
Although G-4 structures have been primarily
recognized as transcriptional repressor elements, it is now
becoming clear that their formation along the genome may facilitate
the maintenance of an open chromatin state, thus allowing gene
transcriptional activity (29).
Gene promoter regions harboring PQS have indeed the potential to
bind a diverse array of factors that may favor or constrain gene
transcription. As a consequence, the possibility of generating
secondary structures, such as G-4, may influence the interaction
between transcription factors and DNA, or vice versa, thus
resulting in either activation or repression of gene expression.
This evidence suggests that the functional consequences of
G-4-interacting agents may depend on the specific mode of their
interaction with the G-4 structure, providing fundamental insights
into the potential complexity of ligand/G-4 interactions and how
they might influence gene expression (30).
Recognition of the biological significance of G-4
structures has put a new wave of interest in the search and
development of G-4 interactive compounds. Targeting such secondary
nucleic acid structures currently represents a novel, even though
challenging, approach to anticancer drug design (12). Nonetheless, there are still several
hurdles that need to be overcome before these peculiar compounds
will be part of the currently available armamentarium of
anti-cancer agents.
The high prevalence of G-4s in the human genome may
raise concerns about the specificity of G-4-stabilising agents,
even if the great structural variability of G-4 structures stands
for their potential selective recognition. Nevertheless, it cannot
be excluded that differences in promoter epigenetic modifications,
cell proliferation-dependent transcriptional activity, and the
presence of single nucleotide polymorphysms as well as protein
crowding at the promoter level could account for a possible lower
susceptibility to G-4-interacting agents of normal compared to
cancer cells.
A point that needs to be urgently addressed deals
with the in vivo existence of G-4 structures, which has been
a matter of debate for decades. The possible presence of G-4
structures in vivo has been indirectly pointed out by the
identification of a variety of proteins able to stabilize or
promote the formation of as well as to destabilize or unwind the
tetraplex DNA (41). Moreover, the
very recent development of G-4 structure-directed antibodies that
allow to quantitatively visualizing G-4 structures in human cells
has undoubtedly represented a step of paramount importance in the
G-4 research field (42,43). Although a large amount of data has
been provided concerning the G-4-mediated regulation of gene
expression (44), direct evidence
for the biological relevance of G-4s in the cell context is still
lacking. In this context, deep knowledge of the molecular
mechanisms that facilitate the formation of G-4 structures (e.g.,
protein-nucleic acid interactions) will be instrumental in
understanding the role of G-4s in living cells and for the
identification of genes that effectively undergo a G-4
motif-dependent transcriptional control and not merely bear PQS.
Filling the present gaps between the chemo-physical and the
biological assays will help opening new avenues in the continuous
fight against human diseases.
Acknowledgements
This study was supported by MIUR, Grant FIRB-Ideas
RBID082ATK and by the University of Padova.
References
|
1
|
Lipps HJ and Rhodes D: G-quadruplex
structures: in vivo evidence and function. Trends Cell Biol.
19:414–422. 2009. View Article : Google Scholar : PubMed/NCBI
|
|
2
|
Brooks TA, Kendrick S and Hurley L: Making
sense of G-quadruplex and i-motif functions in oncogene promoters.
FEBS J. 277:3459–3469. 2010. View Article : Google Scholar : PubMed/NCBI
|
|
3
|
Huppert JL: Structure, location and
interactions of G-quadruplexes. FEBS J. 277:3452–3458. 2010.
View Article : Google Scholar : PubMed/NCBI
|
|
4
|
Williamson JR, Raghuraman MK and Cech TR:
Monovalent cation-induced structure of telomeric DNA: the G-quartet
model. Cell. 59:871–880. 1989. View Article : Google Scholar : PubMed/NCBI
|
|
5
|
Balasubramanian S, Hurley LH and Neidle S:
Targeting G-quadruplexes in gene promoters: a novel anticancer
strategy? Nat Rev Drug Discov. 10:261–275. 2011. View Article : Google Scholar : PubMed/NCBI
|
|
6
|
Eddy J and Maizels N: Conserved elements
with potential to form polymorphic G-quadruplex structures in the
first intron of human genes. Nucleic Acids Res. 36:1321–1333. 2008.
View Article : Google Scholar : PubMed/NCBI
|
|
7
|
Huppert JL and Balasubramanian S:
G-quadruplexes in promoters throughout the human genome. Nucleic
Acids Res. 35:406–413. 2007. View Article : Google Scholar : PubMed/NCBI
|
|
8
|
Bidzinska J, Cimino-Reale G, Zaffaroni N
and Folini M: G-quadruplex structures in the human genome as novel
therapeutic targets. Molecules. 18:12368–12395. 2013. View Article : Google Scholar : PubMed/NCBI
|
|
9
|
Brooks TA and Hurley LH: Targeting MYC
Expression through G-Quadruplexes. Genes Cancer. 1:641–649. 2010.
View Article : Google Scholar : PubMed/NCBI
|
|
10
|
Hanahan D and Weinberg RA: Hallmarks of
cancer: the next generation. Cell. 144:646–674. 2011. View Article : Google Scholar : PubMed/NCBI
|
|
11
|
Palumbo SL, Ebbinghaus SW and Hurley LH:
Formation of a unique end-to-end stacked pair of G-quadruplexes in
the hTERT core promoter with implications for inhibition of
telomerase by G-quadruplex-interactive ligands. J Am Chem Soc.
131:10878–10891. 2009. View Article : Google Scholar : PubMed/NCBI
|
|
12
|
Düchler M: G-quadruplexes: targets and
tools in anticancer drug design. J Drug Target. 20:389–400.
2012.PubMed/NCBI
|
|
13
|
Hurley LH: Secondary DNA structures as
molecular targets for cancer therapeutics. Biochem Soc Trans.
29:692–696. 2001. View Article : Google Scholar : PubMed/NCBI
|
|
14
|
Kumar P, Yadav VK, Baral A, Kumar P, Saha
D and Chowdhury S: Zinc-finger transcription factors are associated
with guanine quadruplex motifs in human, chimpanzee, mouse and rat
promoters genome-wide. Nucleic Acids Res. 39:8005–8016. 2011.
View Article : Google Scholar : PubMed/NCBI
|
|
15
|
Rangan A, Fedoroff OY and Hurley LH:
Induction of duplex to G-quadruplex transition in the c-myc
promoter region by a small molecule. J Biol Chem. 276:4640–4646.
2001. View Article : Google Scholar : PubMed/NCBI
|
|
16
|
Sun D, Liu WJ, Guo K, et al: The proximal
promoter region of the human vascular endothelial growth factor
gene has aG-quadruplex structure that can be targeted by
G-quadruplex-interactive agents. Mol Cancer Ther. 7:880–889. 2008.
View Article : Google Scholar
|
|
17
|
Arola A and Vilar R: Stabilisation of
G-quadruplex DNA by small molecules. Curr Top Med Chem.
8:1405–1415. 2008. View Article : Google Scholar : PubMed/NCBI
|
|
18
|
Petenzi M, Verga D, Largy E, et al:
Cationic pentaheteroaryls as selective G-quadruplex ligands by
solvent-free microwave-assisted synthesis. Chemistry.
18:14487–14496. 2012. View Article : Google Scholar : PubMed/NCBI
|
|
19
|
Collie GW, Promontorio R, Hampel SM, Micco
M, Neidle S and Parkinson GN: Structural basis for telomeric
G-quadruplex targeting by naphthalene diimide ligands. J Am Chem
Soc. 134:2723–2731. 2012. View Article : Google Scholar : PubMed/NCBI
|
|
20
|
Di Antonio M, Doria F, Richter SN, et al:
Quinone methides tethered to naphthalene diimides as selective
G-quadruplex alkylating agents. J Am Chem Soc. 131:13132–13141.
2009.PubMed/NCBI
|
|
21
|
Doria F, Nadai M, Folini M, et al: Hybrid
ligand-alkylating agents targeting telomeric G-quadruplex
structures. Org Biomol Chem. 10:2798–2806. 2012. View Article : Google Scholar : PubMed/NCBI
|
|
22
|
Gunaratnam M, de la Fuente M, Hampel SM,
et al: Targeting pancreatic cancer with a G-quadruplex ligand.
Bioorg Med Chem. 19:7151–7157. 2011. View Article : Google Scholar : PubMed/NCBI
|
|
23
|
Hampel SM, Sidibe A, Gunaratnam M, Riou JF
and Neidle S: Tetrasubstituted naphthalene diimide ligands with
selectivity for telomeric G-quadruplexes and cancer cells. Bioorg
Med Chem Lett. 20:6459–6463. 2010. View Article : Google Scholar : PubMed/NCBI
|
|
24
|
Nadai M, Doria F, Di Antonio M, et al:
Naphthalene diimide scaffolds with dual reversible and covalent
interaction properties towards G-quadruplex. Biochimie.
93:1328–1340. 2011. View Article : Google Scholar : PubMed/NCBI
|
|
25
|
Livak KJ and Schmittgen TD: Analysis of
relative gene expression data using real-time quantitative PCR and
the 2(−Delta Delta C(T)) method. Methods. 25:402–408. 2001.
View Article : Google Scholar
|
|
26
|
Greenfield NJ: Using circular dichroism
collected as a function of temperature to determine the
thermodynamics of protein unfolding and binding interactions. Nat
Protoc. 1:2527–2535. 2006. View Article : Google Scholar : PubMed/NCBI
|
|
27
|
Kumar N, Basundra R and Maiti S: Elevated
polyamines induce c-MYC overexpression by perturbing quadruplex-WC
duplex equilibrium. Nucleic Acids Res. 37:3321–3331. 2009.
View Article : Google Scholar : PubMed/NCBI
|
|
28
|
Kumar N, Patowary A, Sivasubbu S, Petersen
M and Maiti S: Silencing c-MYC expression by targeting quadruplex
in P1 promoter using locked nucleic acid trap. Biochemistry.
47:13179–13188. 2008. View Article : Google Scholar : PubMed/NCBI
|
|
29
|
Borgognone M, Armas P and Calcaterra NB:
Cellular nucleic-acid-binding protein, a transcriptional enhancer
of c-Myc, promotes the formation of parallel G-quadruplexes.
Biochem J. 428:491–498. 2010. View Article : Google Scholar : PubMed/NCBI
|
|
30
|
Waller ZA, Sewitz SA, Hsu ST and
Balasubramanian S: A small molecule that disrupts G-quadruplex DNA
structure and enhances gene expression. J Am Chem Soc.
131:12628–12633. 2009. View Article : Google Scholar : PubMed/NCBI
|
|
31
|
Wang XD, Ou TM, Lu YJ, et al: Turning off
transcription of the bcl-2 gene by stabilizing the bcl-2 promoter
quadruplex with quindoline derivatives. J Med Chem. 53:4390–4398.
2010. View Article : Google Scholar : PubMed/NCBI
|
|
32
|
McLuckie KI, Waller ZA, Sanders DA, et al:
G-quadruplex-binding benzo[a]phenoxazines down-regulate c-KIT
expression in human gastric carcinoma cells. J Am Chem Soc.
133:2658–2663. 2011. View Article : Google Scholar
|
|
33
|
Hsu ST, Varnai P, Bugaut A, Reszka AP,
Neidle S and Balasubramanian S: A G-rich sequence within the c-kit
oncogene promoter forms a parallel G-quadruplex having asymmetric
G-tetrad dynamics. J Am Chem Soc. 131:13399–13409. 2009. View Article : Google Scholar : PubMed/NCBI
|
|
34
|
Bejugam M, Sewitz S, Shirude PS, Rodriguez
R, Shahid R and Balasubramanian S: Trisubstituted isoalloxazines as
a new class of G-quadruplex binding ligands: small molecule
regulation of c-kit oncogene expression. J Am Chem Soc.
129:12926–12927. 2007. View Article : Google Scholar : PubMed/NCBI
|
|
35
|
Rankin S, Reszka AP, Huppert J, et al:
Putative DNA quadruplex formation within the human c-kit oncogene.
J Am Chem Soc. 127:10584–10589. 2005. View Article : Google Scholar : PubMed/NCBI
|
|
36
|
Dai J, Dexheimer TS, Chen D, et al: An
intramolecular G-quadruplex structure with mixed
parallel/antiparallel G-strands formed in the human BCL-2 promoter
region in solution. J Am Chem Soc. 128:1096–1098. 2006. View Article : Google Scholar
|
|
37
|
Dexheimer TS, Sun D and Hurley LH:
Deconvoluting the structural and drug-recognition complexity of the
G-quadruplex-forming region upstream of the bcl-2 P1 promoter. J Am
Chem Soc. 128:5404–5415. 2006. View Article : Google Scholar : PubMed/NCBI
|
|
38
|
Orlotti NI, Cimino-Reale G, Borghini E, et
al: Autophagy acts as a safeguard mechanism against G-quadruplex
ligand-mediated DNA damage. Autophagy. 8:1185–1196. 2012.
View Article : Google Scholar : PubMed/NCBI
|
|
39
|
Maizels N: G4 motifs in human genes. Ann
NY Acad Sci. 1267:53–60. 2012. View Article : Google Scholar : PubMed/NCBI
|
|
40
|
González V and Hurley LH: The c-MYC NHE
III(1): function and regulation. Annu Rev Pharmacol Toxicol.
50:111–129. 2010.PubMed/NCBI
|
|
41
|
Sissi C, Gatto B and Palumbo M: The
evolving world of protein-G-quadruplex recognition: a medicinal
chemist’s perspective. Biochimie. 93:1219–1230. 2011. View Article : Google Scholar : PubMed/NCBI
|
|
42
|
Biffi G, Di Antonio M, Tannahill D and
Balasubramanian S: Visualization and selective chemical targeting
of RNA G-quadruplex structures in the cytoplasm of human cells. Nat
Chem. 6:75–80. 2014. View Article : Google Scholar : PubMed/NCBI
|
|
43
|
Biffi G, Tannahill D, McCafferty J and
Balasubramanian S: Quantitative visualization of DNA G-quadruplex
structures in human cells. Nat Chem. 5:182–186. 2013. View Article : Google Scholar : PubMed/NCBI
|
|
44
|
Tarsounas M and Tijsterman M: Genomes and
G-quadruplexes: for better or for worse. J Mol Biol. 425:4782–4789.
2013. View Article : Google Scholar : PubMed/NCBI
|
|
45
|
Yadav VK, Abraham JK, Mani P, Kulshrestha
R and Chowdhury S: QuadBase: genome-wide database of G4 DNA -
occurrence and conservation in human, chimpanzee, mouse and rat
promoters and 146 microbes. Nucleic Acids Res. 36:D381–D385. 2008.
View Article : Google Scholar : PubMed/NCBI
|
|
46
|
Kikin O, D’Antonio L and Bagga PS: QGRS
Mapper: a web-based server for predicting G-quadruplexes in
nucleotide sequences. Nucleic Acids Res. 34:W676–W682. 2006.
View Article : Google Scholar : PubMed/NCBI
|