Introduction
Meningioma usually appears in the senior age of life
and accounts to ~22% of intracranial tumours in males and 38% in
females (1). According to the WHO
grading criteria, meningioma is divided into three grades: benign
meningioma (grade I), atypical meningioma (grade II) and anaplastic
meningioma (grade III). Anaplastic meningioma shows poorer
prognosis than other common types of meningioma with a median
overall survival time 2 years. Due to the difficulty of managing
meningioma recurrence (2) and the
low predictive powers of clinic pathological factors, biomarkers to
identify high-risk patients with a poor prognosis are strongly
needed. From a previous study conducted in a total 124 samples from
105 patients using the high-resolution FISH-technology (iFISH), it
is reported that the deletion of chromosome 1p may be an
independent marker of meningioma recurrence and progression
(3).
DNA microarray technology has enabled the
simultaneous measurements of expression levels of thousands of
genes in a group sample of tumour tissue, which could be used to
provide prognostic information, or discriminate between various
histologic subtypes. For the last decade, many research groups have
used this technology to define prognostic gene signatures in many
different tumour types, such as ovarian (4) breast (5), gastric (6), lung cancer (7) and neuroblastomas (8). The survival related gene signature
might capture tumour progression status and could serve as a
prerequisite to a more patient-tailored therapy.
Nevertheless, to the best of our knowledge, no study
in which gene expression profiling was used to predict meningioma
overall survival has been published yet. In the present study, we
analysed genome-wide expression profiles of 119 meningioma samples
using DNA microarray technologies. We applied Cox proportional
hazards regression models and identified 37 prognostic genes
related to meningioma overall survival, which could provide an
optimization of the clinical management and development of new
therapeutic strategies for meningioma.
Materials and methods
Data collection
Gene expression profiling datasets from two
previously published studies analysed in the present study were
referred as dataset 1 and dataset 2. Dataset 1 consists of 51
samples, while dataset 2 consists of 68 samples.
For dataset 1 (9),
there are 47 meningioma samples and 4 normal meninges. As
previously discussed, the selection criteria of these samples
include availability of enough tumour RNA, high quality of the
extracted RNA and the representativeness of its cytogenetic
profiles as defined by interphase fluorescence in situ
hybridization (iFISH) within the whole series of tumours. Total RNA
was extracted using RNeasy Mini kit (Quiagen, Valencia, CA, USA).
The RNA integrity was assessed using the Agilent 2100 Bioanalyzer
(Agilent Technologies, Inc., Palo Alto, CA, USA). The labelling
process was performed according to the protocols from Affymetrix.
Labelled RNA was hybridized to Human Genome U133A microarray, after
quality checking on GeneChips Test 3 Arrays. Washing and scanning
were performed using Fluidics Station 400 and GeneChip Scanner
(Affymetrix).
For dataset 2 (10), tumour biopsies from 43 female and
25 male subjects with sporadic meningioma were selected from the
UCLA Neuro-oncology Program Tissue Bank through institutional
review board approved protocols. RNA was extracted from 20–50 mg
tumour pieces using Qiagen™ (Qiagen) RNeasy Mini kits per
manufacturer’s protocols. The extracted total RNA was assessed for
integrity using the 2100 Bioanalyzer by Agilent Technologies. Total
RNA (1 μg) was used for single-round biotinylated probe synthesis
using the Affymetrix Array Station device made by Caliper Life
Sciences (Hopkinton, MA, USA) by the manufacturer’s protocols.
Labelled and sheared cRNA was manually applied to Affymetrix Human
Genome U133 Plus 2.0 Arrays (Affymetrix). All microarrays were
scanned using the Affymetrix GeneChip scanner 3000.
Data processing
We retrieved the raw fluorescence intensity data
within CEL files from NCBI GEO database with accession number
GSE43290 (dataset 1) and GSE16581 (dataset 2). The raw datasets
were preprocessed with gcrma algorithm, as implemented with R
packages from Bioconductor (http://www.bioconductor.org). The gcrma algorithm
(11) adjusts for the background
intensities in Affymtrix array data by including optical noise and
non-specific binding (NSB). It then converts background adjusted
probe intensities to expression measures using the same
normalization and summarization methods implanted by the robust
multiarray average (RMA) (12)
algorithm. Because two different microarray platforms were used in
these datasets, the probe sets had to be matched to identical
genes. Based on the latest official symbol annotation provided by
the manufacturer, we developed a Perl script to match probe sets
among datasets 1 and 2. This process produced a total of 13,879
genes on both the two Affymetrix microarray systems: Human Genome
U133A microarray and Human Genome U133 Plus 2.0 Arrays.
Microarray and statistical analysis
We then used the statistical software programs R,
the R-package, limma (13), for
the analysis of gene expression microarray data from dataset 1.
This algorithm uses linear models, as well as Empirical Bayesian
methods, for analysing designed experiments and assessment of
differential expression. The Cox proportional hazards regression
analysis was conducted to identify survival related genes. Survival
analysis was performed using the R-package ‘survival’ (14). Overall survival (OS) was analysed
using the Kaplan-Meier product-limit method and the significance of
the variables was measured by the log-rank test. Hierarchical
clustering based on Euclidean distance and Ward’s clustering method
were used to show the expression patterns of survival-related genes
in dataset 2. We further analysed the Gene Ontology and canonical
pathways with the use of DAVID (The Database for Annotation,
Visualization and Integrated Discovery) tools (15).
Results
Clinical characteristics
The clinical characteristics of samples in dataset 1
and 2 are summarized in Table I.
We used dataset 1 for the differential expression analysis to
pre-select the survival gene candidates. Within this dataset, a
total of 51 patients (16 males and 35 females with a median age 65
years; range, 23–84 years) were analysed. All tumours were
diagnosed and classified according to WHO criteria: 33 patients
(64.71%) were diagnosed as grade I, 12 patients (23.53%) as grade
II, and 2 patients (3.92%) as grade III. On the other hand, we used
dataset 2 for the identification of survival related gene
expression profile. Among the 68 samples (25 males and 43 females
with a median age 64 years; range, 32–89 years), 43 patients
(63.24%) were diagnosed as grade I, 19 patients (27.94%) as grade
II and 6 patients (8.82%) as grade III. The median survival time is
1,726 days with range of 19–3,387 days.
 | Table IClinical characteristics of the
patients with meningioma tumours. |
Table I
Clinical characteristics of the
patients with meningioma tumours.
| Demographics | Dataset 1, n=51 | Dataset 2, n=68 |
|---|
| Survival time,
days |
| Median | NA | 1,726 |
| Range | NA | 19–3,387 |
| Age, years |
| Median | 65 | 64 |
| Range | 23–84 | 32–89 |
| Gender |
| Male | 16 | 25 |
| Female | 35 | 43 |
| Grade |
| I | 33 | 43 |
| II | 12 | 19 |
| III | 2 | 6 |
| Normal | 4 | NA |
Identification of a 37-gene signature for
meningioma prognosis
Our hypothesis is that the genes involved in the
progression of meningioma may also contribute to the prediction of
prognosis. Therefore, we firstly conducted differential expression
analysis in dataset 1 using Affymetrix Human Genome U133A
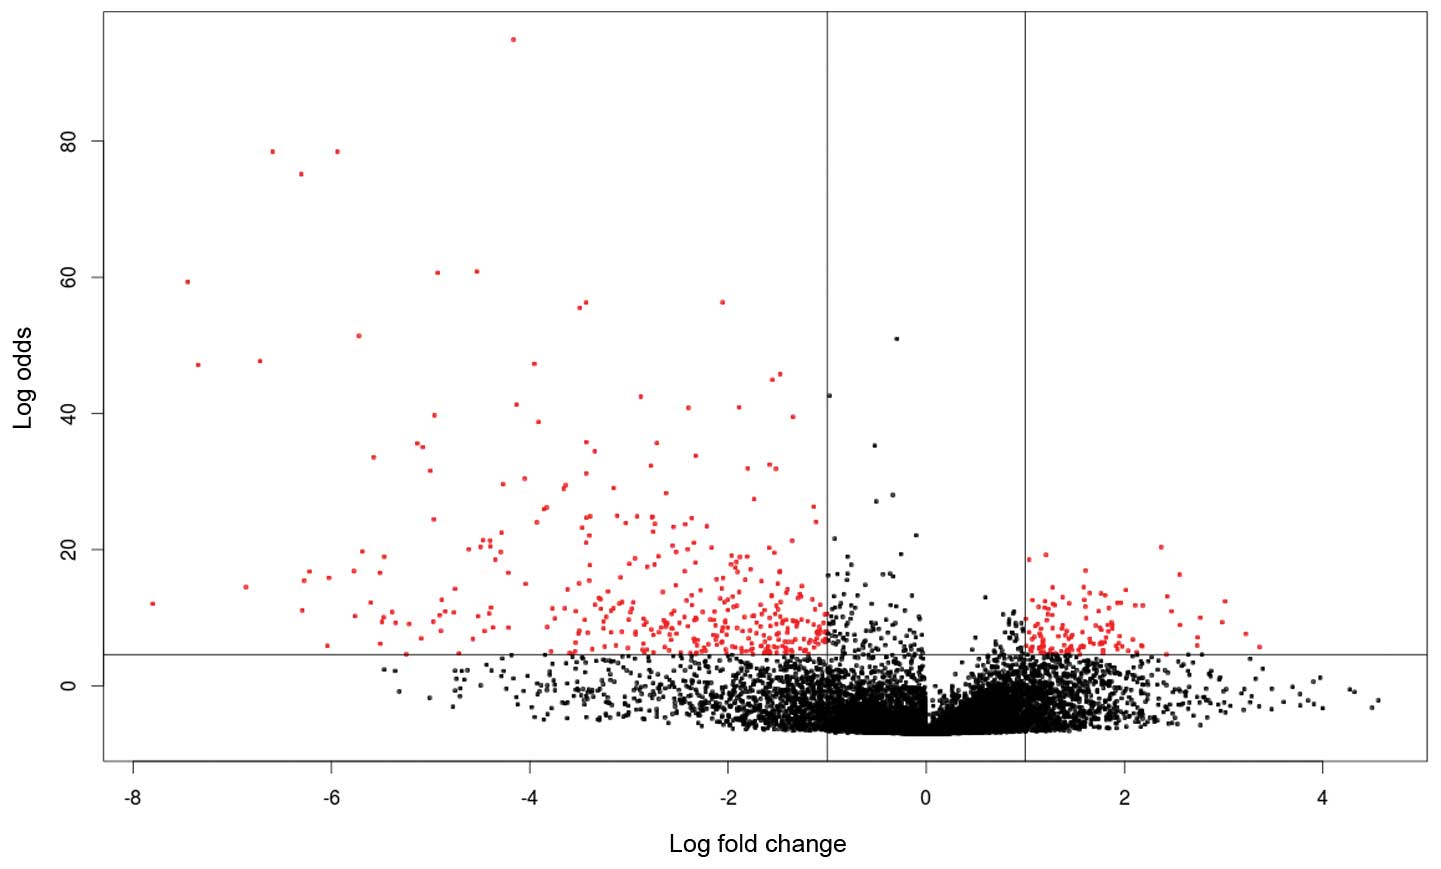
microarray. A total of 449 genes (109 upregulated and 340
downregulated) were identified as significantly differentially
expressed in meningioma. As shown in Fig. 1, the threshold is set as a log-odds
value of >4.6 (99% probability that the gene is differentially
expressed) and a fold-change >2-fold. The 449 genes were used as
a discovery set for the identification of survival related profiles
in meningioma.
To investigate the prognostic potential of these
genes, we prepared dataset 2. To deal with cross-platform
microarray data appropriately, we mapped the probe set IDs from two
microarray platforms to official symbols. A univariate Cox
proportional hazard model showed that expression levels of 51
probes (representing 37 non-redundant genes) were correlated with
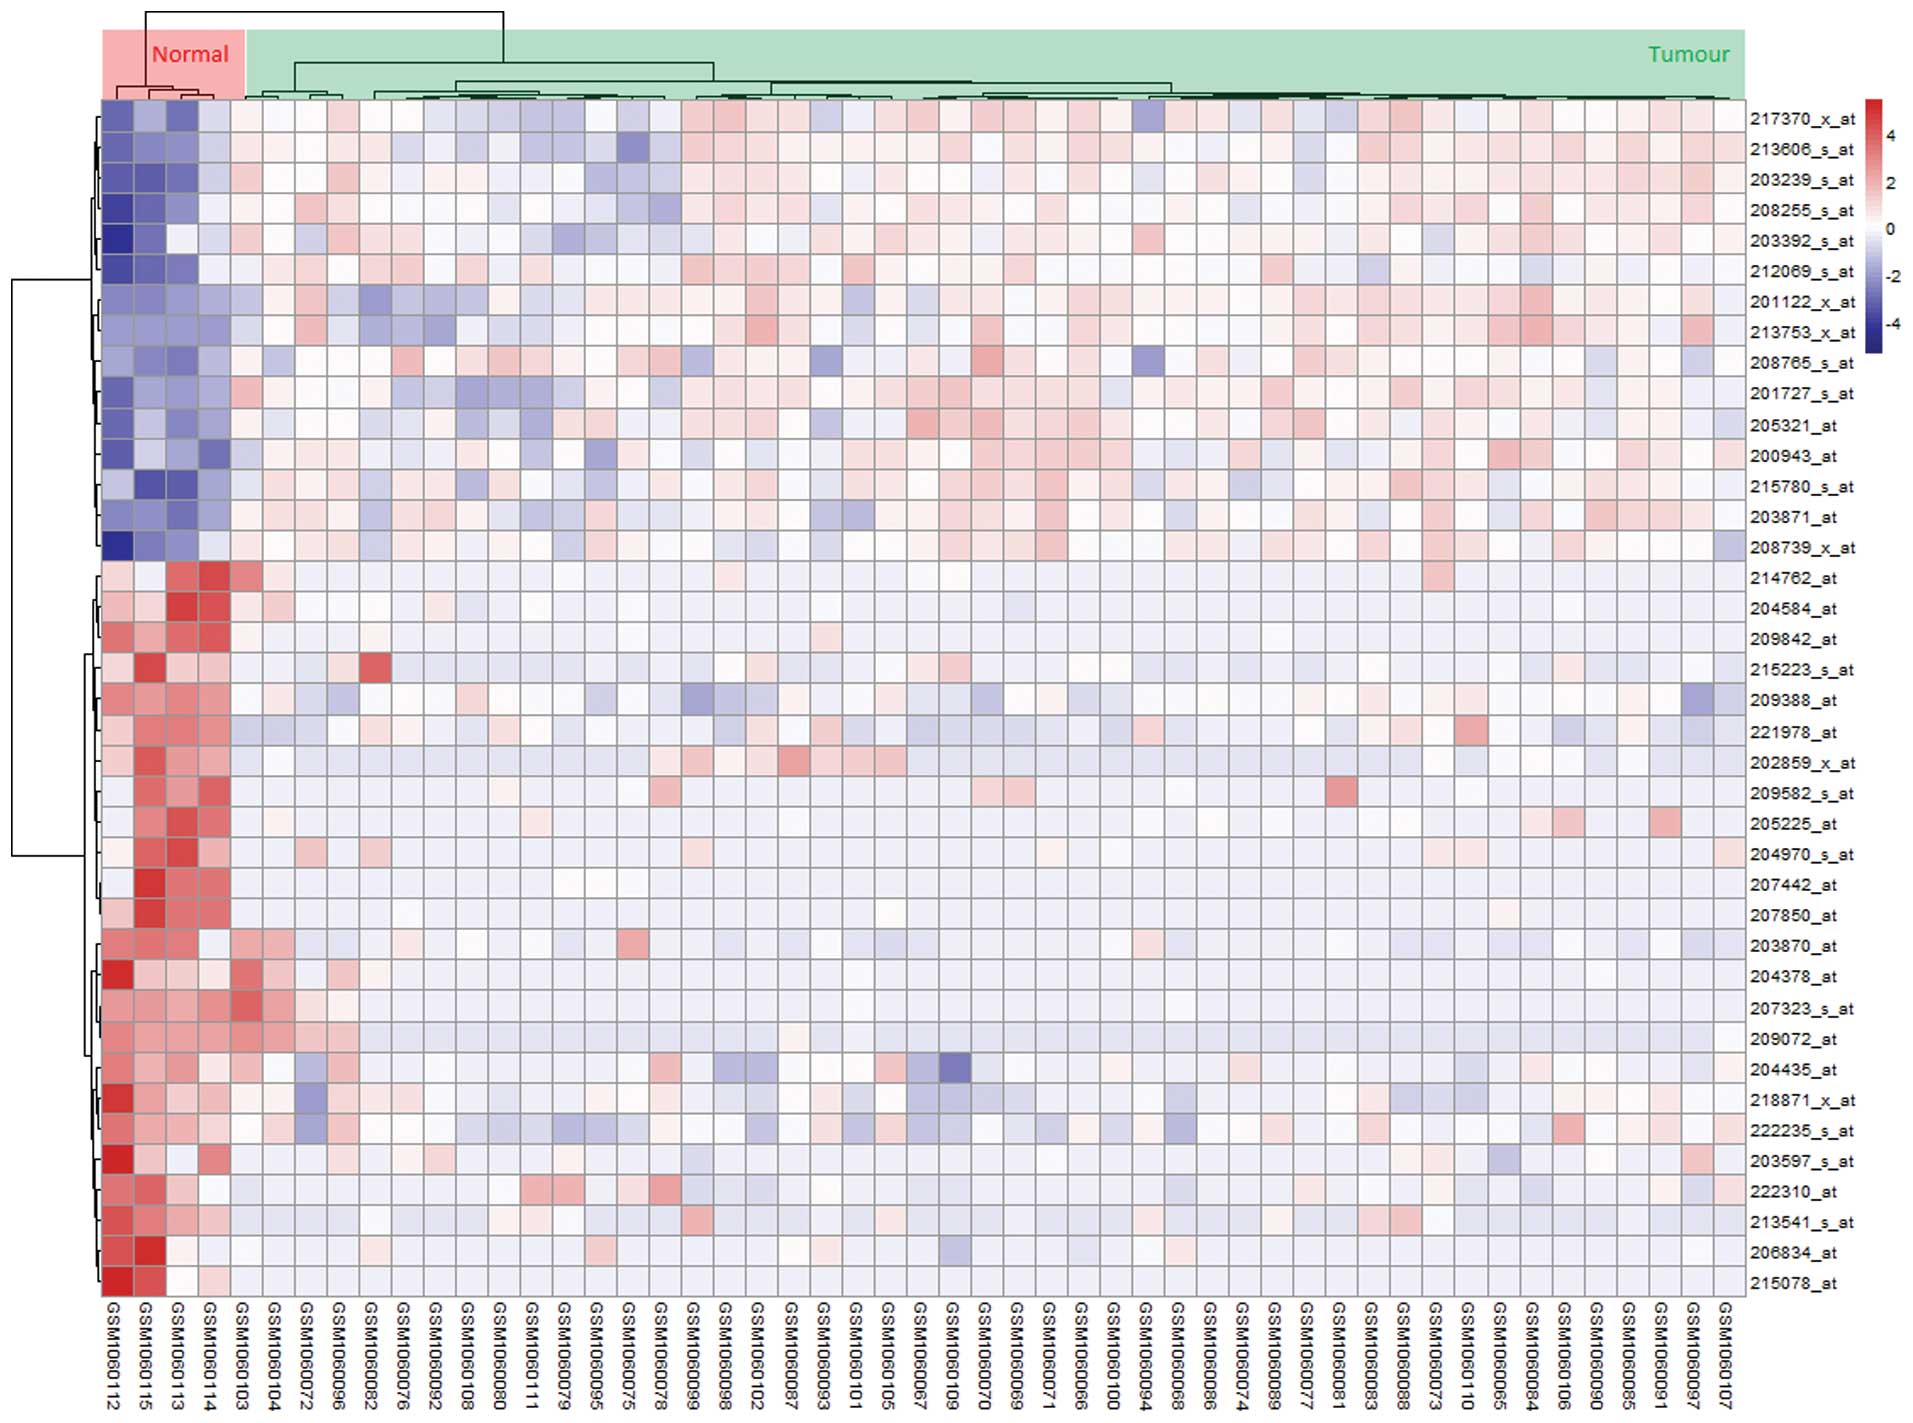
overall survival time (P<0.05) (Table II). As shown in Fig. 2, the 37-gene signature was the
dominant characteristics that permitted the stratification of
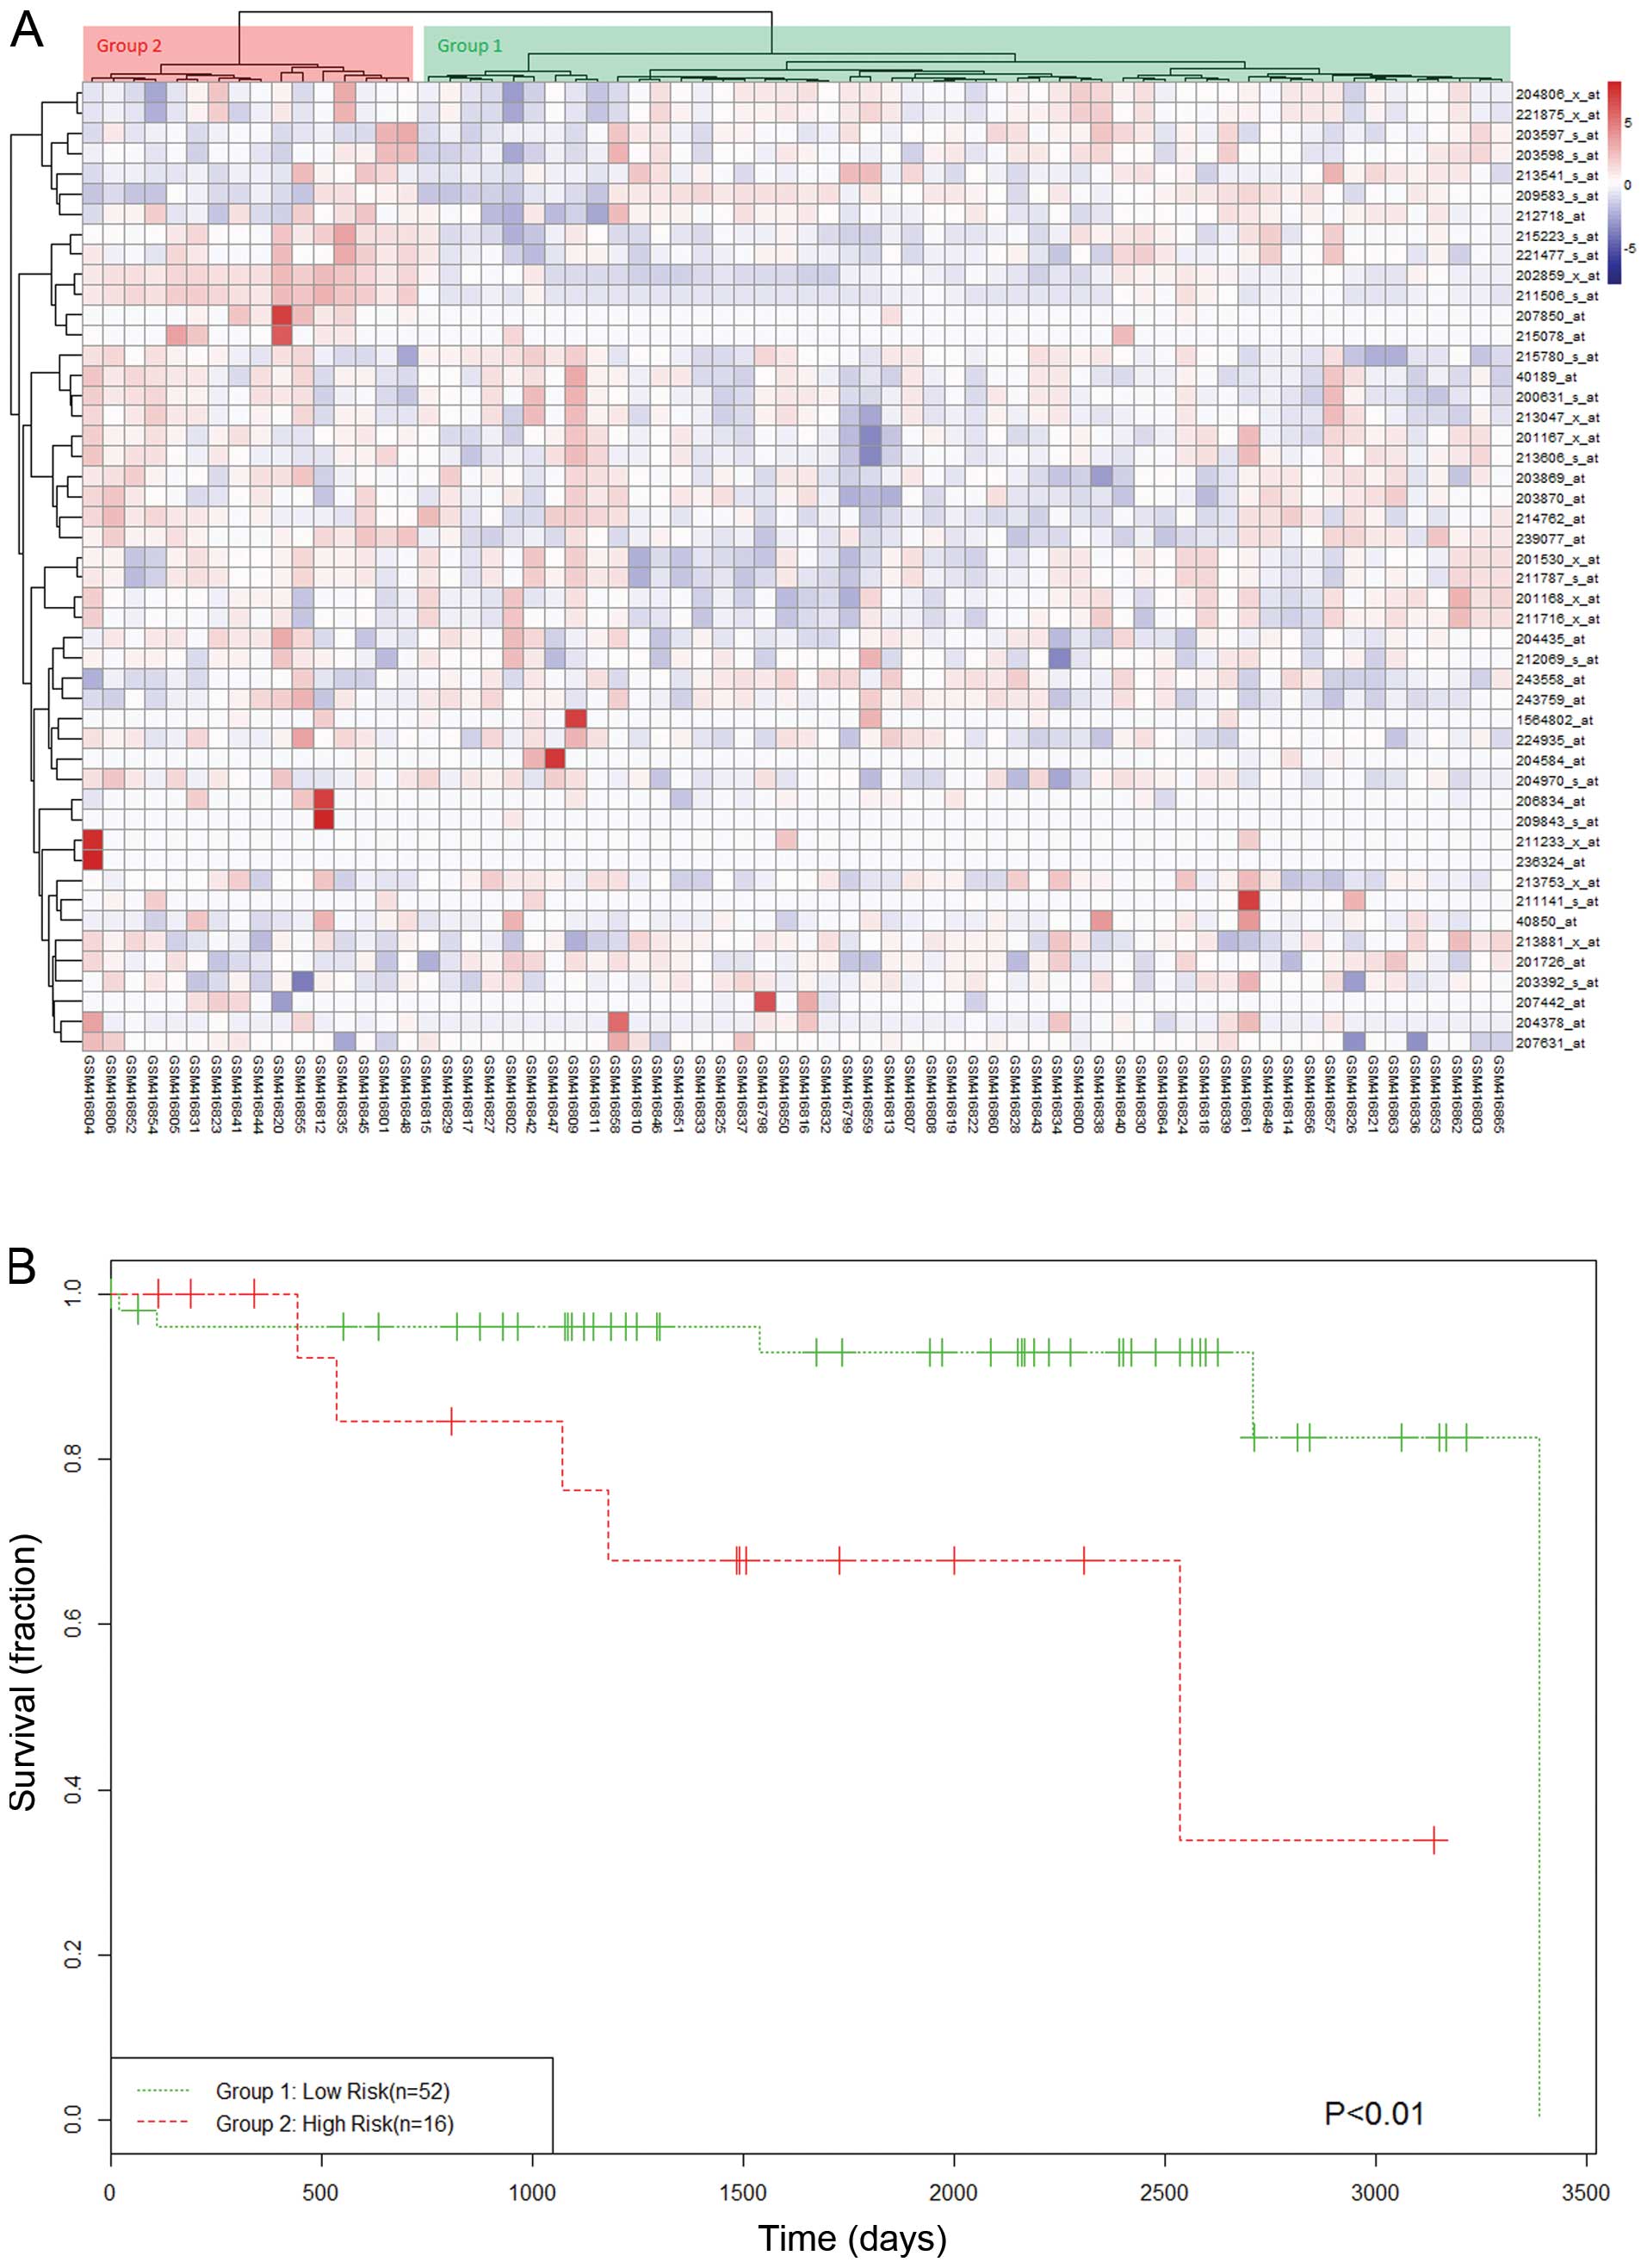
individuals into cancerous and normal groups. To determine whether
the gene expression profiles could accurately predict overall
survival, hierarchical clustering was used to classify all of the
samples from dataset 2 into two groups as high- and low-risk groups
(Fig. 3A). Kaplan-Meier analysis
demonstrated that the high- and low-risk groups were significantly
different in their overall survival (P<0.01) (Fig. 3B).
| Table IIThirty-seven genes composing the
survival related profile. |
Table II
Thirty-seven genes composing the
survival related profile.
| Symbol | Chromosome
location | Description |
|---|
| ARHGDIA | 17q25.3 | Rho GDP dissociation
inhibitor (GDI) α |
| ATP6V1G2 | 6p21.3 | ATPase, H+
transporting, lysosomal 13 kDa, V1 subunit G2 |
| BCAS1 | 20q13.2 | Breast carcinoma
amplified sequence 1 |
| CD200 | 3q12-q13 | CD200 molecule |
| CNOT3 | 19q13.4 | CCR4-NOT
transcription complex, subunit 3 |
| CSF3 | 17q11.2-q12 | Colony stimulating
factor 3 (granulocyte) |
| CSGALNACT2 | 10q11.21 | Chondroitin sulfate
N-acetylgalactosaminyltransferase 2 |
| CTBP1 | 4p16 | C-terminal binding
protein 1 |
| CXCL3 | 4q21 | Chemokine (C-X-C
motif) ligand 3 |
| EIF2S3 | Xp22.2-p22.1 | Eukaryotic
translation initiation factor 2, subunit 3 γ, 52 kDa |
| EIF5A | 17p13-p12 | Eukaryotic
translation initiation factor 5A |
| ELAVL1 | 19p13.2 | ELAV (embryonic
lethal, abnormal vision, Drosophila)-like 1 (Hu antigen
R) |
| ERG | 21q22.3 | v-ets
erythroblastosis virus E26 oncogene homolog (avian) |
| ESR1 | 6q25.1 | Estrogen receptor
1 |
| FKBP8 | 19p12 | FK506 binding protein
8, 38 kDa |
| FUS | 16p11.2 | Fused in sarcoma |
| HBD | 11p15.5 | Hemoglobin, δ |
| HLA-F | 6p21.3 | Major
histocompatibility complex, class I, F |
| HMGN1 | 21q22.2 | High mobility group
nucleosome binding domain 1 |
| HNRNPR | 1p36.12 | Heterogeneous nuclear
ribonucleoprotein R |
| IL8 | 4q13-q21 | Interleukin 8 |
| L1CAM | Xq28 | L1 cell adhesion
molecule |
| LOC100129518 | 6q25.3 | Uncharacterized
LOC100129518 |
| MAFG | 17q25.3 | v-maf
musculoaponeurotic fibrosarcoma oncogene homolog G (avian) |
| MBP | 18q23 | Myelin basic
protein |
| NUPL1 | 13q12.13 | Nucleoporin like
1 |
| PAPOLA | 14q32.31 | Poly(A) polymerase
α |
| PRRC2B | 9q34.13 | Proline-rich
coiled-coil 2B |
| SCAF4 | 21q22.1 | SR-related
CTD-associated factor 4 |
| SENP3 | 17p13 | SUMO1/sentrin/SMT3
specific peptidase 3 |
| SET | 9q34 | SET nuclear
oncogene |
| SETP4 | Xq21.1 | SET pseudogene
4 |
| SOD2 | 6q25.3 | Superoxide
dismutase 2, mitochondrial |
| SOX10 | 22q13.1 | SRY (sex
determining region Y)-box 10 |
| SUMO2 | 17q25.1 | SMT3 suppressor of
mif two 3 homolog 2 (S. cerevisiae) |
| USP46 | 4q12 | Ubiquitin specific
peptidase 46 |
| WBP4 | 13q14.11 | WW domain binding
protein 4 |
Characterization of survival related
profile
We conducted gene set enrichment analysis to
understand the biological characteristics of the 37-gene signature.
The gene signature includes three oncogenes, FUS (FUS RNA binding
protein), ERG (v-ets avian erythroblastosis virus E26 oncogene
homolog) and SET (SET nuclear proto-oncogene); two cell
differentiation markers, CD200 (CD200 molecule) and L1CAM (L1 cell
adhesion molecule); five transcription factors, ESR1 (estrogen
receptor 1), MAFG (v-maf avian musculoaponeurotic fibrosarcoma
oncogene homolog G), CNOT3 (CCR4-NOT transcription complex, subunit
3), SOX10 (sex determining region Y-box 10) and ERG.
To characterize the gene list based on GO
classification on ‘biological process’, ‘molecular function’ and
‘cellular component’, we examined in which categories the gene
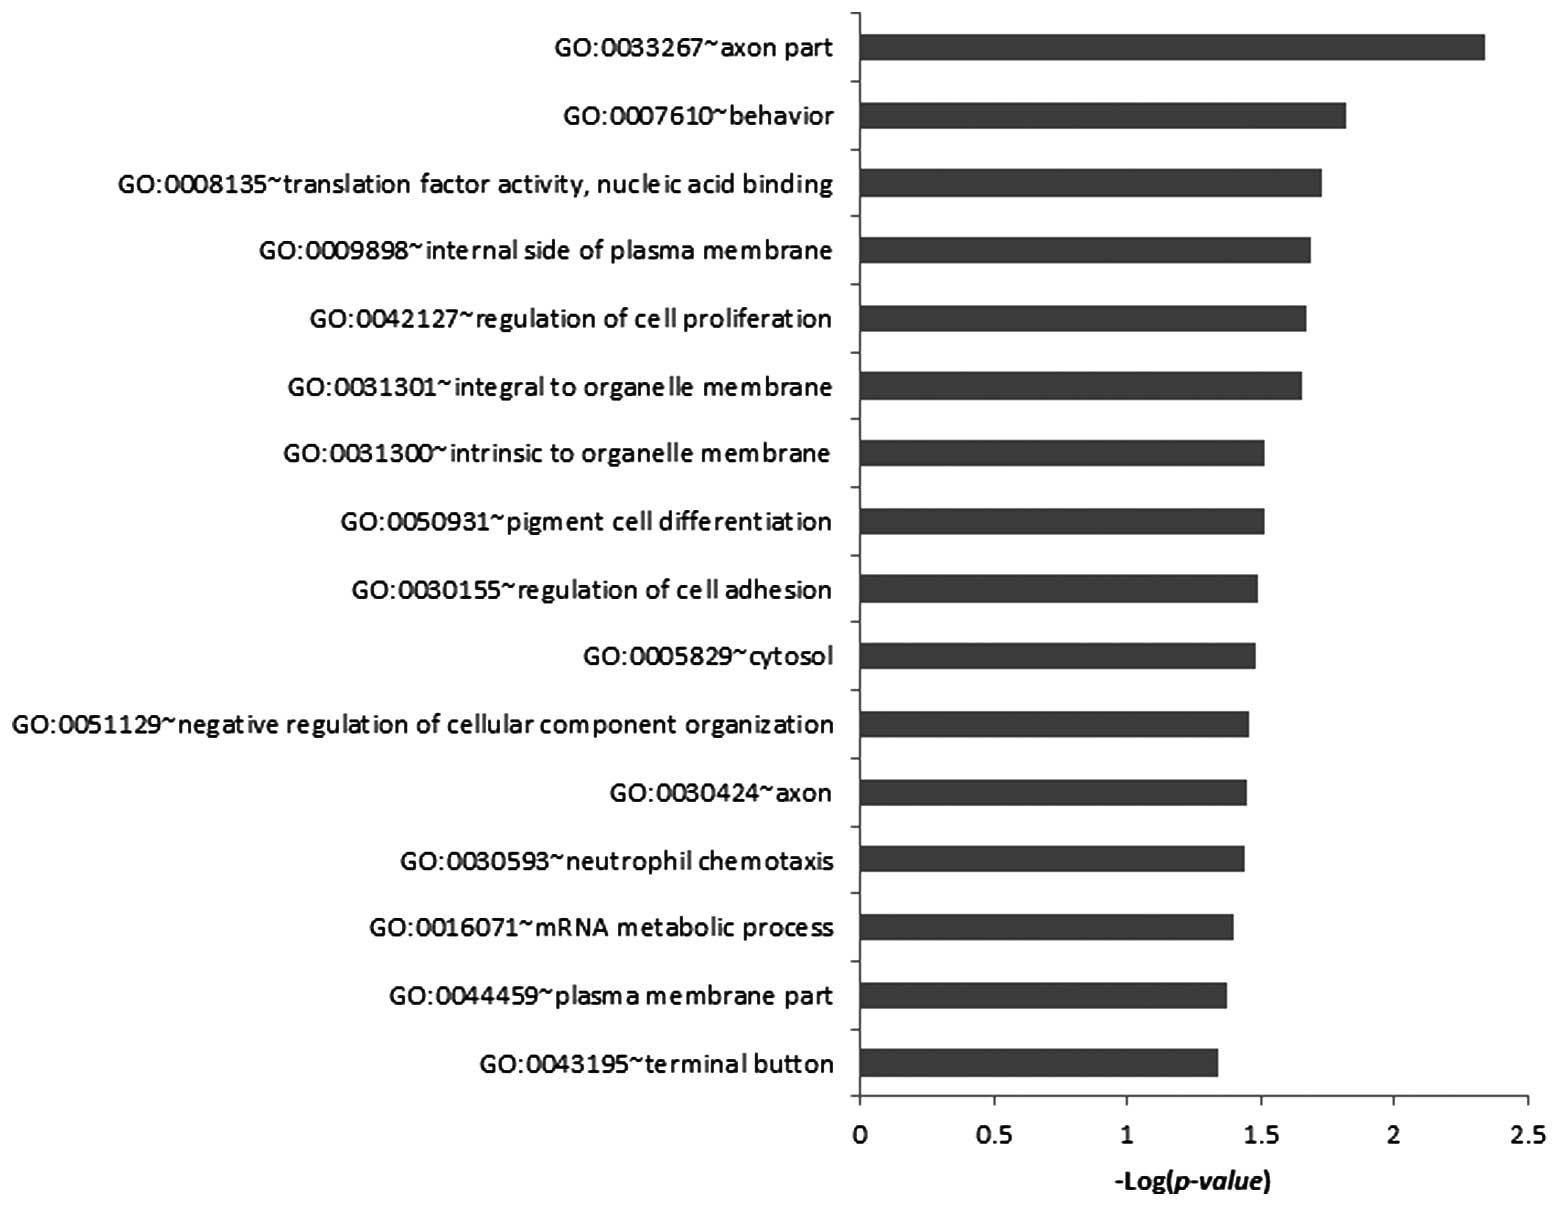
signature was significantly enriched. The 37 genes were
significantly (P-value <0.05) enriched in 16 GO categories. In
the biological process class, the genes were notably enriched in
behaviour (GO:0007610), regulation of cell proliferation
(GO:0042127), pigment cell differentiation (GO:0050931), regulation
of cell adhesion (GO:0030155), negative regulation of cellular
component organization (GO:0051129), neutrophil chemotaxis
(GO:0030593) and mRNA metabolic process (GO:0016071). In cellular
component class, the genes were significantly enriched in axon part
(GO:0033267), internal side of plasma membrane (GO:0009898),
integral to organelle membrane (GO:0031301), intrinsic to organelle
membrane (GO:0031300), cytosol (GO:0005829), axon (GO:0030424),
plasma membrane part (GO:0044459) and terminal button (GO:0043195).
In the molecular function class, the genes were only enriched in
translation factor activity, nucleic acid binding (GO:0008135)
(Fig. 4).
However, we could not identify any pathway that the
37 genes were significantly enriched in.
Discussion
In the present study, we identified a 37-gene
prognostic signature for meningioma patients across two types of
microarray expression profiling datasets by using Cox proportional
hazard models. This gene signature was independently predictive of
survival and outperforming current pathological staging
criteria.
Our survival gene signature consists of genes that
showed prognostic potential in other cancer types. For instance,
the gene ARHGDIA [Rho GDP dissociation inhibitor (GDI) alpha] is
associated with mesothelioma (16,17)
prognosis and could serve as an independent prognostic factor in
hepatocellular carcinoma (18).
Another example is the gene CD200. CD200 is expressed in most PCM
(plasma cell myeloma) cases and its expression level remains stable
even during the treatment process, which could serve as a useful
marker for the prognosis of PCM (19,20).
It is also reported that CD200 could be a new prognostic factor in
acute myeloid leukaemia (21).
ESR1, a ligand-activated transcription factor, involves in
pathological processes of breast (22–25),
prostate (26) and non-small cell
lung cancer (27).
Surprisingly, from the differential expression
analysis, a small number of genes that upregulated or downregulated
were identified in meningioma comparing to normal meninges. This
suggests that meningioma and normal meninges may remain largely
homogeneous at global gene expression level. However, the
identified differentially expressed genes appear to be clinically
and even biologically important, which could ultimately influence
the prognostic outcome.
To the best of our knowledge, the present study is
the first to identify a prognostic signature for meningioma
prognosis based on genome wide expression profiling technologies.
However, because most of the current public accessible meningioma
data lack sufficient follow-up information, we could not evaluate
the prognostic predictive power in other independent datasets. For
future work, we will continuously work on optimizing the prognosis
model by integrating more meningioma datasets.
In conclusion, these results suggest that the
37-gene signature could serve as a useful tool to predict the
meningioma progression and survival. To apply in the clinical
practice, a prospective multi-centre study is still needed to
improve the predictive ability and reliability of the gene
expression profile. Nevertheless, the survival related gene
expression profile could provide an optimization of the clinical
management and development of new therapeutic strategies for
meningioma.
References
|
1
|
Claus EB, Bondy ML, Schildkraut JM,
Wiemels JL, Wrensch M and Black PM: Epidemiology of intracranial
meningioma. Neurosurgery. 57:1088–1095. 2005. View Article : Google Scholar : PubMed/NCBI
|
|
2
|
Pasquier D, Bijmolt S, Veninga T, et al:
Atypical and malignant meningioma: outcome and prognostic factors
in 119 irradiated patients. A multicenter, retrospective study of
the Rare Cancer Network. Int J Radiat Oncol Biol Phys.
71:1388–1393. 2008. View Article : Google Scholar : PubMed/NCBI
|
|
3
|
Linsler S, Kraemer D, Driess C, et al:
Molecular biological determinations of meningioma progression and
recurrence. PloS One. 9:e949872014. View Article : Google Scholar : PubMed/NCBI
|
|
4
|
Konstantinopoulos PA, Spentzos D and
Cannistra SA: Gene-expression profiling in epithelial ovarian
cancer. Nat Clin Pract Oncol. 5:577–587. 2008. View Article : Google Scholar : PubMed/NCBI
|
|
5
|
van ‘t Veer LJ, Dai H, van de Vijver MJ,
et al: Gene expression profiling predicts clinical outcome of
breast cancer. Nature. 415:530–536. 2002. View Article : Google Scholar
|
|
6
|
Motoori M, Takemasa I, Yano M, et al:
Prediction of recurrence in advanced gastric cancer patients after
curative resection by gene expression profiling. Int J Cancer.
114:963–968. 2005. View Article : Google Scholar : PubMed/NCBI
|
|
7
|
Chen HY, Yu SL, Chen CH, et al: A
five-gene signature and clinical outcome in non-small-cell lung
cancer. N Engl J Med. 356:11–20. 2007. View Article : Google Scholar : PubMed/NCBI
|
|
8
|
Schramm A, Schulte JH, Klein-Hitpass L, et
al: Prediction of clinical outcome and biological characterization
of neuroblastoma by expression profiling. Oncogene. 24:7902–7912.
2005. View Article : Google Scholar : PubMed/NCBI
|
|
9
|
Tabernero MD, Maillo A, Gil-Bellosta CJ,
et al: Gene expression profiles of meningiomas are associated with
tumor cytogenetics and patient outcome. Brain Pathol. 19:409–420.
2009. View Article : Google Scholar
|
|
10
|
Lee Y, Liu J, Patel S, et al: Genomic
landscape of meningiomas. Brain Pathol. 20:751–762. 2010.
View Article : Google Scholar
|
|
11
|
Wu Z, Irizarry RA, Gentleman R,
Martinez-Murillo F and Spencer F: A model-based background
adjustment for oligonucleotide expression arrays. J Am Stat Assoc.
99:909–917. 2004. View Article : Google Scholar
|
|
12
|
Irizarry RA, Hobbs B, Collin F, et al:
Exploration, normalization, and summaries of high density
oligonucleotide array probe level data. Biostatistics. 4:249–264.
2003. View Article : Google Scholar : PubMed/NCBI
|
|
13
|
Smyth GK: Limma: linear models for
microarray data. Bioinformatics and Computational Biology Solutions
Using R and Bioconductor. Springer; New York: pp. 397–420. 2005,
View Article : Google Scholar
|
|
14
|
Therneau TM and Grambsch PM: Modeling
Survival Data: Extending the Cox Model. Springer; New York:
2000
|
|
15
|
Huang da W, Sherman BT and Lempicki RA:
Systematic and integrative analysis of large gene lists using DAVID
bioinformatics resources. Nat Protoc. 4:44–57. 2009. View Article : Google Scholar : PubMed/NCBI
|
|
16
|
Gordon GJ, Bueno R and Sugarbaker DJ:
Genes associated with prognosis after surgery for malignant pleural
mesothelioma promote tumor cell survival in vitro. BMC Cancer.
11:1692011. View Article : Google Scholar : PubMed/NCBI
|
|
17
|
Gordon GJ, Dong L, Yeap BY, et al:
Four-gene expression ratio test for survival in patients undergoing
surgery for mesothelioma. J Natl Cancer Inst. 101:678–686. 2009.
View Article : Google Scholar : PubMed/NCBI
|
|
18
|
Li W, Wang H, Jin X and Zhao L: Loss of
RhoGDI is a novel independent prognostic factor in hepatocellular
carcinoma. Int J Clin Exp Pathol. 6:2535–2541. 2013.PubMed/NCBI
|
|
19
|
Douds JJ, Long DJ, Kim AS and Li S:
Diagnostic and prognostic significance of CD200 expression and its
stability in plasma cell myeloma. J Clin Pathol. 67:792–796. 2014.
View Article : Google Scholar : PubMed/NCBI
|
|
20
|
Alapat D, Coviello-Malle J, Owens R, et
al: Diagnostic usefulness and prognostic impact of CD200 expression
in lymphoid malignancies and plasma cell myeloma. Am J Clin Pathol.
137:93–100. 2012. View Article : Google Scholar
|
|
21
|
Tonks A, Hills R, White P, et al: CD200 as
a prognostic factor in acute myeloid leukaemia. Leukemia.
21:566–568. 2007. View Article : Google Scholar : PubMed/NCBI
|
|
22
|
Caizzi L, Ferrero G, Cutrupi S, et al:
Genome-wide activity of unliganded estrogen receptor-alpha in
breast cancer cells. Proc Natl Acad Sci USA. 111:4892–4897. 2014.
View Article : Google Scholar
|
|
23
|
Gao QG, Chan HY, Man CW and Wong MS:
Differential ERalpha-mediated rapid estrogenic actions of
ginsenoside Rg1 and estren in human breast cancer MCF-7 cells. J
Steroid Biochem Mol Biol. 141:104–112. 2014. View Article : Google Scholar : PubMed/NCBI
|
|
24
|
Martinez-Galan J, Torres-Torres B, Nunez
MI, et al: ESR1 gene promoter region methylation in free
circulating DNA and its correlation with estrogen receptor protein
expression in tumor tissue in breast cancer patients. BMC Cancer.
14:592014. View Article : Google Scholar : PubMed/NCBI
|
|
25
|
Toy W, Shen Y, Won H, et al: ESR1
ligand-binding domain mutations in hormone-resistant breast cancer.
Nat Genet. 45:1439–1445. 2013. View
Article : Google Scholar : PubMed/NCBI
|
|
26
|
Gu Z, Wang G and Chen W: Estrogen receptor
alpha gene polymorphisms and risk of prostate cancer: a
meta-analysis involving 18 studies. Tumour Biol. 35:5921–5930.
2014. View Article : Google Scholar : PubMed/NCBI
|
|
27
|
Atmaca A, Al-Batran SE, Wirtz RM, et al:
The validation of estrogen receptor 1 mRNA expression as a
predictor of outcome in patients with metastatic non-small cell
lung cancer. Int J Cancer. 134:2314–2321. 2014. View Article : Google Scholar
|