Introduction
Prostate cancer is the most frequent malignancy in
men. Although the majority of patients present with early stage
tumors that can be surgically treated in a curative manner, ~20% of
the tumors will progress to metastatic and hormone refractory
disease, accounting for >250.000 deaths per year worldwide
(1). Targeted therapies that would
allow for an effective treatment after failure of androgen
withdrawal therapy are lacking.
Recent whole genome sequencing studies have shown
that the genomic landscape of prostate cancer differs markedly from
that of other solid tumor types. Whereas, for example, breast or
colon cancer is characterized by high-grade genetic instability and
presence of a multitude of mutations, deletions, and amplifications
including important therapy target genes such as HER2 and
EGFR (2,3), prostate cancers show only
comparatively few mutations and almost completely lack
amplifications (4–7). In contrast, prostate tumors are
typically characterized by translocations, deletions, and gene
fusions, the latter of which are recurrently involving
androgen-responsive genes and transcription factors of the E-twenty
six (ETS) family (8). The most
frequent ETS-fusion is caused by interstitial deletion or
translocation of a 3.7 Mb genomic segment located between the
TMPRSS2 serine protease and the ERG transcription factor at
chromosome 21q22. Approximately 50% of prostate cancers carry the
TMPRSS2:ERG fusion, which brings ERG under the
control of the androgen responsive TMPRSS2 promoter and results in
permanent expression of ERG (9). Accordingly, ETS-fusion proteins have
been proposed as putative targets for future gene-specific
therapies (10).
In a recent study, which was performed in the
context of the International Cancer Genome Consortium (11) (ICGC) project on Early-Onset
Prostate Cancer, we have carried out integrated genomic analyses,
including whole-genome, transcriptome, and DNA methylome sequencing
in 11 early onset prostate cancer (EO-PCA) patients and detected a
total of 156 individual gene fusions, 140 of which were
non-recurrent and unrelated to ETS genes (5). It could be possible that some of
these rearrangements result in expressed fusion proteins that could
serve as cancer-specific therapy targets, provided that these
rearrangements occur at sufficient frequency to justify the efforts
of drug development. Accordingly, the aim of the present study was
to determine the prevalence of rearrangements of 27 genes by
fluorescence in situ hybridization (FISH) analysis in 500
prostate cancer samples in a tissue microarray format.
Materials and methods
Tissues
A subset of our previously described prostate cancer
prognosis tissue microarray (12)
was used for the present study, including one TMA block containing
one 0.6 mm punch each from formalin-fixed and paraffin-embedded
tumor samples of 500 different patients undergoing surgery between
1992 and 2004 at the Department of Urology, University Medical
Center Hamburg-Eppendorf. Presence of tumor cells in the tissue
spots was confirmed in 478 tissue spots by 34βE12 immunostaining in
an adjacent TMA slide (13). The
remaining 22 tissue spots were excluded from analysis. The
pathological parameters of the TMA spots are described in Table I.
 | Table IComposition of the prognosis TMA
containing 500 prostate cancer specimens. |
Table I
Composition of the prognosis TMA
containing 500 prostate cancer specimens.
| No. of
patients |
|---|
|
|
|---|
| Study cohort on TMA
(n=500) | Biochemical relapse
among categories (n=130) |
|---|
| Follow-up |
| Mean | 37 months | - |
| Median | 33 months | - |
| Age (years) |
| <50 | 16 | 6 |
| 50–60 | 179 | 44 |
| >60–70 | 279 | 73 |
| >70 | 26 | 7 |
| Pretreatment PSA
(ng/ml) |
| <4 | 73 | 9 |
| 4–10 | 282 | 64 |
| 10–20 | 112 | 42 |
| >20 | 33 | 15 |
| pT category (AJCC
2002) |
| pT2 | 310 | 38 |
| pT3a | 126 | 46 |
| pT3b | 63 | 45 |
| pT4 | 1 | 1 |
| Gleason grade |
| ≤3+3 | 195 | 15 |
| 3+4 | 241 | 68 |
| 4+3 | 59 | 42 |
| ≥4+4 | 5 | 5 |
| pN category |
| pN0 | 202 | 70 |
| pN+ | 15 | 14 |
| Surgical
margin |
| Negative | 356 | 85 |
| Positive | 144 | 45 |
Fluorescence in situ hybridization
(FISH)
FISH was used to detect rearrangements of the 27
selected target genes. For all genes, dual color FISH break-apart
probes were manufactured from Spectrum Orange/Spectrum Green
labeled bacterial artificial chromosomes (BACs) corresponding to
the 5′ and 3′ flanking regions of the individual genes. A list of
the target genes, BAC clones, and labeling schemes is provided in
Table II. For FISH analysis,
freshly cut 4 μm TMA sections were de-waxed and pre-treated using a
commercial kit (paraffin pretreatment reagent kit; Abbott
Molecular, Wiesbaden, Germany), followed by dehydration in 70, 80
and 96% ethanol, air-drying and denaturation for 10 min at 72°C in
70% formamide-2X SSC solution. Hybridization was done overnight at
37°C in a humidified chamber; slides were then washed,
counterstained with 0.2 μmol/l 4′-6-diamidino-2-phenylindole in
mounted in antifade solution.
| Table IIList of the genes that were analyzed
for rearrangements using FISH break-apart probes. |
Table II
List of the genes that were analyzed
for rearrangements using FISH break-apart probes.
| | FISH break apart
probe composition | Whole genome
sequencing resultsa |
|---|
| |
|
|
|---|
| Gene | Chromosomal
locus | 5′ BAC(s) | 3′ BAC(s) | Rearrangement
type | Fusion partner
genes |
|---|
| ALDH7A1 | 5q23.2 | SO RP11-772E11 | SG RP11-517I3 |
Translocation
Translocation
Translocation |
ANKRD27:ALDH7A1
ZNF480:ALDH7A1
ELAVL1:ALDH7A1 |
| NR3C1 | 5q31.3 | SG RP11-614D16 | SO RP11-738H11 | Translocation |
NR3C1:HOXA9 |
|
SLC16A12 | 10q23.31 | SG RP11-788M08 | SO RP11-168O10 | Translocation |
SLC16A12:TESC |
| FAM154A | 9p22.1 | SG RP11-151J10 | SO RP11-220B22 |
Translocation
Translocation |
FAM154A:IRAK3
FAM154A:LRP1 |
| PANK1 | 10q23.31 | SG RP11-626K2 | SO RP11-705K1 | Translocation |
CCNT1:PANK1 |
| ARNTL2 | 12p11.23 | SG RP11-546C06 | SO RP11-529A16 | Translocation | ARNTL2 |
| ZNRF3 | 22q12.1 | SO RP11-436H02, SO
RP11-493M06 | SG RP11-664C16, SG
RP11-213L15 | Translocation |
ZNRF3:FBXO16 |
| IMMP2L | 7q31.1 | SG RP11-365F8,
RP11-148C1 | SO RP11-75O20,
RP11-154C19 | Translocation |
IMMP2L:LYST |
| ENOX1 | 13q14.3 | SG RP11-75G24,
RP11-671N06 | SO RP11-364B16,
RPRP11-64J21 |
Translocation
Translocation |
ENOX1:ANO2
WWOX:ENOX1 |
| LYRM4 | 5p25.1 | SO RP3-520B18 | SG RP11-284B11 | Translocation | -:LYRM4 |
| CNOT10 | 3p22.3 | SO RP11-1005I1 | SG RP11-301L7 | Translocation |
-:CNOT10 |
| HLCS | 21q22.13 | SG RP11-383L18 | SO RP11-169M12 |
Translocation
Inversion
Inversion
Translocation |
C1orf151:HLCS
HLCS:TTC3
HLCS:ERG
TTC3:CCDC21 |
| TTC3 | 21q22.13 | SO RP11-674C12 | SG RP11-70N15 | Inversion
Inversion |
TTC3:ERG
HLCS:TTC3 |
| PCNXL2 | 1q42.2 | SO RP11-740C10 | SG RP11-125H16 |
Translocation
Deletion
Deletion |
ENSG00000253819:PCNXL2
DISC1:PCNXL2
C11orf41:RAG1 |
|
C11orf41 | 11p13 | SG RP11-528E21 | SO RP11-60G13 | Deletion |
C11orf41:OR51E2 |
| MLLT4 | 6q27 | SO RP11-351J23 | SG RP11-359F23 | Deletion |
MLLT4:KIF25 |
| GPHN | 14q23.3 | SG RP11-107B06, SG
RP11-100A18 | SO RP11-205I6, SO
RP11-769O05 | Deletion
Deletion |
GPHN:RGS6
GPHN:DPF3 |
| VCL | 10q22.2 | SG RP11-417O11 | SO RP11-178G16 | Deletion |
VCL:ZNF503 |
| DPF3 | 14q24.2 | SO RP5-1140N14, SO
RP11-326F24 | SG RP11-437J15, SG
RP3-514A23 | Deletion
Inversion
Inversion |
GPHN:DPF3
RGS6:DPF3
ZNF578:EPN1 |
| ZNF578 | 19q13.41 | SO RP11-108N06 | SG RP11-207K02 | Inversion
Inversion |
ANKRD27:ZNF578
KDM4B:ZNF578 |
| SH3BGR | 21q22.2 | SG RP11-749C05 | SO RP11-165H11 | Inversion |
SH3BGR:RIPK4 |
| LRP12 | 8q22.3 | SO RP11-77K11 | SG RP11-437B02 | Inversion |
LRP12:ENSG00000253350 |
| ZHX2 | 8q24.13 | SO RP11-94L20 | SG RP11-263A19 | Inversion | -:ZHX2 |
| WDR67 | 8q24.13 | SG RP11-263A19 | SO RP11-54J08 | Inversion |
ENSG00000254303:WDR67 |
| EPN1 | 19q13.42 | SO CTD-2537I9 | SG CTD-2611O12,
RP11-107J22 | Inversion |
ZNF578:EPN1 |
| NCKAP5 | 2q21.2 | SO RP11-736B01, SO
RP11-789J19 | SG RP11-351L15, SG
RP11-393D01 | Inversion |
NCKAP5:MGAT5 |
| PACRG | 6q26 | SG RP11-57O22, SG
RP11-621H02 | SO RP11-308E20, SO
RP3-495O10 | Inversion
Duplication |
PACRG:LOC285796
IPCEF1:PACRG |
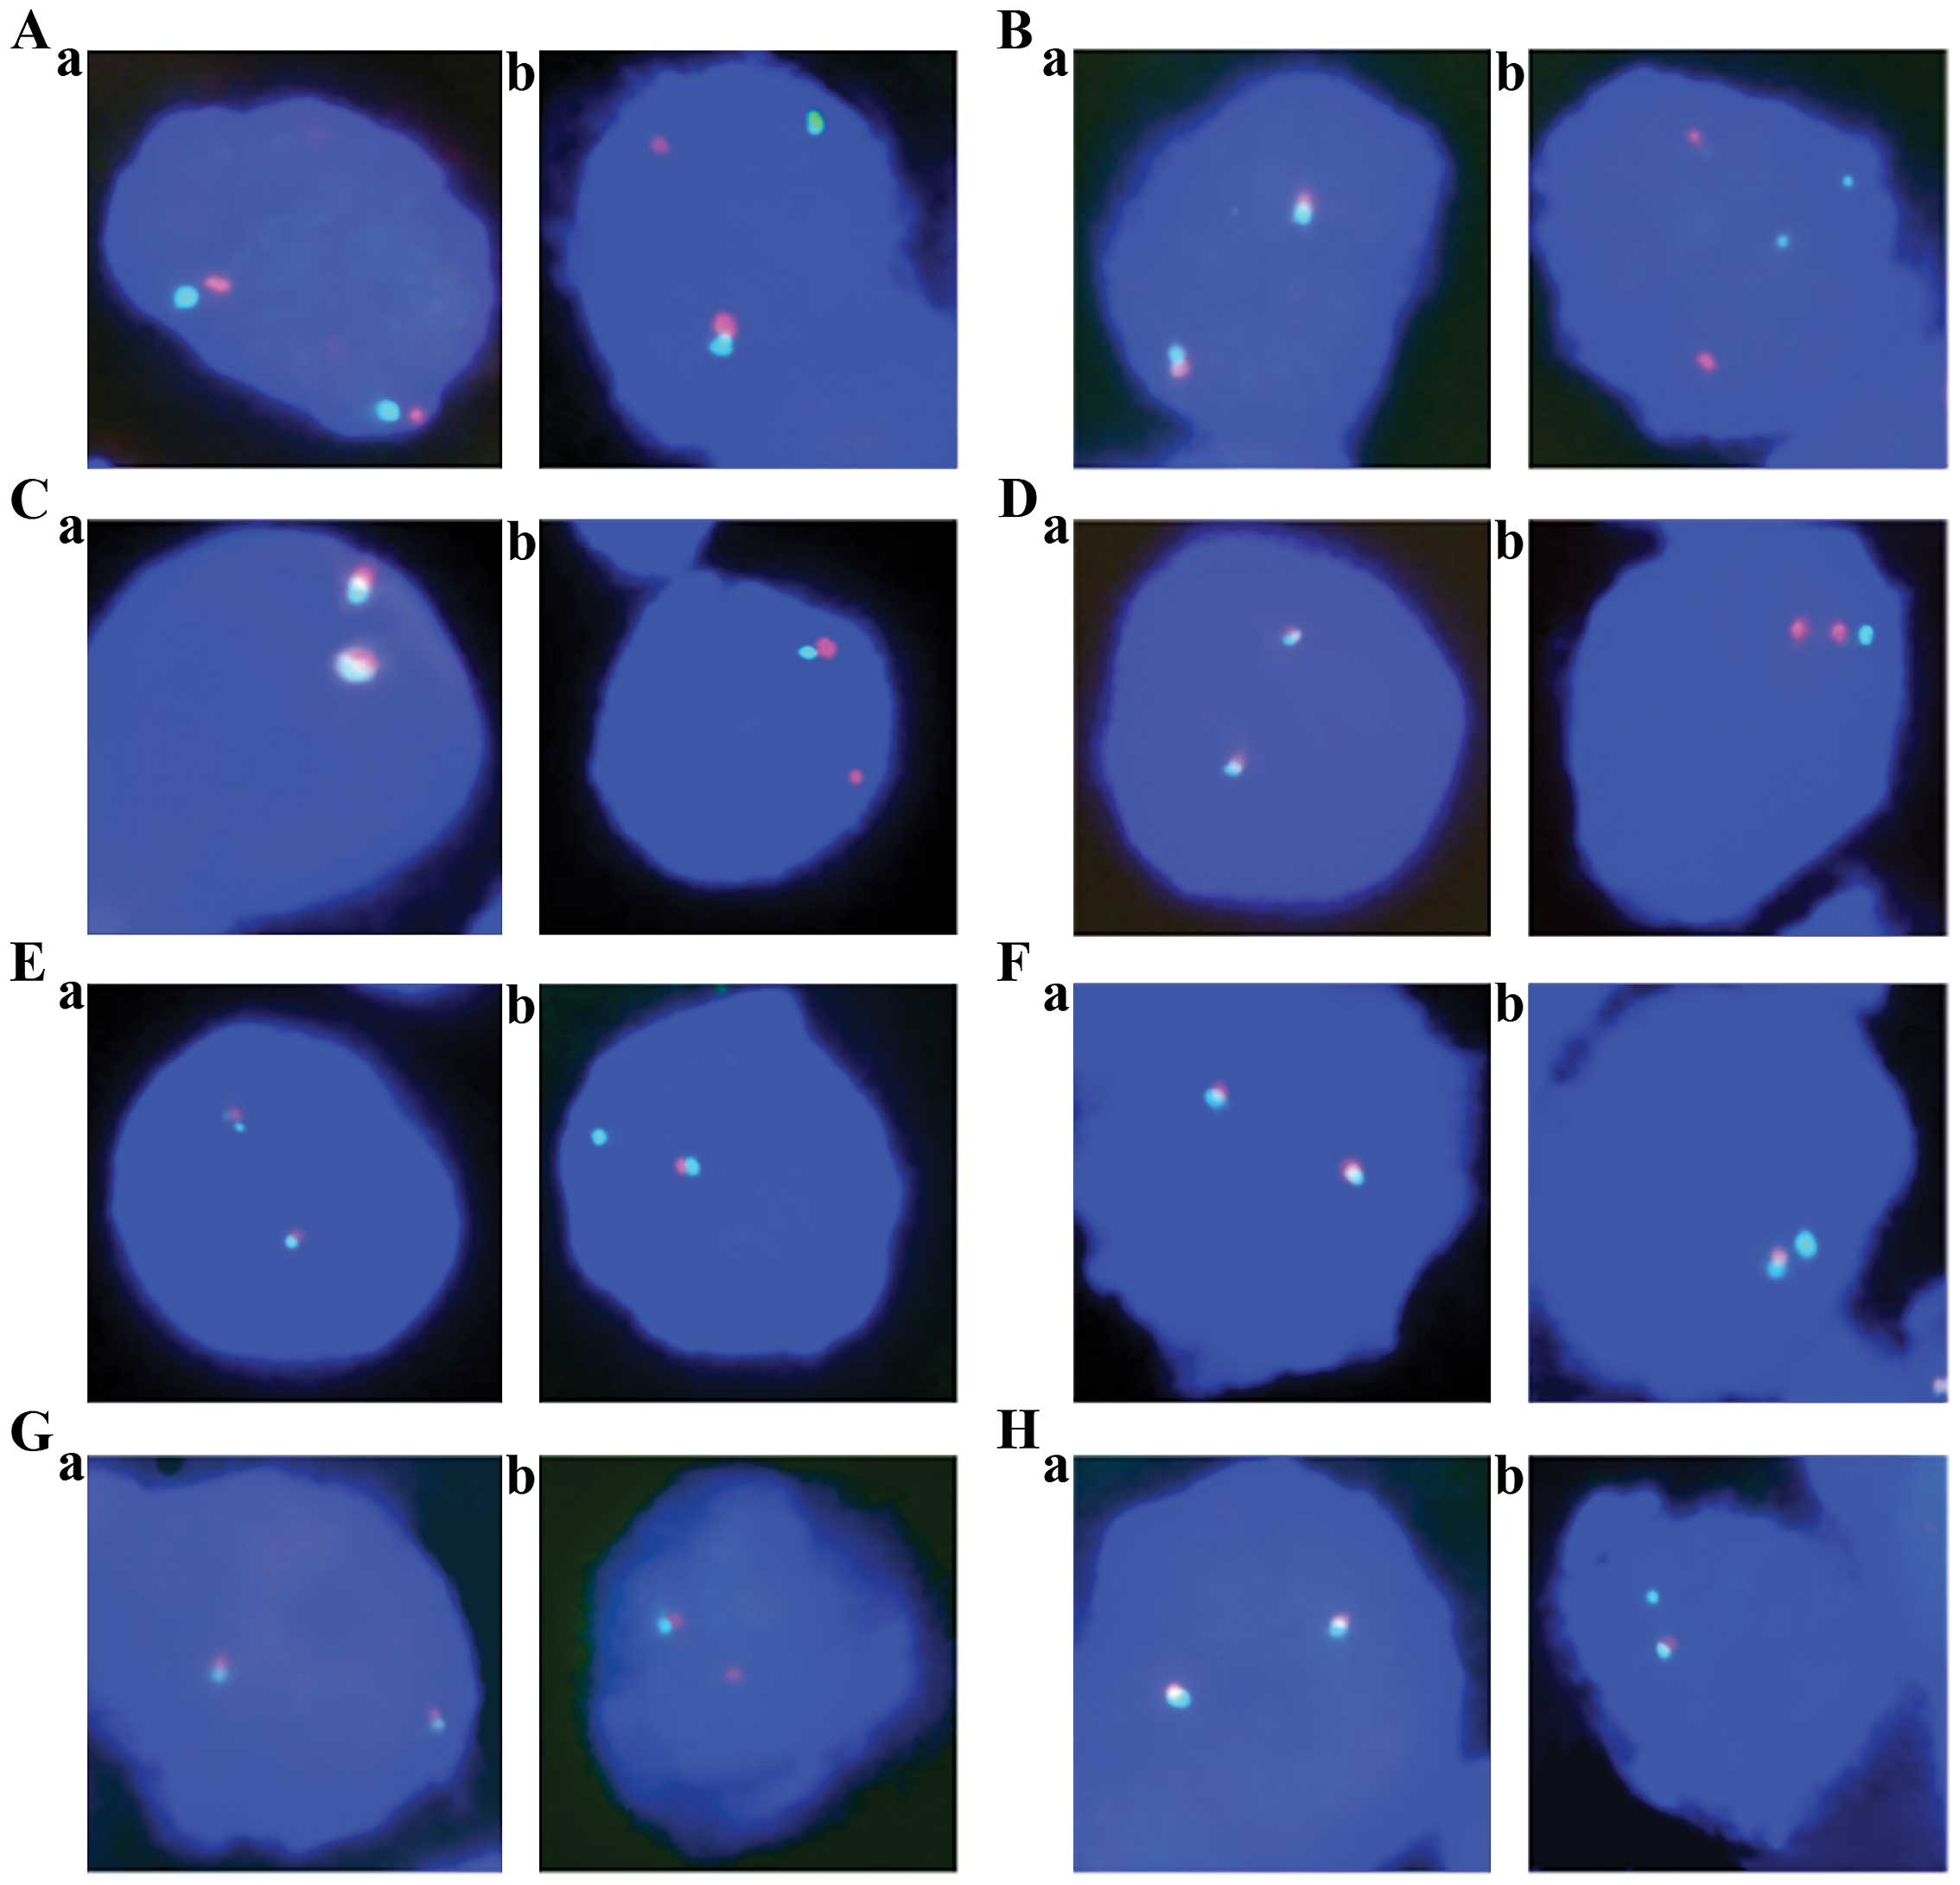
Scoring of FISH
The stained slides were visually inspected under an
epifluorescence microscope. A rearrangement was assumed if at least
one split signal consisting of a separate orange and green signal
was observed in ≥60% of the tumor cell nuclei (indicating balanced
translocations) or if individual orange and green signals from the
overlapping orange/green signal were lost (indicating deletions
with breakpoint inside the gene or imbalanced translocations).
Presence of only one overlapping orange/green signal in >60% of
tumor cells were considered heterozygous deletion. Tumors with
complete lack of overlapping orange/green signals were regarded as
homozygous deletions provided that FISH signals were present in
adjacent normal cells.
Results
Rearrangements were detected for 13 (48%) of the 27
tested genes. Recurrent breakage was found for NCKAP5,
SH3BGR and TTC3 in 3 tumors each, as well as for
ARNTL2 and ENOX1 in 2 cancers each. One rearranged
tumor sample was observed for each of VCL, ZNF578, IMMP2L,
SLC16A12, PANK1, GPHN, LRP1 and ZHX2. All but four
rearrangement were unbalanced, i.e. either the 5′ or the 3′ part of
the FISH probe was lost. For ZNF578, SH3BGR, LPR12 and
ZHX2 a split signal was found suggesting balanced
translocation. Deletions were markedly more frequent than
translocations. The most frequently deleted genes were
NCKAP5 (7.5%), VCL (6.8%), PANK1 (5.9%),
ARNTL2 (5.8%), SLC16A12 (5.6%), SH3BGR (3.0%)
and PCNXL2 (1.6%). All detected deletions were heterozygous.
No alternations were found for C11orf41, MLLT4, ALDH7A1, EPN1,
NR3C1, PACRG, LYRM4, DPF3, FAM154A and WDR67. The number
of successfully analyzed samples per target gene, and the frequency
and type of rearrangements and deletions for all analyzed genes is
summarized in Table III.
Representative FISH images are shown in Fig. 1.
| Table IIIPrevalence and type of detected
structural rearrangements. |
Table III
Prevalence and type of detected
structural rearrangements.
| | Rearrangement | Deletion |
|---|
| |
|
|
|---|
| Gene | Chromosomal
locus | Analyzable | Unbalanced | Balanced | Analyzable | Deletion |
|---|
| PCNXL2 | 1q42.2 | 436 | 0 | 0 | 436 | 7 (1.6) |
| NCKAP5 | 2q21.2 | 377 | 3 (0.8) | 0 | 374 | 28 (7.5) |
| CNOT10 | 3p22.3 | 382 | 0 | 0 | 382 | 4 (1.0) |
| IMMP2L | 7q31.1 | 320 | 1 (0.3) | 0 | 320 | 1 (0.3) |
| LRP12 | 8q22.3 | 321 | 0 | 1 (0.3) | 321 | 0 |
| ZHX2 | 8q24.13 | 389 | 0 | 1 (0.3) | 389 | 0 |
| VCL | 10q22.2 | 338 | 1 (0.3) | 0 | 176 | 12 (6.8) |
|
SLC16A12 | 10q23.31 | 363 | 1 (0.3) | 0 | 250 | 14 (5.6) |
| PANK1 | 10q23.31 | 355 | 1 (0.3) | 0 | 188 | 11 (5.9) |
| ARNTL2 | 12p11.23 | 316 | 2 (0.6) | 0 | 171 | 10 (5.8) |
| ENOX1 | 13q14.3 | 435 | 2 (0.5) | 0 | 435 | 0 |
| GPHN | 14q23.3 | 406 | 1 (0.2) | 0 | 406 | 0 |
| ZNF578 | 19q13.41 | 393 | 0 | 1 (0.3) | 393 | 0 |
| HLCS | 21q22.13 | 360 | 0 | 0 | 360 | 2 (0.6) |
| TTC3 | 21q22.13 | 385 | 3 (0.8) | 0 | 385 | 0 |
| SH3BGR | 21q22.2 | 368 | 2 (0.5) | 1 (0.3) | 368 | 11 (3.0) |
| ZNRF3 | 22q12.1 | 273 | 0 | 0 | 273 | 4 (1.5) |
Discussion
The results of the present study demonstrate that
most chromosomal rearrangement, including balanced translocations
and partial deletions characterized by intragenic breaks, represent
very rare events in prostate cancer. The prevalence of breakage
events affecting the 27 analyzed genes in this study was usually
below 1%.
Based on our data, obtained in a cohort of over 500
tumors, it is not surprising that whole genome sequencing studies
on prostate cancer found only few recurrent rearrangements (except
TMPRSS2:ERG) in a total of 18 cancers (4,5).
Although >250 individual non-ETS gene fusion events (resulting
from translocations, inversions and duplications) were identified
in these two studies in total, only 16 non-ETS genes in the study
by Berger et al (4) and 1
gene in the study by Weischenfeld et al (5) were recurrently hit by structural
rearrangements, however, in each case there was a different fusion
partner. Only ETS-fusions were highly recurrent in these
studies, with 4/7 tumors (4) and
8/11 tumors (5) carrying the
TMPRSS2:ERG fusion.
Little is known about the prevalence of individual
gene rearrangements (except TMPRRS2:ERG) in prostate cancer.
Two studies performed by Reid et al (14) and us analyzed breakage of the
PTEN tumor suppressor, and reported 7% (13/187) (14) and 3% (162/5,404) (5) of PTEN breakage, which was
typically (3 out of 4 affected cases) associated with deletions of
the second PTEN allele. In addition, we have previously
studied breakage of the 3p13 tumor suppressor FOXP1
(15) and found 1.2% of
rearrangements. These data suggest that rearrangements are
infrequent even for genes with a key role including PTEN.
The 0.2–1% of rearrangements found for half of the genes analyzed
in the present study fit well to these numbers.
The selection of the 27 genes analyzed in this study
was based on the findings of our International Cancer Genome (ICGC)
project, where we employed the paired end deep sequencing strategy
(16) to specifically identify
gene breakages, translocations and gene fusions. In the present
study we found a total of 140 non-ETS gene rearrangements.
For the present study, we randomly selected genes that were
potentially involved in non-ETS fusions between
protein-coding genes or gene inactivation by translocation or gene
breakage (5). Such genes are
candidates for a dual tumor relevant function, including a putative
tumor suppressor function based on inactivation by gene breakage,
as well as a putative oncogenic in case of expressed fusion
genes.
In this study, deletion of the analyzed region was
more frequent than rearrangement. This fits well with the known
relevance of many of the analyzed genes, which were located at
chromosomal regions that are frequently deleted on prostate cancer,
including for example PANK1, VCL and SLC16A12
(10q22-q23, deleted in 20–30%) (17–19),
NCKAP5 (2q21, deleted in 10–30%) (17–19),
or ARNTL2 (12p11-p12, deleted in 15–60%) (17,19),
explaining the markedly higher frequency of deletions as compared
to rearrangements. The deletion frequencies observed in the present
study were markedly lower than in these studies, which can be
explained by the fact that we did not use a deletion-specific FISH
assay including a combination of a locus-specific and a centromere
reference probe. With the break-apart probe used in this study, we
only called absolute deletions showing unequivocal loss of one
red-green signal pair but missed relative deletions, which
frequently occur in aneuploid cancers.
Several of the genes analyzed in this study,
including NCKAP5:MGAT5, C11orf41:RAG1,
SH3BGR:RIPK4, FAM154A:IRAK3 and CCNT1:PANK1,
were involved in gene fusions leading to overexpression of the
fusion partner according to our previous study (5). Such fusion genes may represent
suitable targets for new gene specific therapies, since they are
specific for the cancer cells. However, the vast majority of gene
breakages detected in this study were unbalanced, with loss of
either the 3′ or the 5′ fraction of the gene, suggesting a partial
deletion of these genes. Only 4 genes, ZNF587,
SH3BGR, LRP12 and ZHX2, showed balanced
rearrangements that might have led to gene fusions. These findings
suggest that intragenic breaks may in most cases indicate a
deletion break point located inside a coding gene, while formation
of a specific rearrangement with a possible functional fusion gene
seems to be a comparatively rare event.
We manufactured break-apart probe assays to detect
rearrangements of the 27 candidate genes in a tissue microarray
format. The use of our tissue microarray format in combination with
FISH enables a fast and cheap analysis of gene rearrangements to
detect common recurrent gene changes. Break-apart assays are
capable of detecting all types of rearrangements of a probed gene,
including translocation, (partial) deletion and inversion, and are
thus optimally suited to estimate the prevalence of rearrangements
for a given gene. We selected a cut-off level of ≥60% affected
tumor cell nuclei for the detection of rearrangements in order to
avoid false-positive findings due to truncated cell nuclei in 4 μm
tissue sections. This cut-off was based on our previous studies
analyzing breakage of ERG (20) and PTEN (5,17).
Using this threshold we found a high (>95%) correlation between
ERG breakage by FISH and ERG expression be
immunohistochemistry (20),
supporting the validity of our approach to screen for recurrent
gene rearrangements.
In summary, the present study shows that a multitude
of genes can be affected by chromosomal rearrangements in prostate
cancer, but the frequency of specific rearrangements is typically
in the range of 1% or less. In most cases, these rearrangements
will result in gross deletions inactivating the affected gene. True
translocations, potentially resulting in fusion genes, are
comparatively rare.
References
|
1
|
Jemal A, Siegel R, Xu J and Ward E: Cancer
statistics, 2010. CA Cancer J Clin. 60:277–300. 2010. View Article : Google Scholar : PubMed/NCBI
|
|
2
|
Sjoblom T, Jones S, Wood LD, et al: The
consensus coding sequences of human breast and colorectal cancers.
Science. 314:268–274. 2006. View Article : Google Scholar : PubMed/NCBI
|
|
3
|
Wood LD, Parsons DW, Jones S, et al: The
genomic landscapes of human breast and colorectal cancers. Science.
318:1108–1113. 2007. View Article : Google Scholar : PubMed/NCBI
|
|
4
|
Berger MF, Lawrence MS, Demichelis F, et
al: The genomic complexity of primary human prostate cancer.
Nature. 470:214–220. 2011. View Article : Google Scholar : PubMed/NCBI
|
|
5
|
Weischenfeldt J, Simon R, Feuerbach L, et
al: Integrative genomic analyses reveal androgen-driven somatic
alteration landscape in early-onset prostate cancer. Cancer Cell.
23:159–170. 2013. View Article : Google Scholar : PubMed/NCBI
|
|
6
|
Barbieri CE, Baca SC, Lawrence MS, et al:
Exome sequencing identifies recurrent SPOP, FOXA1 and MED12
mutations in prostate cancer. Nat Genet. 44:685–689. 2012.
View Article : Google Scholar : PubMed/NCBI
|
|
7
|
Grasso CS, Wu YM, Robinson DR, et al: The
mutational landscape of lethal castration-resistant prostate
cancer. Nature. 487:239–243. 2012. View Article : Google Scholar : PubMed/NCBI
|
|
8
|
Tomlins SA, Rhodes DR, Perner S, et al:
Recurrent fusion of TMPRSS2 and ETS transcription factor genes in
prostate cancer. Science. 310:644–648. 2005. View Article : Google Scholar : PubMed/NCBI
|
|
9
|
Tomlins SA, Bjartell A, Chinnaiyan AM, et
al: ETS gene fusions in prostate cancer: from discovery to daily
clinical practice. Eur Urol. 56:275–286. 2009. View Article : Google Scholar : PubMed/NCBI
|
|
10
|
Shao L, Tekedereli I, Wang J, et al:
Highly specific targeting of the TMPRSS2/ERG fusion gene using
liposomal nanovectors. Clin Cancer Res. 18:6648–6657. 2012.
View Article : Google Scholar : PubMed/NCBI
|
|
11
|
Hudson TJ, Anderson W, Artez A, et al:
International network of cancer genome projects. Nature.
464:993–998. 2010. View Article : Google Scholar : PubMed/NCBI
|
|
12
|
Schlomm T, Chun F and Erbersdobler A: From
gene to clinic: TMA-based clinical validation of molecular markers
in prostate cancer. Methods Mol Biol. 664:177–189. 2010. View Article : Google Scholar : PubMed/NCBI
|
|
13
|
Minner S, Jessen B, Stiedenroth L, et al:
Low level HER2 overexpression is associated with rapid tumor cell
proliferation and poor prognosis in prostate cancer. Clin Cancer
Res. 16:1553–1560. 2010. View Article : Google Scholar : PubMed/NCBI
|
|
14
|
Reid AH, Attard G, Brewer D, et al: Novel,
gross chromosomal alterations involving PTEN cooperate with allelic
loss in prostate cancer. Mod Pathol. 25:902–910. 2012. View Article : Google Scholar : PubMed/NCBI
|
|
15
|
Krohn A, Seidel A, Burkhardt L, et al:
Recurrent deletion of 3p13 targets multiple tumor suppressor genes
and defines a distinct subgroup of aggressive ERG fusion positive
prostate cancers. J Pathol. 231:130–141. 2013. View Article : Google Scholar : PubMed/NCBI
|
|
16
|
Korbel JO, Urban AE, Affourtit JP, et al:
Paired-end mapping reveals extensive structural variation in the
human genome. Science. 318:420–426. 2007. View Article : Google Scholar : PubMed/NCBI
|
|
17
|
Krohn A, Diedler T, Burkhardt L, et al:
Genomic deletion of PTEN is associated with tumor progression and
early PSA recurrence in ERG fusion-positive and fusion-negative
prostate cancer. Am J Pathol. 181:401–412. 2012. View Article : Google Scholar : PubMed/NCBI
|
|
18
|
Sun J, Liu W, Adams TS, et al: DNA copy
number alterations in prostate cancers: a combined analysis of
published CGH studies. Prostate. 67:692–700. 2007. View Article : Google Scholar : PubMed/NCBI
|
|
19
|
Taylor BS, Schultz N, Hieronymus H, et al:
Integrative genomic profiling of human prostate cancer. Cancer
Cell. 18:11–22. 2010. View Article : Google Scholar : PubMed/NCBI
|
|
20
|
Minner S, Enodien M, Sirma H, et al: ERG
status is unrelated to PSA recurrence in radically operated
prostate cancer in the absence of antihormonal therapy. Clin Cancer
Res. 17:5878–5888. 2011. View Article : Google Scholar : PubMed/NCBI
|