Introduction
Epithelial ovarian cancer (EOC) is the leading cause
of gynecological cancer-related deaths worldwide because it is
generally detected at a late, incurable stage. While the serum
CA125 level is commonly used for detection of ovarian cancers, the
sensitivity and specificity of this parameter are questionable. In
clear cell carcinoma (CCC), for example, half of all cases do not
show any increase in CA125. In addition, non-cancerous diseases
such as endometriosis, adenomyosis and pelvic inflammation may also
result in elevated CA125 (1).
Despite the fact that the four histological subtypes of EOC [CCC,
endometrioid adenocarcinoma (EA), mucinous adenocarcinoma (MA),
serous adenocarcinoma (SA)] differ from each other with regard to
precursor lesion, accumulated course of genetic alterations, and
chemosensitivity, current clinical treatments for all four subtypes
are nearly the same (2,3). Relative to other subtypes, the
prognosis of CCC is poor due to a high recurrence rate and
chemotherapy resistance; nonetheless, CCC-specific biomarkers have
yet to be identified (4).
Shotgun proteomics is a method of identifying and
profiling proteins from complex mixtures using a combination of
liquid chromatography (LC) and mass spectrometry (MS) (5–13).
Recent technological developments have made it possible to extract
mixtures of peptides from formalin-fixed paraffin-embedded (FFPE)
tissues, including cancers such as EOC, for proteome analysis
(14–17). In this study, we performed global
shotgun proteome analysis on FFPE tissues derived from EOCs, and
focused on the CCC subtype in an effort to identify novel candidate
proteins for early diagnosis as well as new therapeutic
targets.
Materials and methods
Ovarian cancer tissue specimens
FFPE tissues from 96 patients with ovarian cancer
who underwent surgery at Nippon Medical School Hospital (Tokyo,
Japan) and Chiba-Hokuso Hospital of Nippon Medical School (Chiba,
Japan) between 2005 and 2012 were analyzed in this study (Table I). Subtypes included 32 cases of
CCC, 13 of EA, 19 of MA and 32 of SA. Two investigators (A. Takaya
and W-X Peng) reassessed the histological type according to the
World Health Organization (WHO) classification (2014), and
clinicopathological stage according to the 2012 International
Federation of Gynecology and Obstetrics (FIGO) staging of EOC. This
study was performed in accordance with the principles of the
Revised Declaration of Helsinki, 2013, and informed consent was
acquired from all patients for the use of specimens.
 | Table ISummary of EOC cases studied. |
Table I
Summary of EOC cases studied.
| CCC (32) | EA (13) | MA (19) | SA (32) |
|---|
| Age (range,
years) | 37–71 | 35–72 | 23–83 | 30–76 |
| Mean age at
diagnosis (years) | 54 | 52 | 59 | 55 |
| T1 | 19 | 10 | 14 | 3 |
| T2 | 5 | 1 | 0 | 2 |
| T3 | 6 | 1 | 3 | 18 |
| T4 | 2 | 1 | 2 | 9 |
| N0 | 28 | 13 | 19 | 15 |
| N1 | 4 | 0 | 0 | 17 |
| M0 | 30 | 12 | 17 | 23 |
| M1 | 2 | 1 | 2 | 9 |
| FIGO | | | | |
| I | 19 | 10 | 14 | 3 |
| II | 5 | 1 | 0 | 2 |
| III | 6 | 1 | 3 | 16 |
| IV | 2 | 1 | 2 | 11 |
| Recurrence after
treatment | | | | |
| (−) | 24 | 12 | 18 | 17 |
| (+) | 8 | 1 | 1 | 15 |
Cell lines
Human ovarian cancer cell lines (JHOC-5 and -9,
JHOM-1, JHOS-2 cells) (18,19)
were obtained from RIKEN BioResource Center (Ibaraki, Japan).
JHOC-5 (RBRC- RCB1520) and JHOC-9 (RBRC-RCB2226) was derived from
human CCC. JHOM-1 (RBRC-RCB1676) was derived from a human MA, while
JHOS-2 (RBRC-RCB1521) was derived from a human SA.
Cells were cultivated in a medium consisting of
Dulbecco’s modified Eagle’s medium (DMEM): Nutrient Mixture F-12
(HamF-12) at 1:1 (Gibco, Grand island, NY, USA) medium containing
10% heat-inactivated fetal bovine serum (FBS) and 0.1 mM MEM
non-essential amino acids (NEAA) (Gibco) at 37°C under a humidified
5% CO2 atmosphere. All lines were tested over the course
of ~3 passages.
Conditioned medium(CM) and cell lysates
from human ovarian cancer cell lines
JHOC-5 (4×10⁶ cells), JHOC-9
(4×10⁶ cells), JHOM-1 (2×10⁶ cells), and
JHOS-2 (4×10⁶ cells) were seeded into 150-cm2
flasks. After 48 h, culture medium was replaced with 30 ml
serum-free medium, and cells were cultivated for additional 24 h.
Each culture was then collected and centrifuged at 400 × g for 20
min at 4°C, and supernatants were separated and concentrated at 4°C
by centrifugation at 14,000 × g using Amicon Ultra 3K filters
(Millipore, Billerica, MA, USA). The supernatants were collected as
conditioned media, protein concentrations were measured using the
Pierce 660 nm Protein Assay kit (Thermo Fisher Scientific, Inc.,
Rockford, IL, USA), and conditioned media were stored at −80°C.
Human ovarian cancer cell lines (5×10⁵ cells/15 ml/100
mm dish) were also seeded and cultured for 72 h in 1:1 DMEM:HamF12
medium containing 10% heat-inactivated FBS. After cultivation,
cells were lysed in buffer containing 2 M thiourea (Nacalai Tesque,
Inc., Kyoto, Japan), 7 M urea (Wako Pure Chemical Industries, Ltd.,
Tokyo, Japan), 3% 3-[(3-cholamidoproryl)
dimethylammonio]-1-propanesulfonate (Dojindo, Kumamoto, Japan), and
1% Triton X-100 (Sigma-Aldrich, St. Louis, MO, USA), followed by
treatment with 10% trichloroacetic acid (TCA) for 30 min. Cell
lysates were centrifuged for 30 min at 20,400 × g at 4°C to remove
precipitated TCA (Wako Pure Chemical Industries, Ltd.) and cellular
debris, and supernatants were collected as cell extract. Protein
concentrations were measured using Pierce 660 nm Protein Assay kit
and cleared lysates were stored at −80°C (20).
Microdissection of FFPE EOC tissue
FFPE tissues originating from 36 EOC patients
consisted of 9 CCC, 8 EA, 7 MA, and 12 SA. EOC patients were used
for proteomic analysis. Ten-micrometer sections were deparaffinized
with xylene and rehydrated through a series of graded alcohols
(100, 90, 80 and 70%). After staining with Mayer’s Hematoxylin for
5 min, cancerous regions were dissected manually with the aid of a
Nikon MultiZoom AZ100M microscope (Nikon Instech Co., Ltd., Tokyo,
Japan). Some cancers with abundant desmoplastic stroma were
dissected away from stromal regions by Laser Microdissection (LMD)
using a Leica LMD6000 microscope (Leica Camera AG, Solms,
Germany).
Protein idetification by LC-MS/MS
analysis
Proteins were extracted from the FFPE tissue
sections with lysis buffer [6 M guanidine hydrochloride, 40 mM
Tris-HCl, pH 8.2, 65 mM dithiothreitol (DTT) (Wako Pure Chemical
Industries, Ltd.)] according to a previous report (12) and protein concentrations were
measured using the Bradford method. Trypsin digestion of extracted
proteins was performed as described by Bluemlein and Ralser
(21) with slight modifications.
In brief, 10 μg of extract from each specimen were first reduced in
45 mM DTT and 20 mM Tris[2-carboxyethyl]phosphine (TCEP) for 30 min
at 37°C, and then alkylated in 100 mM iodoacetamide (IAA) (both
from Wako Pure Chemical Industries, Ltd.) for 30 min at 37°C in the
dark. Following digestion with trypsin (Agilent Technologies, Inc.,
Santa Clara, CA, USA) at 37°C for 24 h, each sample was desalted
using PepClean C-18 Spin Columns (Thermo Fisher Scientific, Inc.)
according to the manufacturer’s instructions.
Samples consisting of ~2 μg purified peptides were
injected into a peptide L-trap column (Chemicals Evaluation and
Research Institute, Tokyo, Japan) using an HTS PAL Autosampler (CTC
Analytics AG, Zwingen, Switzerland) and then further separated with
Advancenano UHPLC on a reverse-phase C18 column (Zaplous column α,
3-μm diameter gel particles and 100 Å pore size, 0.1×150 mm) (both
from AMR Inc., Tokyo, Japan). The mobile phases consisted of
solution A (0.1% formic acid in water) and solution B (0.1% formic
acid in acetonitrile). The column was developed at a flow rate of
500 ml/min with a 5–35% B gradient over the course of 120 min.
Peptides were analyzed using an amaZon ETD ion trap mass
spectrometer (Bruker Daltonics, Billerica, MA, USA).
All MS/MS spectral data were compared to the
Swiss-Prot Homo sapiens database using Mascot (version 2.3.01;
Matrix Science, London, UK) to identify the proteins. The search
criteria were: trypsin enzyme, allowance of up to two missed
cleavage peptides, mass tolerance ±0.5 Da, MS/MS tolerance ±0.5 Da,
fixed modifications of cysteine carbamido-methylation, variable
modifications of methionine oxidation.
Spectral counting analysis of identified
proteins
To compare protein expression patterns among tissue
samples in the shotgun analysis, we used the spectral counting
method. The number of peptide spectra identified with high
confidence (significance, p<0.05) served as the spectral count
value. Relative amounts of identified proteins in each sample were
obtained using the normalized spectral abundance factor (NSAF)
(22), allowing for identification
of 47 candidate proteins with NSAF values >0.01.
Data processing and cluster analysis
The NSAF values of candidate proteins were clustered
hierarchically using Cluster 3.0 (23) and visualized with Java TreeView
(24).
Immunohistochemical analysis
FFPE tissue sections (3 μm) were immunostained for
cystatin B (CYTB) (EPR3931; Abcam, Tokyo, Japan) and Annexin A4
(ANXA4) (HPA007393; Atlas Copco, Stockholm, Sweden) using the
Histofine Simple Stain MAX-PO (R) kit (Nichirei Corp., Tokyo,
Japan). Sections were pre-treated in an autoclave at 121°C for 15
min in 10 mM citrate buffer (pH 6.0 for CYTB and pH 9.0 for ANXA4)
for retrieval of the antigen. After blocking endogenous peroxidase
activity with 0.3% H2O2 in methanol,
anti-CYTB antibody (1:300 in dilution) or anti-ANXA4 antibody
(1:300 in dilution) was applied, and the slides were incubated for
16 h at 4°C. Bound antibodies were detected using Histofine Simple
Stain MAX-PO (R) or (M) reagents (Nichirei Corp.). Mayer’s
Hematoxylin was used for counterstaining.
Two investigators (Takaya A. and Peng W-X) conducted
blind evaluations of each section. Sections with tumor cells were
scored on staining intensity (0, no stain; 1, weak; 2, moderate; 3,
strong) and estimated percentage of tumor cells (0, 0–5%; 1, 6–30%;
2, 31–60%; 3, 61–100%). IHC scores were the sum of intensity and
percentage scores; cases with IHC>5 formed the high expression
group, and all others the low expression group.
RT-qPCR analysis
Total RNA was extracted from each FFPE EOC tissue
sample using the RNeasy FFPE kit (Qiagen, Valencia, CA, USA), and
from JHOC-5 and -9, JHOM-1, JHOS-2 cells using the NucleoSpin RNA
kit (U0955B; Takara Bio, Inc., Osaka, Japan) according to
manufacturer’s instructions. cDNAs were synthesized using a
SuperScript VILO cDNA Synthesis kit (11754-050; Invitrogen Life
Technologies, Carlsbad, CA, USA). Expression levels of CYTB or
ANXA4 mRNAs were estimated from quantitative reverse transcription
PCR (RT-qPCR) reactions with target and control cDNAs using the
TaqMan Universal PCR Master Mix, no AmpErase® UNG
(4324018) (Applied Biosystems, Alameda, CA, USA), and primers and
TaqMan probes for CYTB (Hs00164368_s1) and ANXA4 (Hs00984874_s1)
and 18S rRNA (Hs03928990_g1) (Applied Biosystems). The optimized
program involved denaturation at 95°C for 10 min, followed by 45
cycles of amplification at 95°C for 15 sec and 60°C for 1 min.
RT-qPCR results are expressed as an internal standard concentration
ratio, target/18S rRNA, and analyzed using the ΔΔCt method. mRNA
expression was measured in triplicate (25–27).
Western blot analysis
Equivalent protein samples were resolved using 6 or
13% sodium dodecyl sulfate-polyacrylamide gel electrophoresis
(SDS-PAGE), and proteins were then transferred electrophoretically
onto polyvinylidene fluoride (PVDF) membrane (Millipore, Tokyo,
Japan). After blocking with 5% skim milk in Tris-buffered saline
consisting of 0.2 M Tris-HCl, 150 mM NaCl, and 0.05% Tween-20
(TBS-T) for 1 h at room temperature, membranes were incubated with
anti-CYTB antibody (dilution, 1:1,000), anti-ANXA4 antibody
(dilution, 1:200), or anti-β-actin antibody (dilution, 1:10,000)
for 2 h at room temperature. After a 30-min wash in TBS, blots were
incubated with HRP-conjugated anti-rabbit IgG antibody (dilution,
1:8,000) or HRP-conjugated anti-mouse IgG antibody (dilution,
1:8,000) for 1 h at room temperature. Immunoreactive products were
visualized using SuperSignal West Dura Chemiluminescence Substrate
(Thermo Fisher Scientific, Inc.) and quantified using Chemi Doc XRS
System and Quantity One Software (Bio-Rad Laboratories, Inc.,
Tokyo, Japan). Three independent blots of each tissue sample were
evaluated.
Statistical analysis
The data are shown as mean ± SEM. Two groups of CCC
and non-CCC were compared using Mann-Whitney U test or Fisher’s
test. Significant differences in expression levels between EOC
subtypes were assessed using one-way ANOVA Tukey’s multiple
comparisons. All statistical analyses were performed using GraphPad
Prism version 5 (Graphpad Software, Inc., La Jolla, CA, USA), with
p<0.05 considered significant in each analysis.
Results
Protein identification and comparison of
expression levels between CCC and other EOC subtypes
Shotgun proteome analysis of the four EOC subtypes
identified 399 different proteins in the FFPE tissues, of which 197
were found in CCC, 179 in EA, 141 in MA, and 178 in SA,
respectively. Among the 399 proteins, 67 were common to all EOCs.
Unique to one subtype were 60 proteins from CCC, 62 from EA, 35
from MA, and 36 from SA.
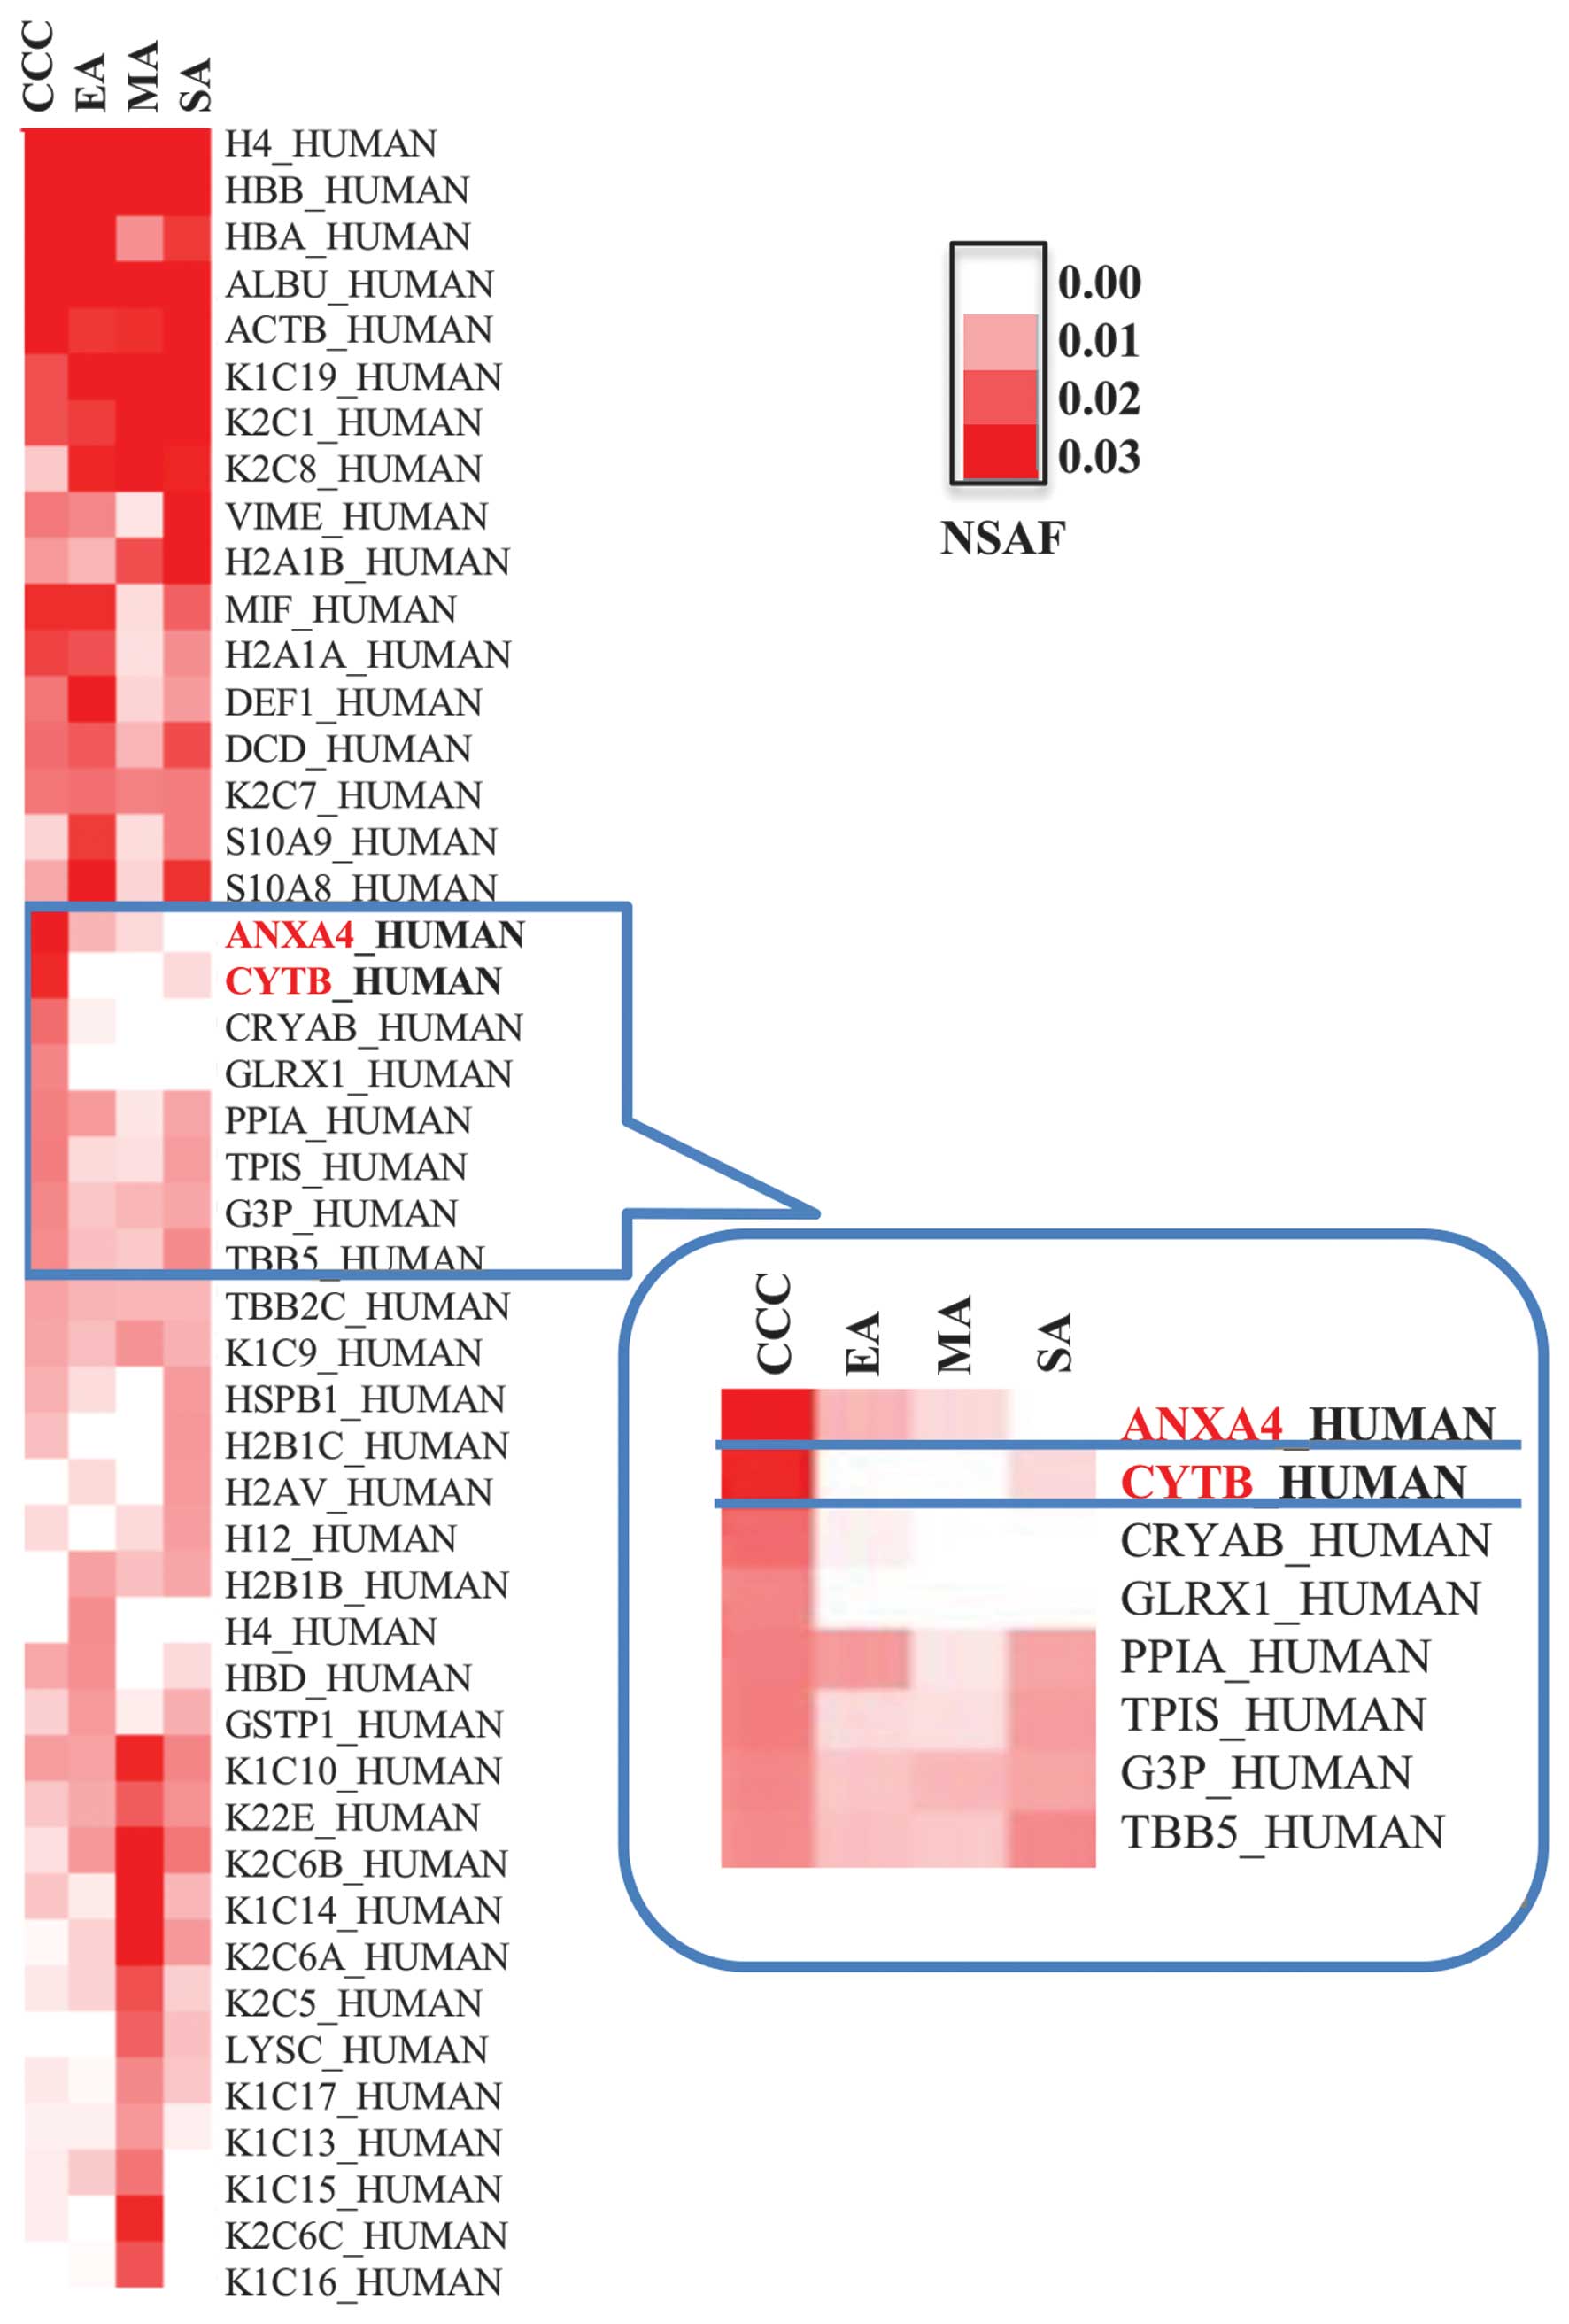
To identify CCC-specific biomarker candidates, we
carried out cluster analyses using proteomic results and visualized
results with a heat map. Hierarchical clustering revealed a clear
distinction in the expression of CYTB and ANXA4 in CCC relative to
other EOC subtypes (Fig. 1),
leading us to focus on CYTB and ANXA4 as potential diagnostic
markers of CCC.
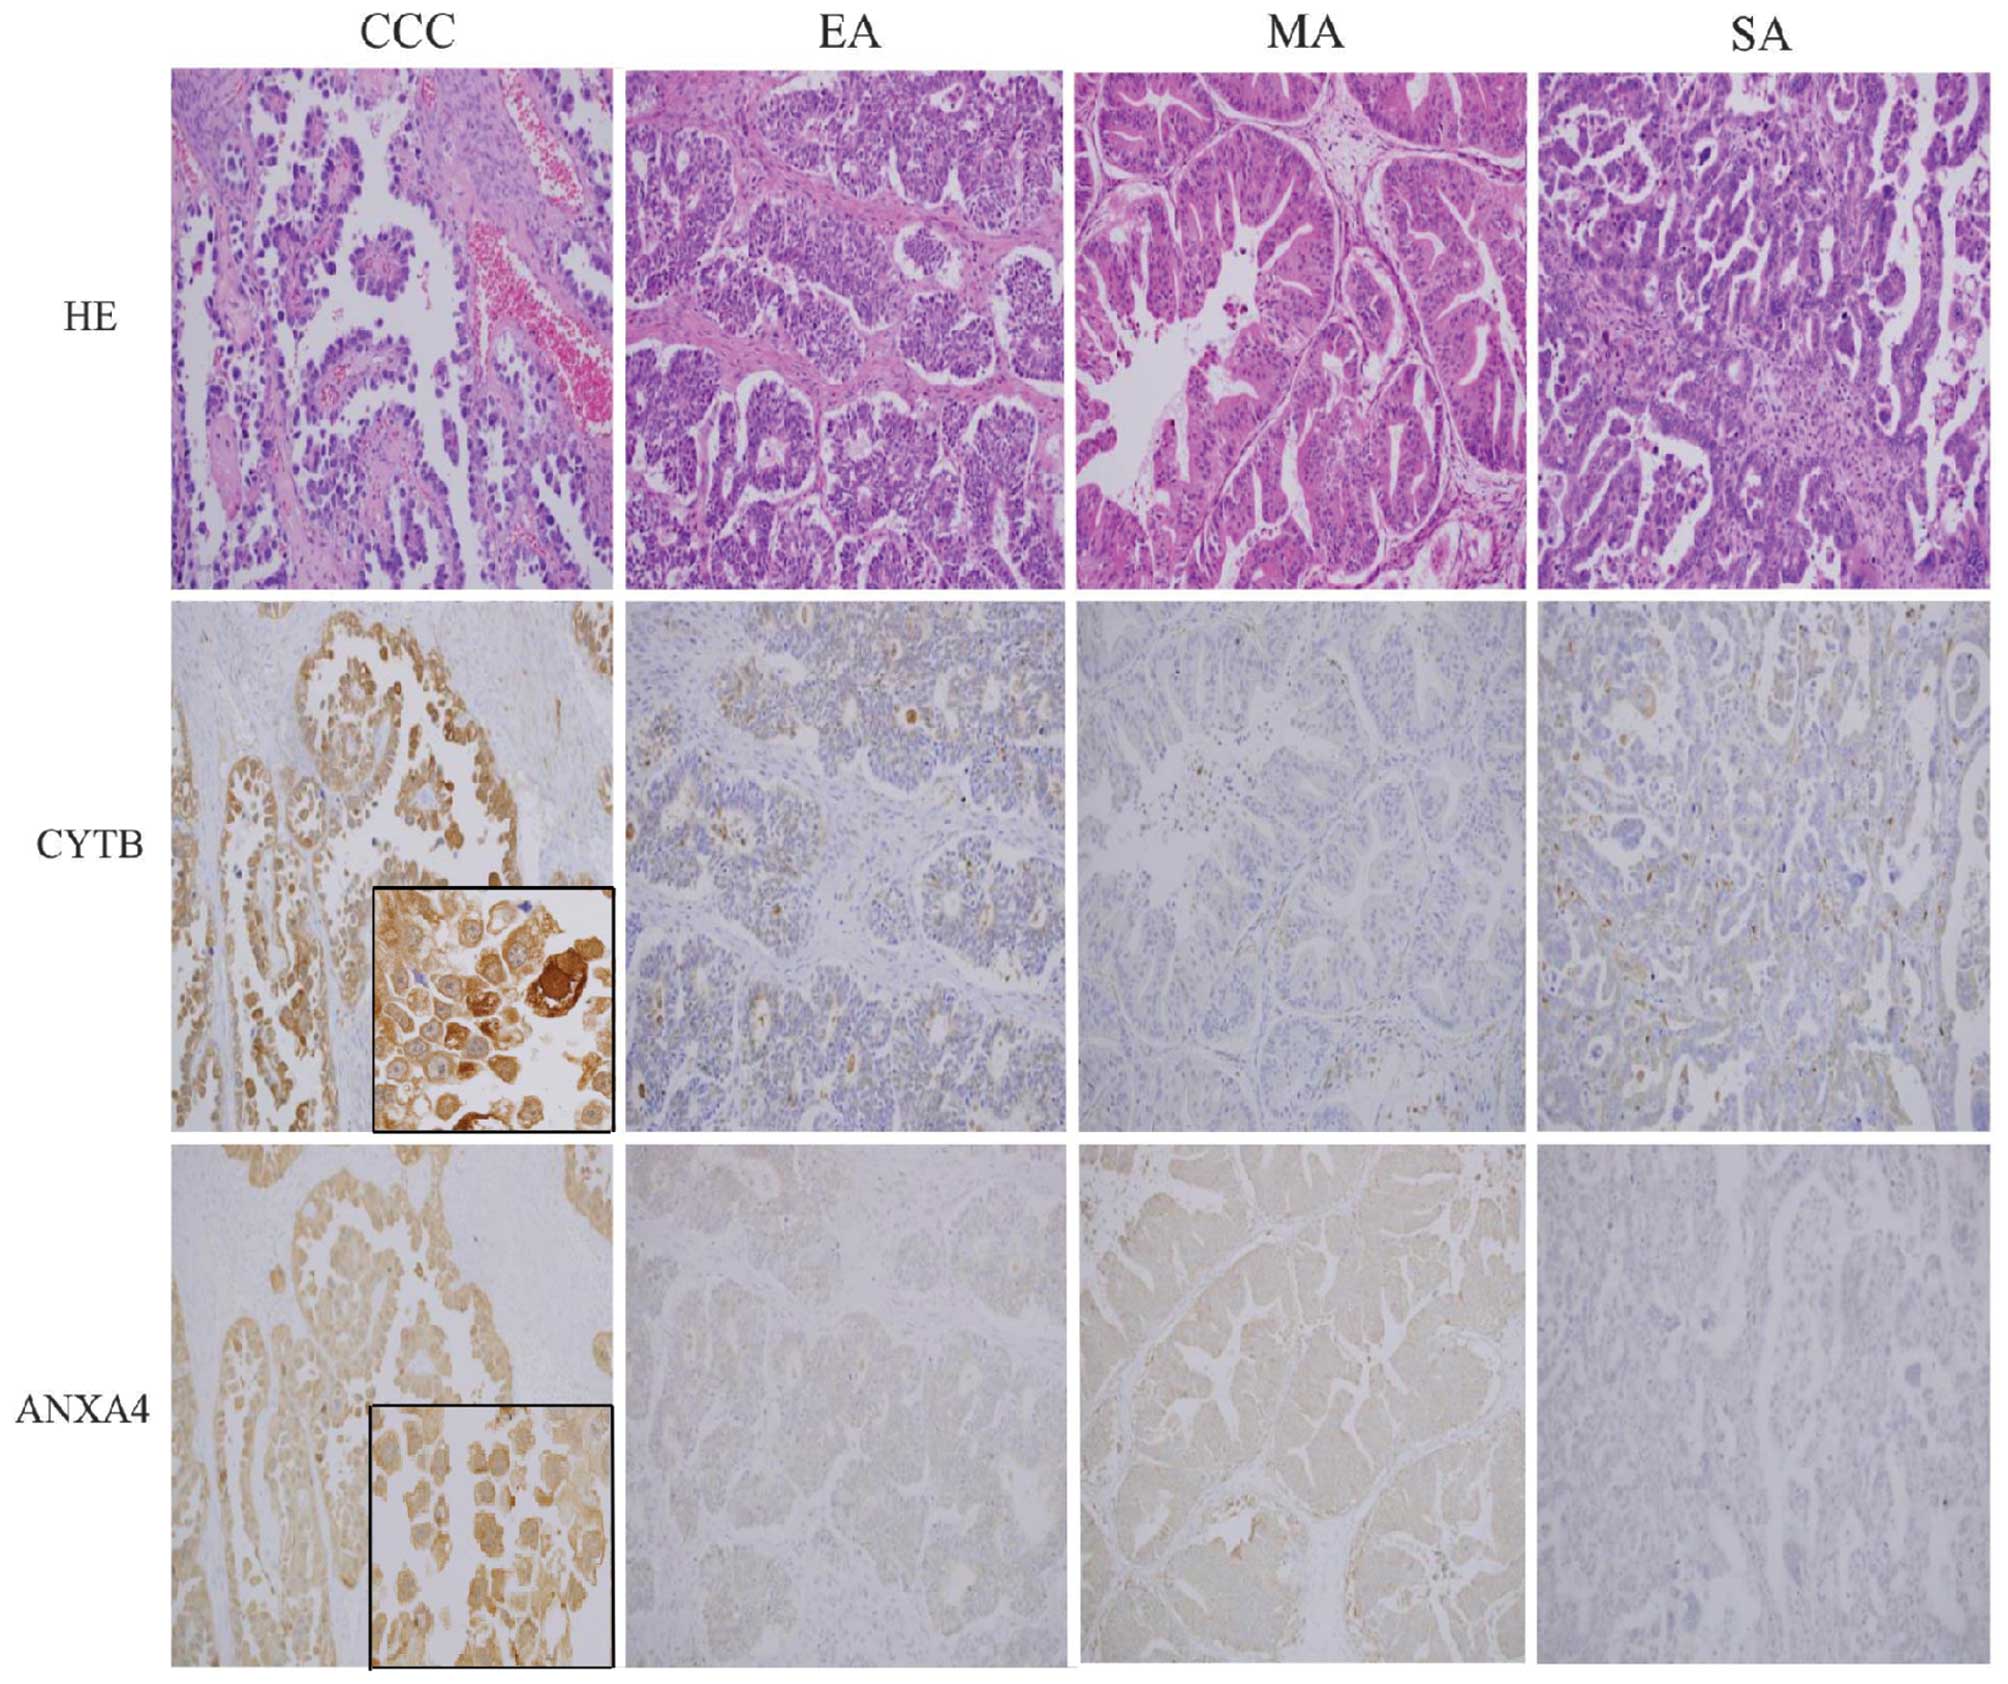
IHC analysis of CYTB and ANXA4
Spectral measurements of CYTB and ANXA4 expression
levels were confirmed by immunohistochemical analysis of FFPE from
CCC, EA, MA and SA cases (n=32, 13, 19 and 32, respectively). CCC
cell sections showed strong CYTB and ANXA4 expression in the cell
membranes, cytoplasm and nucleus (Fig.
2); in contrast, normal epithelial cells are only weak or
negative for cytoplasmic staining of CYTB and ANXA4. High
expression of CYTB was observed in 50% of CCC, which was
significantly more than that in EA (31%), MA (11%) or SA (13%)
subtypes (p<0.001; Fisher’s test) (Table II). Among the 16 CCC cases that
showed strong CYTB expression, 11 cases were in early stage (FIGO
stage I and II) and five cases were in late stage (FIGO stage III
and IV). There were also significantly more cases of high ANXA4
expression in the CCC subtype (94%) relative to EA (16%), MA (53%),
or SA (10%) (p<0.001; Fisher’s test). With regard to stage, 100%
of late stage cases and 91% of cases of early stage CCC showed high
ANXA4 expression.
| Table IIImmunodetection of CYTB and ANXA4 in
four EOC subtypes. |
Table II
Immunodetection of CYTB and ANXA4 in
four EOC subtypes.
| Protein
expression | CCC (32) | EA (13) | MA (19) | SA (32) | P-valuea |
|---|
| CYTB | High (score
5–6) | 16 (50%) | 4 (31%) | 2 (11%) | 4 (13%) | <0.001 |
| Low (score
0–4) | 16 (50%) | 9 (69%) | 17 (89%) | 28 (87%) | |
| ANXA4 | High (score
5–6) | 30 (94%) | 2 (16%) | 10 (53%) | 3 (10%) | <0.001 |
| Low (score
0–4) | 2 (6%) | 11 (84%) | 9 (47%) | 29 (90%) | |
RT-qPCR analysis in FFPE tissues and EOC
cell lines
Following manual or LMD dissection of EOC regions,
we performed RT-qPCR analysis of isolated tissues with CYTB, ANXA4,
and 18S mRNA specific primers. In EOC FFPE tissues, normalized
expression level of CYTB mRNA (Fig.
3A) was significantly higher in CCC than in non-CCC subtypes
(p<0.0001, Mann-Whitney U test). Between individual subtypes,
CYTB mRNA expression in CCC was significantly higher than that in
MA or SA (p<0.05, Tukey’s test). The significant difference was
not found in CYTB mRNA expression level between CCC and EA. ANXA4
mRNA (Fig. 3B) expression level
among EOC FFPE tissues was significantly higher in CCC than in
non-CCC subtypes (p<0.0001, Mann-Whitney U test), and the level
of ANXA4 was also higher in CCC than in any one of the other
subtypes alone (p<0.05, Tukey’s test). Moreover, among EOC cell
lines, the expression levels of CYTB (Fig. 3C) and ANXA4 (Fig. 3D) mRNAs in JHOC-5 and -9 were
significantly higher than those in each of JHOM-1 and JHOS-2
(p<0.05, Tukey’s test). CCC cell lines showed significantly
higher levels of CYTB and ANXA4 than that of non-CCC cell lines
(p<0.05, Mann-Whitney U test).
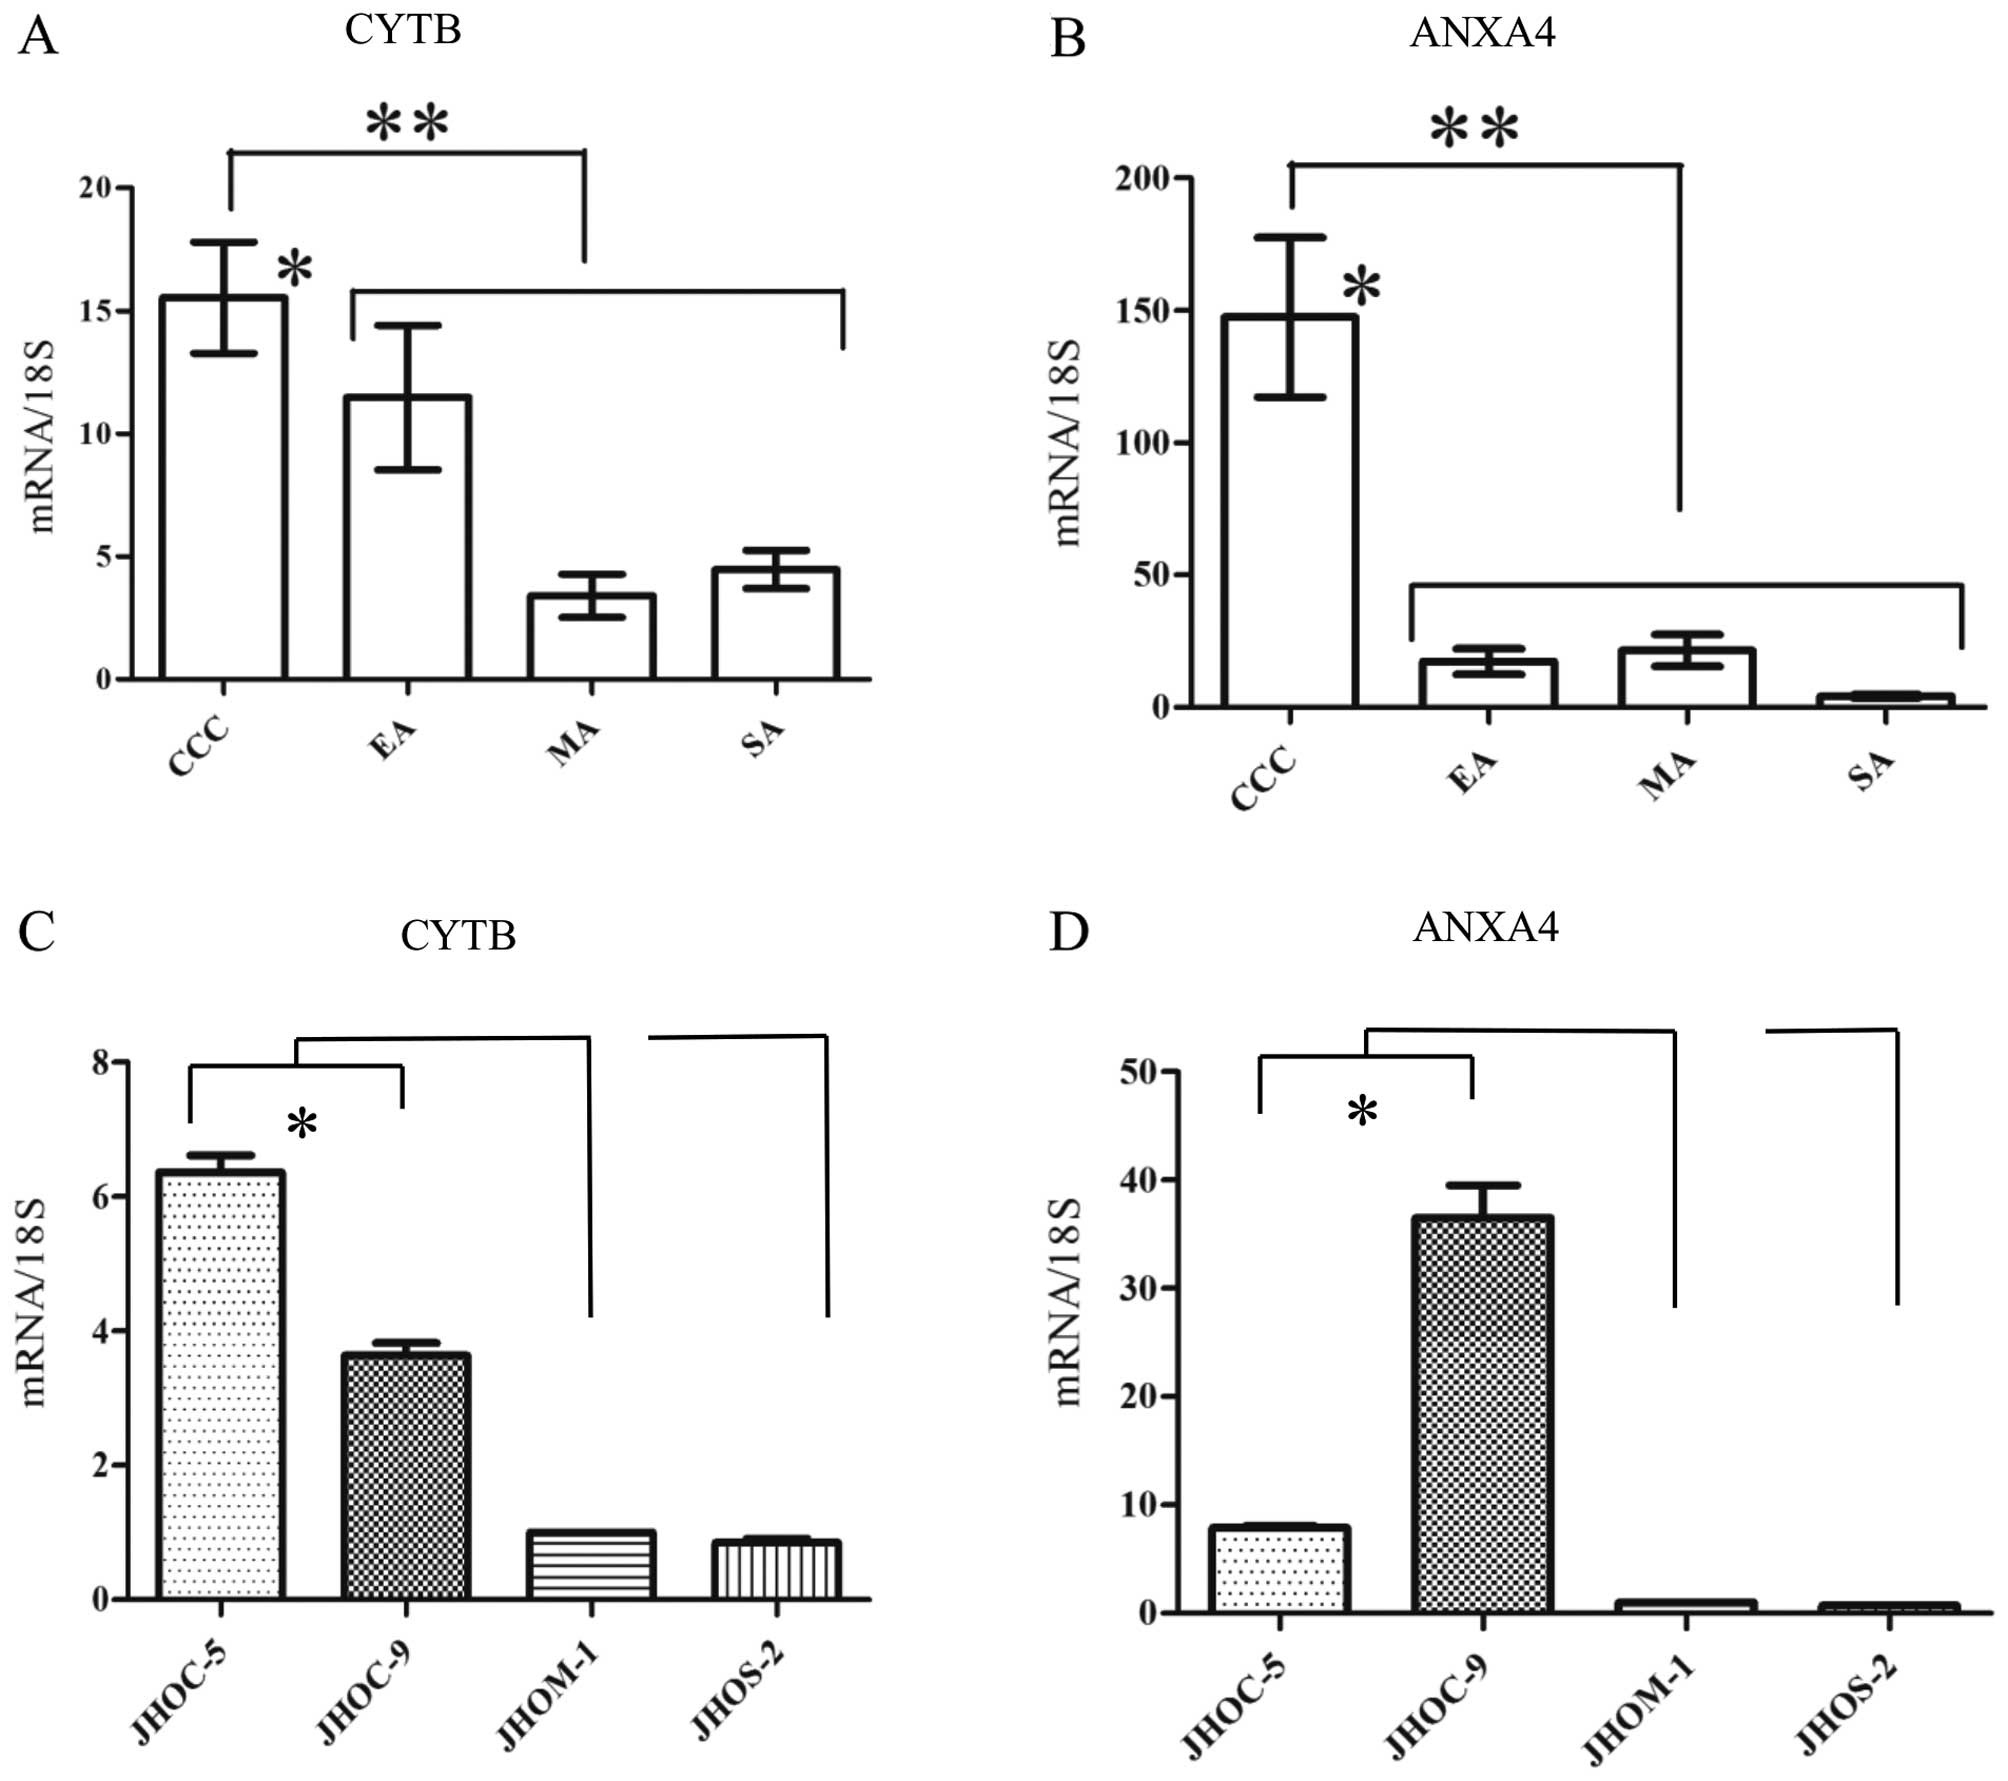 | Figure 3Quantitative reverse transcription PCR
(RT-qPCR) of cystatin B (CYTB) and Annexin A4 (ANXA4). Expression
levels (y-axis) are depicted as the ratio of expression of CYTB or
ANXA4 mRNAs relative to ribosomal 18S mRNAs as measured using
quantitative PCR. (A) In epithelial ovarian cancer (EOC)
formalin-fixed paraffin-embedded (FFPE) tissues, expression of CYTB
mRNA was significantly higher in clear cell carcinoma (CCC) than in
non-CCC subtypes (**p<0.0001, Mann-Whitney U test).
Between individual subtypes, CYTB mRNA expression in CCC was
significantly higher than that in mucinous adenocarcinoma (MA) or
serous adenocarcinoma (SA) (*p<0.05, Tukey’s test).
(B) In EOC FFPE tissues, ANXA4 mRNA expression level was
significantly higher in CCC than in non-CCC subtypes
(**p<0.0001, Mann-Whitney U test), and the level of
ANXA4 was also higher in CCC than in any one of the other subtypes
alone (*p<0.05, Tukey’s test). In EOC cell lines, the
expression levels of (C) CYTB and (D) ANXA4 mRNAs were
significantly higher in JHOC-5 and -9 than in each of JHOM-1 and
JHOS-2 (*p<0.05, Tukey’s test). All data are shown as
mean ± SEM. |
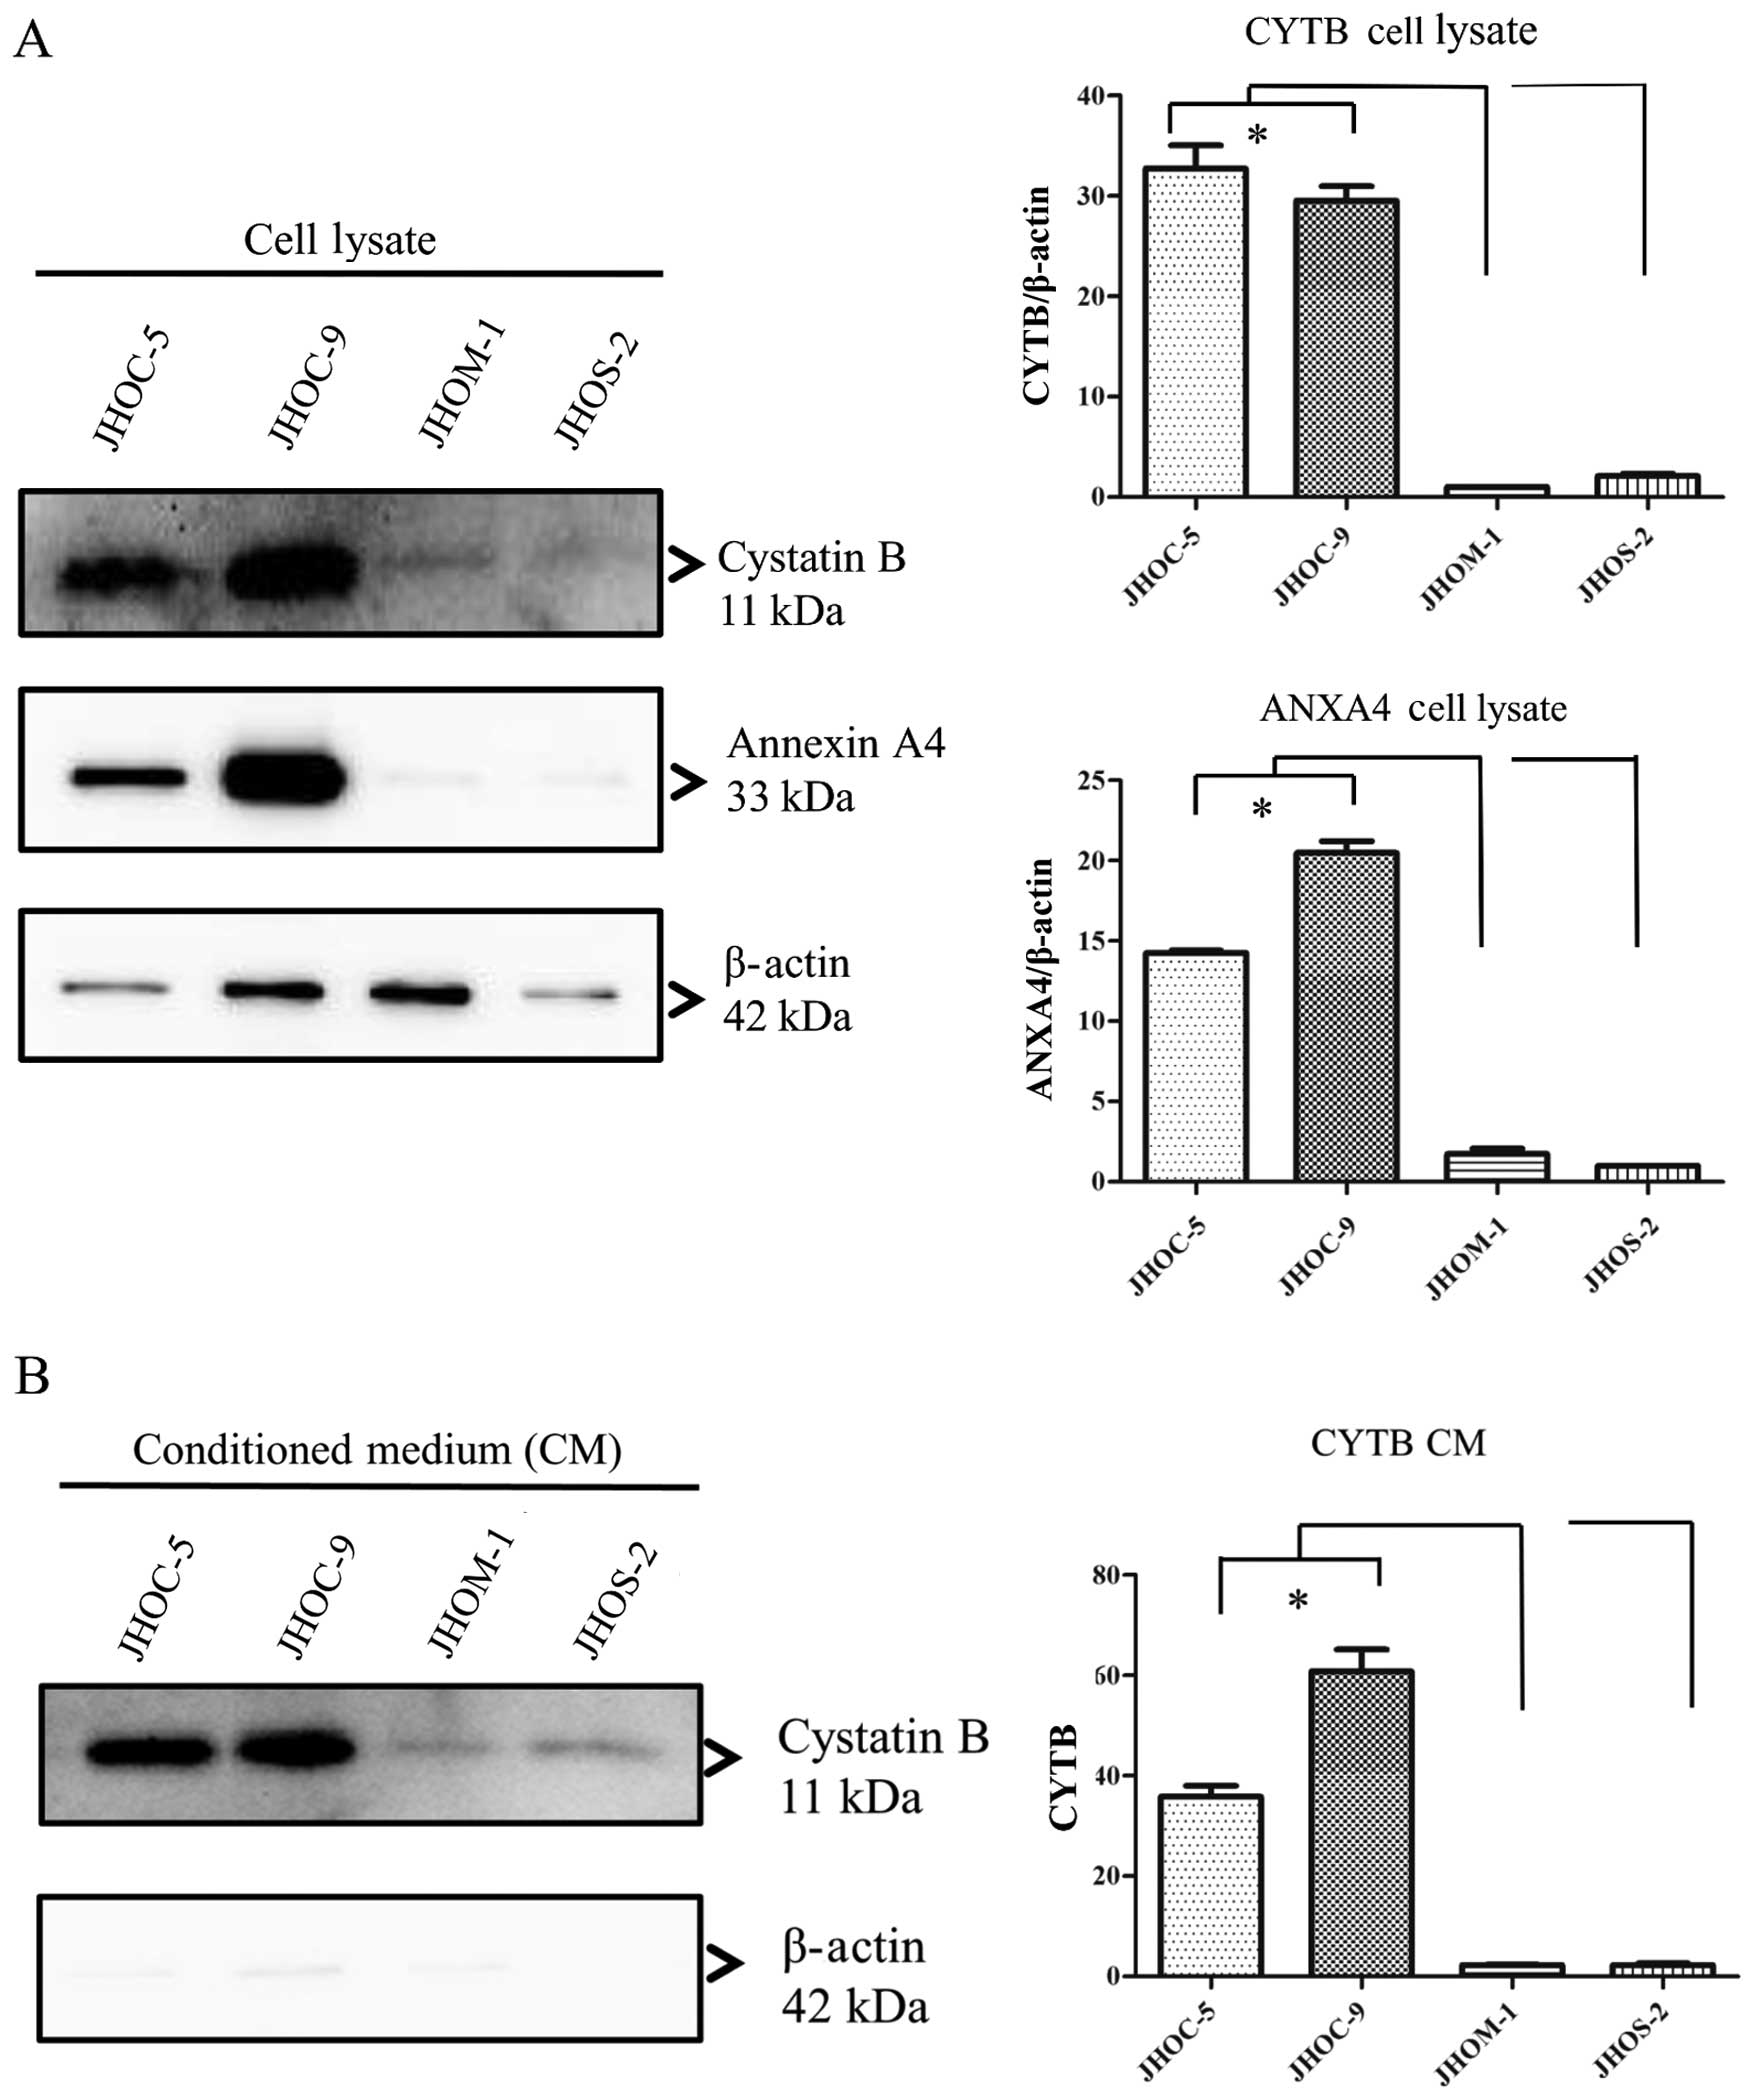
CYTB and ANXA4 levels in CM and cell
lysate of EOC cell lines
It is known that CYTB is a secretory protein and is
released into the circulation in patients with various cancer
patients, including bladder cancer (28) and hepatocellular carcinoma
(29). To determine the secretion
from cells to culture medium, we confirmed the presence of CYTB and
ANXA4 in the cell lysate (Fig. 4A)
and CM (Fig. 4B) collected from
EOC cell lines. In western blot analysis relative amounts of
immunoreactive proteins were measured against a β-actin standard.
CYTB protein levels in both conditioned media and cell lysates were
significantly higher in JHOC-5 and -9 cell lines than that in each
of JHOM-1 and JHOS-2 cell lines (p<0.05, Tukey’s test). In
addition, upon comparing CYTB protein level in both conditioned
media and cell lysates between CCC and non-CCC cell lines, we found
that CCC cell lines showed significantly higher level than non-CCC
cell lines (p<0.05, Mann-Whitney U test). ANXA4 protein level in
cell lysate in JHOC-5 and -9 cell lines was higher than that in
each of JHOM-1 and JHOS-2 cell lines (p<0.05, Tukey’s test).
However, no ANXA4 protein was observed in CM of JHOC-5, JHOM-1 and
JHOS-2 cell lines.
Discussion
CYTB is a member of the cystatin superfamily, which
consists of endogenous inhibitors of lysosomal cysteine proteinases
involved in the degradation of connective tissue and basement
membrane proteins. Aberrant control of stromal degradation may
contribute to the increased tissue proteolysis that allows cancer
cells to spread during neoplastic transformation or tumor
progression (28,30,31).
When compared to matched normal and benign tissue counterparts,
colon, lung and gastric tumor tissues display an imbalance in
cystatin expression levels (32).
In this study, proteome analysis followed by hierarchical
clustering analysis, revealed higher expression of CYTB and ANXA4
in CCC compared with other subtypes. These results were confirmed
by the subsequent validating studies using IHC, RT-qPCR and western
blot analyses. Moreover, cases in the early stage of CCC also
demonstated high expression of CYTB and ANXA4. These results
suggest that CYTB and ANXA4 overexpression may be related to
carcinogenesis and histopathological differentiation of CCC,
repressing CYTB expression may be effective against CCC progression
and CYTB may be a potential treatment target for CCC.
One previous study reported CYTB as a serum marker
equivalent to α-fetoprotein for diagnosis of hepatocellular
carcinoma (29). In transitional
cell carcinoma, the CYTB level in urine has been reported to
correlate positively with tumor grade, stage, and shorter time to
disease recurrence and progression (28). The serum CYTB level has also been
reported to be higher in patients with ovarian cancer relative to
benign ovarian tumor, including high CYTB in ascites fluid
(33). To examine the possibility
of CYTB as serum diagnostic or treatment biomarker of CCC, we
checked the protein level in conditioned media and cell lysates
using culture cells. Compared with other subtypes, CCC cell lines
showed a significantly higher level of expression of CYTB in both
conditioned media and cell lysates. Our results demonstrate that
CYTB may be a secreted protein, and CYTB may serve as a potential
serum diagnostic or treatment biomarker of CCC. On the other hand,
a CCC cell line showed higher expression of ANXA4 protein in cell
lysate only compared to non-CCC cell lines. This result suggests
that ANXA4 may not be a secreted protein, and it may be useful as
an intracellular marker.
ANXA4 is a member of the calcium-dependent
phospholipid-binding protein family. Our study of ANXA4 expression
in FFPE tissues derived from CCC cases agrees with prior reports of
high expression in CCC tumors (34–36).
These results suggest that ANXA4 may play an important role in CCC
carcinogenesis, and also demonstrate that FFPE specimens are
appropriate and reliable tissues for proteome analysis. ANXA4 has
been shown to play a role in membrane permeability and is involved
in modulating drug resistance in cancer cells (36), exo- and endocytosis, as well as
fibrinolysis. Like HNF-1β, the expression pattern of ANXA4 renders
it a molecular signature for cancer pathophysiology (37,38).
ANXA4 overexpression is associated with the cell proliferation,
chemoresistance, and progression of various carcinomas including
ovarian CCC, colorectal carcinoma, gastric cancer and renal
carcinoma (39–41). Studies of ANXA4 knock-down cells
document significant growth retardation, loss of migration, and
greater sensitivity to carboplatin, suggesting that ANXA4 may be
involved in CCC chemoresistance (35,36).
Our present study may suggest that ANXA4 overexpression may be used
for predicting the chemoresistance cases of EOC including CCC.
Further studies will be needed to clarify the mechanism between
ANXA4 protein expression and the EOC chemoresistance.
In summary, this study provides further evidence
supporting the use of CYTB and ANXA4 as diagnostic markers for CCC,
as well as for investigation of new clinical therapies that
modulate these proteins in order to suppress tumor progression or
surmount chemoresistance. The proteomic profiling of four different
subtypes of EOC shown here suggests a method for correlating
biological targets of disease more directly to histopathological
classifications, and may contribute to more individualized
treatments for EOC patients in the future.
Acknowledgements
We would like to thank Mr. Takenori Fujii, Mr.
Kiyoshi Teduka, Ms. Yoko Kawamoto, Ms. Kiyoko Kawahara as well as
Ms. Taeko Suzuki for technical assistance (Department of Integrated
Diagnostic Pathology, Nippon Medical School, Tokyo, Japan). This
study was supported in part by Grants-in-aid for Clinical Rebiopsy
Bank Project for Comprehensive Cancer Therapy Development to Z.N.
from Ministry of Education, Culture, Sport, Science, and Technology
(Tokyo, Japan) (MEXT), 2013–2017 (S1311022).
Abbreviations:
|
EOC
|
epithelial ovarian cancer
|
|
CCC
|
clear cell carcinoma
|
|
EA
|
endometrioid adenocarcinoma
|
|
MA
|
mucinous adenocarcinoma
|
|
SA
|
serous adenocarcinoma
|
|
CYTB
|
cystatin B
|
|
ANXA4
|
Annexin A4
|
|
FFPE
|
formalin-fixed paraffin-embedded
|
|
IHC
|
immunohistochemistry
|
References
|
1
|
du Bois A, Lück HJ, Meier W, et al: A
randomized clinical trial of cisplatin/paclitaxel versus
carboplatin/paclitaxel as first-line treatment of ovarian cancer. J
Natl Cancer Inst. 95:1320–1329. 2003. View Article : Google Scholar : PubMed/NCBI
|
|
2
|
Kitawaki J, Ishihara H, Koshiba H, et al:
Usefulness and limits of CA-125 in diagnosis of endometriosis
without associated ovarian endomeriomas. Hum Reprod. 20:1999–2003.
2005. View Article : Google Scholar : PubMed/NCBI
|
|
3
|
Ozols RF, Bundy BN, Greer BE, et al: Phase
III trial of carboplatin and paclitaxel compared with cisplatin and
paclitaxel in patients with optimally resected stage III ovarian
cancer: A Gynecologic Oncology Group study. J Clin Oncol.
21:3194–3200. 2003. View Article : Google Scholar : PubMed/NCBI
|
|
4
|
Uekuri C, Shigetomi H, Ono S, Sasaki Y,
Matsuura M and Kobayashi H: Toward an understanding of the
pathophysiology of clear cell carcinoma of the ovary (Review).
Oncol Lett. 6:1163–1173. 2013.PubMed/NCBI
|
|
5
|
Old WM, Meyer-Arendt K, Aveline-Wolf L, et
al: Comparison of label-free methods for quantifying human proteins
by shotgun proteomics. Molecular & cellular proteomics. Mol
Cell Proteomics. 4:1487–1502. 2005. View Article : Google Scholar : PubMed/NCBI
|
|
6
|
Toyama A, Suzuki A, Shimada T, et al:
Proteomic characterization of ovarian cancers identifying
annexin-A4, phosphoserine amino-transferase, cellular retinoic
acid-binding protein 2, and serpin B5 as histology-specific
biomarkers. Cancer Sci. 103:747–755. 2012. View Article : Google Scholar : PubMed/NCBI
|
|
7
|
Yamamoto T, Kudo M, Peng WX and Naito Z:
Analysis of protein expression regulated by lumican in PANC-1 cells
using shotgun proteomics. Oncol Rep. 30:1609–1621. 2013.PubMed/NCBI
|
|
8
|
Wang JJ, Liu Y, Zheng Y, Lin F, Cai GF and
Yao XQ: Comparative proteomics analysis of colorectal cancer. Asian
Pac J Cancer Prev. 13:1663–1666. 2012. View Article : Google Scholar : PubMed/NCBI
|
|
9
|
Zhu Y, Wu R, Sangha N, et al:
Classifications of ovarian cancer tissues by proteomic patterns.
Proteomics. 6:5846–5856. 2006. View Article : Google Scholar : PubMed/NCBI
|
|
10
|
Morgan TM, Seeley EH, Fadare O, Caprioli
RM and Clark PE: Imaging the clear cell renal cell carcinoma
proteome. J Urol. 189:1097–1103. 2013. View Article : Google Scholar :
|
|
11
|
Tan Y, Ma SY, Wang FQ, et al:
Proteomic-based analysis for identification of potential serum
biomarkers in gallbladder cancer. Oncol Rep. 26:853–859.
2011.PubMed/NCBI
|
|
12
|
Jiang X, Jiang X, Feng S, Tian R, Ye M and
Zou H: Development of efficient protein extraction methods for
shotgun proteome analysis of formalin-fixed tissues. J Proteome
Res. 6:1038–1047. 2007. View Article : Google Scholar : PubMed/NCBI
|
|
13
|
Sprung RW Jr, Brock JW, Tanksley JP, et
al: Equivalence of protein inventories obtained from formalin-fixed
paraffin-embedded and frozen tissue in multidimensional liquid
chromatography-tandem mass spectrometry shotgun proteomic analysis.
Mol Cell Proteomics. 8:1988–1998. 2009. View Article : Google Scholar : PubMed/NCBI
|
|
14
|
Kawamura T, Nomura M, Tojo H, et al:
Proteomic analysis of laser-microdissected paraffin-embedded
tissues: (1) stage-related protein candidates upon non-metastatic
lung adenocarcinoma. J Proteomics. 73:1089–1099. 2010. View Article : Google Scholar
|
|
15
|
Bateman NW, Sun M, Bhargava R, et al:
Diffetential proteomic analysis of late-stage and recurrent breast
cancer from formalin-fixed paraffin-embedded tissues. J Proteome
Res. 10:1323–1332. 2011. View Article : Google Scholar
|
|
16
|
Naidoo K, Jones R, Dmitrovic B, et al:
Proteome of formalin-fixed paraffin-embedded pancreatic ductal
adenocarcinoma and lymph node metastases. J Pathol. 226:756–763.
2012. View Article : Google Scholar
|
|
17
|
Rodriguez-Rigueiro T, Valladares-Ayerbes
M, Haz-Conde M, et al: A novel procedure for protein extraction
from formalin-fixed paraffin-embedded tissues. Proteomics.
11:2555–2559. 2011. View Article : Google Scholar : PubMed/NCBI
|
|
18
|
Yamada K, Tachibana T, Hashimoto H, et al:
Establishment and characterization of cell lines derived from
serous adenocarcinoma (JHOS-2) and clear cell adenocarcinoma
(JHOC-5, JHOC-6) of human ovary. Hum Cell. 12:131–138. 1999.
|
|
19
|
Hayashi M, Okuda T, Chiba H, Nagatsuka M
and Okai T: The analysis of toll-like receptor signal pathway in
human ovarian cancer cells. J Showa Med Assoc. 70:211–221.
2010.
|
|
20
|
Yamamoto T, Matsuda Y, Kawahara K, Naito Z
and Ishiwata T: Keratinocyte growth factor stimulates growth of MIA
PaCa-2 cells through extracellular signal-regulated kinase
phosphorylation. Oncol Lett. 3:307–310. 2012.PubMed/NCBI
|
|
21
|
Bluemlein K and Ralser M: Monitoring
protein expression in whole-cell extracts by targeted label- and
standard-free LC-MS/MS. Nat Protoc. 6:859–869. 2011. View Article : Google Scholar : PubMed/NCBI
|
|
22
|
Zybailov B, Coleman MK, Florens L and
Washburn MP: Correlation of relative abundance ratios derived from
peptide ion chromatograms and spectrum counting for quantitative
proteomic analysis using stable isotope labeling. Anal Chem.
77:6218–6224. 2005. View Article : Google Scholar : PubMed/NCBI
|
|
23
|
de Hoon MJ, Imoto S, Nolan J and Miyano S:
Open source clustering software. Bioinformatics. 20:1453–1454.
2004. View Article : Google Scholar : PubMed/NCBI
|
|
24
|
Saldanha AJ: Java Treeview - extensible
visualization of microarray data. Bioinformatics. 20:3246–3248.
2004. View Article : Google Scholar : PubMed/NCBI
|
|
25
|
Cotoi CG, Khorsandi SE, Pleşea IE and
Quaglia A: Whole- genome DASL gene expression profiling of
hepatocellular carcinoma sub-populations isolated by laser
microdissection on formalin-fixed and paraffin-embedded liver
tissue samples. Rom J Morphol Embryol. 53:893–902. 2012.
|
|
26
|
Kotorashvili A, Ramnauth A, Liu C, et al:
Effective DNA/RNA co-extraction for analysis of microRNAs, mRNAs,
and genomic DNA from formalin-fixed paraffin-embedded specimens.
PLoS One. 7:e346832012. View Article : Google Scholar : PubMed/NCBI
|
|
27
|
Nakanishi Y, Shimizu T, Tsujino I, et al:
Semi-nested real-time reverse transcription polymerase chain
reaction methods for the successful quantitation of cytokeratin
mRNA expression levels for the subtyping of non-small-cell lung
carcinoma using paraffin-embedded and microdissected lung biopsy
specimens. Acta Histochem Cytochem. 46:85–96. 2013. View Article : Google Scholar : PubMed/NCBI
|
|
28
|
Feldman AS, Banyard J, Wu CL, McDougal WS
and Zetter BR: Cystatin B as a tissue and urinary biomarker of
bladder cancer recurrence and disease progression. Clin Cancer Res.
15:1024–1031. 2009. View Article : Google Scholar : PubMed/NCBI
|
|
29
|
Lee M-J, Yu G-R, Park S-H, et al:
Identification of cystatin B as a potential serum marker in
hepatocellular carcinoma. Clin Cancer Res. 14:1080–1089. 2008.
View Article : Google Scholar : PubMed/NCBI
|
|
30
|
Rivenbark AG and Coleman WB: Epigenetic
regulation of cystatins in cancer. Front Biosci (Landmark Ed).
14:453–462. 2009. View
Article : Google Scholar
|
|
31
|
Keppler D: Towards novel anti-cancer
strategies based on cystatin function. Cancer Lett. 235:159–176.
2006. View Article : Google Scholar
|
|
32
|
Kos J and Lah TT: Cysteine proteinases and
their endogenous inhibitors: Target proteins for prognosis,
diagnosis and therapy in cancer (Review). Oncol Rep. 5:1349–1361.
1998.PubMed/NCBI
|
|
33
|
Gashenko EA, Lebedeva VA, Brak IV,
Tsykalenko EA, Vinokurova GV and Korolenko TA: Evaluation of serum
procathepsin B, cystatin B and cystatin C as possible biomarkers of
ovarian cancer. Int J Circumpolar Health. 72:212152013. View Article : Google Scholar
|
|
34
|
Masuishi Y, Arakawa N, Kawasaki H, Miyagi
E, Hirahata F and Hirano H: Wild-type p53 enhances annexin IV gene
expression in ovarian clear cell adenocarcinoma. FEBS J.
278:1470–1483. 2011. View Article : Google Scholar : PubMed/NCBI
|
|
35
|
Kim A, Enomoto T, Serada S, et al:
Enhanced expression of Annexin A4 in clear cell carcinoma of the
ovary and its association with chemoresistance to carboplatin. Int
J Cancer. 125:2316–2322. 2009. View Article : Google Scholar : PubMed/NCBI
|
|
36
|
Mogami T, Yokota N, Asai-Sato M, et al:
Annexin A4 is involved in proliferation, chemo-resistance and
migration and invasion in ovarian clear cell adenocarcinoma cells.
PLos One. 8:e803592013. View Article : Google Scholar : PubMed/NCBI
|
|
37
|
Kajihara H, Yamada Y, Kanayama S, et al:
Clear cell carcinoma of the ovary: Potential pathogenic mechanisms
(Review). Oncol Rep. 23:1193–1203. 2010.PubMed/NCBI
|
|
38
|
Tsuchiya A, Sakamoto M, Yasuda J, et al:
Expression profiling in ovarian clear cell carcinoma:
identification of hepatocyte nuclear factor-1 beta as a molecular
marker and a possible molecular target for therapy of ovarian clear
cell carcinoma. Am J Pathol. 163:2503–2512. 2003. View Article : Google Scholar : PubMed/NCBI
|
|
39
|
Duncan R, Carpenter B, Main LC, Telfer C
and Murray GI: Characterisation and protein expression profiling of
annexins in colorectal cancer. Br J Cancer. 98:426–433. 2008.
View Article : Google Scholar
|
|
40
|
Lin L-L, Huang H-C and Juan H-F: Revealing
the molecular mechanism of gastric cancer marker annexin A4 in
cancer cell proliferation using exon arrays. PLoS One.
7:e446152012. View Article : Google Scholar : PubMed/NCBI
|
|
41
|
Zimmermann U, Balabanov S, Giebel J, et
al: Increased expression and altered location of annexin IV in
renal clear cell carcinoma: a possible role in tumour
dissemination. Cancer Lett. 209:111–118. 2004. View Article : Google Scholar : PubMed/NCBI
|