Introduction
Recent reports have sought to raise awareness of the
growing number of cancer research studies whose findings cannot be
independently reproduced (1).
Indeed, investigators from the Hematology and Oncology Department
at Amgen in Thousand Oaks, CA, USA, were only able to confirm the
scientific results in six out of 53 (11%) reports that were
regarded as landmark studies (1).
A similar assessment of 67 projects (47 of which were oncology
studies) by researchers from Bayer HealthCare (Leverkusen, Germany)
revealed that only one-quarter of the published data could be
reproduced (2). Several reasons
have been proposed to explain the high rate of contrasting results
among different laboratories, including investigator bias,
inappropriate statistical analysis of results, and insufficient
sample size (1,2). Investigator bias is a broad category
that includes manipulation of the analysis and selective reporting
of data (3). It is also well known
that the smaller the experimental sample size, the less likely the
research findings are to be true (3). Alterations in cell culture conditions
are also reported to skew experimental results and increase the
likelihood that a study cannot be replicated (4). However, there are no comprehensive
analyses of the effects of cell culture modifications on the cancer
cell transcriptome.
Cancer cell lines are an indispensable component of
a translational research program and have played a critical role in
several important discoveries, including identification of
BRAF mutations in human tumors (5), development of targeted therapeutic
agents (6), determining mechanisms
of therapeutic resistance (7), and
many others (8). The extent that
investigators rely on cancer cell lines for their studies is
exemplified by the current collection of 200 lung cancer cell
lines, which have been the subject of >9,000 citations (9). These and other cancer cell lines are
maintained in defined media that are isosmotic and contain a
buffer, inorganic salts, nutrients (amino acids and vitamins) and
an energy source (usually glucose) to permit normal cell
metabolism. However, the composition of media formulations can vary
widely. For example, complete Eagle’s minimum essential medium
(MEM) contains 1,000 mg/l of glucose, whereas the concentration of
glucose in Dulbecco’s modified Eagle’s medium (DMEM) containing the
high glucose modification is 4,500 mg/l. The concentration of
glucose present in Roswell Park Memorial Institute (RPMI)-1640
medium falls between MEM and DMEM and is 2,000 mg/l.
It is widely known that the tumor microenvironment
has a profound impact on determining the gene expression patterns
of cancer cells (10). Cancer
cells may also influence gene expression of normal
(non-transformed) cell populations residing in the tumor
microenvironment and the extent of the gene modulation occurring in
both compartments may be quantitatively assessed experimentally
using cross-species hybridization of microarrays (11). Here, we varied the in vitro
microenvironment of MDA-MB-231 breast cancer cells by adjusting
their cell culture conditions and then constructed gene expression
profiles on the cells to determine the possibility that cell
culture modifications could contribute to the inability to
reproduce experimental results. The resulting data emphasize that
in order to obtain reproducible results for cancer cells grown in
culture, one must adhere to the precise details regarding media
formulation, supplemental nutrition, and the density of the cell
preparation at the time of analysis.
Materials and methods
Antibodies
The following antibodies were used in this study:
anti-IL-8, anti-E-cadherin (Invitrogen Life Technologies, Carlsbad,
CA, USA); anti-S100A4, anti-VIM, anti-CD44 (Cell Signaling
Technology, Inc., Beverly, MA, USA); anti-CD24 (R&D Systems,
Minneapolis, MN, USA); anti-β-actin (AC-15) (Sigma-Aldrich, St.
Louis, MO, USA); goat anti-mouse IgG-horseradish peroxidase (HRP),
goat anti-rabbit IgG-HRP (Santa Cruz Biotechnology, Inc., Santa
Cruz, CA, USA).
Cell lines and cell culture
conditions
Human MDA-MB-231 breast cancer cells (12) were maintained as a monolayer
culture in MEM, DMEM, or RPMI-1640 supplemented with L-glutamine,
sodium pyruvate, non-essential amino acids, a 2-fold vitamin
solution, and penicillin-streptomycin (Invitrogen Life
Technologies). Fetal bovine serum (FBS) (HyClone, Logan, UT, USA)
or horse serum (HS) (Invitrogen Life Technologies) was added to the
media. All tissue culture reagents were free of endotoxin as
determined by the Limulus Amebocyte Lysate assay (Associates of
Cape Cod, Inc., Woods Hole, MA, USA). MDA-MB-231 cells were free of
the following murine pathogens: Mycoplasma species, Hanta
virus, hepatitis virus, minute virus, adenovirus (MAD1, MAD2),
cytomegalovirus, ectromelia virus, lactate dehydrogenase-elevating
virus, polyma virus, and Sendai virus (assayed by the Research
Animal Diagnostic Laboratory, University of Missouri, Columbia, MO,
USA). MDA-MB-231 breast cancer cells were tested at the MD Anderson
Characterized Cell Line Core Facility using short tandem repeats
DNA profiling.
Microarray analysis
Total RNA was extracted from the cultured cells by
using the mirVana miRNA Isolation kit (Life Technologies, Grand
Island, NY, USA) according to the manufacturer’s instructions. The
integrity of the RNA fraction was determined using a Bio-Rad
Experion Bioanalyzer (Bio-Rad, Hercules, CA, USA) as a surrogate
for mRNA quality control. Biotin-labeled cRNA samples were prepared
by using the Illumina Total Prep RNA Amplification kit and 1.5 μg
of biotinylated cRNA sample was hybridized to HumanHT-12 v4.0
Expression BeadChip (Illumina, Inc., San Diego, CA, USA). BeadChips
were scanned with an Illumina BeadArray Reader and the microarray
data were normalized using the quantile normalization method in the
Linear Models for Microarray Data package in the R language
environment (12). All statistical
analyses were performed using the BRB-ArrayTools software program
(version 4.0) (13).
Western blot analysis
Western blot analysis was used to confirm the
results of the microarray data. MDA-MB-231 cancer cells
(2×10⁶ cells) were plated onto 100 mm culture dishes and
maintained in the various media formulations containing different
concentrations (or types) of sera. Whole-cell lysates of cancer
cells were obtained when cancer cells reached the appropriate
experimental cell density by lysing cells in buffer [10 mM Tris (pH
8.0), 1 mM EDTA, 0.1% SDS, 1% deoxycholate, 1% NP40, 0.14 M NaCl, 1
μg/ml leupeptin, 1 μg/ml aprotinin, and 1 μg/ml pepstatin]
containing a protease inhibitor mixture (Roche Diagnostics,
Indianapolis, IN, USA) (12).
Next, 30 μg of total protein was separated by electrophoresis on
4–12% Nu-PAGE gels (Life Technologies) and transferred to
nitrocellulose membranes. Membranes were blocked for 1 h and then
incubated overnight at 4°C with primary antibodies (1:1,000). The
membranes were rinsed, incubated with HRP-conjugated secondary
antibodies (1:3,000), and visualized by enhanced chemiluminescence
(Amersham Pharmacia Biotech, Piscataway, NJ, USA). To ensure equal
protein loading, the blots were stripped and reprobed with an
anti-β-actin antibody (Sigma-Aldrich). Quantification of protein
levels in the western blots was performed using ImageJ software
(National Institutes of Health, Bethesda, MD, USA).
Real-time reverse transcription
polymerase chain reaction
Microarray results for interleukin-8 (IL-8),
S100A4, vimentin (VIM), E-cadherin (CDH1),
CD44, and CD24 were validated using real-time reverse
transcription polymerase chain reaction (RT-PCR). Total RNA was
extracted from the MDA-MB-231 cancer cells using the Qiagen RNeasy
Mini kit (Qiagen, Valencia, CA, USA) according to the
manufacturer’s instructions. First-strand cDNA was synthesized from
5 μg RNA using SuperScript III Reverse Transcriptase (Invitrogen
Life Technologies). RT-PCR was performed using TaqMan®
Universal PCR Master Mix and quantified with Applied Biosystems
7500 Real-Time PCR system (Applied Biosystems, Foster City, CA,
USA). The following TaqMan® Gene Expression assays were
used in our validation study; human IL-8 (Hs00174103-ml);
human S100A4 (Hs00243202_m1); human VIM
(Hs00185584_m1); human CDH1 (Hs01023894_m1); human
CD44 (Hs01075861_m1) and human CD24 (Hs02379687_s1)
(all from Applied Biosystems). 18S rRNA was used as an endogenous
control. Relative mRNA expression in the cells was calculated using
the ΔΔCt method (14) and the
results are expressed as the mean ± standard deviation (SD) of mRNA
relative to that of control.
Statistical analysis
All statistical analyses were performed using
BRB-ArrayTools version 4.3.2 under the R language environment. The
microarray data were normalized using the quantile normalization
method in the Linear Models for Microarray Data package. A
two-sample t-test was applied to gene expression data from three
groups of samples and expression of genes and a P<0.001 was
considered statistically significant. This stringent significance
threshold was used to limit the number of false-positive findings.
We also performed a global test of whether the expression profiles
differed between the classes by permuting the labels of which
arrays corresponded to which classes. For each permutation, the
P-values were recomputed and the number of genes with significant
expression levels of <0.001 was noted. Cluster analyses were
performed with the Cluster software program and heat maps were
generated using the TreeView software program (15).
Accession numbers
The microarray data have been deposited in the Gene
Expression Omnibus under accession number GSE61670.
Results
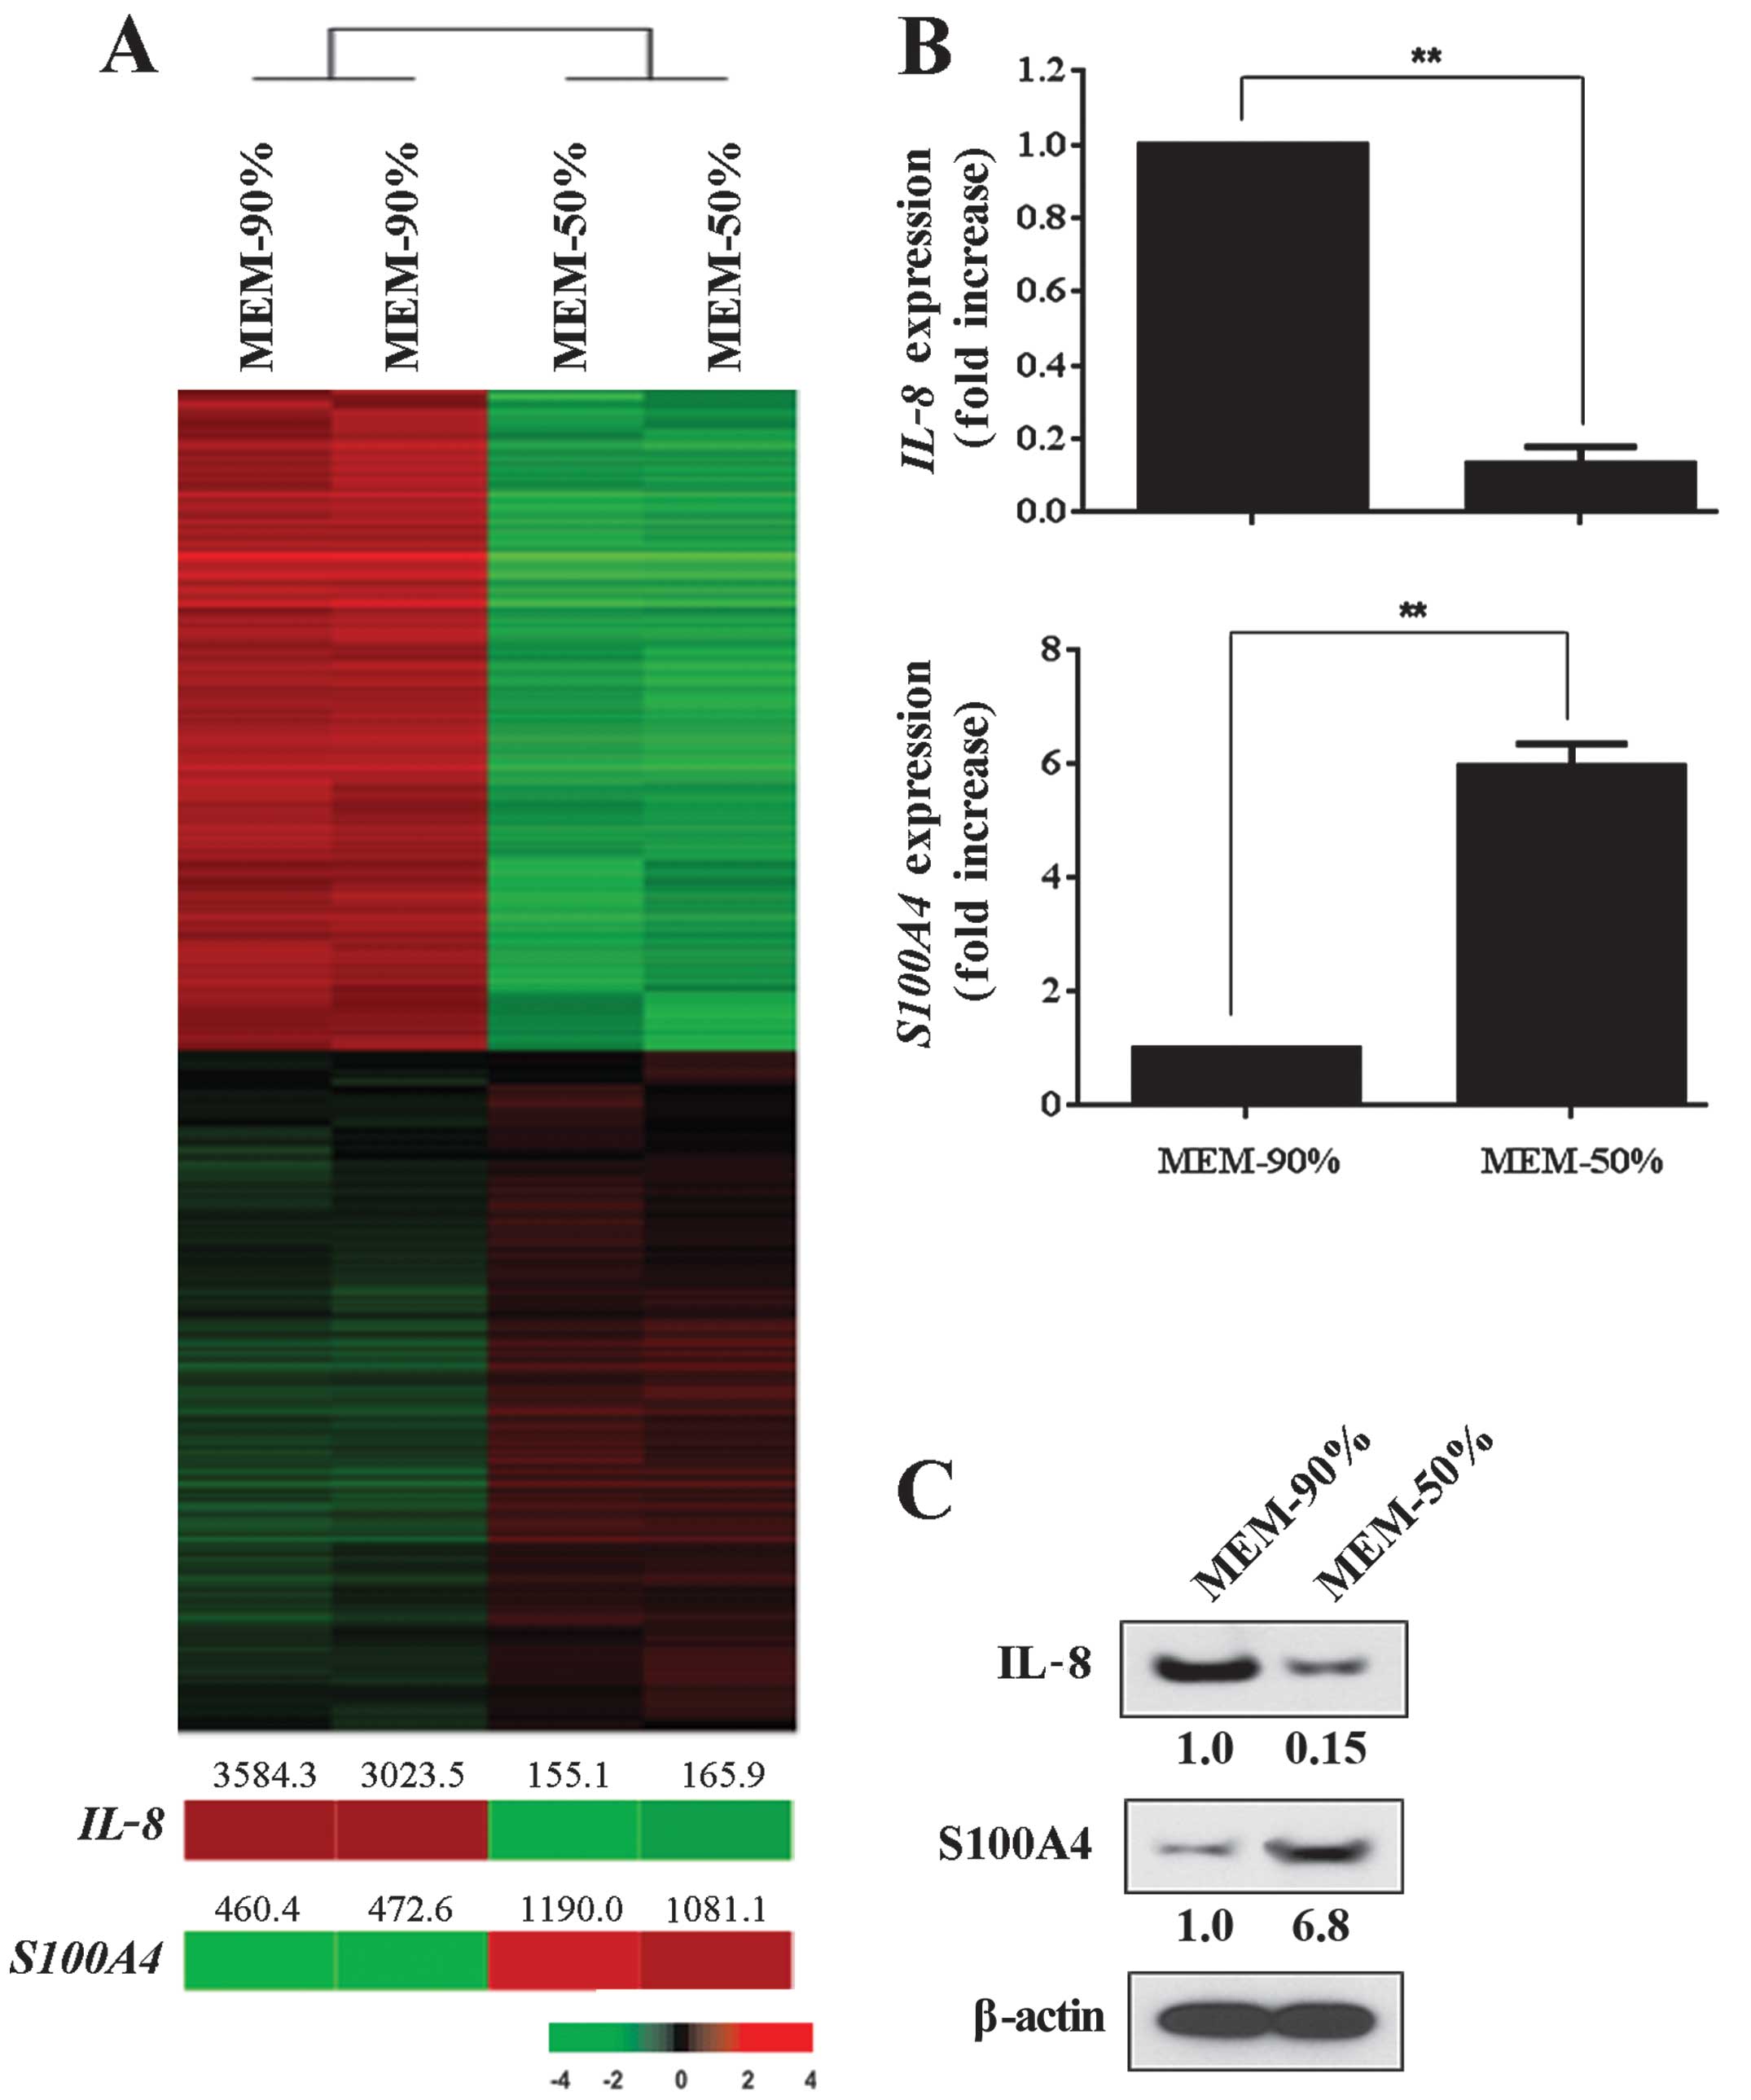
Cell density affects patterns of gene
expression in MDA-MB-231 cancer cells
To begin to study the effects of the cell culture
environment on the cancer cell transcriptome, we first examined how
alterations in cell density affect patterns of gene expression of
MDA-MB-231 breast cancer cells. The cells were grown as monolayers
in MEM supplemented with 10% FBS and harvested for analysis when
they were 50 or 90% confluent in culture dishes. We noted that this
alteration in cell density resulted in the differential expression
of 2,234 genes (Fig. 1A).
Specifically,1,100 genes were significantly upregulated in cancer
cells that were 90% confluent when compared to cells that were 50%
confluent. A similar number of genes (1,134 genes) were
significantly downregulated in 90% confluent cancer cells. We
selected IL-8 and S100A4 from the upregulated and
downregulated gene sets for validation using RT-PCR, because these
two genes were among the most differentially expressed in their
corresponding gene sets. The expression of IL-8 mRNA in
cells that were 90% confluent in MEM was 9-fold greater than that
of cells cultured to 50% confluence in the same medium. In
contrast, we noted a 6-fold downregulation in S100A4 mRNA
expression in cells that were 90% confluent in comparison to cells
that were analyzed once they reached 50% confluence. We confirmed
the differential expression of IL-8 and S100A4 at the
protein level using western blot analysis (Fig. 1C).
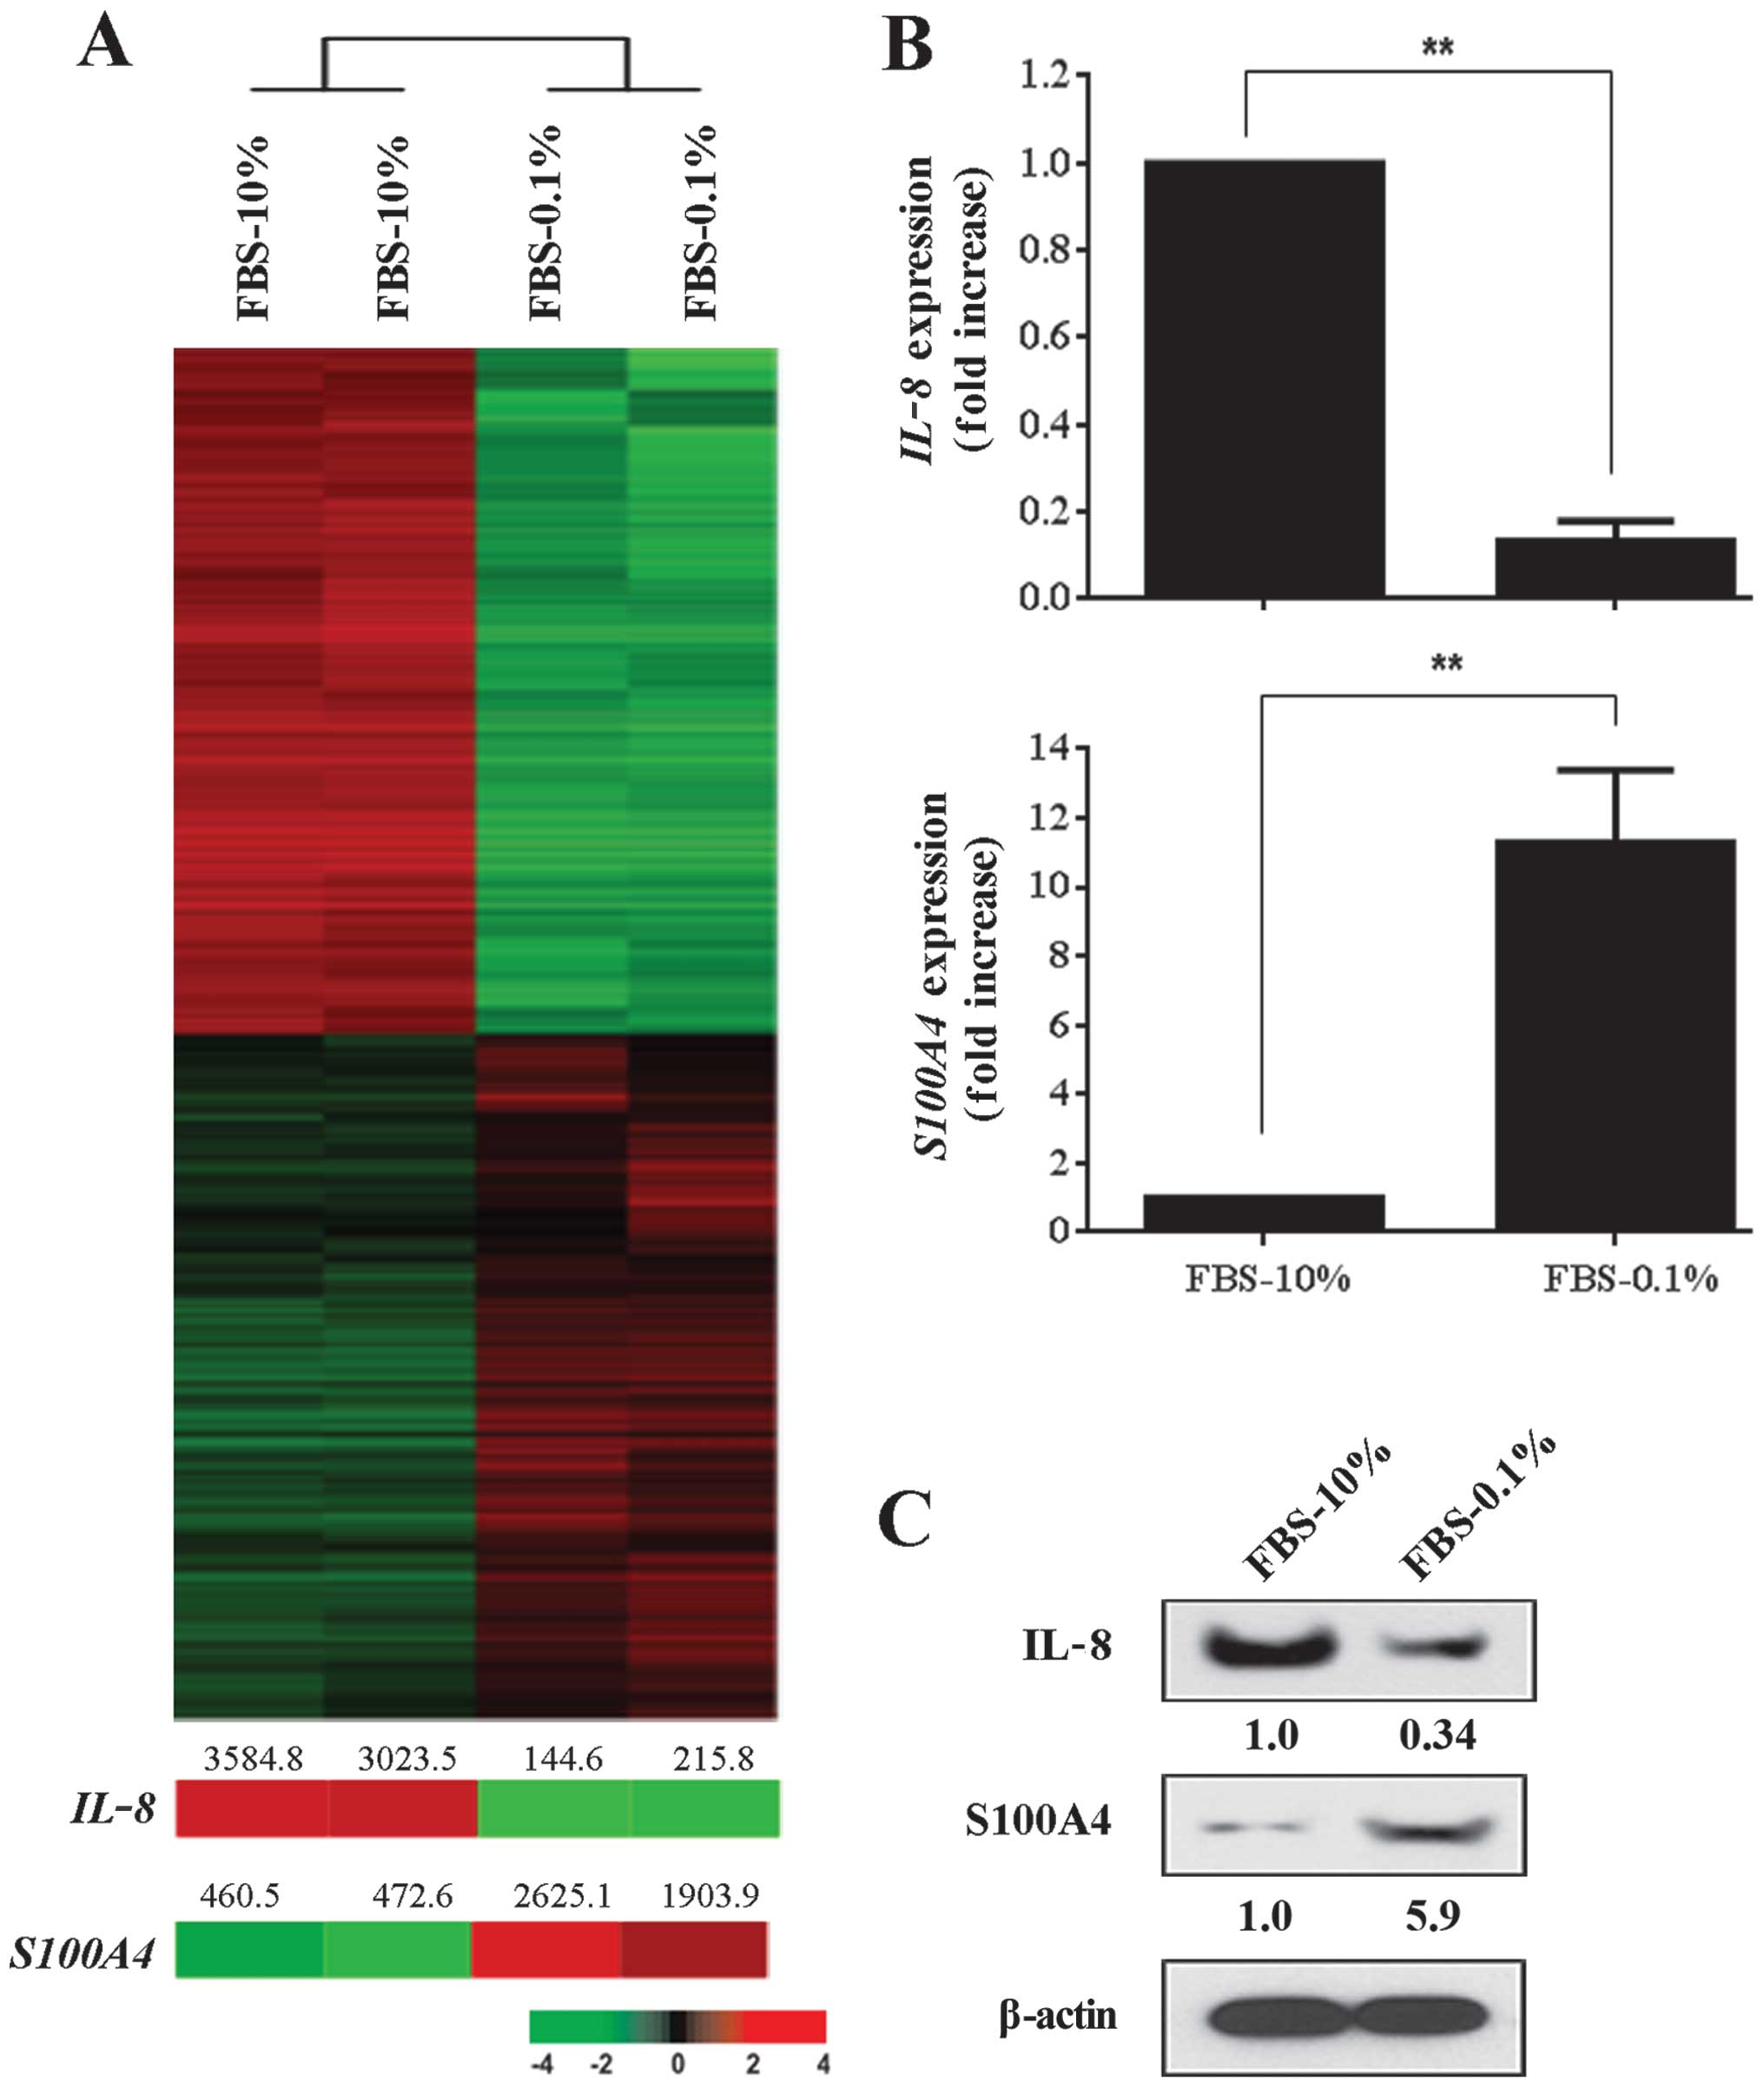
Concentration of FBS affects MDA-MB-231
cancer cell gene expression
Next, we analyzed how varying the concentration of
FBS affected gene expression in MDA-MB-231 breast cancer cells. The
concentration of FBS in several same passage cultures of MDA-MB-231
cancer cells was adjusted to either 0.1 or 10% and all cells were
analyzed when cultures reached 90% confluency. We found almost
3,000 genes that were differentially expressed between MDA-MB-231
cells cultured in 10% FBS and those cultured in 0.1% FBS (Fig. 2A). A total of 1,489 genes were
expressed at significantly higher levels in cells cultured in 10%
FBS when compared to cells cultured in 0.1%. Once again,
IL-8 and S100A4 gene expressions were among the more
differentially regulated genes and both were examined in greater
detail. RT-PCR analysis revealed that IL-8 was upregulated
by 10-fold in MDA-MB-231 cancer cells that were grown in 10% FBS,
whereas S100A4 was down-regulated by 10-fold in cells
maintained in 10% FBS (Fig. 2B).
We confirmed these findings by western blot analysis, which showed
a 3-fold increase of IL-8 expression in MDA-MB-231 cancer cells
grown in 10% FBS and almost a 6-fold increase in S100A4 protein
expression when cells are grown in the reduced concentration (0.1%)
of FBS (Fig. 2C).
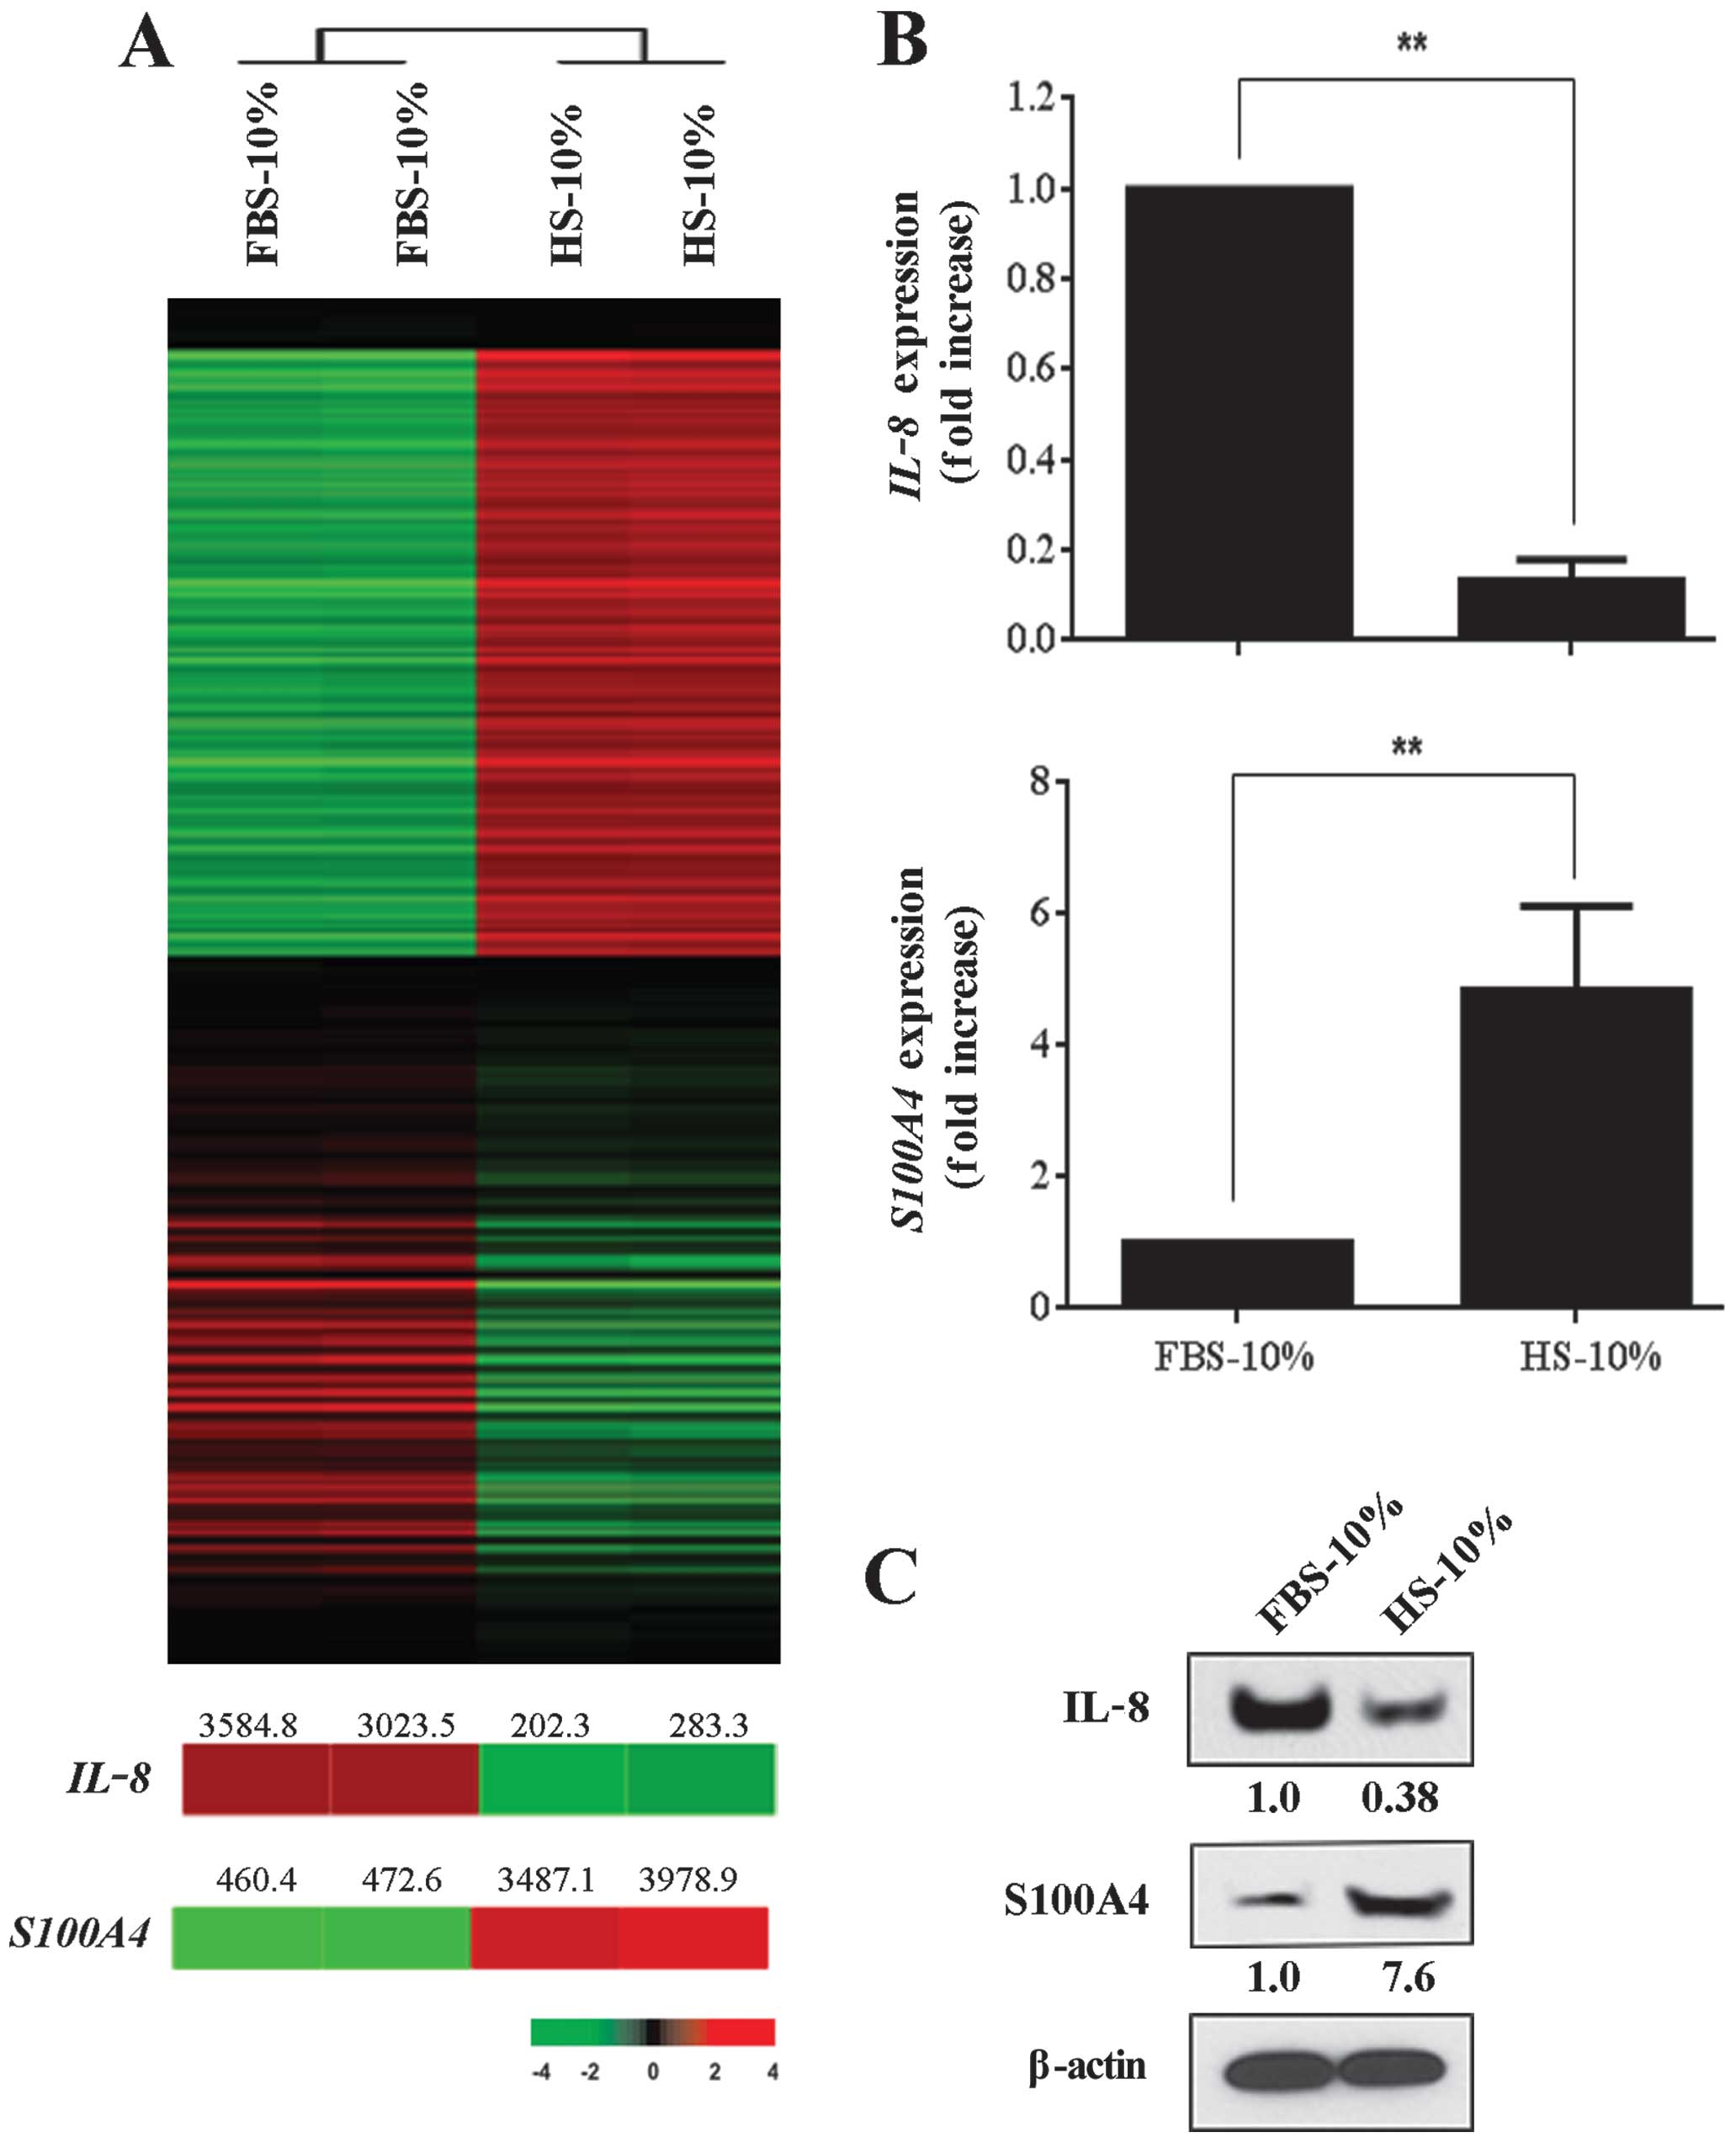
Virtually any type of animal is capable of serving
as a donor for serum, but some animal sera are used more often than
others. Fetal bovine serum (FBS) and horse serum (HS) are among the
more common types of sera used for culturing mammalian cells and we
evaluated the effects of these sera on MDA-MB-231 cancer cell gene
expression. In this series of experiments, we maintained the
density of cell cultures at the time of analysis constant at 90%.
While altering the source of the sera used in cell culture
significantly affected cancer cell gene expression, the overall
effect was less than that observed when we modified the
concentration of FBS in the culture media or when we analyzed cells
grown at different cell densities. We recorded a total of 422
differentially expressed genes in a comparison between MDA-MB-231
cancer cells grown in MEM containing 10% FBS and those grown in MEM
containing 10% HS. A total of 235 and 187 genes were significantly
upregulated and down-regulated, respectively, in cancer cells in
the 10% FBS cell group (Fig. 3A).
IL-8 and S100A4 were among the differently modulated
genes and expression levels were confirmed using RT-PCR (Fig. 3B) and western blot analysis
(Fig. 3C). IL-8 protein expression
in MDA-MB-231 cancer cells grown in media supplemented with 10% FBS
was ~3-fold higher than of cells maintained in 10% HS. In contrast,
S100A4 protein expression was negligible in MEM containing FBS, but
was markedly upregulated in media containing HS.
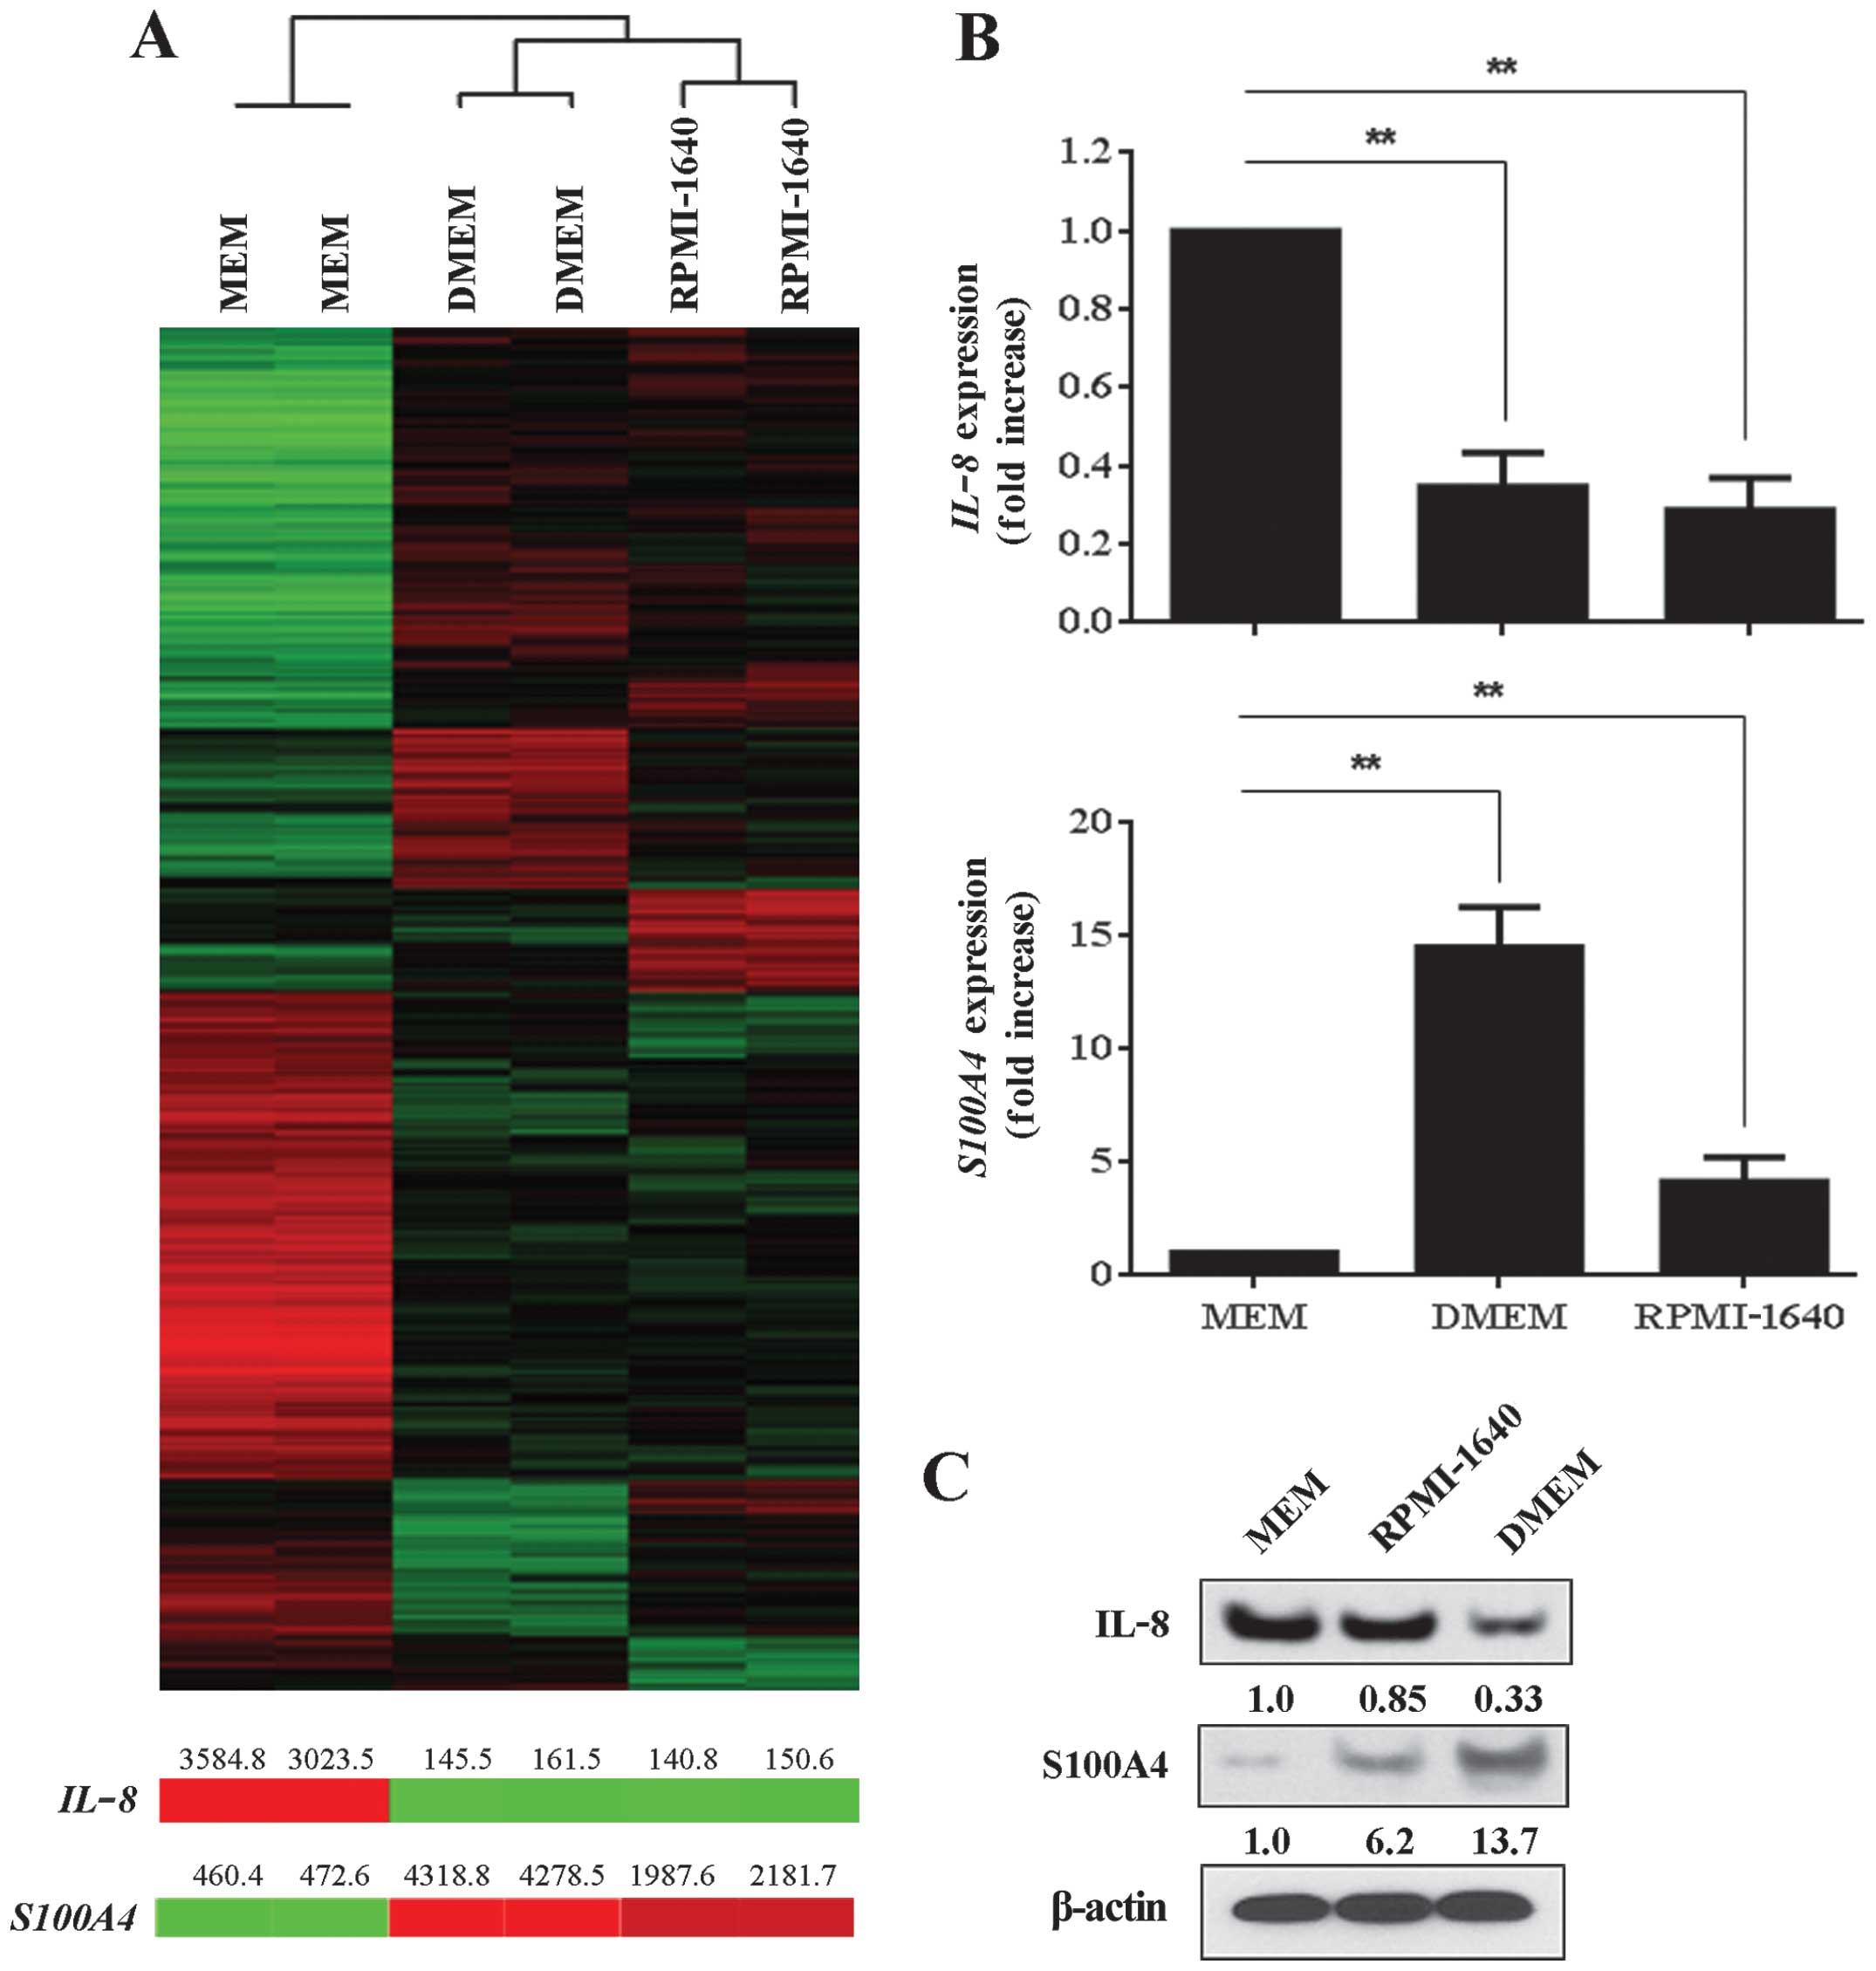
Cell culture media formulations exert the
most profound effect on cancer cell gene expression
To determine how different media formulations affect
cancer cell gene expression, we cultured MDA-MB-231 breast cancer
cells in MEM, DMEM, or RPMI-1640 media, all containing 10% FBS, and
when the cultures reached 90% confluence, we extracted total RNA
from the cells and applied it to beadchip microarrays for analysis.
A total of 8,925 genes were differentially expressed when we
compared microarray results from MDA-MB-231 cancer cells grown in
MEM with those cells grown in DMEM or RPMI-1640 (Fig. 4A). Specifically, 1,409 genes were
highly expressed in MEM as compared to DMEM and RPMI-1640; 840
genes were highly expressed in DMEM as compared to MEM and
RPMI-1640; and 1,662 genes were highly expressed in RPMI-1640 as
compared to MEM and DMEM. The microarray analysis predicted IL-8
expression levels would be greatest in MDA-MB-231 cells that were
grown in MEM and least in cells that were maintained in DMEM and
RPMI-1640 and this finding was confirmed by RT-PCR (Fig. 4B). S100A4 gene expression
was significantly greater in MDA-MB-231 cells grown in DMEM and
RPMI-1640 in comparison to cells grown in MEM and this was also
validated by RT-PCR (Fig. 4B).
Indeed, S100A4 gene expression levels were 15- and 5-fold
greater in cells grown in DMEM and RPMI-1640, respectively, as
compared to cells grown in MEM. Western blot analysis of IL-8 and
S100A4 paralleled the gene expression results (Fig. 4C).
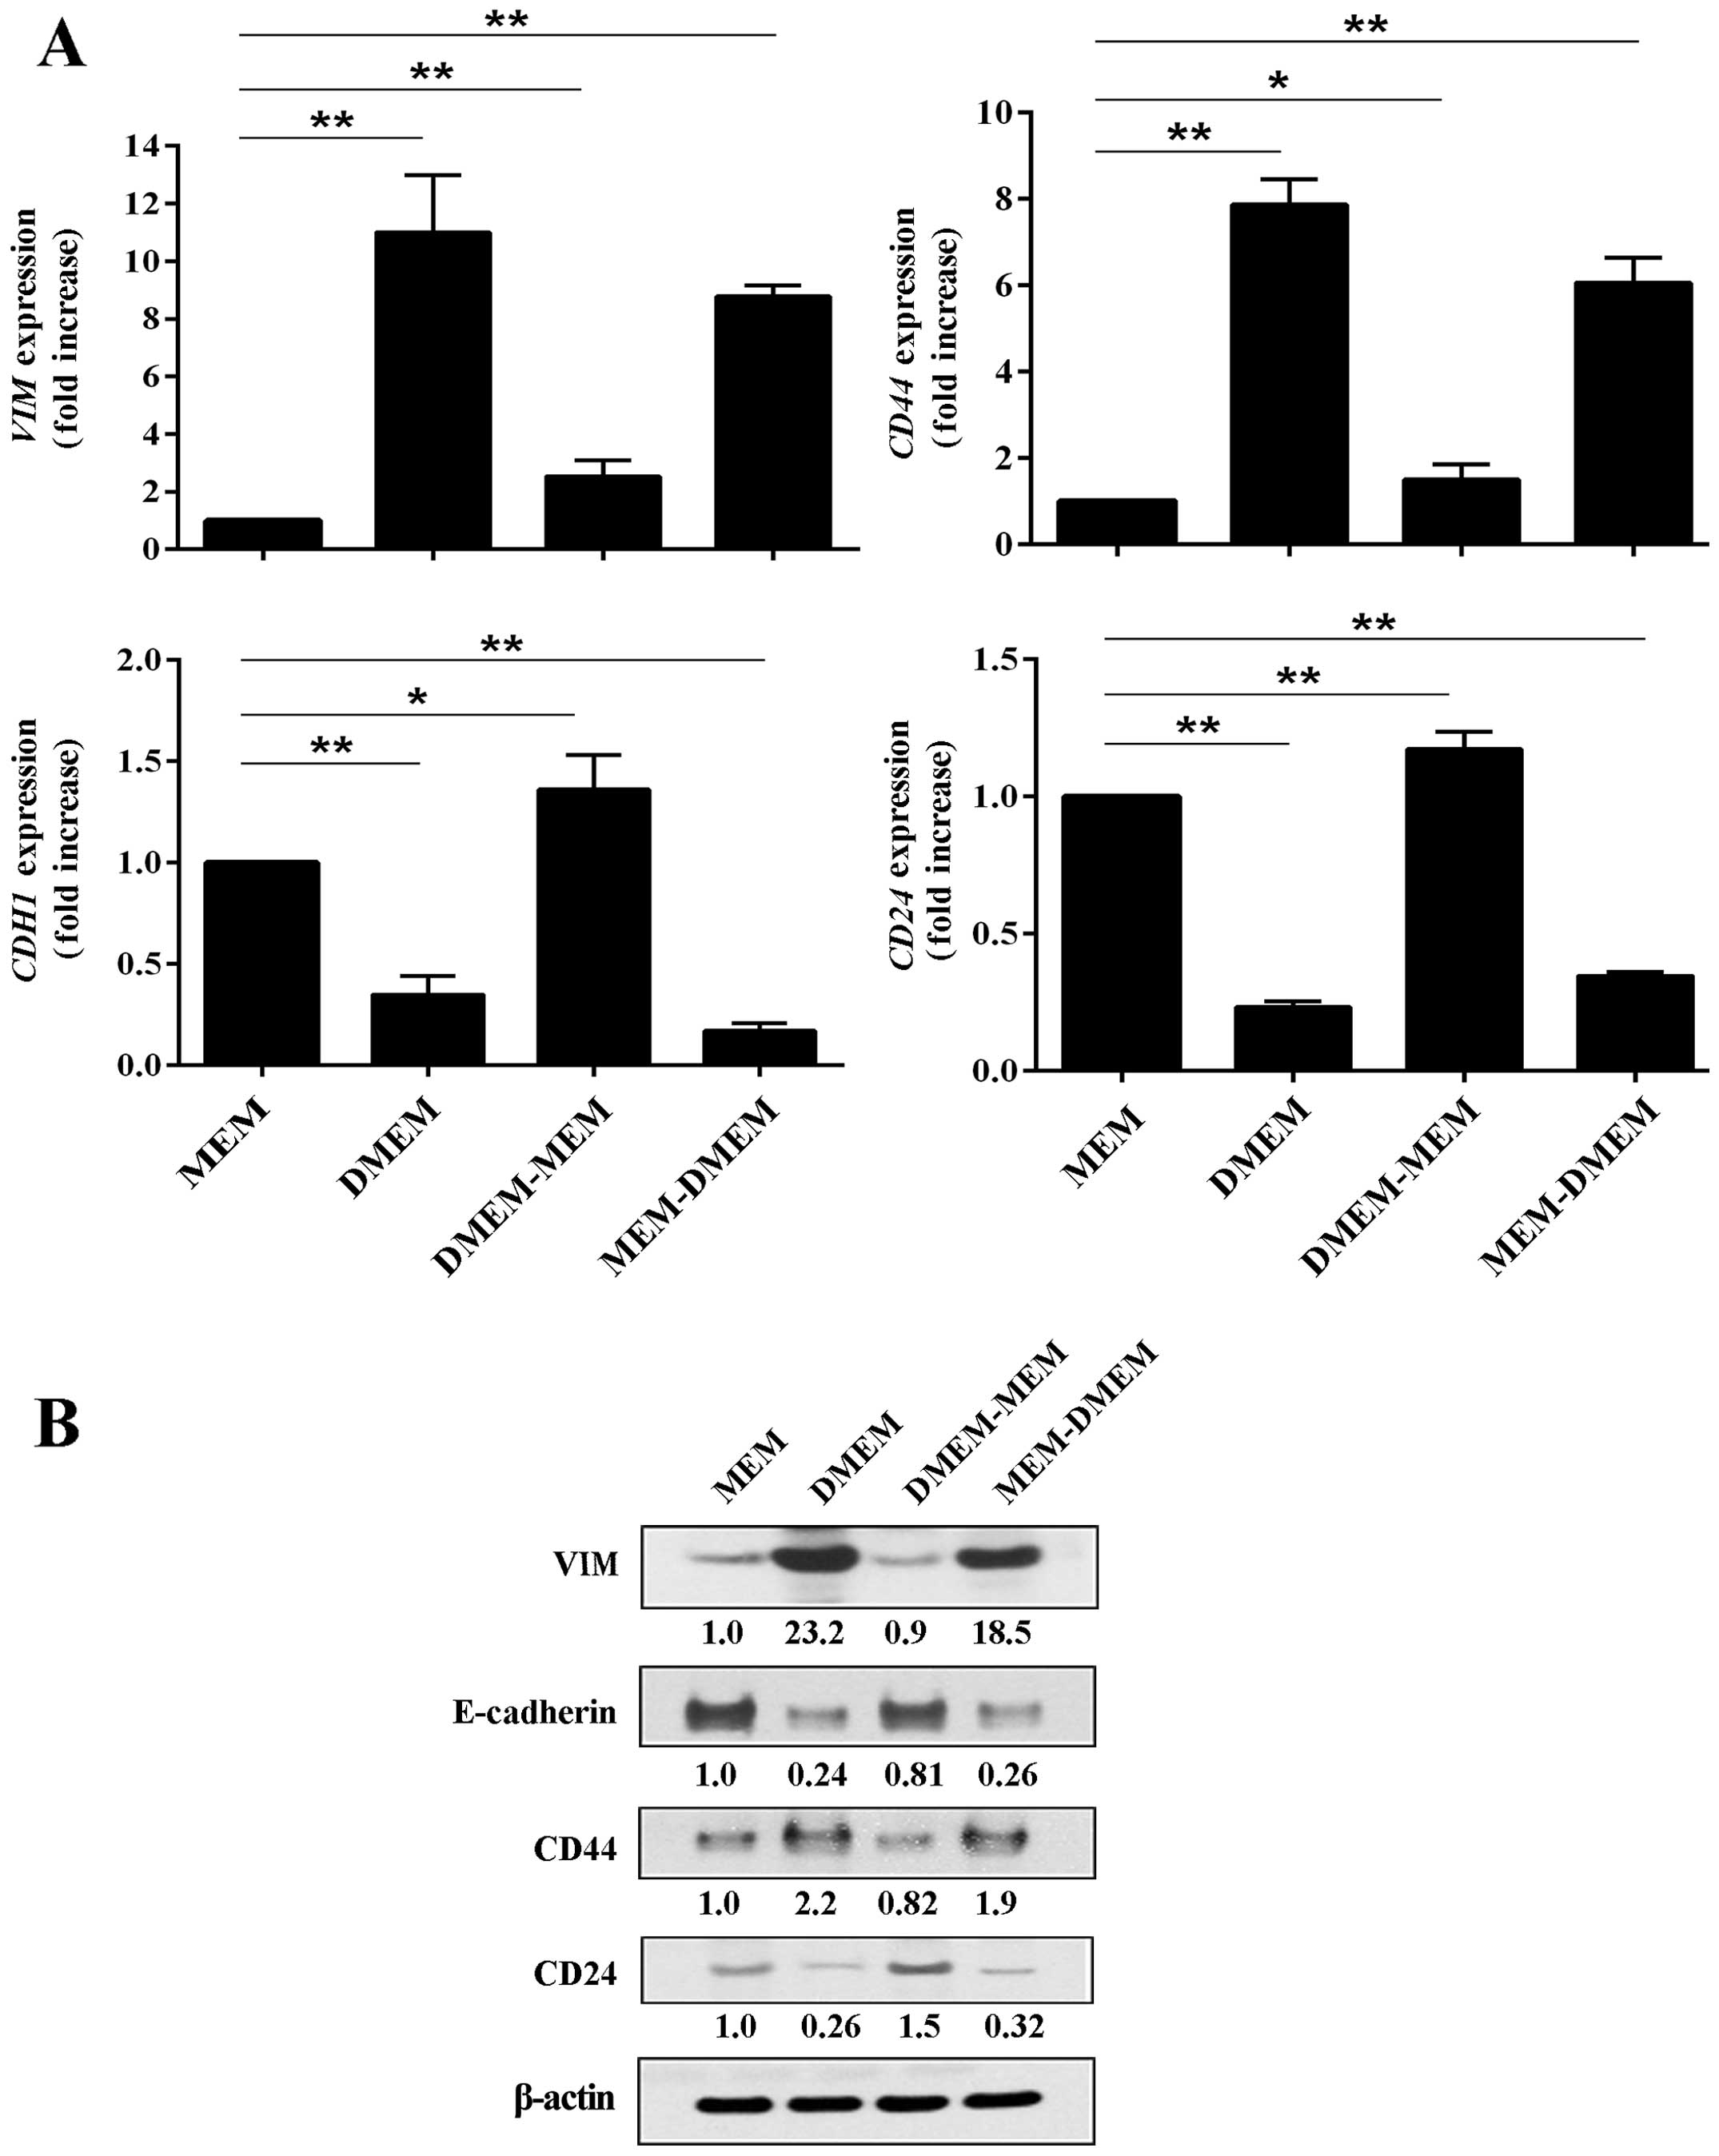
Cell culture media formulations modulate
expression of genes associated with EMT
Data mining on the expression array sets suggested
that genes frequently associated with epithelial-mesenchymal
transition (EMT) were differentially modulated by the various media
formulations. MDA-MB-231 cancer cells that were grown in MEM had a
tendency to express significantly higher expression levels of
epithelial cell markers E-cadherin (CDH1) and CD24,
whereas the same cells grown in DMEM expressed higher levels of
mesenchymal markers VIM and CD44. We confirmed the
gene expression array using RT-PCR analysis. Gene expression levels
of VIM and CD44 in MDA-MB-231 cancer cells were
dramatically suppressed when the cells were grown in MEM in
comparison to cells grown in DMEM (Fig. 5A, upper panel). VIM and
CD44 expression levels were at least 8-fold higher in cells
that were maintained in DMEM. However, expression levels of these
two genes could be easily modulated by simply switching the cells
to a different media formulation for a period of 48 h. When DMEM
was replaced by MEM, expression levels of CD44 and
VIM dropped dramatically; when MEM was replaced by DMEM
expression, levels of CD44 and VIM increased.
The gene expression patterns of CDH1 and
CD24 were diametrically opposed to that of CD44 and
VIM. That is, CDH1 and CD24 gene expression
were elevated in MDA-MB-231 cancer cells when they were grown in
MEM and both were suppressed when cells were maintained in DMEM
(Fig. 5A, lower panel). Similar to
our analysis of CD44 and VIM, gene expression of
CDH1 and CD24 was plastic and influenced by the in
vitro microenvironment. When the MDA-MB-231 cancer cell media
was changed from MEM to DMEM for 48 h, expression levels of
CDH1 and CD24 were significantly reduced. All of the
gene expression results were validated at the protein level by
western blot analysis (Fig.
5B).
Discussion
Cancer cell lines play an invaluable role in the
drug discovery process (16) and
in identifying molecular mechanisms of therapeutic resistance
(7). Because tumor cell lines
consist of pure populations of cancer cells, they are frequently
more advantageous for study as compared to tumor tissue (8). For example, cancer cell lines provide
a source of high quality DNA, RNA, and proteins that may facilitate
testing and data interpretation (8). However, the misidentification of cell
lines and their cross-contamination have led to a number of
misleading and erroneous publications in the scientific literature
(17,18). Recently, several granting agencies
and scientific journals have sought to handle this problem by
requiring investigators to provide cell line authentication for
human cancer cells using short tandem repeat profiling (18). In the present report, we provide
convincing evidence that the replication of results on cultured
cancer cells also requires rigid adherence to the cell culture
formulation used to maintain cells and reporting of the cell
density reached at the time of analysis.
One of the more striking observations of our study
was that in our whole-genome microarray analysis of MDA-MB-231
breast cancer cells, approximately one-quarter (25.6%) of all genes
were differentially expressed when we examined cells that were
grown in different media formulations. While we had predicted that
several genes would be differentially modulated by the various
media preparations, we did not anticipate the extent of
differential gene expression observed in our study. Genes
associated with the EMT program were upregulated or downregulated
simply by switching the cells to a different media formulation
(different concentration of glucose) for a period of 48 h. EMT
plays a critical role during development and is also observed in
the process of tissue repair (19). Invading and metastasizing carcinoma
cells revive the EMT program by upregulating mesenchymal proteins
and by suppressing expression of epithelial proteins (20). EMT has been the focus of much
recent investigation because cancer cells undergoing EMT have been
shown to obtain stem cell-like properties and become resistant to
anticancer agents (21). Our
results demonstrate that EMT gene and protein expression is
remarkably plastic in cultured cancer cells and that EMT is highly
influenced by the tissue culture microenvironment. It is tempting
to speculate that the elevated glucose concentration present in
DMEM and RPMI-1640 relative to that found in MEM was responsible
for the induction of the EMT program in MDA-MB-231 breast cancer
cells. Evidence to support this contention comes from studies of
renal tubular cells (22) and
peritoneal mesothelial cells (23), which activate the EMT program in
response to stimulation with high concentrations of glucose.
Moreover, a recent study demonstrated that the small fraction of
cancer cells with stem-like properties that exists in a tumor could
be dramatically increased in the cell culture environment by
culturing the cells in high concentrations of glucose (24). These investigations lend
credibility to the experimental approach used in our study and
suggest that additional study in this area is warranted.
Two genes that have been linked to breast cancer
progression, IL-8 and S100A4, were differentially
modulated by every cell culture modification that we examined.
S100A4 is a small calcium-binding protein that has been shown to
promote migration, invasion, and anchorage-independent growth of
breast cancer cells (25). In the
present report, S100A4 was upregulated in MDA-MB-231 cancer
cells under conditions of low cell density, minimal FBS
supplementation, HS, and when cells are grown in a DMEM
formulation. Alternatively, S100A4 expression was negligible
when cells were maintained in media supplemented with 10% FBS and
when cells achieved a confluent state. IL-8 is a human chemokine
that is produced by a variety of different cell types. In healthy
tissues, IL-8 is minimally expressed, but can be rapidly induced
100-fold in response to pro-inflammatory cytokines, such as tumor
necrosis factor, IL-1, bacterial or viral products, and cellular
stress (26). IL-8 contributes to
the progression of several types of tumors by mediating cancer cell
migration and stimulating tumor neovascularization (27). More recent studies have shown that
IL-8 signaling may function as a key factor in the regulation of
breast cancer stem cell activity (28). In our study, IL-8 expression was
enriched in confluent MDA-MB-231 breast cancer cells that were
maintained in MEM containing 10% FBS.
Collectively, our results show that the gene
expression patterns of cancer cells can vary significantly
according to the conditions under which they are cultured. While
the introduction of measures that ensure the identification of
cancer cell lines used in research investigations will undoubtedly
improve the reproducibility of translational oncology research,
accurate documentation of cell culture conditions is essential for
replicating results from in vitro studies of cancer
cells.
Acknowledgements
This study was supported in part by funds from
Cancer Center Support Core grant CA16672 and grant 2RO1-CA154710
from the National Cancer Institute, National Institutes of Health
(Bethesda, MD, USA).
References
|
1
|
Begley CG and Ellis LM: Drug development:
raise standards for preclinical cancer research. Nature.
483:531–533. 2012. View
Article : Google Scholar : PubMed/NCBI
|
|
2
|
Prinz F, Schlange T and Asadullah K:
Believe it or not: how much can we rely on published data on
potential drug targets? Nat Rev Drug Discov. 10:7122011. View Article : Google Scholar : PubMed/NCBI
|
|
3
|
Ioannidis JP: Why most published research
findings are false. PLoS Med. 2:e1242005. View Article : Google Scholar : PubMed/NCBI
|
|
4
|
Bissell M: Reproducibility: the risks of
the replication drive. Nature. 503:333–334. 2013. View Article : Google Scholar : PubMed/NCBI
|
|
5
|
Davies H, Bignell GR, Cox C, et al:
Mutations of the BRAF gene in human cancer. Nature. 417:949–954.
2002. View Article : Google Scholar : PubMed/NCBI
|
|
6
|
Druker BJ, Tamura S, Buchdunger E, et al:
Effects of a selective inhibitor of the Abl tyrosine kinase on the
growth of Bcr-Abl positive cells. Nat Med. 2:561–566. 1996.
View Article : Google Scholar : PubMed/NCBI
|
|
7
|
Engelman JA, Zejnullahu K, Mitsudomi T, et
al: MET amplification leads to gefitinib resistance in lung cancer
by activating ERBB3 signaling. Science. 316:1039–1043. 2007.
View Article : Google Scholar : PubMed/NCBI
|
|
8
|
Gazdar AF, Gao B and Minna JD: Lung cancer
cell lines: useless artifacts or invaluable tools for medical
science? Lung Cancer. 68:309–318. 2010. View Article : Google Scholar : PubMed/NCBI
|
|
9
|
Gazdar AF, Girard L, Lockwood WW, Lam WL
and Minna JD: Lung cancer cell lines as tools for biomedical
discovery and research. J Natl Cancer Inst. 102:1310–1321. 2010.
View Article : Google Scholar : PubMed/NCBI
|
|
10
|
Langley RR and Fidler IJ: The seed and
soil hypothesis revisited - the role of tumor-stroma interactions
in metastasis to different organs. Int J Cancer. 128:2527–2535.
2011. View Article : Google Scholar : PubMed/NCBI
|
|
11
|
Cascone T, Herynk MH, Xu L, et al:
Upregulated stromal EGFR and vascular remodeling in mouse xenograft
models of angiogenesis inhibitor-resistant human lung
adenocarcinoma. J Clin Invest. 121:1313–1328. 2011. View Article : Google Scholar : PubMed/NCBI
|
|
12
|
Kim SJ, Kim JS, Park ES, Lee JS, et al:
Astrocytes upregulate survival genes in tumor cells and induce
protection from chemotherapy. Neoplasia. 13:286–298.
2011.PubMed/NCBI
|
|
13
|
Simon R, Lam A, Li MC, Ngan M, Menenzes S
and Zhao Y: Analysis of gene expression data using BRB-ArrayTools.
Cancer Inform. 3:11–17. 2007.PubMed/NCBI
|
|
14
|
Livak KJ and Schmittgen TD: Analysis of
relative gene expression data using real-time quantitative PCR and
the 2(−Delta Delta C(T)) method. Methods. 25:402–408. 2001.
View Article : Google Scholar
|
|
15
|
Eisen MB, Spellman PT, Brown PO and
Botstein D: Cluster analysis and display of genome-wide expression
patterns. Proc Nat Acad Sci USA. 95:14863–14868. 1998. View Article : Google Scholar : PubMed/NCBI
|
|
16
|
Druker BJ and Lydon NB: Lessons learned
from the development of an abl tyrosine kinase inhibitor for
chronic myelogenous leukemia. J Clin Invest. 105:3–7. 2000.
View Article : Google Scholar : PubMed/NCBI
|
|
17
|
American Type Culture Collection Standards
Development Organization Workgroup ASN- 0002. Cell line
misidentification: the beginning of the end. Nat Rev Cancer.
10:441–448. 2010. View
Article : Google Scholar : PubMed/NCBI
|
|
18
|
Barallon R, Bauer SR, Butler J, et al:
Recommendation of short tandem repeat profiling for authenticating
human cell lines, stem cells, and tissues. In Vitro Cell Dev Biol
Anim. 46:727–732. 2010. View Article : Google Scholar : PubMed/NCBI
|
|
19
|
Thiery JP, Acloque H, Huang RY and Nieto
MA: Epithelial-mesenchymal transitions in development and disease.
Cell. 139:871–890. 2009. View Article : Google Scholar : PubMed/NCBI
|
|
20
|
Tam WL and Weinberg RA: The epigenetics of
epithelial-mesenchymal plasticity in cancer. Nat Med. 19:1438–1449.
2013. View
Article : Google Scholar : PubMed/NCBI
|
|
21
|
Scheel C and Weinberg RA: Cancer stem
cells and epithelial-mesenchymal transition: concepts and molecular
links. Semin Cancer Biol. 22:396–403. 2012. View Article : Google Scholar : PubMed/NCBI
|
|
22
|
Tang L, Li H, Gou R, Cheng G, Guo Y, Fang
Y and Chen F: Endothelin-1 mediated high glucose-induced
epithelial-mesenchymal transition in renal tubular cells. Diabetes
Res Clin Pract. 104:176–182. 2014. View Article : Google Scholar : PubMed/NCBI
|
|
23
|
Yu MA, Shin KS, Kim JH, et al: HGF and
BMP-7 ameliorate high glucose-induced epithelial-to-mesenchymal
transition of peritoneal mesothelium. J Am Soc Nephrol. 20:567–581.
2009. View Article : Google Scholar : PubMed/NCBI
|
|
24
|
Liu PP, Liao J, Tang ZJ, et al: Metabolic
regulation of cancer cell side population by glucose through
activation of the Akt pathway. Cell Death Differ. 21:124–135. 2014.
View Article : Google Scholar
|
|
25
|
Kim TH, Kim HI, Soung YH, Shaw LA and
Chung J: Integrin (alpha6beta4) signals through Src to increase
expression of S100A4, a metastasis-promoting factor: implications
for cancer cell invasion. Mol Cancer Res. 7:1605–1612. 2009.
View Article : Google Scholar : PubMed/NCBI
|
|
26
|
Hoffmann E, Dittrich-Breiholz O, Holtmann
H and Kracht M: Multiple control of interleukin-8 gene expression.
J Leukoc Biol. 72:847–855. 2002.PubMed/NCBI
|
|
27
|
Waugh DJ and Wilson C: The interleukin-8
pathway in cancer. Clin Cancer Res. 14:6735–6741. 2008. View Article : Google Scholar : PubMed/NCBI
|
|
28
|
Singh JK, Simões BM, Howell SJ, Farnie G
and Clarke RB: Recent advances reveal IL-8 signaling as a potential
key to targeting breast cancer stem cells. Breast Cancer Res.
15:2102013. View
Article : Google Scholar : PubMed/NCBI
|