Introduction
Oral squamous cell carcinoma (OSCC) is a frequently
occurring neoplasm that is usually aggressive and has a poor
prognosis (1). OSCC accounts for
>50% of all head and neck SCC. The prognosis in advanced cases
is poor, and the 5-year survival rates of OSCC are below 50%
(2,3). The 5-year survival rate is 90% for
patients without metastasis, but <40% for patients with
metastasis, suggesting that the regional lymph node metastasis
(RLNM) is one of the most adverse prognostic factors (4–10).
However, the mechanisms of metastasis are poorly understood
(11). Therefore, molecular
changes in a number of oncogenes and tumor suppressor genes
associated with development of OSCC may be important clues for
preventing this disease, and elucidating the molecular mechanisms
involved in cancer metastasis is needed (3,4).
The tropomodulin family (TMOD1-4) is expressed
differentially in a tissue-specific manner and is involved in
regulating actin filament architecture in diverse cellular types
(12). TMOD1-4 are 70% similar in
amino acid sequence with different expression profiles (13) and contain an N-terminal
unstructured domain and a C-terminal domain consisting of 5
leucine-rich repeat motifs (14,15).
TMOD1-4 inhibit elongation and depolymerization of actin filaments
by binding to the pointed end of the actin filament (16–18).
Among them, TMOD1 has two actin-binding regions and two
tropomyosin-binding regions (19–22).
Recent studies have reported that TMOD1 is a
diagnostic marker for triple-negative breast cancers and
ALK-negative anaplastic large-cell lymphoma (23,24);
however, the role of TMOD1 in OSCC remains unknown. We present the
results of measurements of TMOD1 levels in OSCC that are clinically
and functionally linked to RLNM.
Materials and methods
Ethics statement
The Ethics Committee of the Graduate School of
Medicine, Chiba University, Chiba, Japan (approval number, 236)
approved the study protocol, which was performed in accordance with
the tenets of the Declaration of Helsinki. All patients provided
written informed consent.
OSCC-derived cell lines and tissue
specimens
Human OSCC-derived cell lines (HSC-2, HSC-3, HSC-4,
Sa3, Ca9-22, Ho-1-u-1, Ho-1-N-1, KOSC-2 and SAS) were obtained from
the Human Science Research Resources Bank (Osaka, Japan) or the
RIKEN BioResource Center (Ibaraki, Japan) through the National
BioResource Project of the Ministry of Education, Culture, Sports,
Science and Technology in Japan. Primary cultured human normal oral
keratinocytes (HNOKs) were obtained from healthy oral mucosal
epithelial specimens collected from young patients at Chiba
University Hospital (25–28). All cells were grown in Dulbecco's
modified Eagle's medium (Sigma-Aldrich, St. Louis, MO, USA)
supplemented with 10% fetal bovine serum (FBS; Sigma-Aldrich) and
50 units/ml of penicillin and streptomycin (Sigma-Aldrich).
Two hundred primary OSCC specimens and
patient-matched normal epithelial specimens were obtained during
surgeries performed at Chiba University Hospital (Table I). The resected tissues were fixed
in 20% buffered formaldehyde solution for pathological diagnosis
and immunohistochemical (IHC) staining. We performed
histopathological diagnosis of each OSCC sample according to the
World Health Organization criteria at the Department of Pathology
of Chiba University Hospital (29). The clinicopathological stages were
determined based on the TNM classification of the International
Union against Cancer (30).
 | Table IClinical classification in OSCCs from
200 patients. |
Table I
Clinical classification in OSCCs from
200 patients.
| Variables | No. of
patients | (%) |
|---|
| Age at surgery
(years) |
| <70 | 111 | 55.5 |
| ≥70 | 89 | 44.5 |
| Gender |
| Male | 132 | 66 |
| Female | 68 | 34 |
| T-primary
tumor |
| T1 + T2 | 116 | 58 |
| T3 + T4 | 84 | 42 |
| N-regional lymph
node |
| Negative | 120 | 60 |
| Positive | 80 | 40 |
| Histopathological
type |
| Well and
moderately differentiated | 190 | 95 |
| Poorly
differentiated | 10 | 5 |
| Vascular
invasion |
| Negative | 149 | 74.5 |
| Positive | 51 | 25.5 |
mRNA expression analysis
Total RNA was isolated using TRIzol reagent
(Invitrogen, Carlsbad, CA, USA), according to the manufacturer's
instructions. cDNA was generated using ReverTra Ace qPCR RT Master
Mix (Toyobo Life Science, Osaka, Japan) according to the
manufacturer's instructions. Real-time quantitative reverse
transcriptase-polymerase chain reaction (qRT-PCR) was performed in
a 20-μl reaction volume using the LightCycler 480 apparatus (Roche
Diagnostics, Mannheim, Germany), according to the manufacturer's
protocol. The general amplification conditions were performed as
previously described (31–33). Primers and universal probes were
designed using the Universal ProbeLibrary Assay Design Center
(Roche Diagnostics), which specifies the most suitable set. The
primer sequences used for qRT-PCR were: TMOD1, forward,
5′-AGCTGAGGACCCTGGAAAAT-3′ and reverse, 5′-GCAGGCAGCAGTGCATTAT-3′;
and universal probe #42, and the glyceraldehyde-3-phosphate
dehydrogenase (GAPDH), forward, 5′-CATCTCTGCCCCCTCTGCTGA-3′
and reverse, 5′-GGATGACCTTGCCCACAGCCT-3′; and universal probe #60.
The transcript amount for TMOD1 was estimated from the
respective standard curves and normalized to the GAPDH transcript
amount determined in corresponding samples.
Immunoblotting analysis
The cells were washed three times with cold
phosphate-buffered saline (PBS) and briefly centrifuged gently. The
cellular pellets were incubated at 4°C for 30 min in a lysis buffer
(7 M urea, 2 M thiourea, 4% w/v CHAPS, and 10 mM Tris; pH 7.4) with
a proteinase inhibitor cocktail (Roche Diagnostics). The total
protein concentration was measured using a dye-binding method based
on the Bradford assay with Bio-Rad Protein Assay Dye Reagent
Concentrate (Bio-Rad Laboratories, Hercules, CA, USA).
Protein extracts were electrophoresed on 4–12%
Bis-Tris gel and transferred to nitrocellulose membranes
(Invitrogen) and blocked for 1 h at room temperature with Blocking
One (Nacalai Tesque, Inc., Kyoto, Japan). The membranes were washed
three times with 0.1% Tween-20 in Tris-buffered saline (TBS-T) and
incubated with affinity-purified rabbit anti-TMOD1 monoclonal
antibody (Santa Cruz Biotechnology, Santa Cruz, CA, USA) and mouse
anti-GAPDH monoclonal antibody overnight at 4°C. The membrane was
washed with TBS-T and incubated with horseradish
peroxidase-conjugated anti-rabbit or anti-mouse IgG as a secondary
antibody (Promega Corp., Madison, WI, USA), for 1 h at room
temperature. Finally, the membranes were detected using SuperSignal
West Pico Chemiluminescent substrate (Thermo Fisher Scientific,
Rockford, IL, USA), and immunoblotting was visualized by exposing
the membranes to the ChemiDoc XRS Plus system (Bio-Rad
Laboratories). The signal intensities were quantitated using the
Image Lab system (Bio-Rad Laboratories). Densitometric TMOD1
protein data were normalized to GAPDH protein levels.
Semi-quantitative IHC
Semi-quantitative IHC (sq-IHC) of 4-μm sections of
paraffin-embedded OSCC clinical specimens was performed. Briefly,
after paraffinization, hydration, activation of antigen, hydrogen
peroxide quenching, and blocking, the clinical sections were
incubated with rabbit anti-TMOD1 monoclonal antibody (Santa Cruz
Biotechnology) at 4°C in a moist chamber overnight. Upon incubation
with the primary antibody, the specimens were washed three times
with PBS and treated with EnVision reagent (Dako, Carpinteria, CA,
USA) followed by color development in 3,3′-diaminobenzidine
tetrahydrochloride (Dako). The slides then were counterstained
lightly with hematoxylin, dehydrated with ethanol, cleaned with
xylene and mounted. To quantify the status of the TMOD1 protein
expression in clinical samples, we used the sq-IHC scoring systems
previously described (28,34–37).
The mean percentages of positive tumoral cells were determined in
at least three random fields in each section; the intensities of
the TMOD1-immunoreactions were scored as follows: 0+, none; 1+,
weak; 2+, moderate; and 3+, intense. The staining intensity and the
numbers were multiplied to produce a TMOD1 sq-IHC score. To
determine the cut-off points of the TMOD1 sq-IHC scores, we
analyzed the OSCCs sq-IHC scores of 200 patients using receiver
operating characteristic (ROC) curves. Two independent pathologists
from Chiba University Hospital, neither of whom had knowledge of
the clinical status of the patients, made these judgments. To
calculate the 5-year survival rate, we followed-up each patient,
until death.
Prospective study
To evaluate the effect of the cut-off value from
RLNM by ROC curve analysis, we performed a prospective study using
40 primary OSCC specimens at Chiba University Hospital. We randomly
selected 40 primary OSCC specimens and analyzed the correlation
between RLNM and TMOD1 expression using sq-IHC.
Statistical analysis
To compare the TMOD1 expression levels, statistical
significance was evaluated using the Mann-Whitney U test. The
relationships between the TMOD1 sq-IHC scores and
clinicopathological profiles were evaluated using the Student's
t-test and the Mann-Whitney U test. The 5-year survival rate was
evaluated using the log-rank test. P<0.05 was considered
statistically significant. The data are expressed as the mean ± the
standard error of the mean.
Results
Upregulation of TMOD1 in OSCC-derived
cell lines
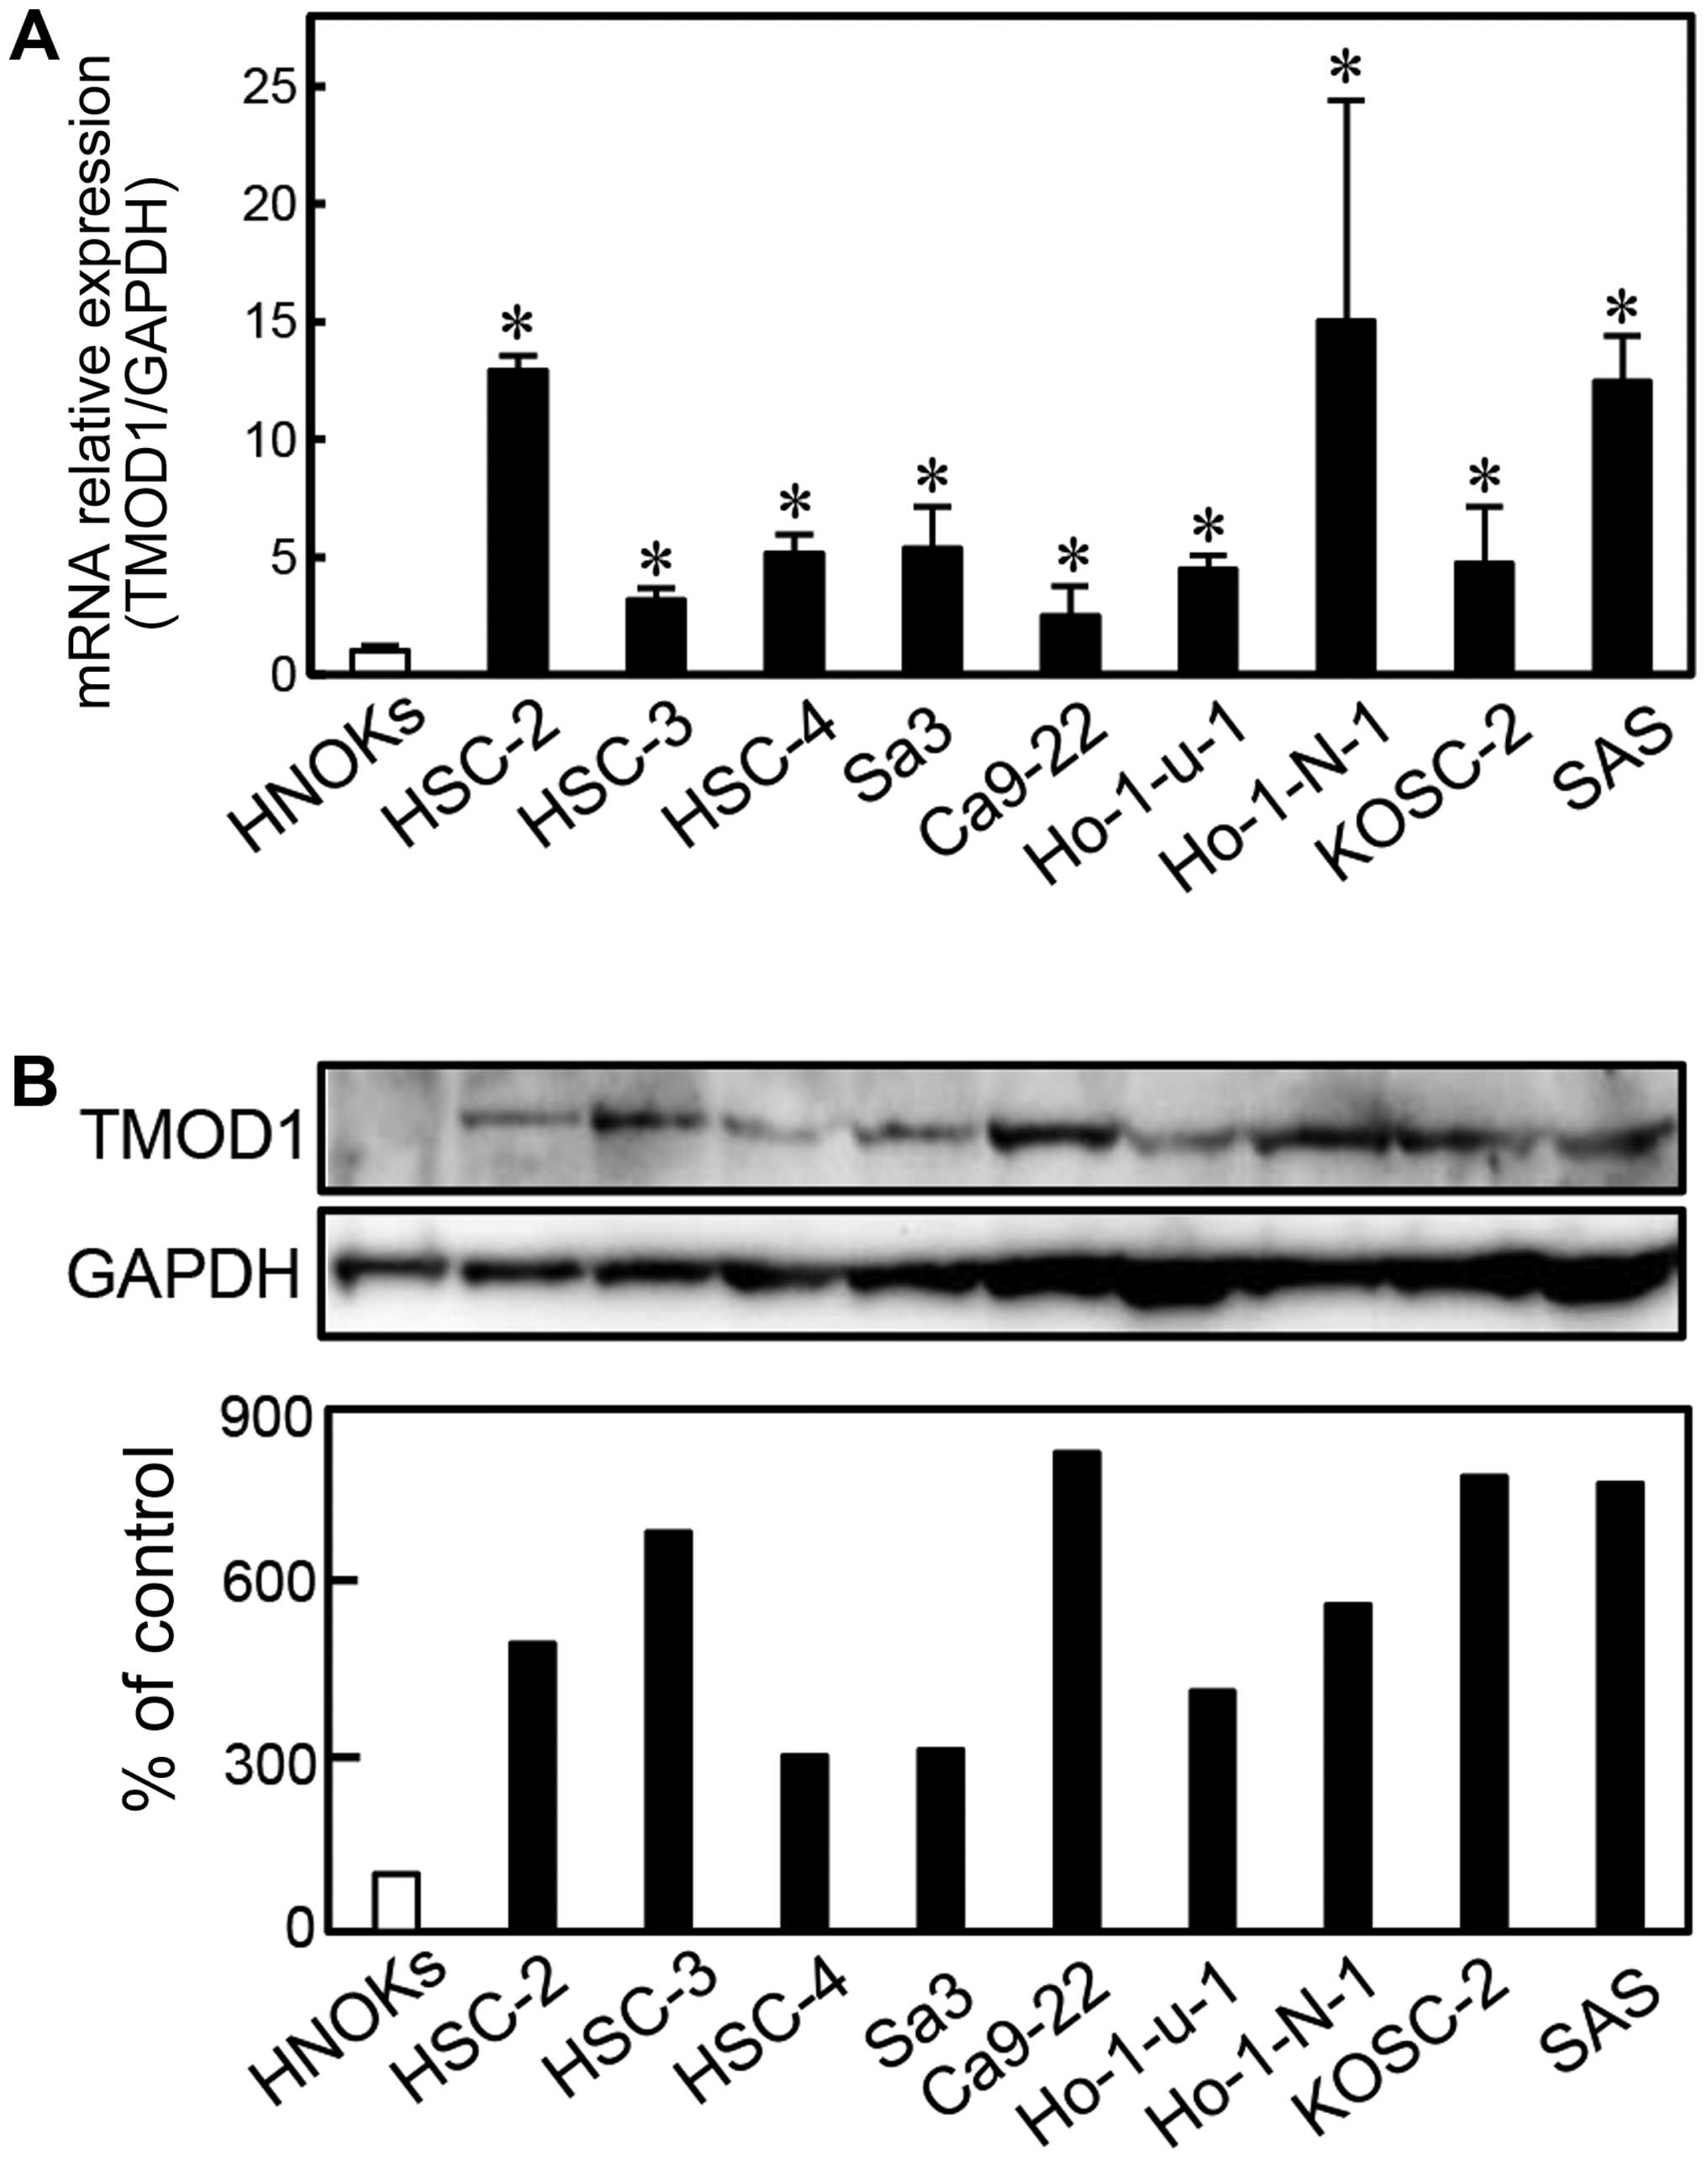
To investigate the expression status of TMOD1, we
performed qRT-PCR and immunoblotting analyses using 9 OSCC-derived
cell lines (HSC-2, HSC-3, HSC-4, Sa3, Ca9-22, Ho-1-u-1, Ho-1-N-1,
KOSC-2 and SAS) and HNOKs. TMOD1 mRNA was upregulated
significantly (P<0.05) in all OSCC-derived cell lines compared
with the HNOKs (Fig. 1A). We also
performed immunoblotting analysis to investigate the TMOD1 protein
expression in the OSCC-derived cell lines and the HNOKs (Fig. 1B). A significant increase in TMOD1
protein expression was seen in all OSCC-derived cell lines compared
with the HNOKs.
Evaluation of TMOD1 expression in primary
OSCCs
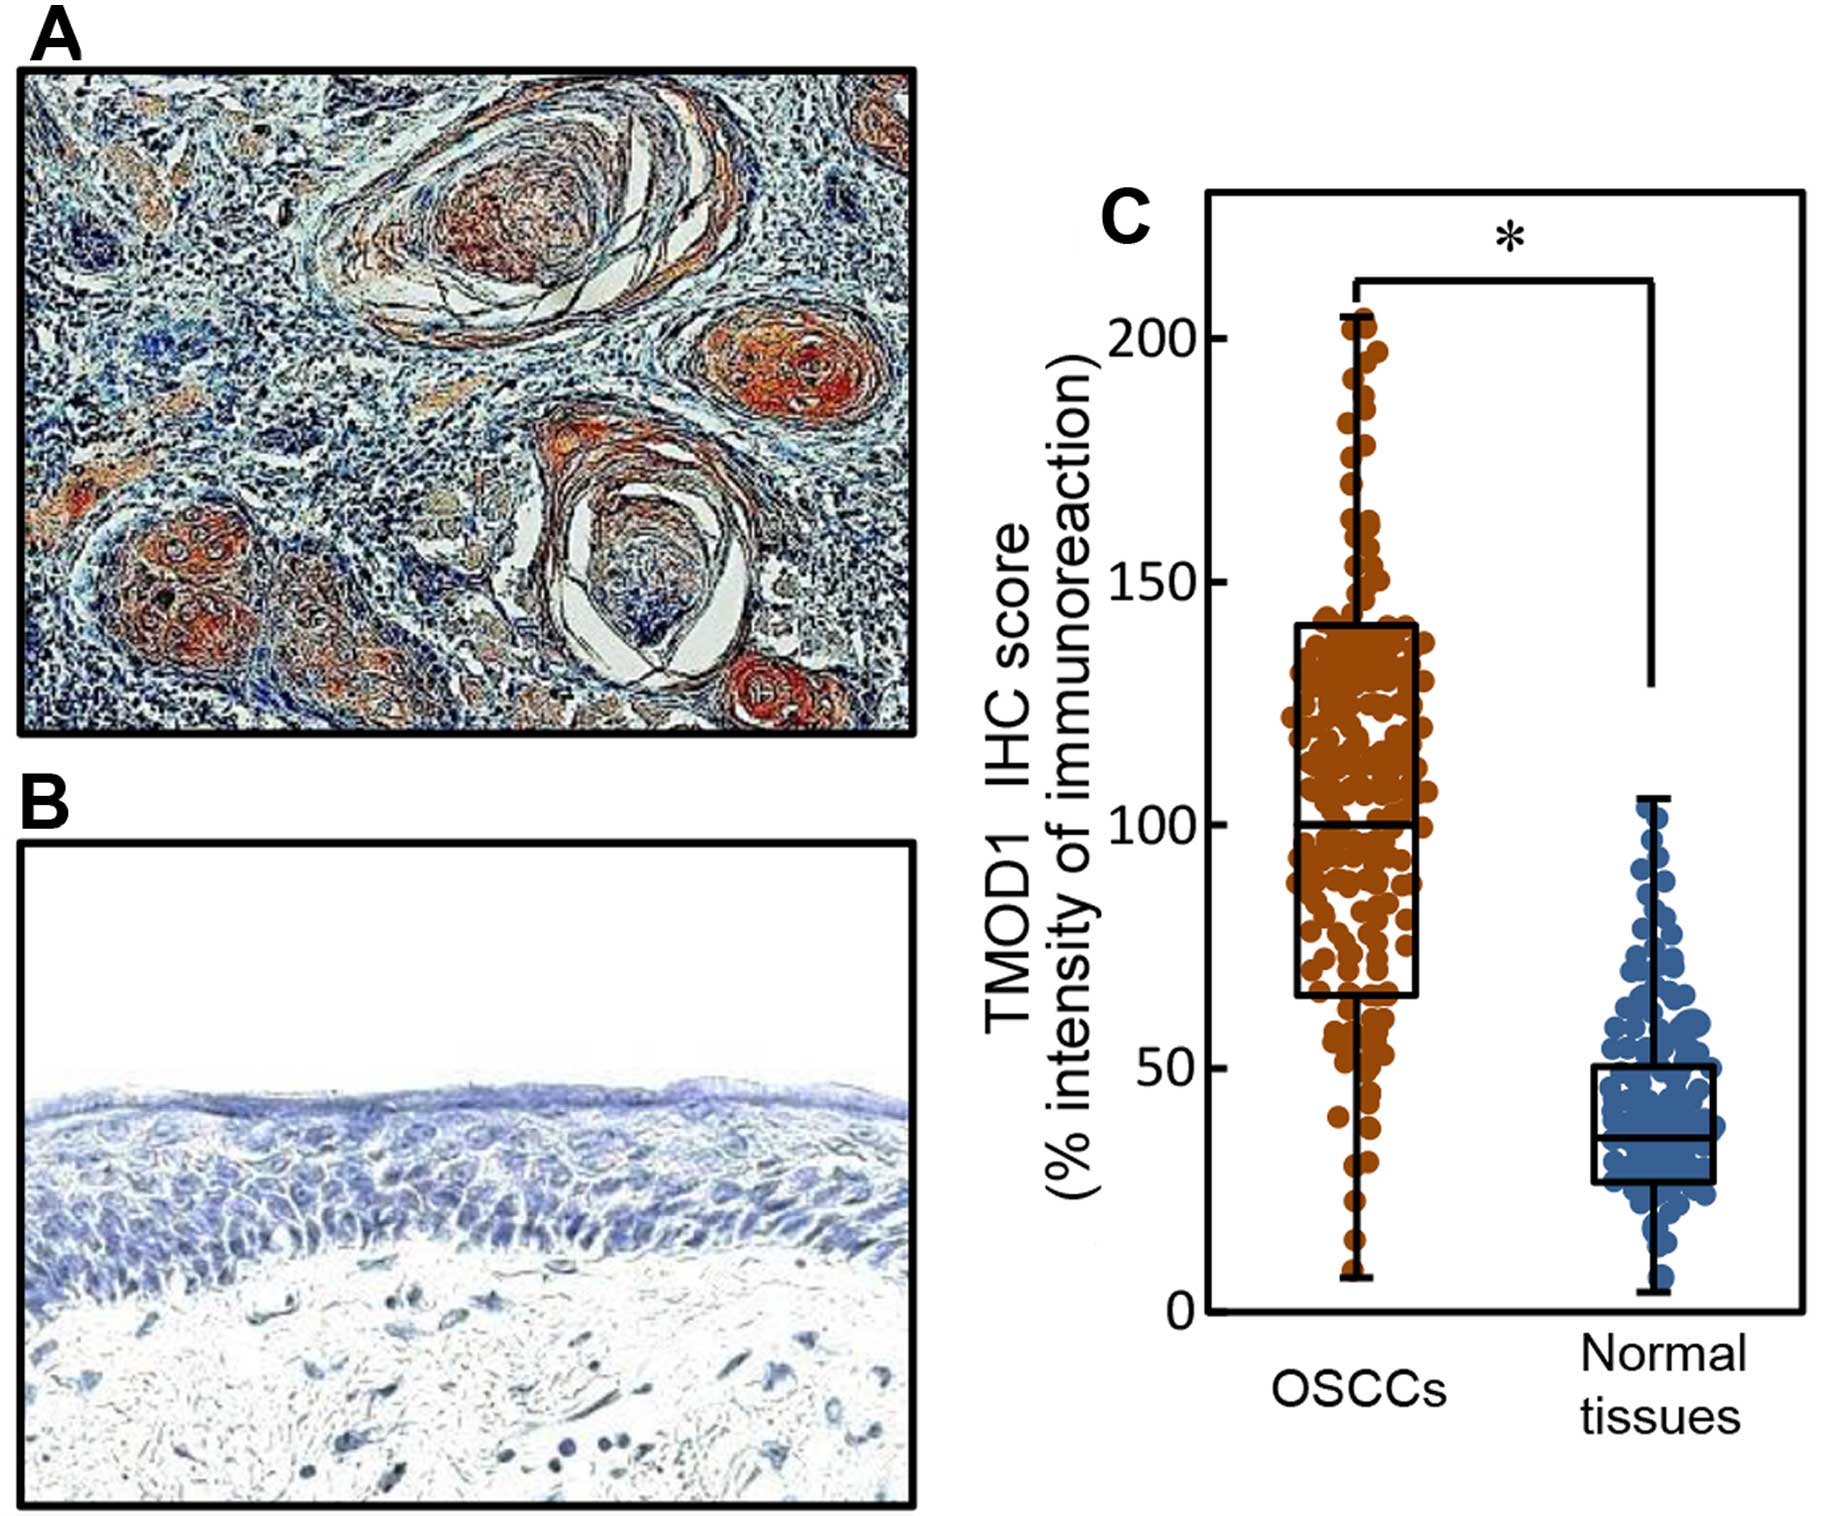
To investigate the expression status of TMOD1 in
primary OSCCs and the relation to the clinicopathological
characteristics, we analyzed the TMOD1 protein expression in
primary OSCC specimens from 200 patients (Table I) using the sq-IHC scoring system.
We showed representative IHC results for TMOD1 protein in primary
OSCCs (Fig. 2A) and normal oral
tissue (Fig. 2B). Strong TMOD1
immunoreactivity was detected in the cytoplasm of primary OSCCs;
however, normal oral tissue showed almost negative immunostaining.
The TMOD1 protein expression of primary OSCCs was significantly
(P<0.05) higher than in normal tissue (Fig. 2C). The TMOD1 sq-IHC scores in OSCCs
and adjacent normal oral tissues ranged from 204.44 to 7.00
(median, 100.00) and from 105.50 to 4.00 (median, 35.83),
respectively.
Evaluation of TMOD1 expression in primary
OSCCs by age at surgery, gender, primary tumoral size, histologic
type and vascular invasiveness
We did not find differences between TMOD1 protein
expression and the clinical parameters (Fig. 3) (age at surgery, P=0.181; gender,
P=0.417; primary tumoral size, P=0.057; histologic type, P=0.073;
or vascular invasion, P=0.558).
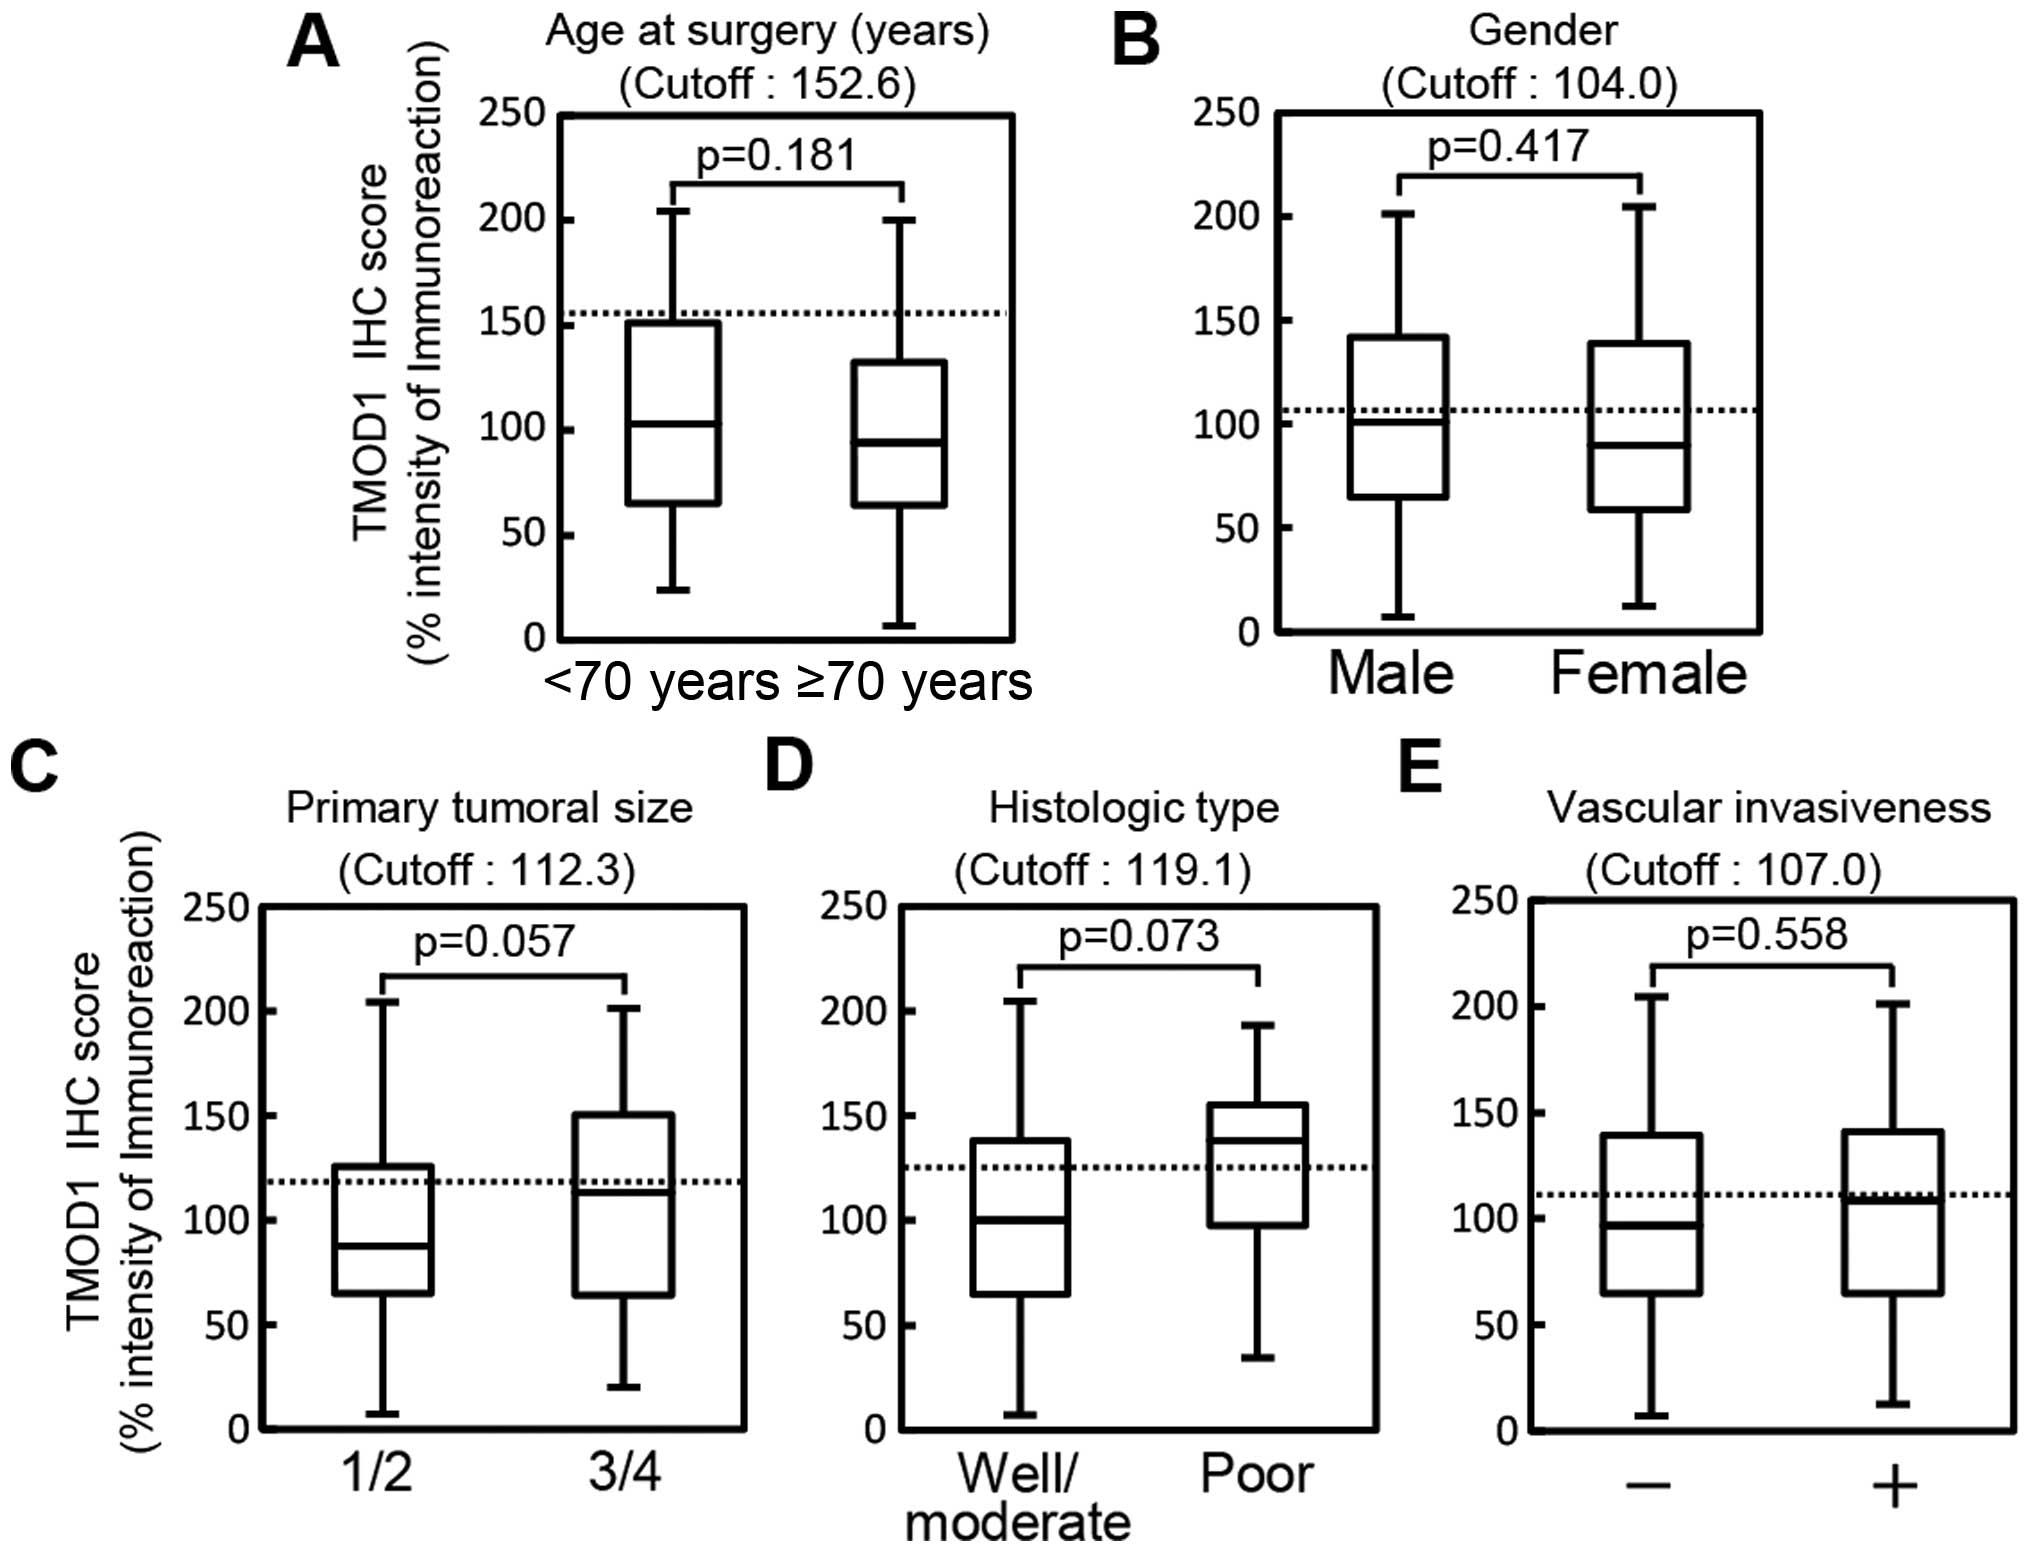 | Figure 3Evaluation of TMOD1 expression in
primary OSCCs by various clinical parameters. The evaluation of
TMOD1 expression based on the age at surgery shows that the optimal
cut-off point in the ROC curve analysis is 152.6 (AUC, 0.556; 95%
CI, 0.476–0.636; sensitivity, 88.8%; specificity, 25.5%). The TMOD1
OSCCs sq-IHC scores in patients under 70 years of age and over 70
years of age range from 204.44 to 24.00 (median, 103.00) and 200.00
to 7.00 (median, 94.00), respectively. The TMOD1 protein expression
in the primary OSCCs does not differ significantly (P=0.18,
Student's t-test) between the two age groups (A). Evaluation of
TMOD1 expression in primary OSCCs by gender shows that the optimal
cut-off point in the ROC curve analysis is 104.0 (AUC, 0.530; 95%
CI, 0.445–0.616; sensitivity, 47.7%; specificity, 61.2%). The TMOD1
OSCCs sq-IHC scores in males and females range from 201.17 to 7.00
(median, 101.00) and 204.44 to 12.50 (median, 89.92), respectively.
The TMOD1 protein expression in the primary OSCCs does not differ
significantly (p=0.417, Student's t-test) between males and females
(B). Evaluation of TMOD1 expression by primary tumoral size shows
that the optimal cut-off point in the ROC curve analysis is 112.3
(AUC, 0.578; 95% CI, 0.496–0.660; sensitivity, 70.7%; specificity,
52.4%). The TMOD1 OSCCs sq-IHC scores in T1/T2 and T3/T4 range from
204.44 to 7.00 (median, 87.46) and 201.67 to 20.00 (median,
113.13), respectively. The TMOD1 protein expression in the primary
OSCCs does not differ significantly (P=0.057, Student's t-test)
between T1/T2 and T3/T4 (C). Evaluation of TMOD1 expression in
primary OSCCs by histologic type shows that the optimal cut-off
point in the ROC curve analysis is 119.1 (AUC, 0.665; 95% CI,
0.489–0.841; sensitivity, 68.3%; specificity, 70.0%). The TMOD1
OSCCs sq-IHC scores in well/moderately differentiated OSCCs and
poorly differentiated OSCCs range from 204.44 to 7.00 (median,
100.00) and 193.17 to 34.50 (median, 138.14), respectively. The
TMOD1 protein expression in the primary OSCCs does not differ
significantly (P=0.073, Student's t-test) between well/moderately
differentiated OSCCs and poorly differentiated OSCCs (D).
Evaluation of TMOD1 expression in primary OSCCs by vascular
invasiveness shows that the optimal cut-off point in the ROC curve
analysis is 107.0 (AUC, 0.527; 95% CI, 0.437–0.618; sensitivity,
60.4%; specificity, 60.0%). The TMOD1 OSCCs sq-IHC scores
with/without vascular invasion range from 204.44 to 7.00 (median,
97.00) and 201.17 to 12.50 (median, 108.53), respectively. The
TMOD1 protein expression in the primary OSCCs does not differ
significantly (P=0.558, Student's t-test) with/without vascular
invasion (E). |
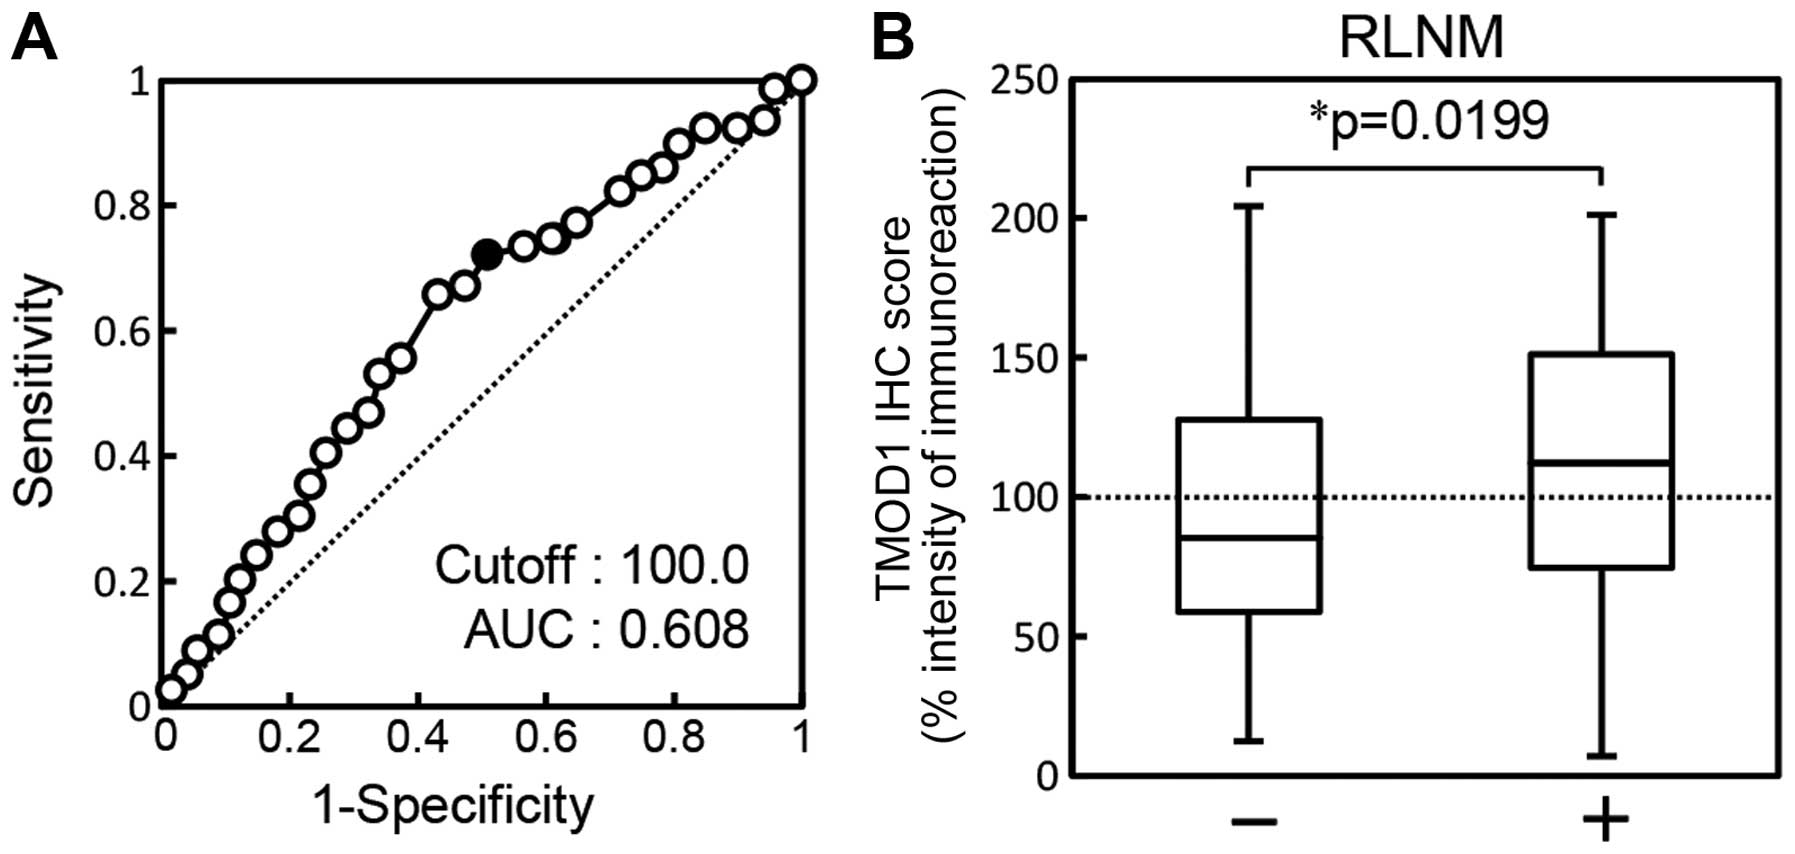
Evaluation of TMOD1 expression in primary
OSCCs by RLNM
The ROC curve analysis showed that the area under
the curve (AUC) was 0.608 [95% confidence interval (CI),
0.527–0.688; sensitivity, 65.8%; specificity, 57.5%] and the
cut-off value was 100.00 (Fig.
4A). The TMOD1 sq-IHC scores of the RLNM-negative patients and
RLNM-positive patients ranged from 204.44 to 12.50 (median, 85.48)
and from 201.17 to 7.00 (median, 112.16), respectively. TMOD1
protein expression of primary OSCCs with RLNM was significantly
(P=0.0199) higher than without RLNM (Fig. 4B).
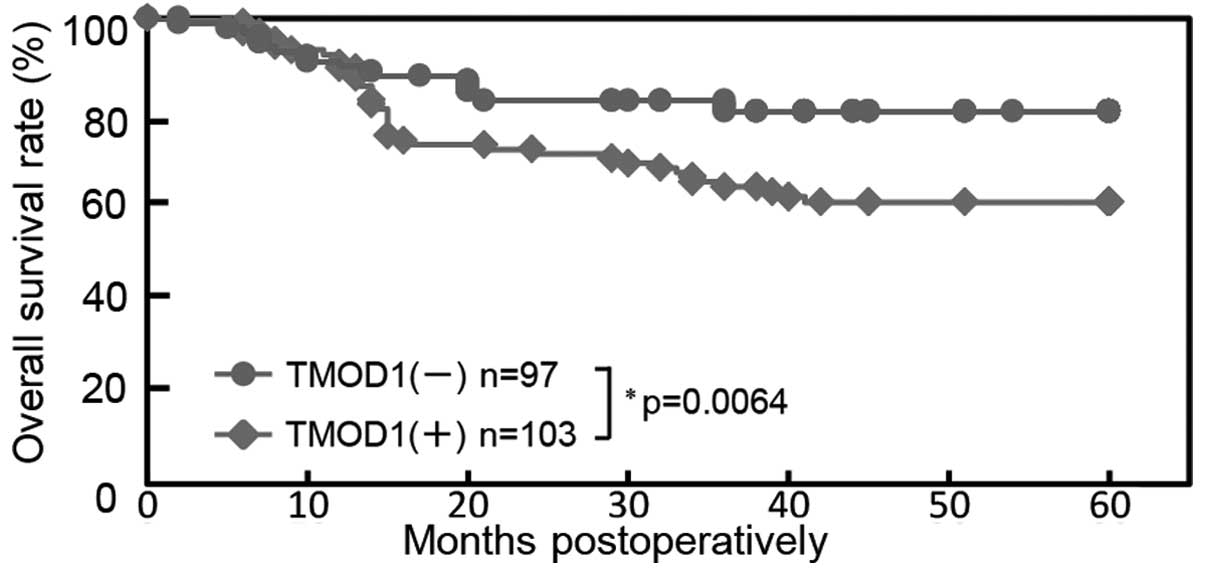
Evaluation of TMOD1 expression in primary
OSCCs with 5-year survival
Using the cut-off value from RLNM from ROC curve
analysis, the 5-year survival rates in the TMOD1-positive OSCCs
(n=103) and the TMOD1-negative OSCCs (n=97) were 60.4 and 79.9%,
respectively. The survival rates in the TMOD1-positive group were
significantly (P=0.0064) lower than those in the TMOD1-negative
group (Fig. 5).
Prospective study of TMOD1 expression in
primary OSCCs
To determine if the cut-off value of the TMOD1 IHC
scores from RLNM (Fig. 4) are
useful as a clinical indicator, we prospectively assessed the
correlation between RLNM and TMOD1 expression in 40 patients with
OSCC. High TMOD1 expression was seen in 12 (75%) of 16
RLNM-positive patients and 9 (37.5%) of 24 RLNM-negative patients.
Thus, TMOD1 expression was significantly (P=0.027) higher in the
RLNM-positive patients (Table
II).
| Table IIProspective study of TMOD1 expression
in primary OSCCs from 40 patients. |
Table II
Prospective study of TMOD1 expression
in primary OSCCs from 40 patients.
| RLNM (n=40) | |
|---|
|
| |
|---|
| Relative
expression | − (%) | + (%) | P-value |
|---|
| High TMOD1 | 9 (37.5) | 12 (75) | 0.027 |
| Low TMOD1 | 15 (62.5) | 4 (25) | |
| Total | 24 (100) | 16 (100) | |
Discussion
We found that TMOD1 was overexpressed frequently in
OSCC in vitro and in vivo (P<0.05; Figs. 1 and 2), and that TMOD1 expression in
RLNM-positive patients with OSCC was significantly (P<0.05)
greater than in RLNM-negative patients (Fig. 4). In addition, the survival rates
in the TMOD1-positive patients were significantly lower than in the
TMOD1-negative patients (Fig. 5).
In the prospective study, high TMOD1 expression was seen in 12
(75%) of 16 RLNM-positive patients and 9 (37.5%) of 24
RLNM-negative patients (Table
II).
OSCCs are characterized by a high degree of local
invasiveness and a high rate of RLNM in an early phase (38). A study reported recently that 37%
of patients with OSCC had RLNM (39). The 5-year survival rate in
RLNM-negative patients was 81%, whereas that in RLNM-positive
patients was 57% (39). Metastasis
represents a highly organized, non-random, organ-specific and
multistep process (40). Although
many molecules, such as integrins and matrix metalloproteinases
(MMPs), play key roles in cancer cell invasiveness and metastasis
(41–43), the precise factors and mechanisms
affecting its preferred migration and invasion into the regional
lymph nodes are poorly understood. Overexpression of TMOD1, a novel
target of NF-κB, induces the translocation of β-catenin to nucleus,
leading to activation of MMPs in triple-negative breast cancer
samples (23). Since NF-κB
signaling also relates to RLNM and tumor-induced lymphangiogenesis
(44), our hypothesis is that
TMOD1 may contribute to the cellular invasiveness and metastasis in
OSCCs through the NF-κB signaling.
In conclusion, the current results indicated that
TMOD1 is overexpressed frequently in human oral cancer. TMOD1
overexpression is associated with RLNM and the 5-year survival
rate. The prospective study also confirmed the correlation between
TMOD1 expression and RLNM. While further studies are needed to
study the NF-κB-TMOD1 axis in the cancer microenvironment, TMOD1
overexpression may directly affect tumoral metastasis in OSCCs, and
TMOD1 may be a critical biomarker of RLNM.
Acknowledgements
We thank Lynda C. Charters for editing this
manuscript.
References
|
1
|
Severino P, Alvares AM, Michaluart P Jr,
Okamoto OK, Nunes FD, Moreira-Filho CA and Tajara EH; Head and Neck
Genome Project GENCAPO. Global gene expression profiling of oral
cavity cancers suggests molecular heterogeneity within anatomic
subsites. BMC Res Notes. 1:1132008. View Article : Google Scholar : PubMed/NCBI
|
|
2
|
Yao M, Epstein JB, Modi BJ, Pytynia KB,
Mundt AJ and Feldman LE: Current surgical treatment of squamous
cell carcinoma of the head and neck. Oral Oncol. 43:213–223. 2007.
View Article : Google Scholar
|
|
3
|
Casiglia J and Woo SB: A comprehensive
review of oral cancer. Gen Dent. 49:72–82. 2001.
|
|
4
|
Takes RP: Staging of the neck in patients
with head and neck squamous cell cancer: Imaging techniques and
biomarkers. Oral Oncol. 40:656–667. 2004. View Article : Google Scholar : PubMed/NCBI
|
|
5
|
Karatzanis AD, Waldfahrer F, Psychogios G,
Hornung J, Zenk J, Velegrakis GA and Iro H: Resection margins and
other prognostic factors regarding surgically treated glottic
carcinomas. J Surg Oncol. 101:131–136. 2010.
|
|
6
|
Fan S, Tang QL, Lin YJ, Chen WL, Li JS,
Huang ZQ, Yang ZH, Wang YY, Zhang DM, Wang HJ, et al: A review of
clinical and histological parameters associated with contralateral
neck metastases in oral squamous cell carcinoma. Int J Oral Sci.
3:180–191. 2011. View Article : Google Scholar : PubMed/NCBI
|
|
7
|
Lea J, Bachar G, Sawka AM, Lakra DC,
Gilbert RW, Irish JC, Brown DH, Gullane PJ and Goldstein DP:
Metastases to level IIb in squamous cell carcinoma of the oral
cavity: A systematic review and meta-analysis. Head Neck.
32:184–190. 2010.
|
|
8
|
Okura M, Aikawa T, Sawai NY, Iida S and
Kogo M: Decision analysis and treatment threshold in a management
for the N0 neck of the oral cavity carcinoma. Oral Oncol.
45:908–911. 2009. View Article : Google Scholar : PubMed/NCBI
|
|
9
|
Greenberg JS, Fowler R, Gomez J, Mo V,
Roberts D, El Naggar AK and Myers JN: Extent of extracapsular
spread: A critical prognosticator in oral tongue cancer. Cancer.
97:1464–1470. 2003. View Article : Google Scholar : PubMed/NCBI
|
|
10
|
Sano D and Myers JN: Metastasis of
squamous cell carcinoma of the oral tongue. Cancer Metastasis Rev.
26:645–662. 2007. View Article : Google Scholar : PubMed/NCBI
|
|
11
|
Tanaka J, Irié T, Yamamoto G, Yasuhara R,
Isobe T, Hokazono C, Tachikawa T, Kohno Y and Mishima K: ANGPTL4
regulates the metastatic potential of oral squamous cell carcinoma.
J Oral Pathol Med. 44:126–133. 2015. View Article : Google Scholar
|
|
12
|
Lewis RA, Yamashiro S, Gokhin DS and
Fowler VM: Functional effects of mutations in the
tropomyosin-binding sites of tropomodulin1 and tropomodulin3.
Cytoskeleton Hoboken. 71:395–411. 2014. View Article : Google Scholar : PubMed/NCBI
|
|
13
|
Bliss KT, Tsukada T, Novak SM, Dorovkov
MV, Shah SP, Nworu C, Kostyukova AS and Gregorio CC:
Phosphorylation of tropomodulin1 contributes to the regulation of
actin filament architecture in cardiac muscle. FASEB J.
28:3987–3995. 2014. View Article : Google Scholar : PubMed/NCBI
|
|
14
|
Krieger I, Kostyukova A, Yamashita A,
Nitanai Y and Maéda Y: Crystal structure of the C-terminal half of
tropomodulin and structural basis of actin filament pointed-end
capping. Biophys J. 83:2716–2725. 2002. View Article : Google Scholar : PubMed/NCBI
|
|
15
|
Kostyukova A, Maeda K, Yamauchi E, Krieger
I and Maéda Y: Domain structure of tropomodulin: Distinct
properties of the N-terminal and C-terminal halves. Eur J Biochem.
267:6470–6475. 2000. View Article : Google Scholar : PubMed/NCBI
|
|
16
|
Kostyukova AS: Tropomodulins and
tropomodulin/tropomyosin interactions. Cell Mol Life Sci.
65:563–569. 2008. View Article : Google Scholar
|
|
17
|
Gregorio CC, Weber A, Bondad M, Pennise CR
and Fowler VM: Requirement of pointed-end capping by tropomodulin
to maintain actin filament length in embryonic chick cardiac
myocytes. Nature. 377:83–86. 1995. View
Article : Google Scholar : PubMed/NCBI
|
|
18
|
Tsukada T, Kotlyanskaya L, Huynh R, Desai
B, Novak SM, Kajava AV, Gregorio CC and Kostyukova AS:
Identification of residues within tropomodulin-1 responsible for
its localization at the pointed ends of the actin filaments in
cardiac myocytes. J Biol Chem. 286:2194–2204. 2011. View Article : Google Scholar :
|
|
19
|
Fowler VM, Greenfield NJ and Moyer J:
Tropomodulin contains two actin filament pointed end-capping
domains. J Biol Chem. 278:40000–40009. 2003. View Article : Google Scholar : PubMed/NCBI
|
|
20
|
Greenfield NJ, Kostyukova AS and
Hitchcock-DeGregori SE: Structure and tropomyosin binding
properties of the N-terminal capping domain of tropomodulin 1.
Biophys J. 88:372–383. 2005. View Article : Google Scholar
|
|
21
|
Kostyukova AS, Choy A and Rapp BA:
Tropomodulin binds two tropomyosins: A novel model for actin
filament capping. Biochemistry. 45:12068–12075. 2006. View Article : Google Scholar : PubMed/NCBI
|
|
22
|
Kostyukova AS, Rapp BA, Choy A, Greenfield
NJ and Hitchcock-DeGregori SE: Structural requirements of
tropomodulin for tropomyosin binding and actin filament capping.
Biochemistry. 44:4905–4910. 2005. View Article : Google Scholar : PubMed/NCBI
|
|
23
|
Ito-Kureha T, Koshikawa N, Yamamoto M,
Semba K, Yamaguchi N, Yamamoto T, Seiki M and Inoue J: Tropomodulin
1 expression driven by NF-κB enhances breast cancer growth. Cancer
Res. 75:62–72. 2015. View Article : Google Scholar
|
|
24
|
Agnelli L, Mereu E, Pellegrino E, Limongi
T, Kwee I, Bergaggio E, Ponzoni M, Zamò A, Iqbal J, Piccaluga PP,
et al; European T-Cell Lymphoma Study Group. Identification of a
3-gene model as a powerful diagnostic tool for the recognition of
ALK-negative anaplastic large-cell lymphoma. Blood. 120:1274–1281.
2012. View Article : Google Scholar : PubMed/NCBI
|
|
25
|
Kasamatsu A, Uzawa K, Nakashima D, Koike
H, Shiiba M, Bukawa H, Yokoe H and Tanzawa H: Galectin-9 as a
regulator of cellular adhesion in human oral squamous cell
carcinoma cell lines. Int J Mol Med. 16:269–273. 2005.PubMed/NCBI
|
|
26
|
Endo Y, Uzawa K, Mochida Y, Shiiba M,
Bukawa H, Yokoe H and Tanzawa H: Sarcoendoplasmic reticulum
Ca2+ ATPase type 2 downregulated in human oral squamous
cell carcinoma. Int J Cancer. 110:225–231. 2004. View Article : Google Scholar : PubMed/NCBI
|
|
27
|
Sakuma K, Kasamatsu A, Yamatoji M, Yamano
Y, Fushimi K, Iyoda M, Ogoshi K, Shinozuka K, Ogawara K, Shiiba M,
et al: Expression status of Zic family member 2 as a prognostic
marker for oral squamous cell carcinoma. J Cancer Res Clin Oncol.
136:553–559. 2010. View Article : Google Scholar
|
|
28
|
Yamatoji M, Kasamatsu A, Kouzu Y, Koike H,
Sakamoto Y, Ogawara K, Shiiba M, Tanzawa H and Uzawa K:
Dermatopontin: A potential predictor for metastasis of human oral
cancer. Int J Cancer. 130:2903–2911. 2012. View Article : Google Scholar
|
|
29
|
Pindborg J, Reichart P, Smith C and Van
der Waal I: Histological Typing of Cancer and Precancer of the Oral
Mucosa. 2nd edition. Springer-Verlag; Berlin: 1997, View Article : Google Scholar
|
|
30
|
Sobin LH, Gospodarowicz MK and Wittekind
C: TNM Classification of Malignant Tumours. 7th edition. John Wiley
& Sons; 2011
|
|
31
|
Shimizu F, Shiiba M, Ogawara K, Kimura R,
Minakawa Y, Baba T, Yokota S, Nakashima D, Higo M, Kasamatsu A, et
al: Overexpression of LIM and SH3 protein 1 leading to accelerated
G2/M phase transition contributes to enhanced tumourigenesis in
oral cancer. PLoS One. 8:e831872013. View Article : Google Scholar
|
|
32
|
Iyoda M, Kasamatsu A, Ishigami T,
Nakashima D, Endo-Sakamoto Y, Ogawara K, Shiiba M, Tanzawa H and
Uzawa K: Epithelial cell transforming sequence 2 in human oral
cancer. PLoS One. 5:e140822010. View Article : Google Scholar : PubMed/NCBI
|
|
33
|
Baba T, Sakamoto Y, Kasamatsu A, Minakawa
Y, Yokota S, Higo M, Yokoe H, Ogawara K, Shiiba M, Tanzawa H, et
al: Persephin: A potential key component in human oral cancer
progression through the RET receptor tyrosine
kinase-mitogen-activated protein kinase signaling pathway. Mol
Carcinog. 54:608–617. 2013. View
Article : Google Scholar
|
|
34
|
Minakawa Y, Kasamatsu A, Koike H, Higo M,
Nakashima D, Kouzu Y, Sakamoto Y, Ogawara K, Shiiba M, Tanzawa H,
et al: Kinesin family member 4A: A potential predictor for
progression of human oral cancer. PLoS One. 8:e859512013.
View Article : Google Scholar
|
|
35
|
Lombardi DP, Geradts J, Foley JF, Chiao C,
Lamb PW and Barrett JC: Loss of KAI1 expression in the progression
of colorectal cancer. Cancer Res. 59:5724–5731. 1999.PubMed/NCBI
|
|
36
|
Shimada K, Uzawa K, Kato M, Endo Y, Shiiba
M, Bukawa H, Yokoe H, Seki N and Tanzawa H: Aberrant expression of
RAB1A in human tongue cancer. Br J Cancer. 92:1915–1921. 2005.
View Article : Google Scholar : PubMed/NCBI
|
|
37
|
Kouzu Y, Uzawa K, Koike H, Saito K,
Nakashima D, Higo M, Endo Y, Kasamatsu A, Shiiba M, Bukawa H, et
al: Overexpression of stathmin in oral squamous-cell carcinoma:
Correlation with tumour progression and poor prognosis. Br J
Cancer. 94:717–723. 2006.PubMed/NCBI
|
|
38
|
Maula S-M, Luukkaa M, Grénman R, Jackson
D, Jalkanen S and Ristamäki R: Intratumoral lymphatics are
essential for the metastatic spread and prognosis in squamous cell
carcinomas of the head and neck region. Cancer Res. 63:1920–1926.
2003.PubMed/NCBI
|
|
39
|
Kim SY, Nam SY, Choi SH, Cho KJ and Roh
JL: Prognostic value of lymph node density in node-positive
patients with oral squamous cell carcinoma. Ann Surg Oncol.
18:2310–2317. 2011. View Article : Google Scholar : PubMed/NCBI
|
|
40
|
Nicolson GL: Paracrine and autocrine
growth mechanisms in tumor metastasis to specific sites with
particular emphasis on brain and lung metastasis. Cancer Metastasis
Rev. 12:325–343. 1993. View Article : Google Scholar : PubMed/NCBI
|
|
41
|
Thomas GJ, Lewis MP, Hart IR, Marshall JF
and Speight PM: AlphaVbeta6 integrin promotes invasion of squamous
carcinoma cells through up-regulation of matrix
metalloproteinase-9. Int J Cancer. 92:641–650. 2001. View Article : Google Scholar : PubMed/NCBI
|
|
42
|
Ylipalosaari M, Thomas GJ, Nystrom M,
Salhimi S, Marshall JF, Huotari V, Tervahartiala T, Sorsa T and
Salo T: αvβ6 integrin down-regulates the MMP-13 expression in oral
squamous cell carcinoma cells. Exp Cell Res. 309:273–283. 2005.
View Article : Google Scholar : PubMed/NCBI
|
|
43
|
Ramos DM, But M, Regezi J, Schmidt BL,
Atakilit A, Dang D, Ellis D, Jordan R and Li X: Expression of
integrin β6 enhances invasive behavior in oral squamous cell
carcinoma. Matrix Biol. 21:297–307. 2002. View Article : Google Scholar : PubMed/NCBI
|
|
44
|
Su C, Chen Z, Luo H, Su Y, Liu W, Cai L,
Wang T, Lei Y and Zhong B: Different patterns of NF-kappaB and
Notch1 signaling contribute to tumor-induced lymphangiogenesis of
esophageal squamous cell carcinoma. J Exp Clin Cancer Res.
30:852011. View Article : Google Scholar
|