Introduction
Colorectal cancer (CRC) is one of the leading causes
of death in western countries (1),
and the incidence is still increasing. Approximately 70% of
patients with CRC are >65 years while the disease is rare under
the age of 45 (2). Advancements in
surgery and perioperative therapies have significantly improved the
survival rate in patients with CRC (3). However, the possibility of tumor
recurrence remains high even after surgical therapy and it depends
on the stage of cancer at the time of diagnosis. Recently,
molecular targeting, a novel therapeutic strategy, has been widely
researched and applied in the treatment of CRC.
Ribosomal proteins (RPs) play an important role in
forming the majority of cellular proteins and are considered to be
indispensable for cell growth (4).
RP genes have been linked, either directly or indirectly, to
various diseases including cancer. Eukaryotic ribosomes are
composed of ~79 different ribosomal proteins (5). Even though the functions of RPs have
not been fully investigated, quantitative deficiencies of RP genes
have been suggested to contribute to the growth retardation and
abnormalities (6,7). Ribosomal protein S15A (RPS15A) is a
highly conserved 40S ribosomal protein which promotes the binding
of capped mRNA to the small ribosomal subunit at the early stages
of translation (8). RPS15A is
found to be a responsive gene of transforming growth factor beta
(TGF-β) (9). In addition, RPS15A
has been reported to promote cell division in actively dividing
tissues. In humans, the expression of RPS15A is closely related
with cancer progression. Accumulated evidence shows that RPS15A
could stimulate cell growth and proliferation in hepatocellular
carcinoma (10) and lung
adenocarcinoma (11). However, its
prognostic significance in CRC remains unclear and there is scarce
previous information concerning the possible role of RPS15A in
human CRC.
In our pilot project, in a lentivirus-based
screening of CRC related genes, we identified RPS15A as a potential
oncogene in CRC. To further demonstrate the hypothesis, we first
studied the correlation between RPS15A expression and the
clinicopathological features and prognosis in CRC patients, and
then investigated the effects and possible mechanisms of RNAi
mediated RPS15A gene knockdown on CRC cells.
Materials and methods
Patient tissues and cell lines
Tumor tissues and their corresponding normal tissues
from 200 consecutive patients were prepared for
immunohistochemistry (IHC) assay. According to the criteria of the
World Health Organization classification, the tumor-node-metastasis
(TNM) stage was determined. All specimens were collected at the
Department of General Surgery, Zhongshan Hospital, Fudan University
in Shanghai between January 2008 and December 2009. All patients
were then followed-up. All participants provided written informed
consent. The present study was approved by the ethics committee of
the Zhongshan Hospital, Fudan University.
Human CRC cell lines DLD-1, HCT116, HT-29, RKO,
SW1116, SW480 and human embryonic kidney cell line HEK293T were
obtained from the Cell Bank of Chinese Academy of Sciences
(Shanghai, China). DLD-1, RKO, SW1116 and SW480 cells were
maintained in RPMI-1640 medium (Hyclone Laboratories, Logan, UT,
USA) supplemented with 10% heat inactivated fetal bovine serum
(FBS). HCT116 and HT-29 cells were maintained in McCoy's 5A (Sigma)
supplemented with 10% heat inactivated FBS. HEK293T cells were
cultured in Dulbecco's modified Eagle's medium (DMEM; HyClone
Laboratories) supplemented with 10% heat inactivated FBS. All cells
were incubated at 37°C in humidified atmosphere of 5%
CO2.
Immunohistochemistry (IHC)
For formalin-fixed paraffin-embedded (FFPE) tissue
sections, Histostain-Plus 3rd Gen IHC detection kit (85-9073;
Invitrogen, Carlsbad, CA, USA) was used to perform IHC assay
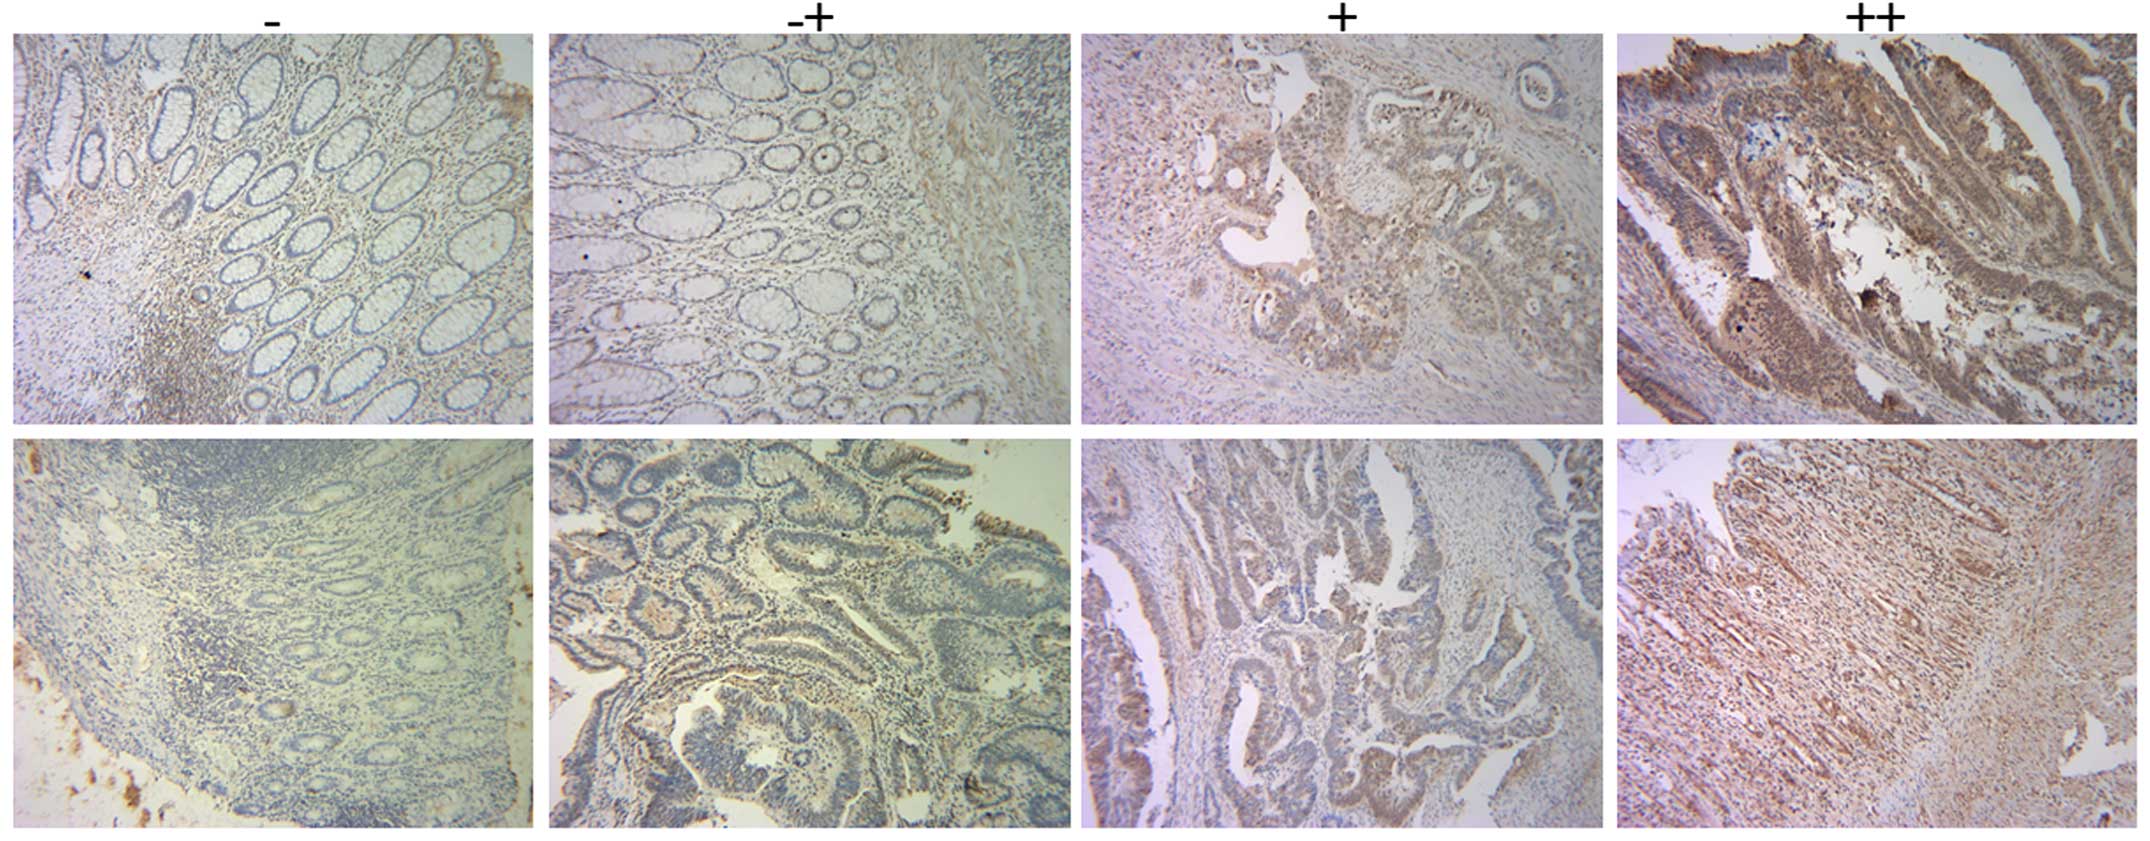
according to the manufacturer's instructions. IHC score was used to
evaluate RPS15A expression in these tissues. IHC score was
calculated as the multiplication product of two independent scores:
the proportion of positive tumor cells in the tissues as 0 (0%), 1
(0–20%), 2 (20–60%), 3 (60–100%), respectively; and the score of
the intensity of positive tumor cells in the tumor tissues as 0
(negative), 1 (yellow), 2 (faint yellow), 3 (reddish brown),
respectively. For IHC score, the cut-off for the definition of
high/low expression subgroups was the median value.
Lentivirus vectors construction and
infection
To silence RPS15A expression, two short hairpin
(shRNA) sequences were identified to target human RPS15A gene
(NM_001019). The shRNA sequences are S1,
5′-GTGCAACTCAAAGACCTGGAACTCGAGTTCCAGGTCTTTGAGTTGCACTTTTT-3′ and S2,
5′-GCATGGTTACATTGGCGAATTCTCGAGAATTCGCCAATGTAACCATGCTTTTT-3′. The
non-silencing shRNA
(5′-GCGGAGGGTTTGAAAGAATATCTCGAGATATTCTTTCAAACCCTCCGCTTTTTT-3′) was
used as control. The stem-loop-stem oligos were synthesized,
annealed, and ligated into the NheI/PacI-linearized
pFH-L vector (Shanghai Hollybio, Shanghai, China). The
reconstructed pFH-L-shRPS15A and pFH-L-shCon vectors were
co-transfected into HEK293T cells with packing helper plasmid
spVSVG-I and pCMVΔR8.92 (Shanghai Hollybio) to generate
lentiviruses. After 96-h incubation, the lentiviral particles were
harvested from the supernatant by ultracentrifugation. The RNAi
lentiviruses were referred as Lv-shRPS15A (KD) for specific RPS15A
gene knockdown and Lv-shCon (NC) for control. For lentiviral
transduction, HCT116 cells (8×10⁴ cells/well) and DLD-1
cells (5×10⁴ cells/well) were seeded onto 6-well plates
and incubated with NC or KD for 96 h, respectively, with a
replacement of media 24 h after lentivirus transduction.
RNA extraction and real-time PCR
analysis
After 96-h incubation, total RNA was isolated from
cultured cells by the TRIzol® reagent, and cDNA was
synthesized from the extracted RNA using Promega M-MLV cDNA
synthesis kit according to the manufacturer's instructions. RPS15A
mRNA level was evaluated by real-time PCR using the SYBR Premix Ex
Taq™ Perfect Real-Time (Takara Bio, Shiga, Japan) on an ABI PRISM
7500 Real-Time system. β-actin gene was applied as the input
reference. The primers used for real-time PCR are listed as
follows: RPS15A-forward, 5′-TGACGTGCAACTCAAAGACC-3′ and
RPS15A-reverse, 5′-CCAGAGTCCATGAGGCATTT-3′; DUSP6-forward,
5′-CAGCGACTGGAACGAGAATAC-3′ and DUSP6-reverse,
5′-ACTCGATGTCCGAGGAAGAGT-3′; p38-forward,
5′-GCTTGCGACTCACAGGATTG-3′ and p38-reverse,
5′-GAGAAATTGCCCTCTGAACCC-3′; p53-forward,
5′-CACACCCTGGAGGATTTCATC-3′ and p53-reverse,
5′-GGGCAACAAAGCGAGACC-3′; 14-3-3α-forward,
5′-AAGAGCGAAACCTGCTCTCA-3′ and 14-3-3α-reverse,
5′-CTCCACCTTCTCCCGGTACT-3′; CDK1-forward, 5′-TG
GAGTTGTGTATAAGGGTAGAC-3′ and CDK1-reverse,
5′-GATGACGAAGTTCCTTTAATAGAG-3′; p21-forward,
5′-TCCAGCGACCTTCCTCATCC-3′ and p21-reverse,
5′-CATAGCCTCTACTGCCACCATC-3′; CDK6-forward,
5′-TACCCTCTCTGCTGCTTTCAA-3′ and CDK6-reverse,
5′-TGTGCTACTCATTTTGCTCACC-3′; KRAS-forward,
5′-TGTCATCTTGCCTCCCTACC-3′ and KRAS-reverse,
5′-TTCTCTTGAGCCCTGAGGAA-3′; β-actin-forward,
5′-GTGGACATCCGCAAAGAC-3′ and β-actin-reverse,
5′-AAAGGGTGTAACGCAACTA-3′.
The relative mRNA levels of these genes were
calculated using the 2−Δ Δ Ct method.
Western blot analysis
Lentivirus-transduced cells were washed twice with
ice-cold PBS and lysed in 2X SDS sample buffer (10 mM EDTA, 4% SDS,
10% Glycine in 100 mM Tris-HCl buffer, pH 6.8) at 4°C and boiled
for 5 min. The cell lysate was then centrifuged at 12,000 rpm for
15 min at 4°C and the supernatant was collected and preserved at
−80°C prior to use. The protein concentration was determined using
the BCA protein assay kit. Equal amount of proteins (30 μg) were
loaded and separated on 10% SDS-PAGE gels and transferred onto PVDF
membranes (Millipore). Proteins were probed overnight at 4°C with
the indicated primary antibodies, followed by incubation with
horseradish peroxidase-conjugated second antibodies (Santa Cruz
Biotechnology) at room temperature for 1 h. Immunoreactivity was
developed with enhanced chemiluminescent autoradiography (ECL kit;
Amersham Biosciences).
Cell viability assay
Cell proliferation was assessed using a colorimetric
assay with 3-(4,5-dimethylthiazol-2-yl)-2, 5-diphenyltetrazolium
bromide (MTT). After infection for 4 days, HCT116 cells
(2.5×10³ cells/well) and DLD-1 cells (3×10³
cells/well) were seeded onto 96-well plates and incubated at 37°C
in 5 consecutive days. At each time-point, 20 μl of MTT solution (5
mg/ml) was added to each well and incubated at 37°C for 4 h. Then,
100 μl of acidified isopropanol (10% SDS, 5% isopropanol and 0.01
mol/l HCl) was added. The absorbance of each plate was measured at
595 nm using a spectrophotometer (Biotek Epoch; BioTek Instruments,
Inc., Winooski, VT, USA).
Colony formation assay
In vitro tumorigenicity was determined on the
basis of cell growth in a plate colony formation assay. After
infection for 5 days, HCT116 and DLD-1 cells (400 cells/well) were
seeded onto 6-well plates and incubated at 37°C for 7 days,
respectively. The culture medium was changed every 2–3 days. When
the colonies were formed, cells were washed and fixed, stained with
crystal purple for 20 min, and washed 3 times with
ddH2O, sequentially. The number of colonies (>50
cells/colony) was counted using Colony Counter software. The
morphology and size of the colonies was examined under a light
microscope.
Cell cycle analysis
The cell cycle distribution (sub-G1, G0/G1, S or
G2/M phase) was characterized by different DNA contents via flow
cytometry. Lentivirus-transduced cells were collected by
centrifugation at 1,500 rpm for 5 min, washed with PBS, and were
fixed in 70% ice-cold ethanol solution. Then, the fixed cells were
resuspended in a propidium iodide (PI)/RNase/PBS buffer for
incubation in dark at 37°C for 30 min. The stained cells were
analyzed by a FACSCalibur II sorter and CellQuest FACS system (BD
Biosciences, San Diego, CA, USA). The percentage of cells in each
stage was analyzed.
Statistical analysis
In cytological experiments, all data were expressed
as mean ± SD of three independent experiments performed in
triplicate. Statistical significance was conducted with the
Student's t-test using SPSS 16.0 software. The Cramer's V in
Pearson's chi-squared test was used to analyze the correlations
between the RPS15A expression and the clinicopathological
parameters. Kaplan-Meier model was utilized to perform survival
curves and log-rank test was used to evaluate the intergroup
differences. The Cox hazard model was performed to identify the
independent factors for poor prognosis of CRC patients. P<0.05
was considered to indicate a statistically significant result.
Results
RPS15A expression in CRC and
corresponding normal tissues
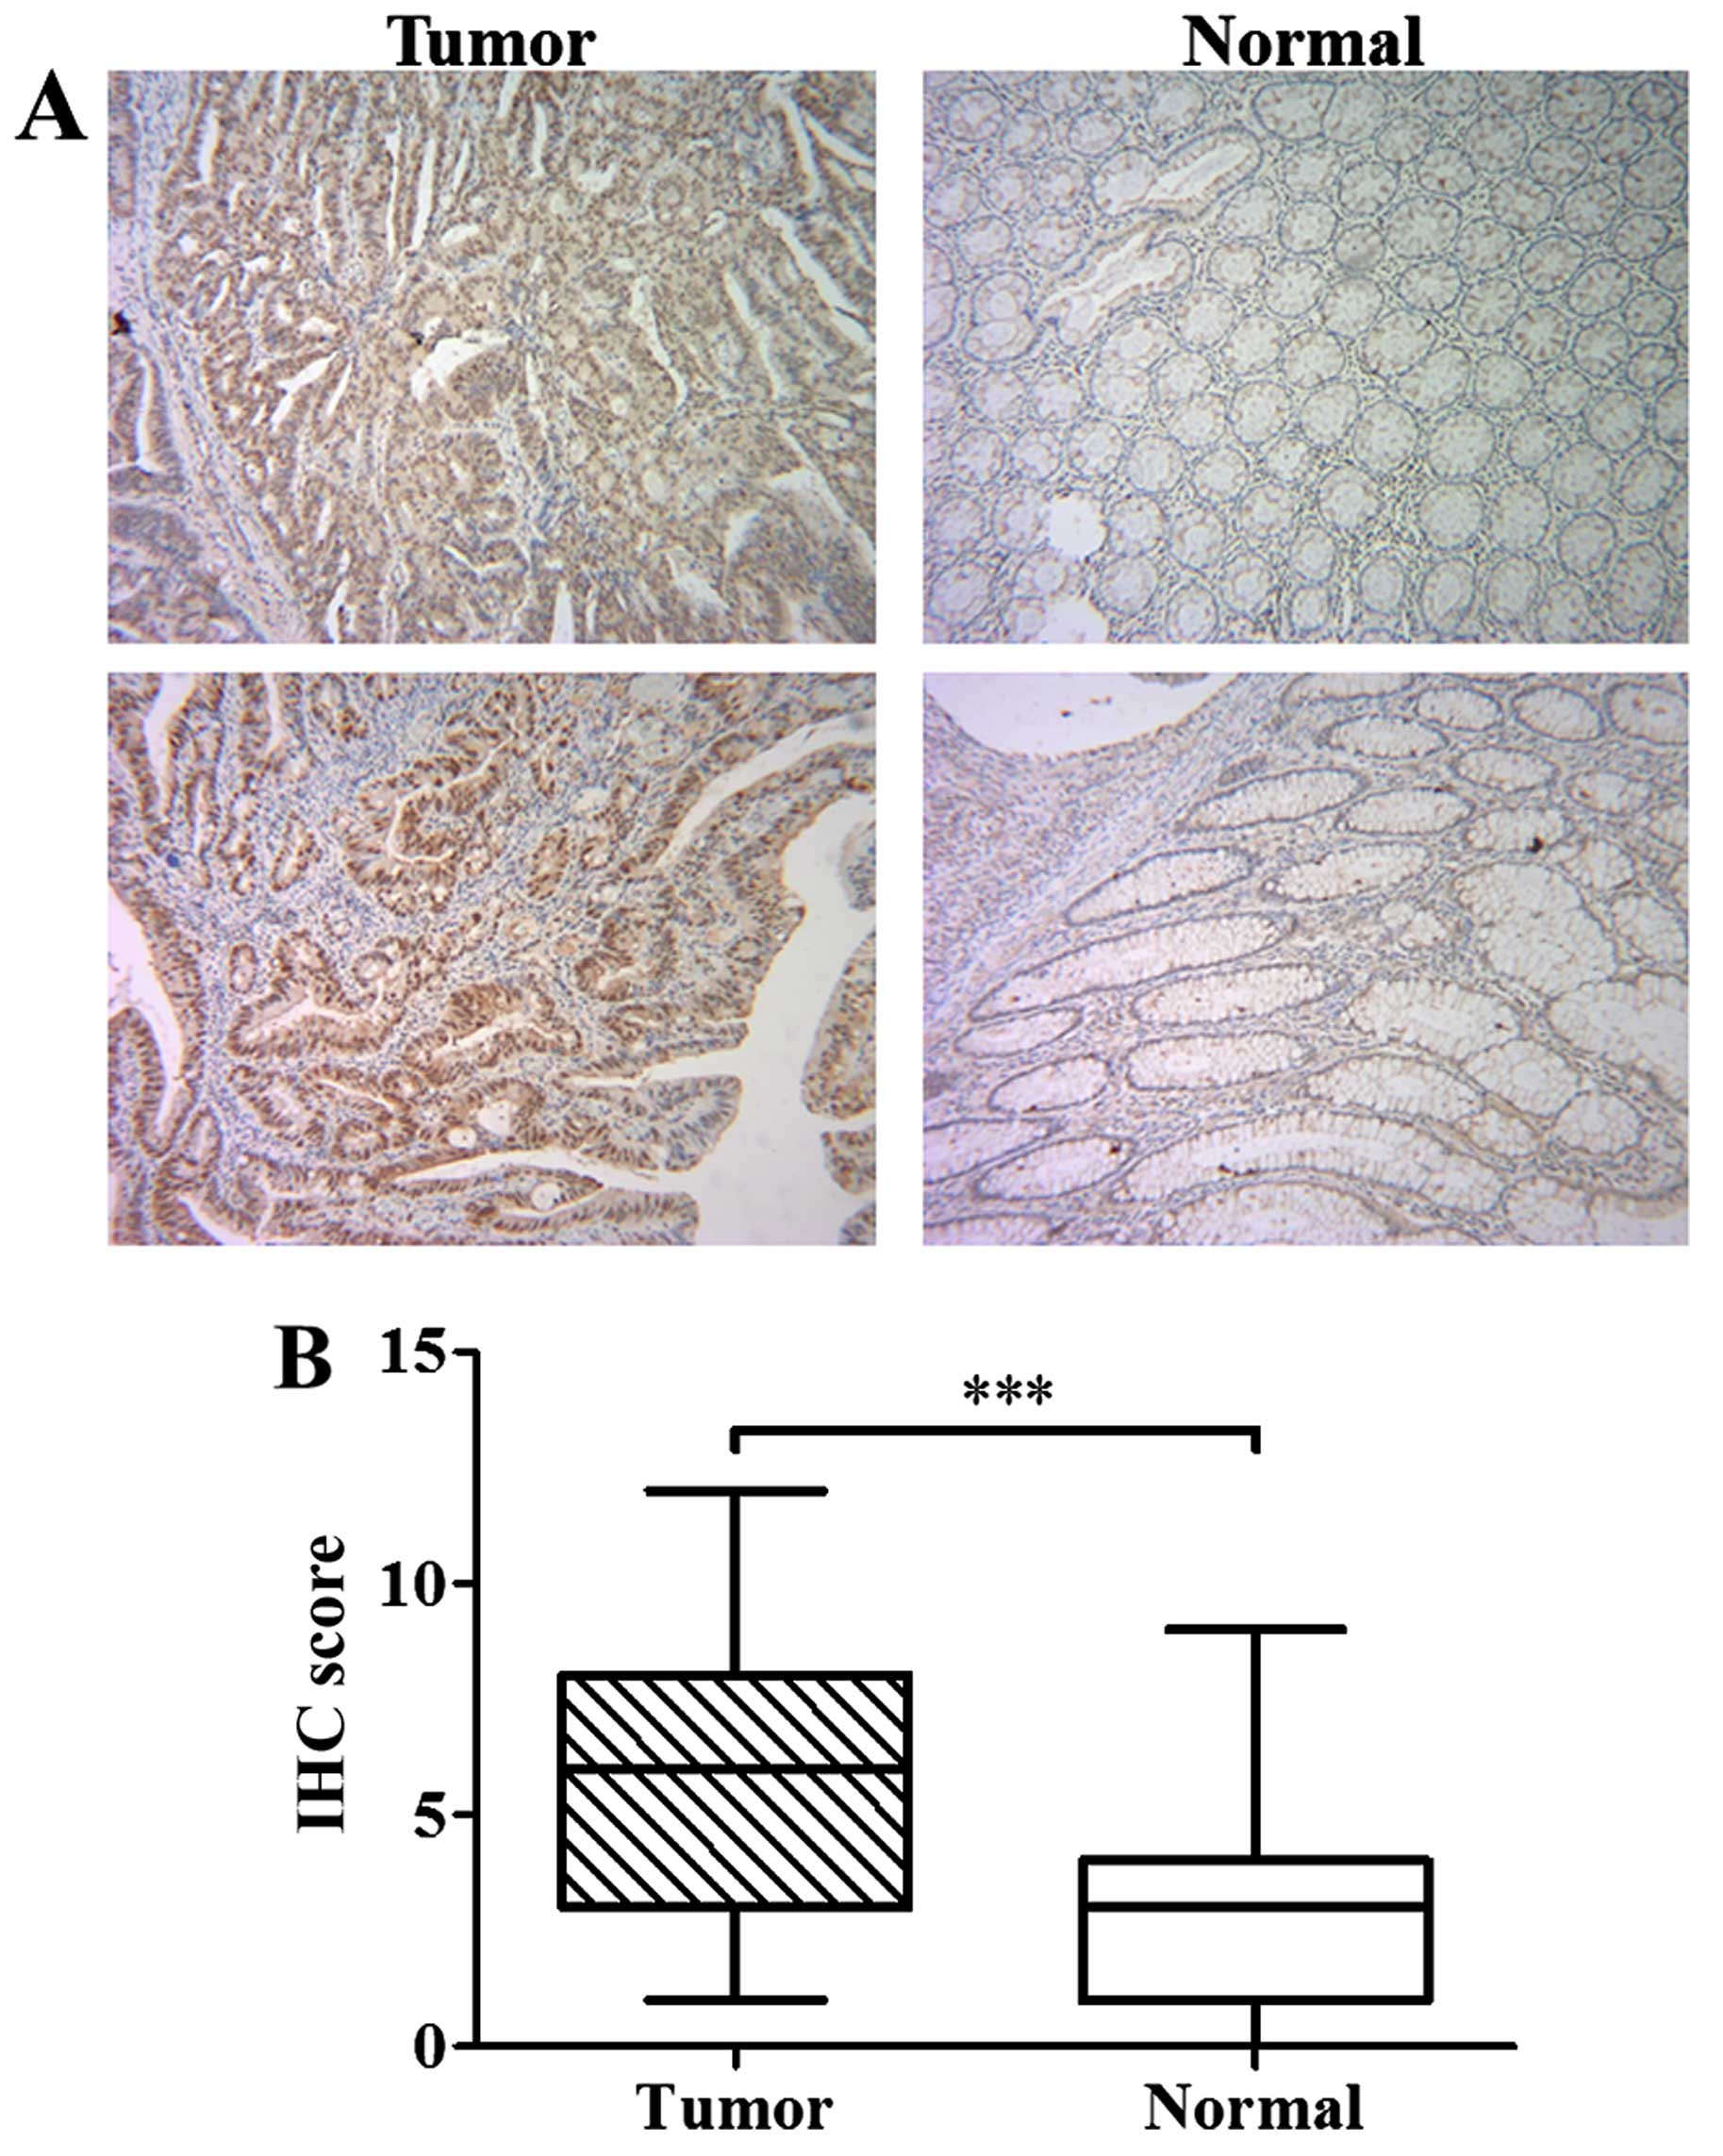
To investigate the expression of RPS15A in CRC, IHC
was performed in a total of 200 consecutive cases of tumor tissues
and their corresponding normal tissues. Representative images of
IHC staining of tumor and corresponding normal tissues are shown in
Figs. 1A and 2. IHC score of RPS15A in CRC tissues was
significantly higher than that in normal tissues (P<0.001;
Fig. 1B), suggesting that RPS15A
was accumulated in CRC.
Association of the RPS15A expression with
clinicopatho-logical characteristics
As shown in Table
I, we summarized the correlation between RPS15A expression and
clinicopatho-logical characteristics of CRC patients. For IHC
score, the median value was defined as the cut-off for the
definition of high/low expression subgroups. The 200 consecutive
cases of tumor tissues were analyzed and then classified into 2
groups: high expression of RPS15A (n=102) and low expression of
RPS15A (n=98). High RPS15A expression was observed to be associated
with older age (P=0.035), not receiving preoperative neoadjuvant
treatment (P=0.048), higher primary pN stage (P=0.007), and more
synchronous distant metastases (P=0.058). No association was
observed between RPS15A expression and other clinicopathological
characteristics.
 | Table IRelations between the expression of
RPS15A in tumor tissues and the clinicopathological
characteristics. |
Table I
Relations between the expression of
RPS15A in tumor tissues and the clinicopathological
characteristics.
| Low (%) (n=98) | High (%) (n=102) | Correlation
coefficient | P-value |
|---|
| Gender | | | 0.047 | 0.509 |
| Male | 58 (59.2) | 65 (63.7) | | |
| Female | 40 (40.8) | 37 (36.3) | | |
| Age (years) | | | 0.149 | 0.035a |
| ≤60 | 52 (53.1) | 39 (38.2) | | |
| >60 | 46 (46.9) | 63 (61.8) | | |
| Preoperative CEA
(ng/ml) | | | 0.057 | 0.424 |
| <5 | 62 (63.3) | 70 (68.6) | | |
| ≥5 | 36 (36.7) | 32 (31.4) | | |
| Preoperative
neoadjuvant treatment | | | 0.140 | 0.048a |
| No | 80 (81.6) | 93 (91.2) | | |
| Yes | 18 (18.4) | 9 (8.8) | | |
| Primary tumor
site | | | 0.115 | 0.269 |
| Right-sided | 38 (38.8) | 50 (49.0) | | |
| Left-sided | 26 (26.5) | 26 (25.5) | | |
| Rectum | 34 (34.7) | 26 (25.5) | | |
| Primary tumor size
(cm) | | | 0.040 | 0.575 |
| <4 | 48 (49.0) | 54 (52.9) | | |
| ≥4 | 50 (51.0) | 48 (47.1) | | |
| Primary histological
type | | | 0.037 | 0.596 |
| Non-mucinous | 84 (85.7) | 90 (88.2) | | |
| Mucinous | 14 (14.3) | 12 (11.8) | | |
| Primary
differentiation | | | 0.057 | 0.422 |
| Well to
moderate | 59 (60.2) | 67 (65.7) | | |
| Poor | 39 (39.8) | 35 (34.3) | | |
| Primary pT
stage | | | 0.110 | 0.121 |
| 1/2 | 38 (38.8) | 29 (28.4) | | |
| 3/4 | 60 (61.2) | 73 (71.6) | | |
| Primary pN
stage | | | 0.189 |
0.007a |
| 0 | 69 (70.4) | 53 (52.0) | | |
| 1/2 | 29 (29.6) | 49 (48.0) | | |
| Vascular
invasion | | | 0.084 | 0.237 |
| No | 92 (93.9) | 91 (89.2) | | |
| Yes | 6 (6.1) | 11 (10.8) | | |
| Nerve invasion | | | 0.079 | 0.265 |
| No | 91 (92.9) | 90 (88.2) | | |
| Yes | 7 (7.1) | 12 (11.8) | | |
| Synchronous distant
metastases | | | 0.134 | 0.058 |
| No | 82 (83.7) | 74 (72.5) | | |
| Yes | 16 (16.3) | 28 (27.5) | | |
Prognostic significance of RPS15A
expression in CRC
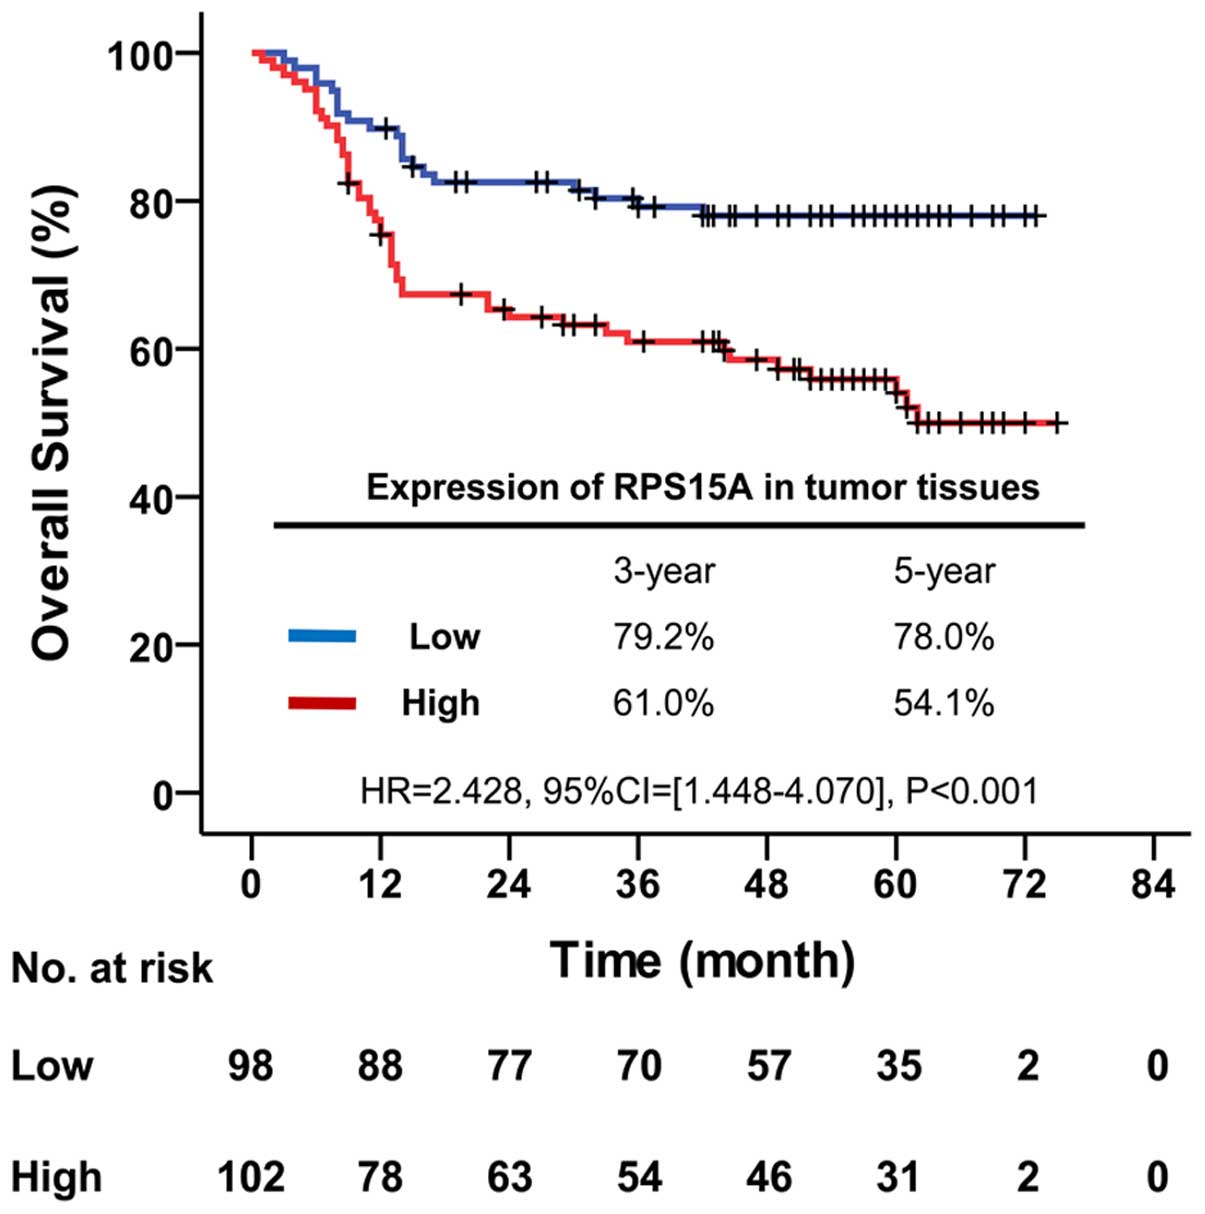
To investigate the effect of RPS15A expression on
the prognosis of CRC patients, the Kaplan-Meier method was used.
The median follow-up time of all patients was 49.0 months
(inter-quartile range, 14.0–61.0 months). The overall survival of
patients with low expression of RPS15A was significantly better
than patients with high expression (HR, 2.428, 95% CI, 1.448–4.070;
P<0.001). The overall survival rate was decreased from 79.2% in
low expression to 61.0% in high expression of RPS15A at 3 years,
and from 78.0 to 54.1% at 5 years, respectively (Fig. 3).
To determine whether RPS15A could be as an
independent risk factor for poor prognosis of CRC patients, Cox
hazard regression model was used to conduct univariate and
multivariate analysis of conventional clinicopathological factors
and RPS15A. According to univariate analysis results (Table II), overall survival of CRC
patients was significantly correlated with RPS15A expression
(P=0.001), together with preoperative CEA (P=0.006), primary tumor
site (P=0.001), primary pT stage (P=0.001), primary pN stage
(P<0.001), nerve invasion (P=0.001) and synchronous distant
metastases (P<0.001). While the multivariate analysis (Table II) indicated that only RPS15A
expression (P=0.022), primary pN stage (P=0.028) and synchronous
distant metastases (P<0.001) were deemed as independent
prognostic factors for overall survival of CRC patients. Therefore,
high expression of RPS15A could be an independent risk factor for
poor prognosis of CRC patients.
| Table IIUnivariate and multivariate analysis
for overall survival. |
Table II
Univariate and multivariate analysis
for overall survival.
| Univariate
analysis | Multivariate
analysis |
|---|
|
|
|
|---|
| HR | 95% CI | P-value | HR | 95% CI | P-value |
|---|
| Gender |
| Male | 1 | - | - | 1 | - | - |
| Female | 0.914 | 0.557–1.500 | 0.723 | 0.954 | 0.570–1.597 | 0.859 |
| Age (years) |
| ≤60 | 1 | - | - | 1 | - | - |
| >60 | 1.222 | 0.752–1.986 | 0.419 | 0.994 | 0.587–1.684 | 0.984 |
| Preoperative CEA
(ng/ml) |
| <5 | 1 | - | - | 1 | - | - |
| ≥5 | 1.972 | 1.217–3.196 |
0.006a | 1.264 | 0.689–2.316 | 0.449 |
| Preoperative
neoadjuvant treatment |
| No | 1 | - | - | 1 | - | - |
| Yes | 1.188 | 0.622–2.268 | 0.602 | 1.151 | 0.547–2.423 | 0.711 |
| Primary tumor
site |
| Right-sided | 1 | - | - | 1 | - | - |
| Left-sided | 0.559 | 0.308–1.013 | 0.055 | 0.738 | 0.389–1.401 | 0.353 |
| Rectum | 0.326 | 0.171–0.623 |
0.001a | 0.739 | 0.325–1.680 | 0.470 |
| Primary tumor size
(cm) |
| <4 | 1 | - | - | 1 | - | - |
| ≥4 | 1.619 | 0.995–2.634 | 0.052 | 1.034 | 0.581–1.841 | 0.910 |
| Primary
histological type |
| Non-mucinous | 1 | - | - | 1 | - | - |
| Mucinous | 0.988 | 0.490–1.996 | 0.974 | 0.813 | 0.349–1.893 | 0.632 |
| Primary
differentiation |
| Well to
moderate | 1 | - | - | 1 | - | - |
| Poor | 1.558 | 0.962–2.523 | 0.071 | 1.235 | 0.680–2.241 | 0.488 |
| Primary pT
stage |
| 1/2 | 1 | - | - | 1 | - | - |
| 3/4 | 3.018 | 1.579–5.769 |
0.001a | 1.174 | 0.536–2.572 | 0.688 |
| Primary pN
stage |
| 0 | 1 | - | - | 1 | - | - |
| 1/2 | 4.549 | 2.692–7.686 |
<0.001a | 2.009 | 1.078–3.744 |
0.028a |
| Vascular
invasion |
| No | 1 | - | - | 1 | - | - |
| Yes | 0.993 | 0.429–2.301 | 0.988 | 0.839 | 0.342–2.058 | 0.701 |
| Nerve invasion |
| No | 1 | - | - | 1 | - | - |
| Yes | 2.812 | 1.501–5.268 |
0.001a | 1.790 | 0.899–3.562 | 0.097 |
| Synchronous distant
metastases |
| No | 1 | - | - | 1 | - | - |
| Yes | 8.857 | 5.391–14.552 |
<0.001a | 5.033 | 2.478–10.220 |
<0.001a |
| Expression of
PRS15Ain tumor tissues |
| Low | 1 | - | - | 1 | - | - |
| High | 2.428 | 1.448–4.070 |
0.001a | 1.958 | 1.100–3.484 |
0.022a |
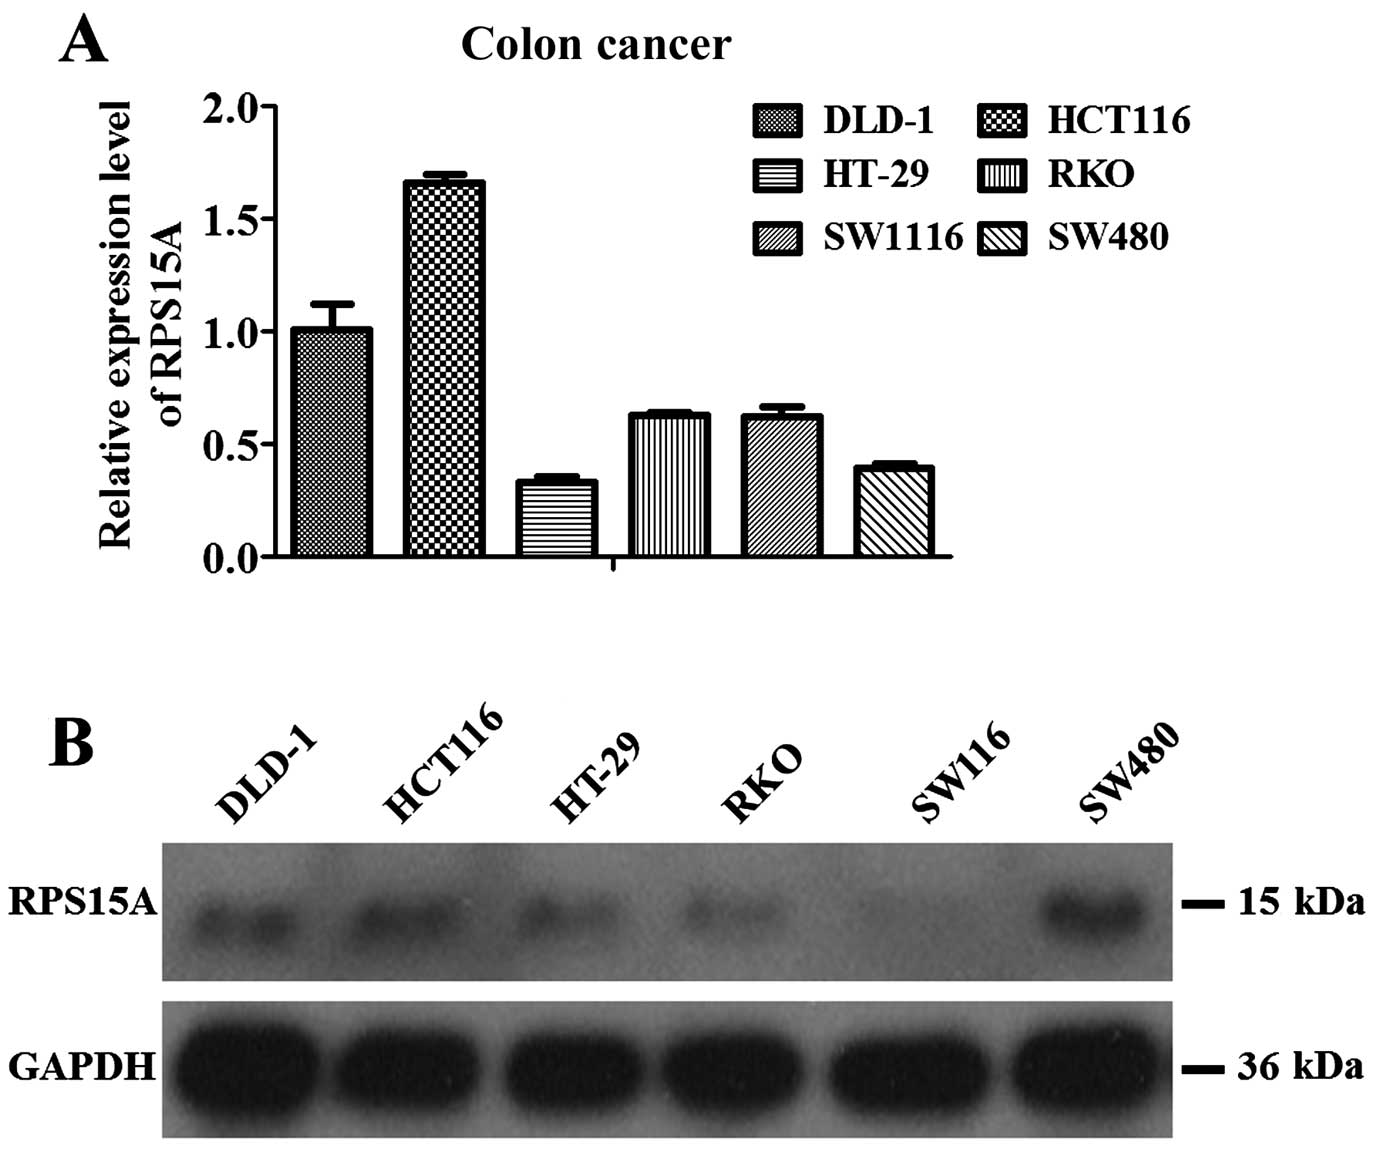
Expression levels of RPS15A in CRC
cells
Real-time PCR and western blot analyses revealed
that 6 human colorectal cell lines, including DLD-1, HCT116, HT-29,
RKO, SW1116 and SW480, expressed RPS15A, of which highest
expression was found in HCT116 cells followed by DLD-1 cells
(Fig. 4A). Western blot analysis
showed similar results except for the relatively higher protein
level in SW480 cells (Fig. 4B).
Therefore, HCT116 and DLD-1 cells were employed for further
functional analysis.
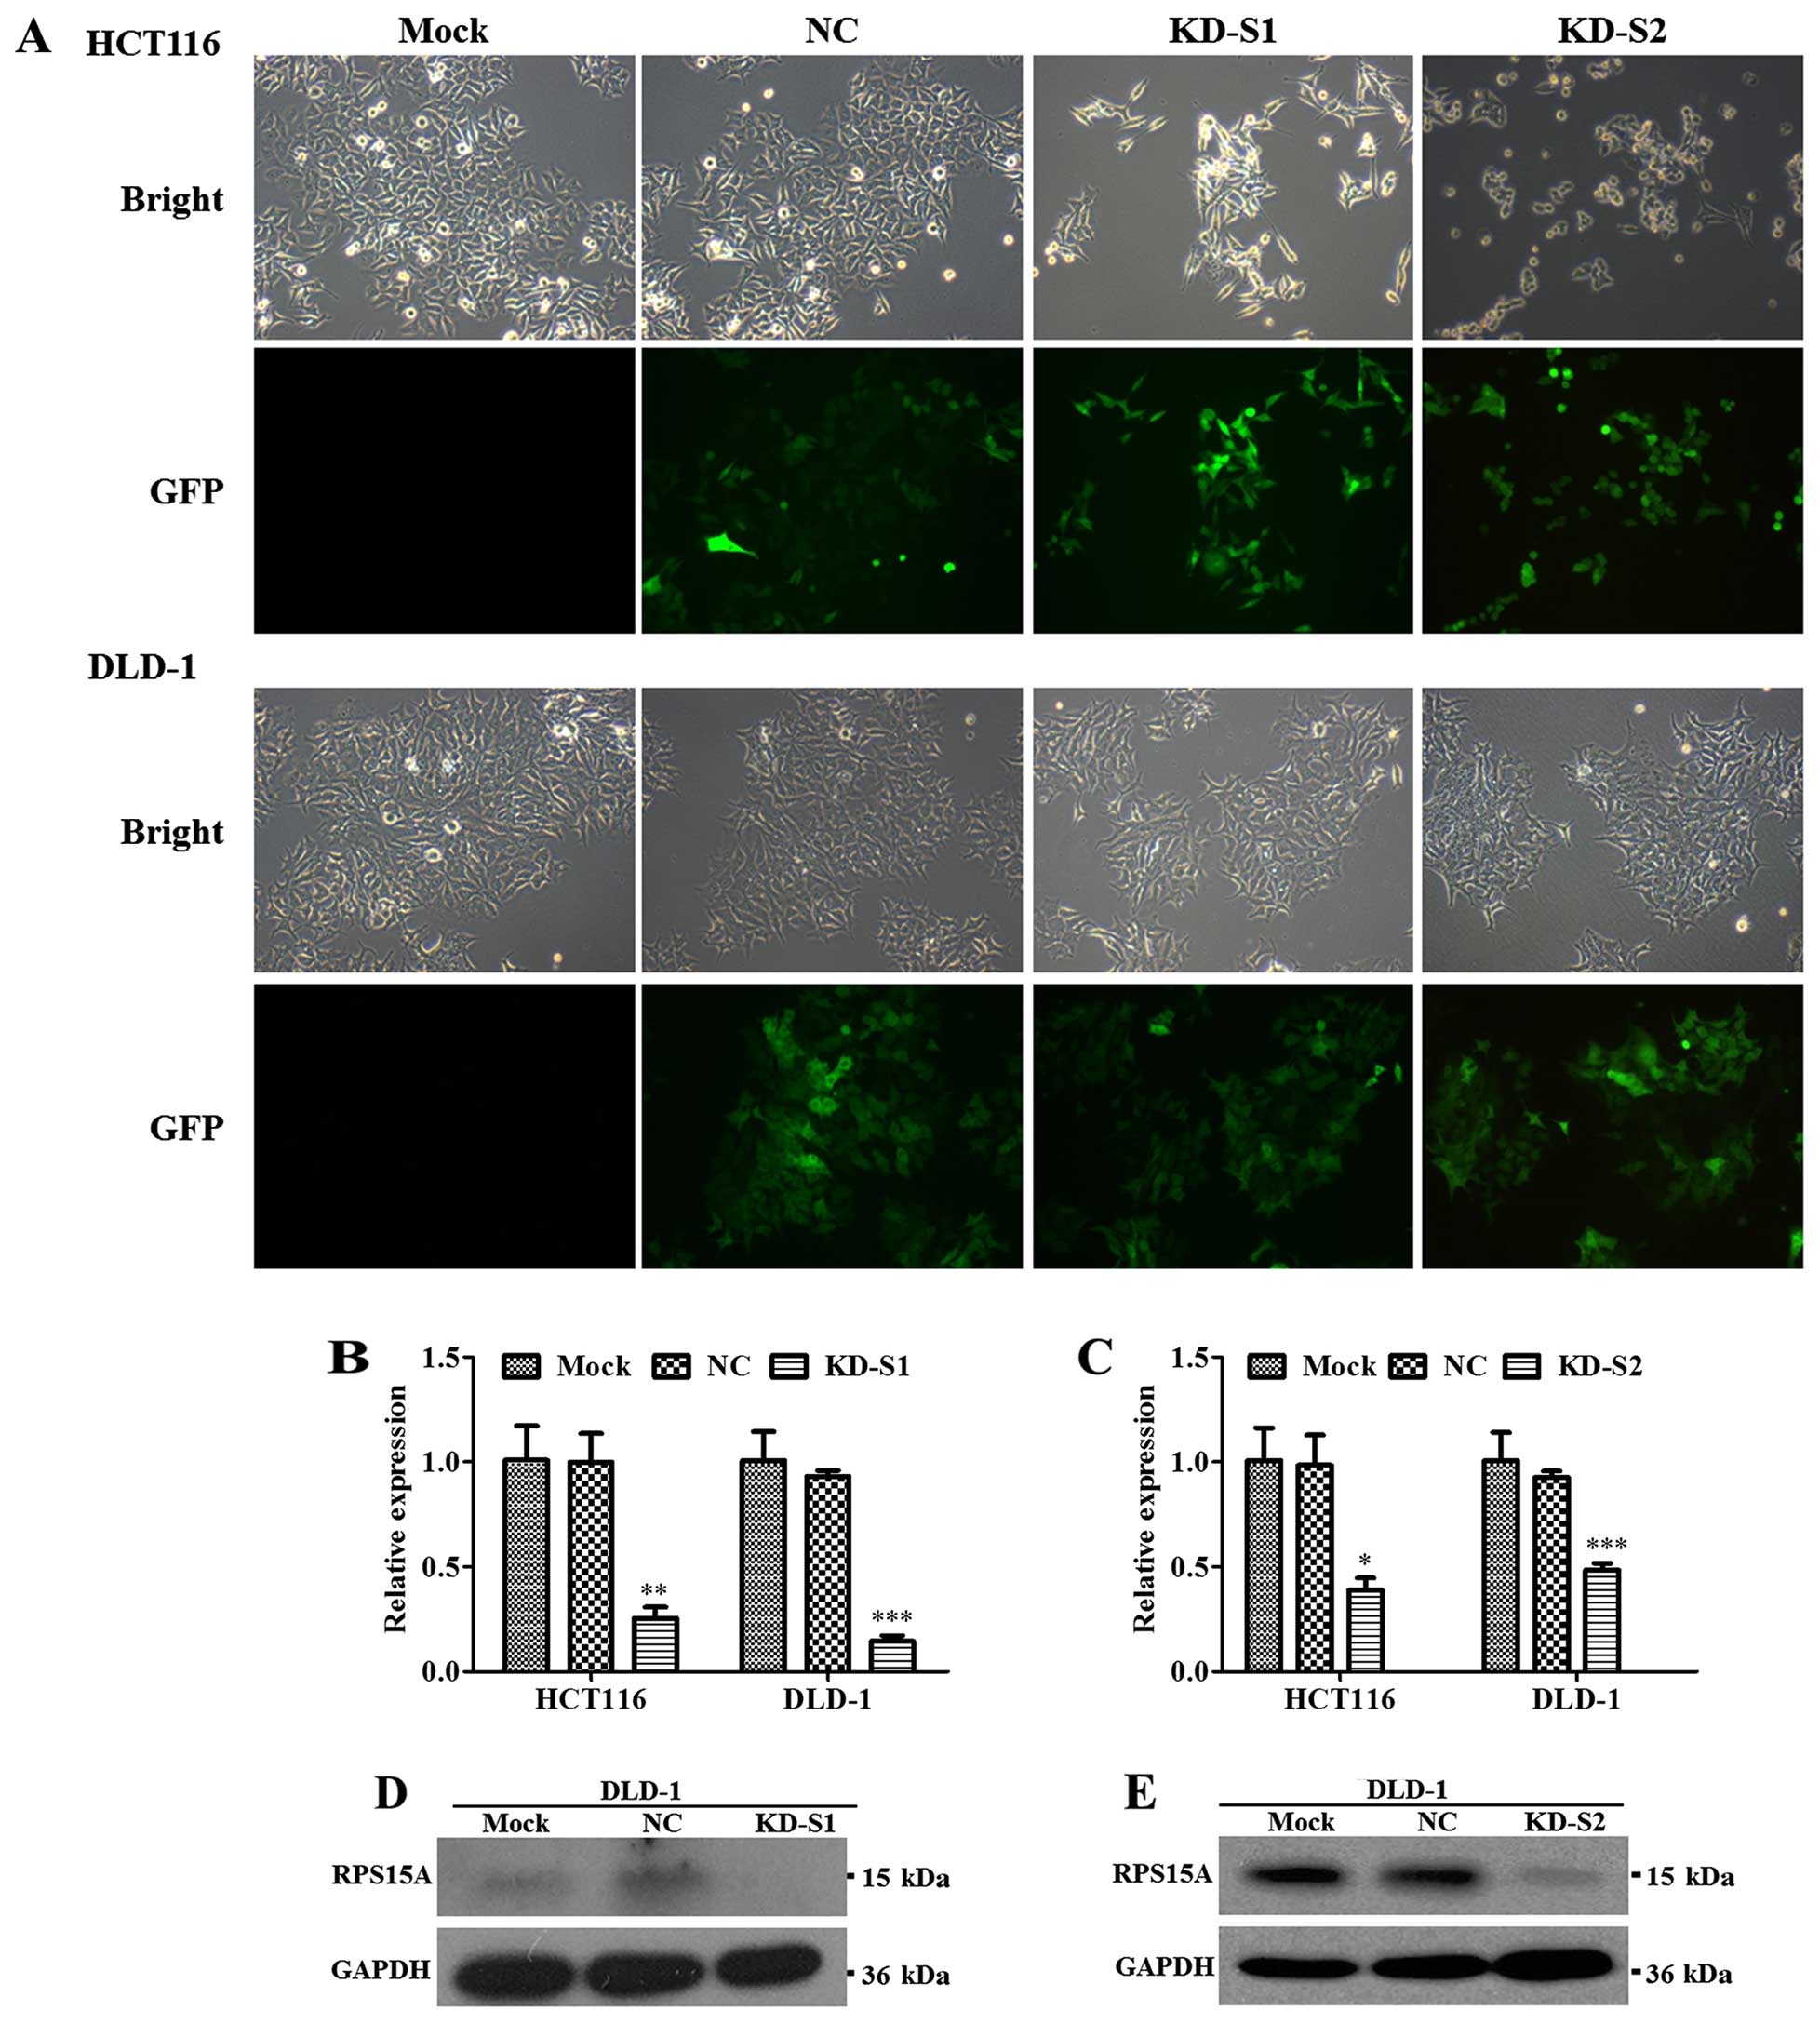
To examine the role of RPS15A in CRC, infection
efficiency was showed in Fig. 5A
and RPS15A knockdown efficiency was confirmed by real-time qPCR and
western blot analysis. Compared with NC group, the mRNA levels of
RPS15A in KD-S1 groups were significantly downregulated, by 74.5
and 84.3% in HCT116 and DLD-1 cells (Fig. 5B), similar to KD-S2 (Fig. 5C). Furthermore, the RPS15A protein
levels in DLD-1 cells were significantly attenuated by KD-S1
(Fig. 5D) and KD-S2 (Fig. 5E).
Functional analysis of RPS15A in CRC
cells
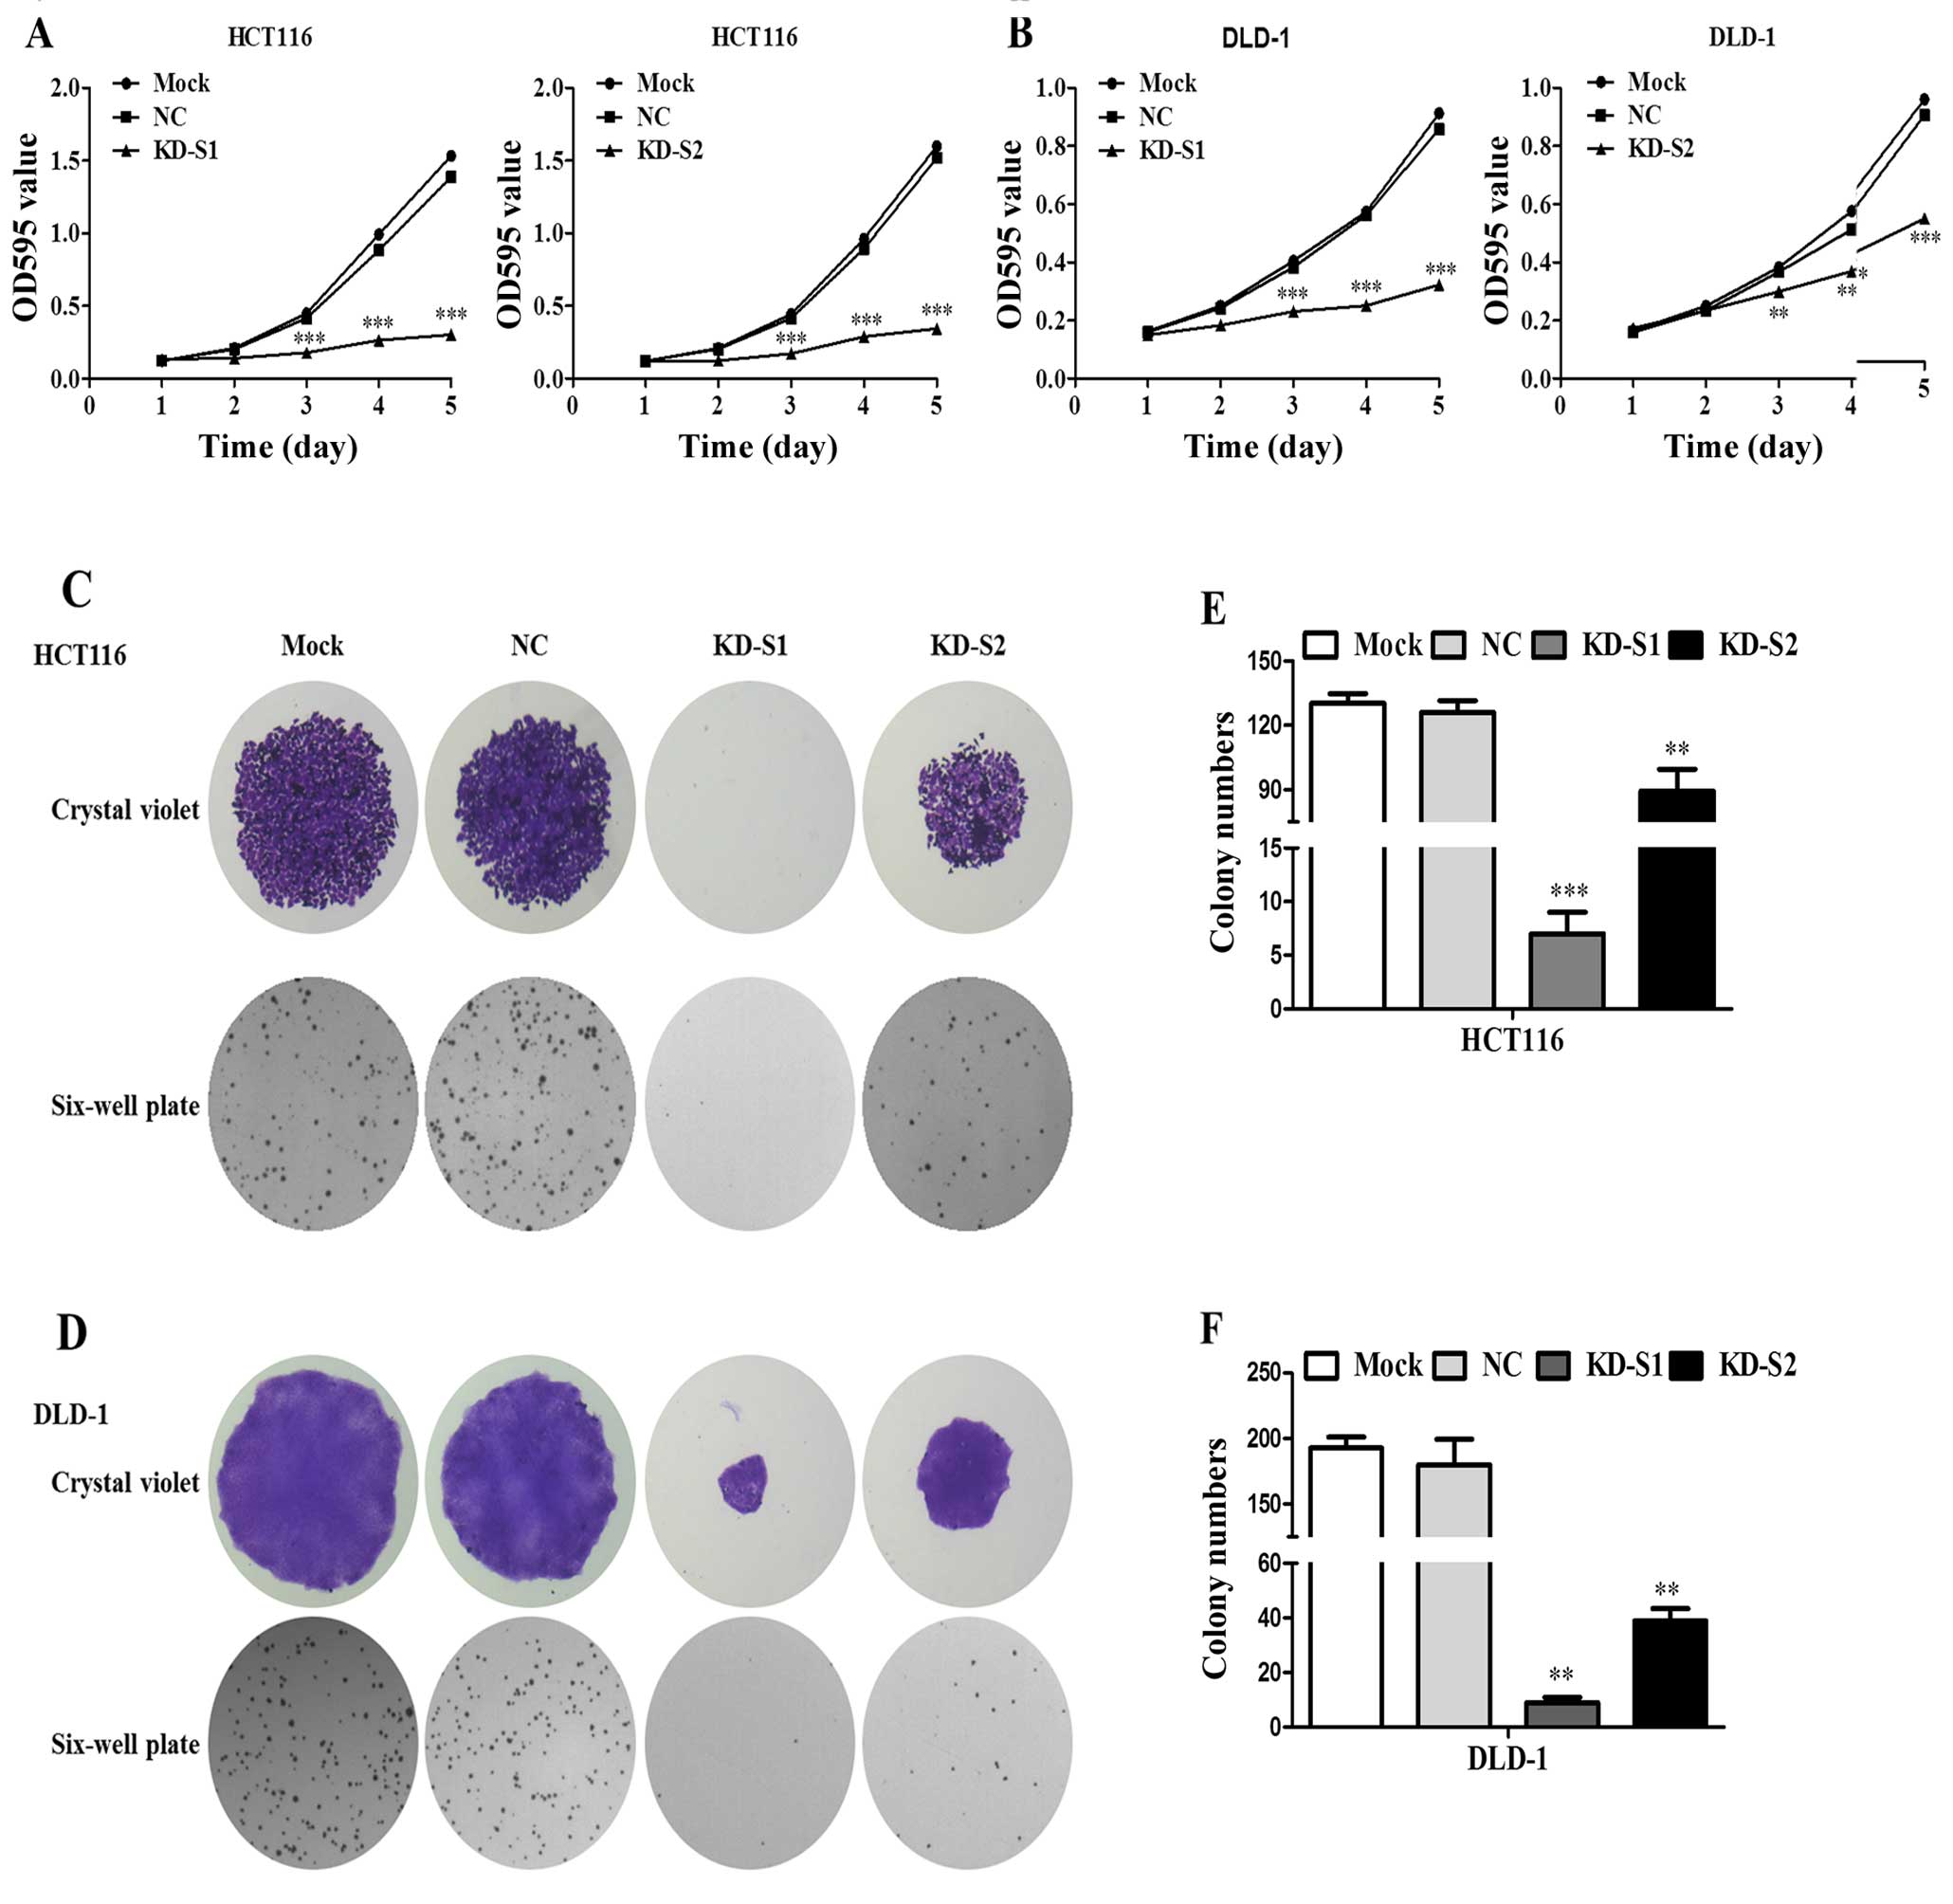
Effect of the shRNA mediated RPS15A silencing on CRC
cell viability was assessed by MTT assay. As shown in Fig. 6A and B, KD-S1 and KD-S2 inhibited
HCT116 and DLD1 proliferation. Furthermore, both the number and
size of colonies were observed. As shown in Fig. 6C and D, KD-S1 and KD-S2 inhibited
cell clone formation in HCT116 and DLD-1 cells. However, the
suppression effect of KD-S2 was less compared to KD-S1 (Fig. 6E and F). Taken together, knockdown
of RPS15A by shRNA was able to remarkably suppress the
proliferation and colony formation.
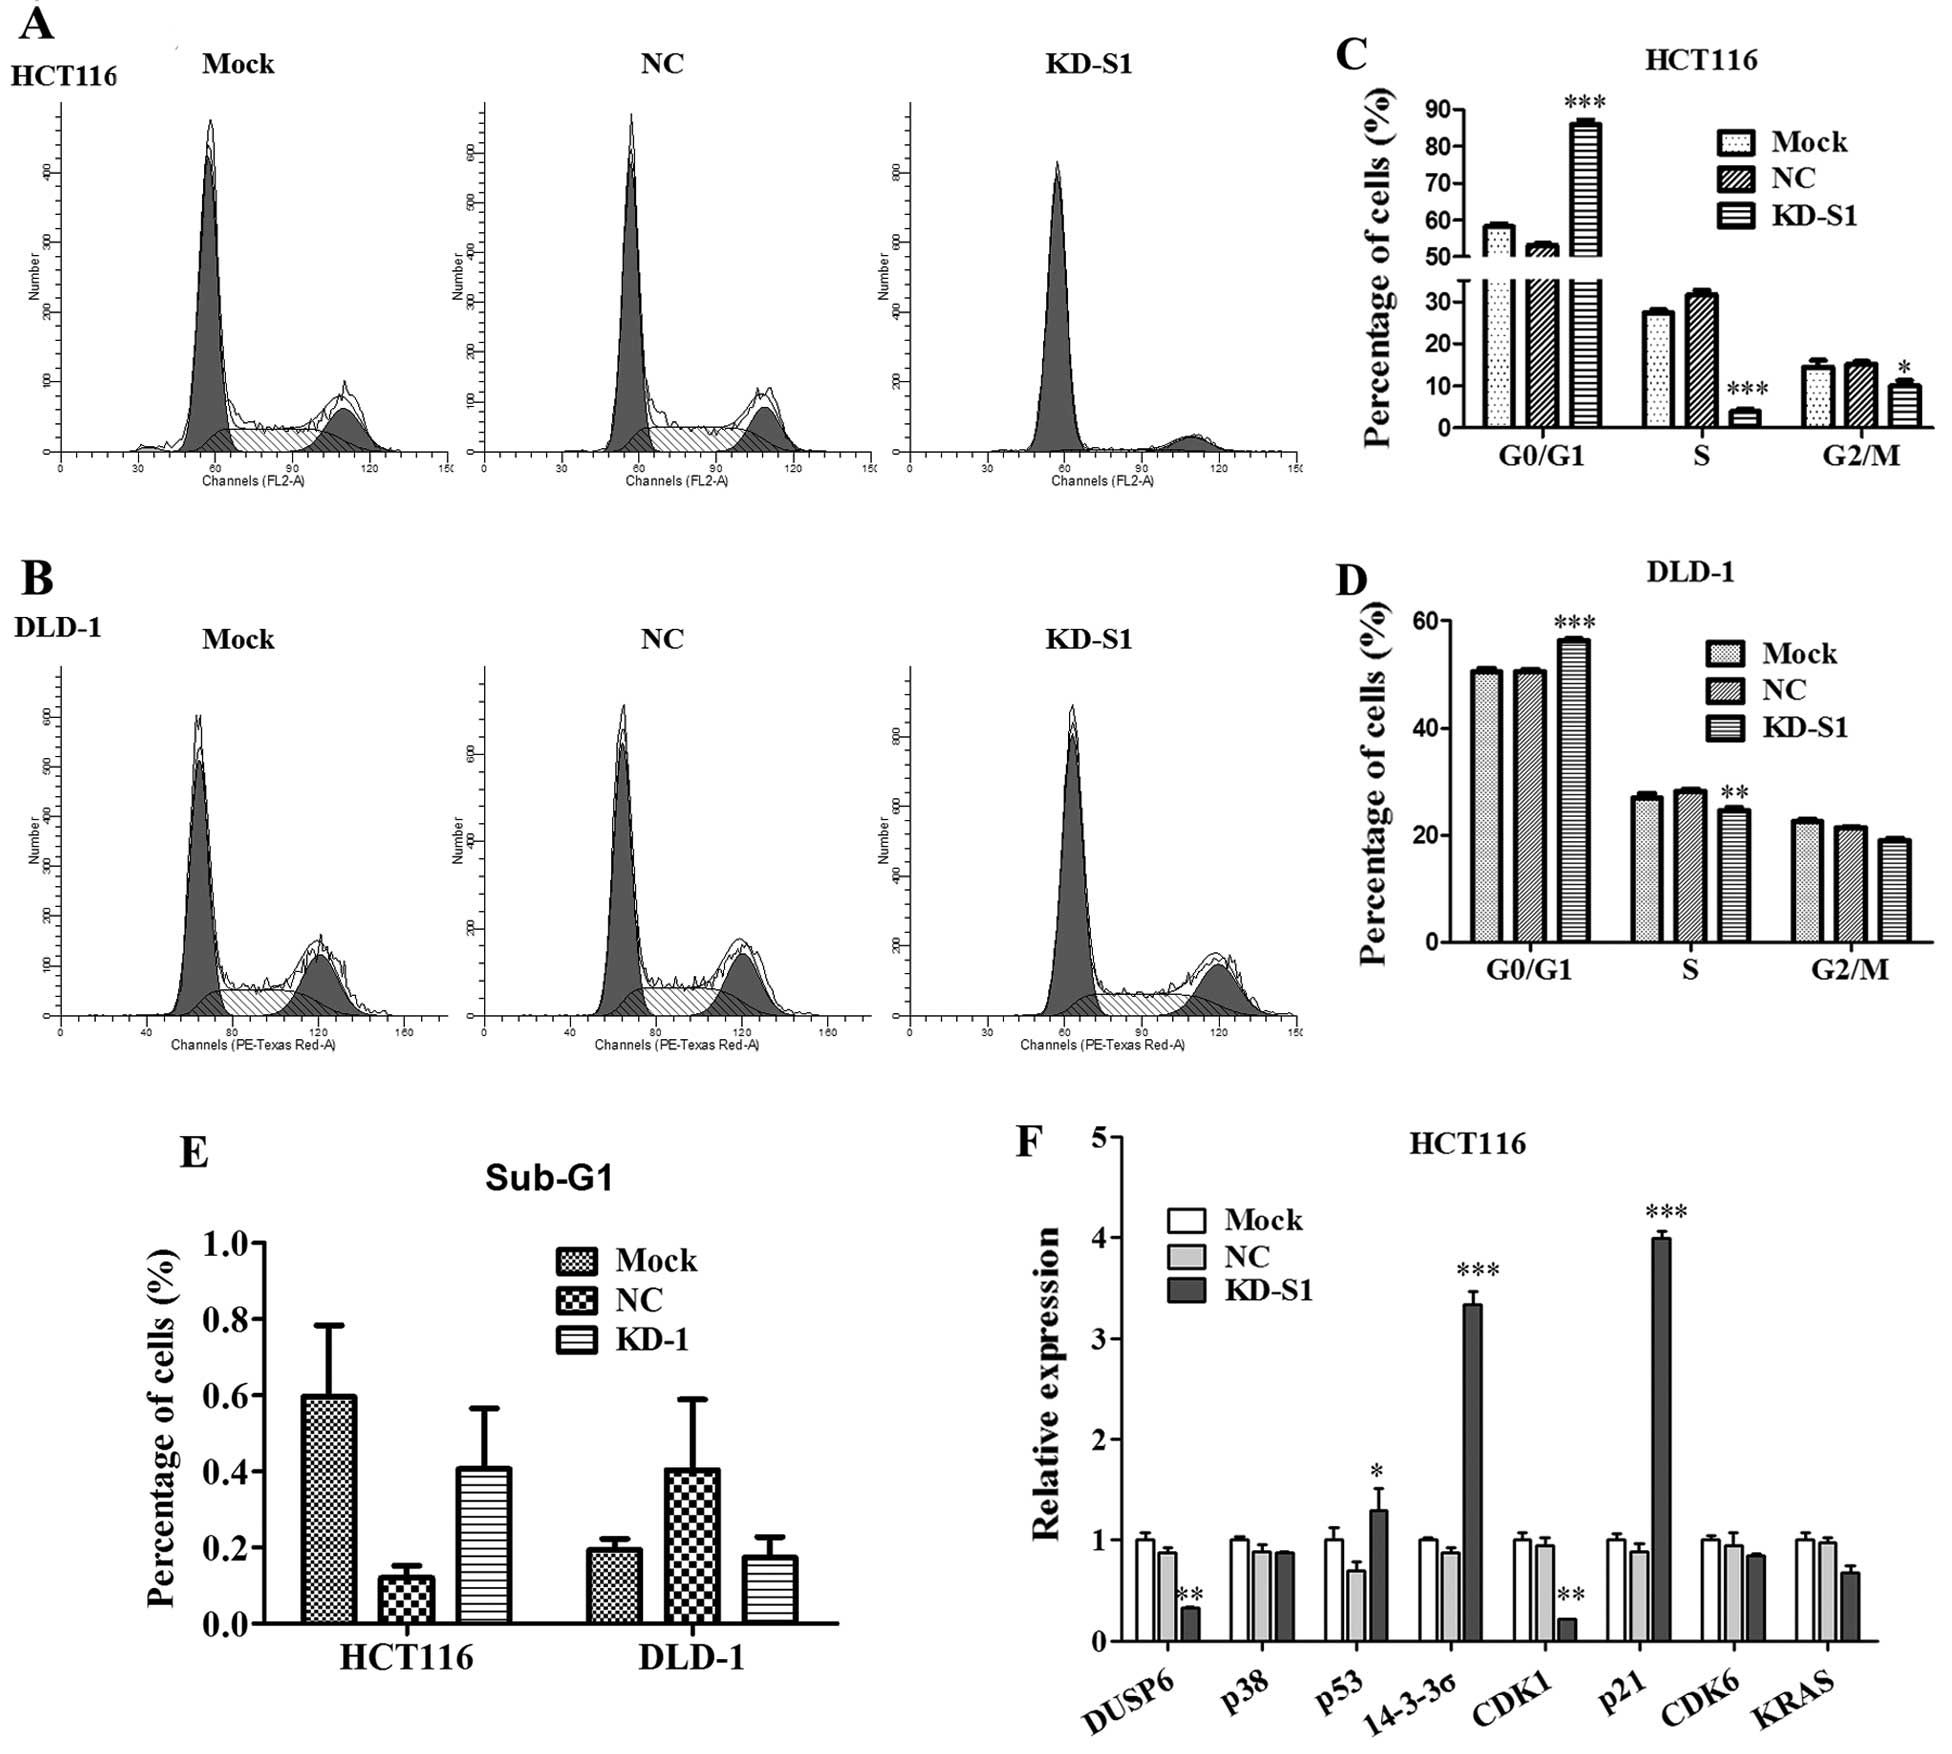
To clarify the underlying mechanism that RPS15A
silencing inhibited cell growth, flow cytometry was performed in
HCT116 and DLD-1 cells (Fig. 7A and
B). As shown in Fig. 7C, KD-S1
effectively blocked the cell cycle progression in HCT116. The cell
population of G0/G1 phase in the KD-S1 group (85.99±1.14%) was
significantly higher than NC group (53.10±0.56%), whereas the cell
population of S phase or G2/M phase was much lower than NC group.
Similarly, KD-S1 also blocked cell cycle progression of DLD-1 cells
(Fig. 7D). The sub-G1 phase of the
two CRC cell lines was not significantly changed in KD-S1 group
compared with control (Fig.
7E).
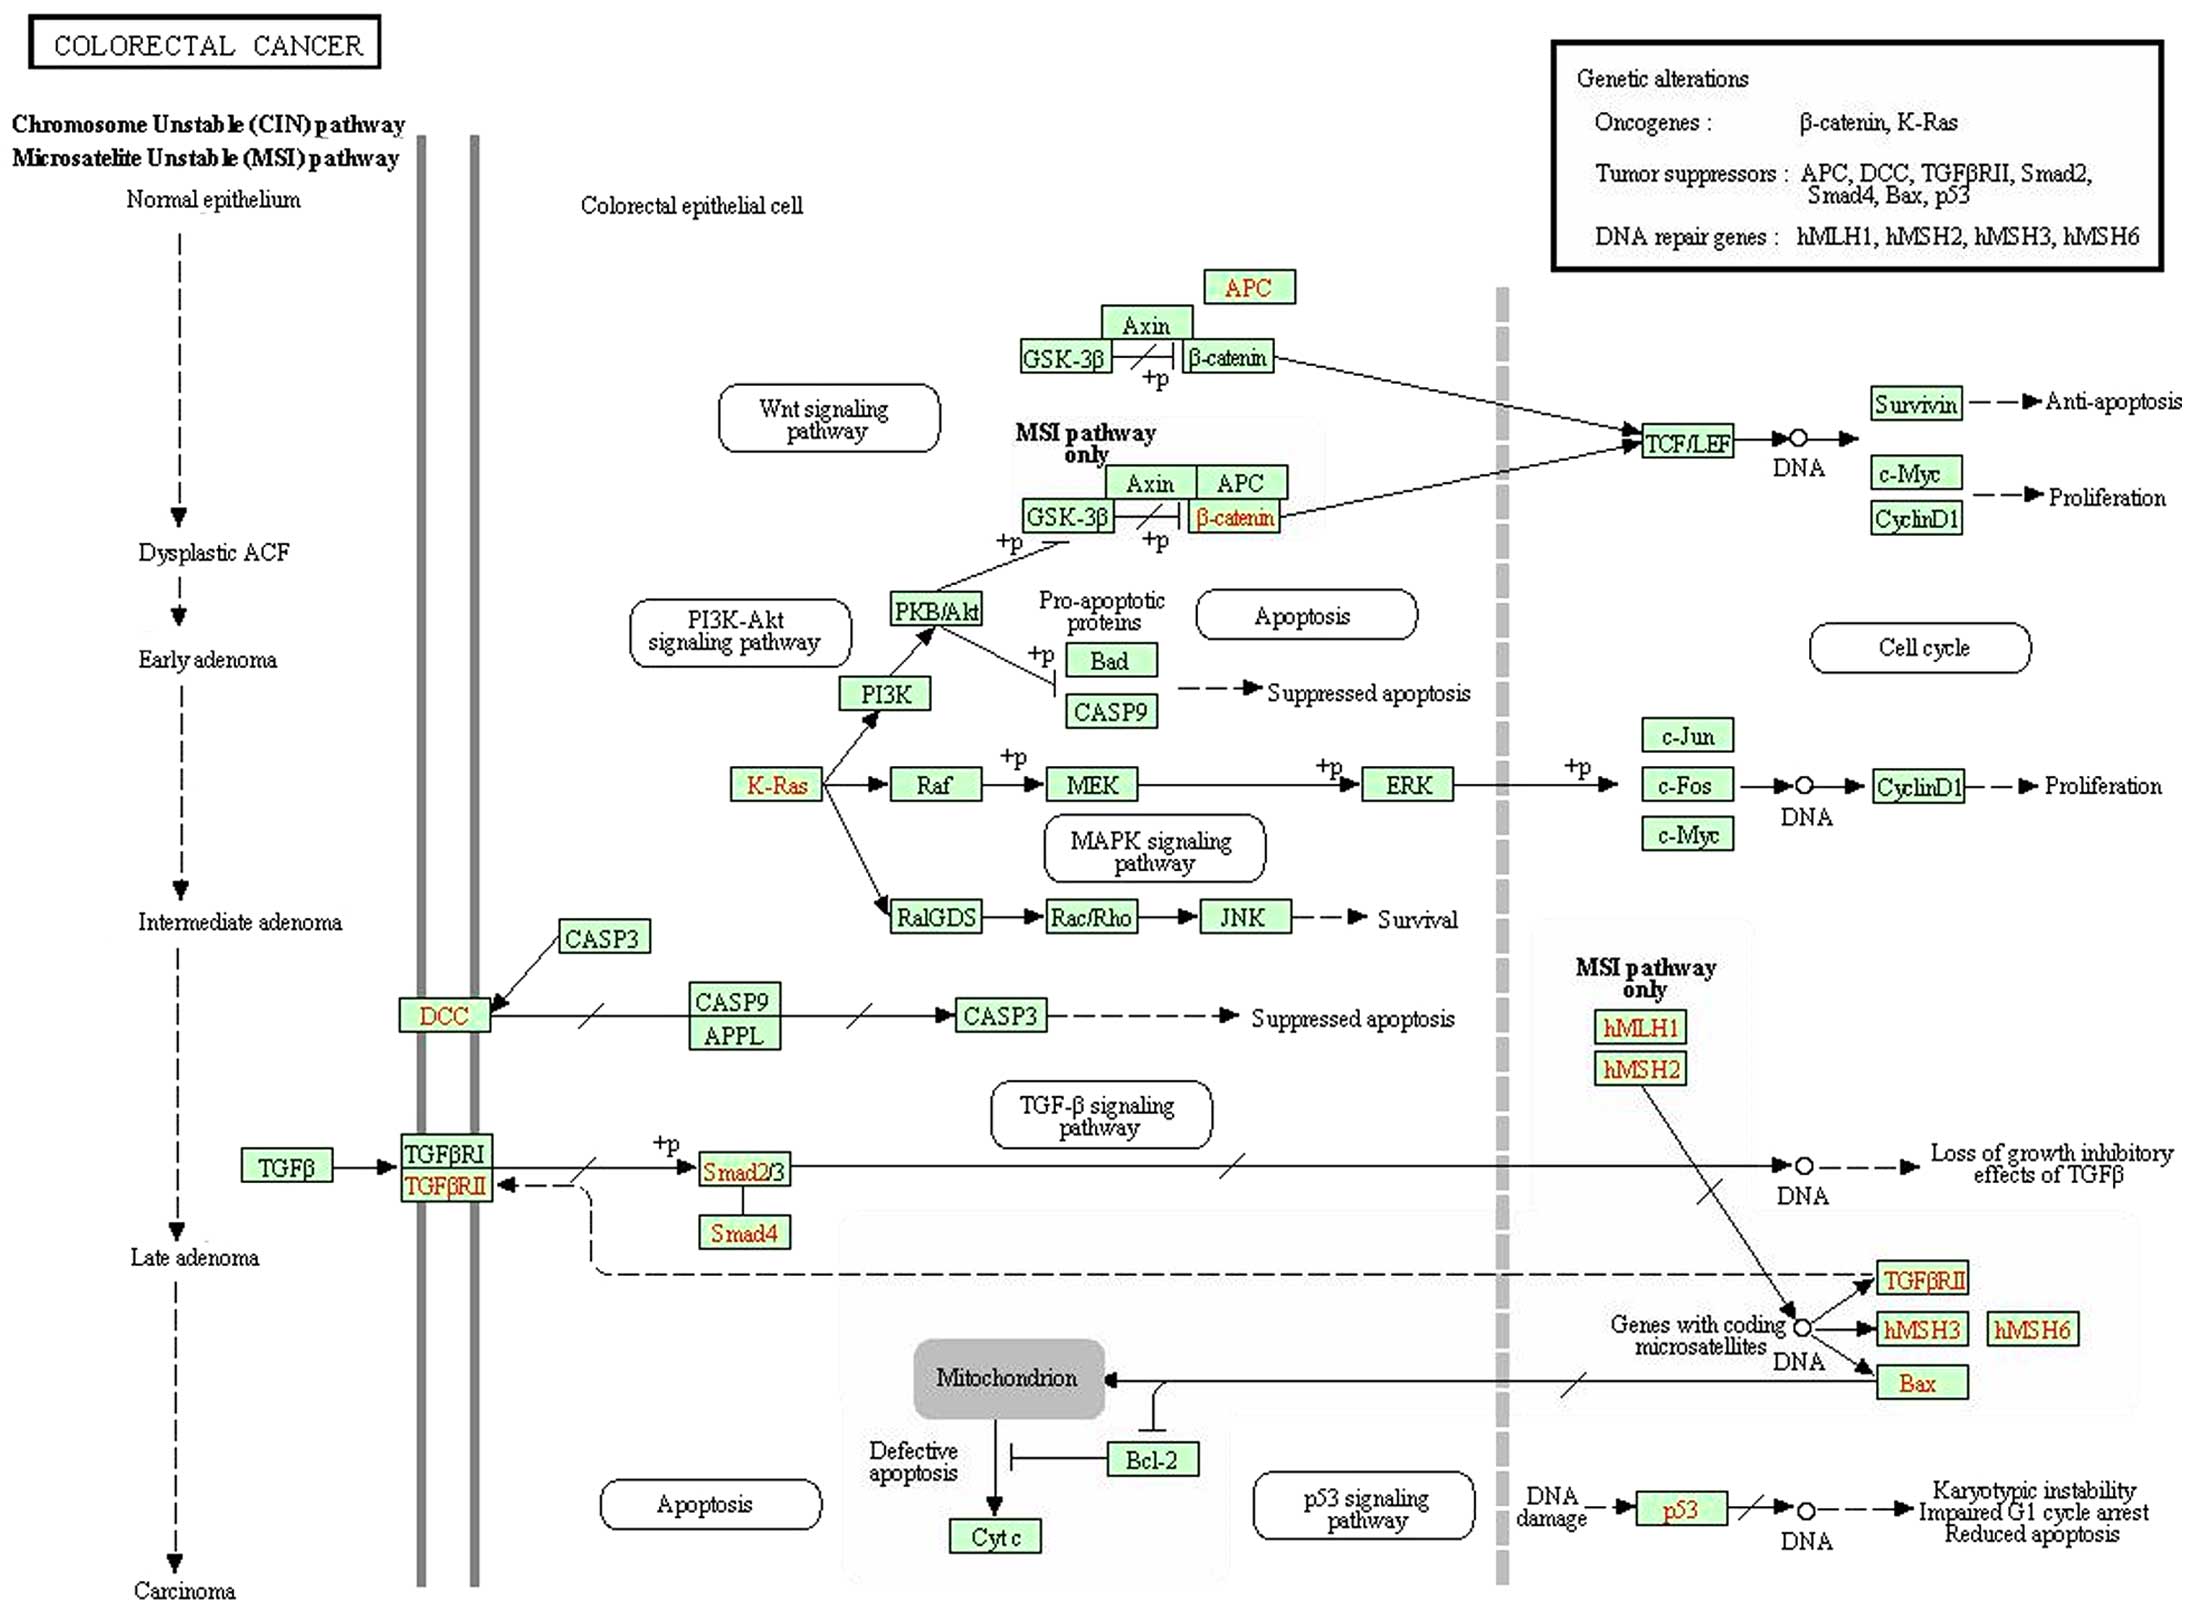
In order to clarify the underlying mechanism, we
conducted GeneChip analysis. According to KEGG pathway analysis of
CRC signaling pathway, we identified that certain oncogenes and
tumor suppressors were misregulated in RPS15A-KD cells (Fig. 8). We found that upregulation of p53
may correlate with an inhibited proliferation ability and cell
cycle arrest in CRC cells. As validated by real-time PCR, we found
that p53 was upregulated by RPS15A-KD in HCT116 cells, whereas, p21
and 14-3-3α the downstream targets of p53 were strongly increased
in KD-S1 group (Fig. 7F). These
results indicated that knockdown of RPS15A in CRC cells led to cell
cycle arrest in G0/G1 phase, which could contribute to the
inhibition of CRC cell growth.
Discussion
In a retrospective study, we revealed that RPS15A
was accumulated in human CRC tissues and significantly correlated
with malignant clinicopathological features and a worse prognosis
in CRC patients. Cell line based analysis indicated that RPS15A was
widely and highly expressed in 6 human CRC cell lines, including
DLD-1, HCT116, HT-29, RKO, SW1116 and SW480. Knockdown of RPS15A
had a pivotal effect on CRC cell proliferation via inducing G0/G1
phase arrest rather than inducing apoptosis. GeneChip analysis
suggested that RPS15A depletion might lead to misregulation of p53
signaling pathway.
Ribosome biogenesis is an essential biological
process in human. To date, a number of oncogenic or tumor
suppressive genes have been identified to affect the formation of
mature ribosome (12–15), which suggest that protein synthesis
machinery plays an important role in the regulation of malignant
transformation. For instance, the oncogenic WBSCR22 protein,
important for ribosome small subunit biosynthesis, is upregulated
in invasive breast cancer (16).
Ribosomal protein S6 (RPS6), a key regulator of 40S ribosome
biogenesis, actively participates in human esophageal cancer
progression. RPS6 knockdown resulted in a reduction in esophageal
cancer cell growth, migration and invasion (17).
The present study is the first reporting the
potential role of RPS15A in CRC initiation and progression. In this
investigation, we studied 200 paired colorectal tissue samples from
200 CRC patients, and analyzed their clinicopathological
significance. As shown in Fig. 1B
and the Results section, RPS15A was significantly upregulated in
tumor tissues compared to normal tissues (P<0.001, Wilcoxon
signed-rank test). RPS15A was strongly stained in the enlarged
nuclei in most of the tumor cells, whereas mildly stained in the
cytoplasm (Fig. 1A). As a
ribosomal protein, RPS15A is normally localized in the cytoplasm.
However, in CRC tumor tissues, overexpression and nuclear
localization of RPS15A implied an abnormal and malignant function
of this protein. In addition to the abnormal expression pattern of
RPS15A in tumor tissues, relatively higher expression of RPS15A
predicted a lower survival rate in CRC patients (Fig. 3), strongly suggesting that RPS15A
could be a potential target for early diagnosis and prevention, in
addition to helping with developing novel targeted therapies for
late stage disease. Consistent with our findings, RPS15A was also
found to be correlated to other types of cancers, including
hepatic, osteosarcoma and lung cancer (10,11,18),
adding RPS15A as a potential antitumor target for drug
development.
According to our GeneChip analysis, the knockdown of
RPS15A by small interfering RNA might lead to upregulation of p53.
Further identification indicated that RPS15A depletion caused p21
upregulation and CDK1 downregulation, which might contribute to the
cell cycle arrest at G0/G1. Upregulation of 14-3-3α was also seen
when RPS15A was knocked down, which might counteract the
pro-apoptotic effect of the p53. This is a probable reason why
knockdown of RPS15A did not induce apoptosis in the CRC cells
(Fig. 7E).
Through analysis of the relation between RPS15A
expression level and the clinicopathological characteristics of
CRC, we found that high level of RPS15A was statistically
correlated to primary pN stage (P=0.07), and showed a trend for
association with synchronous distant metastases (P=0.058),
indicating that overexpression of RPS15A might promote the mobility
and invasiveness of CRC cells. However, the underlying molecular
mechanism needs further investigation.
In conclusion, overexpression of RPS15A predicts a
worse prognosis and outcome of CRC patients through misregulation
of cell cycle progression and promotion of metastasis. Knock-down
of RPS15A expression in CRC cells, remarkably induced cell growth
suppression and cell cycle arrest via p21 upregulation and CDK1
downregulation. Our findings identify RPS15A as a potential
therapeutic target against CRC.
Acknowledgements
The present study was supported by grants from the
National Natural Science Foundation of China (no. 81272390).
References
|
1
|
Sánchez-Tena S, Vizán P, Dudeja PK,
Centelles JJ and Cascante M: Green tea phenolics inhibit
butyrate-induced differentiation of colon cancer cells by
interacting with monocarboxylate transporter 1. Biochim Biophys
Acta. 1832:2264–2270. 2013. View Article : Google Scholar : PubMed/NCBI
|
|
2
|
Labianca R, Nordlinger B, Beretta GD,
Brouquet A and Cervantes A; ESMO Guidelines Working Group. Primary
colon cancer: ESMO Clinical Practice Guidelines for diagnosis,
adjuvant treatment and follow-up. Ann Oncol. 21(Suppl 5): v70–v77.
2010. View Article : Google Scholar : PubMed/NCBI
|
|
3
|
Wolpin BMMJ, Meyerhardt JA, Mamon HJ and
Mayer RJ: Adjuvant treatment of colorectal cancer. CA Cancer J
Clin. 57:168–185. 2007. View Article : Google Scholar : PubMed/NCBI
|
|
4
|
Uechi T, Nakajima Y, Nakao A, Torihara H,
Chakraborty A, Inoue K and Kenmochi N: Ribosomal protein gene
knockdown causes developmental defects in zebrafish. PLoS One.
1:e372006. View Article : Google Scholar : PubMed/NCBI
|
|
5
|
Nakao A, Yoshihama M and Kenmochi N: RPG:
The Ribosomal Protein Gene database. Nucleic Acids Res.
32:D168–D170. 2004. View Article : Google Scholar :
|
|
6
|
Lambertsson A: The minute genes in
Drosophila and their molecular functions. Adv Genet. 38:69–134.
1998. View Article : Google Scholar : PubMed/NCBI
|
|
7
|
Oliver ERST, Saunders TL, Tarlé SA and
Glaser T: Ribosomal protein L24 defect in belly spot and tail
(Bst), a mouse Minute. Development. 131:3907–3920. 2004. View Article : Google Scholar : PubMed/NCBI
|
|
8
|
Jiménez L, Becerra A and Landa A: Cloning,
expression and partial characterization of a gene encoding the S15a
ribosomal protein of Taenia solium. Parasitol Res. 92:414–420.
2004. View Article : Google Scholar : PubMed/NCBI
|
|
9
|
Akiyama N, Matsuo Y, Sai H, Noda M and
Kizaka-Kondoh S: Identification of a series of transforming growth
factor beta-responsive genes by retrovirus-mediated gene trap
screening. Mol Cell Biol. 20:3266–3273. 2000. View Article : Google Scholar : PubMed/NCBI
|
|
10
|
Xu M, Wang Y, Chen L, Pan B, Chen F, Fang
Y, Yu Z and Chen G: Down-regulation of ribosomal protein S15A mRNA
with a short hairpin RNA inhibits human hepatic cancer cell growth
in vitro. Gene. 536:84–89. 2014. View Article : Google Scholar
|
|
11
|
Zhao X, Shen L, Feng Y, Yu H, Wu X, Chang
J, Shen X, Qiao J and Wang J: Decreased expression of RPS15A
suppresses proliferation of lung cancer cells. Tumour Biol.
36:6733–6734. 2015. View Article : Google Scholar : PubMed/NCBI
|
|
12
|
Bordeleau ME, Robert F, Gerard B,
Lindqvist L, Chen SM, Wendel HG, Brem B, Greger H, Lowe SW, Porco
JA Jr, et al: Therapeutic suppression of translation initiation
modulates chemosensitivity in a mouse lymphoma model. J Clin
Invest. 118:2651–2660. 2008.PubMed/NCBI
|
|
13
|
Hagner PR, Mazan-Mamczarz K, Dai B, Balzer
EM, Corl S, Martin SS, Zhao XF and Gartenhaus RB: Ribosomal protein
S6 is highly expressed in non-Hodgkin lymphoma and associates with
mRNA containing a 5′ terminal oligopyrimidine tract. Oncogene.
30:1531–1541. 2011. View Article : Google Scholar :
|
|
14
|
Panwalkar A, Verstovsek S and Giles FJ:
Mammalian target of rapamycin inhibition as therapy for hematologic
malignancies. Cancer. 100:657–666. 2004. View Article : Google Scholar : PubMed/NCBI
|
|
15
|
Venticinque L, Jamieson KV and Meruelo D:
Interactions between laminin receptor and the cytoskeleton during
translation and cell motility. PLoS One. 6:e158952011. View Article : Google Scholar : PubMed/NCBI
|
|
16
|
Õunap K, Käsper L, Kurg A and Kurg R: The
human WBSCR22 protein is involved in the biogenesis of the 40S
ribosomal subunits in mammalian cells. PLoS One. 8:e756862013.
View Article : Google Scholar : PubMed/NCBI
|
|
17
|
Kim SH, Jang YH, Chau GC, Pyo S and Um SH:
Prognostic significance and function of phosphorylated ribosomal
protein S6 in esophageal squamous cell carcinoma. Mod Pathol.
26:327–335. 2013. View Article : Google Scholar
|
|
18
|
Zhang C, Zhang T, Song E, Himaya SW, Chen
X and Zheng L: Ribosomal protein S15A augments human osteosarcoma
cell proliferation in vitro. Cancer Biother Radiopharm. 29:451–456.
2014. View Article : Google Scholar : PubMed/NCBI
|