Introduction
Alcoholism is a risk factor for breast cancer, with
consumption of 3 or more drinks per day leading to a 40–50%
increase in risk, and with approximately 50,000
alcohol-attributable cases per year worldwide (1–3). It
is postulated that the effects of alcohol are not exerted in the
early stage of the carcinogenic process, since alcohol effects are
not associated with ductal carcinoma in situ of the breast
in postmenopausal women. There is also a greater associated risk
for lobular than for ductal breast cancer (4–6).
Alcohol induced cancers may be restricted to estrogen
receptor-positive tumors (2,7).
Even low levels of alcohol consumption (3–6 drinks/week) are
associated with a small increase in breast cancer risk, with the
most consistent measure being cumulative alcohol intake throughout
adult life combined with binge drinking (3–5).
Experimental studies in mice and rats have shown
that ethanol consumption promotes mammary tumors and abnormal
tissue development (8–13) at least partly via the estrogen
pathway (8). In vitro, the
estrogen association has mainly been shown using the breast cancer
luminal epithelial cell line MCF7, which is estrogen and
progesterone receptor positive and lacks ERBB2 gene amplification
or Her2/neu protein overexpression (14–17).
Studies, mostly with an ethanol exposure of less than 1 week and
concentrations higher than 50 mM, produced modest stimulation of
in vitro growth, invasiveness, and migration of MCF7 cells
(18–23) and in other more malignant breast
cancer cell lines (18–23).
In our recent preliminary study using MCF7 cells
(see abstract) (24), we found
that short-term exposure to ethanol was associated with modest
transcriptional upregulation of the metallothionein family, but
long-term exposure led to more substantial upregulation of Oct4,
Nanog, and CEACAM6 protein expression, and results in a global
oncogenic transcriptional signature as well as the stimulation of
anchorage-independence. This process was not directly mediated by
acetaldehyde, nor by observable estrogen responsiveness. These
results suggested that ethanol may enhance the oncogenesis of
breast cancer cells through the interplay of cancer-related genes
and their regulatory miRs.
Surprisingly, few publications are available on the
effects of exposure to ethanol on the MCF-12A cell line (25), which is derived from normal but
immortalized breast epithelial cells, or on other epithelial breast
cell cultures. Similar to MCF7, the MCF-12A cell line is both
estrogen receptor-positive and progesterone receptor-positive
(26). To our knowledge, there are
no publications about MCF-12A cells regarding the transcriptional
signatures that would help to characterize breast tissue related
oncogenic transformation, neither any publications on the role of
microRNAs (miRs) in ethanol treated MCF-12A, particularly with
respect to the miRs that are known to regulate key mRNA levels in
breast cancer oncogenic pathways (27–31).
In turn, there are some related reports on other normal epithelial
breast cell cultures (32,33).
The putative oncogenic effects of alcohol have been
proposed to be mediated by stimulation of estrogen levels and/or
estrogen responsiveness, and also potentially by other effects
unrelated to estrogen (1,2,34–38).
The latter may include the inhibition of DNA methylation,
interaction with retinoid metabolism, or oxidative stress, and
could operate either by ethanol effects or through the first
ethanol metabolite, acetaldehyde, which is produced by alcohol
dehydrogenase (ADH). Acetaldehyde effects might include the
formation of stable DNA adducts or decreased glutathione. However,
it is possible that ethanol, besides these direct or indirect
oncogenic effects, could stimulate a later stage of tumor
progression through increased cell invasiveness, detachment, and
metastasis. A well studied process mediating these alterations in
epithelial cancers is the epithelial mesenchymal transition (EMT),
a process that has been extensively studied in breast cancer and
MCF7 cells (39,40), but not under ethanol induction.
In a recent study, both non-tumorigenic (MCF 10A,
MCF-12A) and tumorigenic (MCF7) breast epithelial cells exposed to
cigarette smoke acquired mesenchymal properties. These properties
included fibroblastoid morphology, increased anchorage-independent
growth, motility, and invasiveness. For the MCF 10A cells, this may
be related to the emergence of a CD44(high)/CD24(low) population,
and in both normal cell types is associated with changes in gene
expression related to EMT. The MCF 10A transplanted into mice,
which were later treated with cigarette smoke extract, showed
increased survival and colonization of the mammary ducts (41). In the only other report that we
could find, the induction of the expression of transcription factor
ESX in MCF-12A confers growth in soft agar and a transformed in
vitro metastatic phenotype consistent with EMT (42). A few studies of ethanol or alcohol
described EMT effects in other normal and malignant tissues and in
breast cancer cells (43–45). No such effects on MCF-12A or other
normal breast epithelial cells have been reported.
In the current study, the effects of short- and
long-term exposures to various physiologically relevant
concentrations of ethanol and relatively high dose acetaldehyde
were studied using MCF-12A monolayers. In one experiment,
ethanol-induced cells were selected for anchorage independence by
survival in soft agar. Analysis of stem cell markers and global
transcriptional gene expression signatures including miRs, with
particular reference to EMT, were carried out to better understand
the mechanism of action of alcohol on the putative induction of
malignant features on normal breast epithelial cells, in order to
better clarify early effects of alcohol in breast cancer.
Materials and methods
Cell lines
MCF-12A (catalog CRL-10782) was obtained from the
American Type Culture Collection (ATCC; Manassas, VA, USA) and
grown according to the recommendations provided by the supplier, in
medium containing DMEM/F12 in the presence of 2.5% horse serum and
supplemented with epidermal growth factor, hydrocortisone, bovine
insulin, cholera toxin, and antibiotic/antimycotic. Cells were
carried in 6 well plastic plates at 37°C, 5% CO2 and
passaged as required at 90% confluence or less. Ethanol, molecular
grade (Fisher Scientific, Pittsburgh, PA, USA) and acetaldehyde ACS
grade (Sigma Aldrich, St. Louis, MO, USA) were added to cell
culture wells as described and replaced when culture medium was
changed, typically at 3 day intervals. Mammospheres were generated
by disaggregating monolayer cultures and applying 50,000 cells per
well to Corning Inc. (Corning, NY, USA) ultra low attachment
plastic plates in the presence of mammary epithelial cell growth
medium (Fisher, MEBM) plus 2% v/v B27 supplement (Invitrogen,
Carlsbad, CA, USA) and 0.01 mg/ml bovine insulin.
Western blots
Blots were accomplished using standard methods:
Cells were dissolved in boiling buffer (1% SDS, 1 mM sodium
orthovanadate, 10 mM Tris pH 7.4, and protease inhibitors) by
scraping cells from wells and passing the lysate several times
through a 26 gauge needle to reduce viscosity. Protein
concentrations and recoveries were determined using the Pierce
protein determination kit (Thermo Fisher, Waltham, MA, USA).
Protein samples were applied to 4–15% linear gradient gels
(Bio-Rad, Richmond, CA, USA) and electrophoresed,
electrophoretically transferred to PVDF membranes (Bio-Rad), and
analyzed for specific proteins by antibody binding using standard
methods including enzyme bound second antibodies and Super Signal
West Pico luminescent solution (Pierce).
RNA expression analysis
Cell cultures in 6-well plates were washed once with
PBS, and RNA was extracted and purified using the Qiagen RNeasy
Plus Micro kit (Qiagen Sciences Inc., Germantown, MD, USA). RNA
concentration and recovery was determined using the Nanodrop
apparatus (Thermo Fisher), and RNA integrity was determined by
Bioanalyzer (Agilent, Santa Clara, CA, USA). All RNA samples were
determined to have an RNA Integrity Number (RIN) of 8 or higher.
Gene expression was determined from RNA samples by DNA microarray
analysis using the Affymetrix (Santa Clara, CA, USA) Human Gene 1.0
ST carried out by the UCLA DNA Microarray Core facility, or by the
Affymetrix Human Gene 1.1 ST by the UCLA Pathology Department DNA
Laboratory. Relative expression values from different treatments
were compared using Microsoft Excel. Some samples were subjected to
polymerase chain reaction (PCR) as follows: RNA samples of 1 μg
were reverse transcribed using the Invitrogen SuperScript III
first-strand synthesis Supermix according to the manufacturer's
recommendation. cDNA derived from the 1 week ethanol treated
samples and untreated control cDNA samples from the same 6-well
plate were subjected to polymerase chain reaction assays for MT1X
and results were compared with GAPDH controls, according to
standard methods using the Clontech Advantage 2 PCR kit (Mountain
View, CA, USA) according to the manufacturer's recommendations.
Primers: for MT1X forward TCATCTGTCCCGCTGCGTGT and reverse
GGCACAGGAGCCAACAGGCG. For GAPDH, forward GTCGCCAGCCGAGCCACACT and
reverse TGACCTTGGCCAGGGGTGCT. Gene identification labels are
according to the NCBI (National Center for Biotechnology
Information) Gene database: http://www.ncbi.nlm.nih.gov/gene and are referred to
as NCBI:Gene in figure and table descriptions.
MicroRNA analysis
Cells were grown on 6-well plates in the presence or
absence of either ethanol or acetaldehyde as described in Results.
Total RNA including microRNAs (miRs) was purified using the Mirvana
microRNA purification kit (Ambion; Life Technologies, Austin, TX,
USA). Samples of RNA were analyzed for miR content by LC Sciences,
Houston, TX, USA. Relative miR levels are expressed on an arbitrary
scale following normalization. MicroRNA results and DNA micro-array
results are deposited in the Gene Expression Omnibus (GEO) archive
under accession number GSE76953. MicroRNA names and sequences are
available at www.mirbase.org.
Flow cytometry
Cells were grown and treated with ethanol or
acetaldehyde as described, washed twice with Hanks Balanced Salt
Solution (HBSS), disaggregated by repeated pipeting in Cell
Stripper (Mediatech, Manassas, VA, USA), pelleted, and resuspended
in staining buffer consisting of PBS plus 3% FBS (SB). Cells were
incubated in the presence of fluorescent conjugated antibodies for
30 min. on ice, washed twice with SB, and finally resuspended in SB
for flow cytometry on an LSR II (BD Biosciences, San Diego, CA,
USA). Controls using either no antibody or all possible
combinations of antibodies were used to validate specificity of
cell staining. Data analysis and plotting were done using FACSDiva
Version 6.1.1 software. All fluorophore-conjugated antibodies and
isotype controls were from eBioscience (San Diego, CA, USA).
Soft agar growth
Cells were trypsinized and subjected to the soft
agar tumorigenic/anchorage-independent cell selection procedure:
Cells were suspended in 1 ml/well of warm (37°C) 0.3–0.5% agar in
culture medium (soft agar layer) and 10,000 cells/ml were deposited
in duplicate or triplicate wells above a layer of 1 ml of 1% agar
(in the same medium) that had been allowed to solidify on 6-well
plates at 4°C (hard layer agar). Cultures were allowed to grow for
4 weeks and when foci were visible, they were stained with 0.005%
crystal violet in Hanks' solution for 1 h, and colonies were
counted. In certain cases, separate foci from the soft agar
cultures not subjected to staining were transferred to culture
medium in T-25 flasks, grown as monolayers in the absence of
ethanol or acetaldehyde, and used for further experiments including
gene expression analysis.
Results
Short-term continuous exposure of MCF-12A
cells to high dose ethanol causes changes in the global
transcriptional signature that are not, however, induced by
acetaldehyde, and does not affect anchorage-independence
Monolayer cultures of MCF-12A cells were subjected
to 1 week incubations with 25 mM ethanol, roughly equivalent to the
peak alcohol concentration in serum after 4–5 glasses of wine, or
to 2.5 mM acetaldehyde replaced daily, a concentration several-fold
higher than would be expected from this level of alcohol ingestion
in either humans or rats (46,47).
These concentrations were similar to the ones used by us in a
preliminary study of 1- and 4-week exposures of MCF7 breast
epithelial cancer cells to these agents (24). No obvious effects on cell culture
growth or morphology were observed in the MCF-12A cells, and the
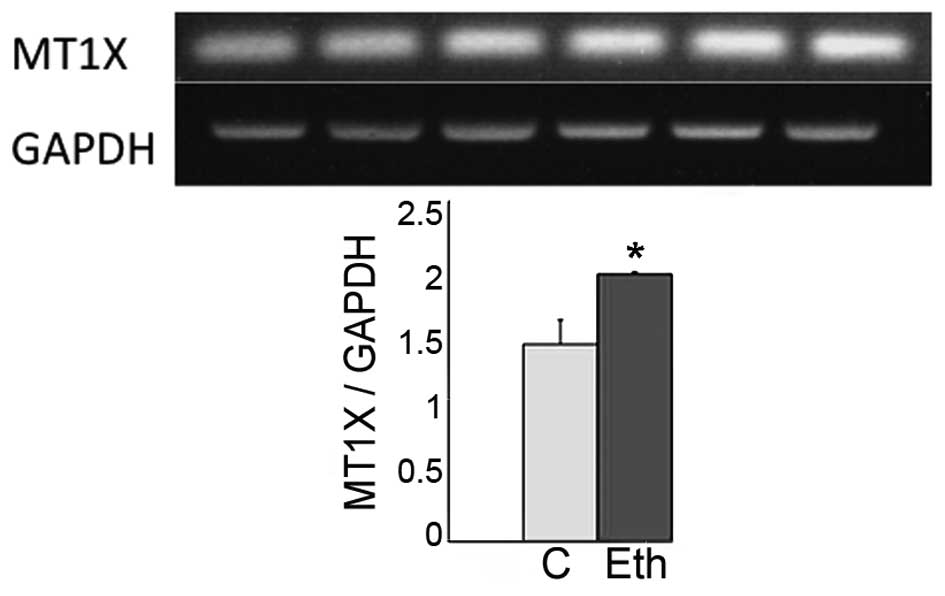
extracted RNAs were subjected to DNA microarray assays. Table I shows that mRNA levels for the
metallothionein genes, known to be affected by ethanol, were
increased by ethanol in these experiments, particularly the 1F, 1L
and 1X, but the same genes were largely unaffected by acetaldehyde.
This result was confirmed for MT1X by quantitative RT/PCR (Fig. 1).
 | Table IMCF-12A monolayers were exposed to
ethanol or acetaldehyde for 1 week.a |
Table I
MCF-12A monolayers were exposed to
ethanol or acetaldehyde for 1 week.a
| Ethanol (Eth) | Acetaldehyde
(Act) |
|---|
|
|
|
|---|
| Gene | Eth/C ratio | C value | Act/C ratio | C value |
|---|
| MT1A | 1.32 | 178 | 1.13 | 1039 |
| MT1B | 1.25 | 97 | 1.02 | 168 |
| MT1F | 2.24 | 2248 | 1.09 | 3193 |
| MT1G | 1.33 | 3777 | 0.94 | 4279 |
| MT1H | 1.31 | 176 | 1.11 | 221 |
| MT1L | 2.01 | 1806 | 0.99 | 3975 |
| MT1X | 2.14 | 1816 | 0.99 | 7219 |
| MT2A | 1.24 | 13940 | 0.96 | 20349 |
| MT4 | 1.53 | 128 | 1.25 | 147 |
In total, 129 MCF-12A genes were upregulated by
>2.0 and 257 were downregulated to <0.5 by 25 mM ethanol, as
compared to control MCF-12A cells grown in the absence of these
agents. By contrast, 2.5 mM acetaldehyde only upregulated 19 genes
by >2.0 and downregulated 58 genes by <0.5. Within these
ranges, and considering genes that are related to alcohol
metabolism, ethanol upregulated AOX1 and downregulated ALDH3B2, and
acetaldehyde similarly affected to a lesser extent both genes and
increased ALDH1A3 (Table II).
However, the expression of the stem cell/Aldefluor related isoform,
ALDH1A1, was not affected by either treatment.
| Table IIThe short-term exposure of MCF-12A
cells to high dose ethanol or acetaldehyde changes the
transcriptional expression balance among members of the serpin,
ankyrin, and alcohol metabolism gene families.a |
Table II
The short-term exposure of MCF-12A
cells to high dose ethanol or acetaldehyde changes the
transcriptional expression balance among members of the serpin,
ankyrin, and alcohol metabolism gene families.a
| | Ethanol (Eth) | Acetaldehyde
(Act) |
|---|
| |
|
|
|---|
| Gene name | Gene symbol | Eth/cont ratio | C value | Act/cont ratio | C value |
|---|
| Alcohol
metabolism | | | | | |
| Aldehyde
Dhd1A3 | ALDH1A3 | 0.80 | 1191 | 1.91 | 376 |
| Aldehyde
Dhd3B2 | ALDH3B2 | 0.19 | 477 | 0.69 | 226 |
| Aldehyde Ox 1 | AOX1 | 1.91 | 138 | 1.86 | 213 |
| Serpins | | | | | |
| Serpin A1 | A1 | 4.41 | 314 | 0.98 | 504 |
| Serpin B2 | B2 (PAI 2) | 0.14 | 2625 | 2.04 | 495 |
| Serpin B3 | B3 | 0.10 | 2267 | 1.14 | 754 |
| Serpin B7 | B7 | 0.11 | 886 | 0.76 | 41 |
| Ankyrins | | | | | |
| Ankyrin 36B | ANKRD 36Bb | 2.07 | 104 | 1.60 | 152 |
| Ankyrin 22 | ANKRD 22 | 0.17 | 1027 | 0.72 | 67 |
|
Epithelial/mesenchymal transition | | | | | |
| Cadherin 11 | CDH11 | 3.25 | 153 | 0.97 | 42 |
| Interleuk 31 rec
A | IL3IRA | 2.72 | 125 | 1.49 | 62 |
| Connect tiss
gf | CTGF | 2.67 | 284 | 0.91 | 748 |
| Integrin sub
b6 | ITGB6 | 2.53 | 236 | 1.06 | 118 |
| Laminin β3 | LAMB3 | 2.46 | 1103 | 1.50 | 1822 |
| Matrix metl pep
2 | MMP2 | 2.34 | 210 | 1.09 | 495 |
| Thrombospondin
1 | THBS1 | 2.15 | 2410 | 1.36 | 1045 |
| Met assoc lung
ad | MALAT1b | 1.86 | 388 | 1.67 | 2942 |
| Interleukin 6 | IL6 | 2.12 | 81 | 1.42 | 119 |
| Trans GFβ2 | TGFB2 | 2.09 | 413 | 1.36 | 856 |
| Cadherin 4 | CDH4 | 2.00 | 213 | 0.88 | 145 |
| Keratin 17 | KRT 17b | 0.51 | 10650 | 0.55 | 5277 |
| Keratin 78 | KRT 78 | 0.27 | 314 | 1.14 | 101 |
| Keratin 23 | KRT 23 | 0.24 | 228 | 0.76 | 127 |
| Keratin 80 | KRT 80 | 0.22 | 727 | 0.98 | 100 |
| Keratin 16 | KRT 16b | 0.28 | 2923 | 0.49 | 1850 |
| Keratin 4 | KRT 4 | 0.11 | 1197 | 0.71 | 176 |
Alcohol substantially affected the transcription of
4 serpins, upregulating A1 and downregulating B3, B7, and B2 (PAI2)
but acetaldehyde only affected SerpinB2. One ankyrin mRNA was
increased by both agents (37),
and one was decreased by both (22). Remarkably, a number of other genes
related to EMT were upregulated by ethanol (e.g., CTGF, LAMB3,
TGFB2 and others) or downregulated (KRT17, KRT16, KRT4, and other
keratins) as expected for the EMT process. Again, acetaldehyde
affected only some of these genes and to a much lesser extent.
These transcriptional alterations elicited by 1 week
incubation did not translate into phenotypic changes related to
malignancy, since neither ethanol nor acetaldehyde treatment caused
anchorage-independence as judged by the lack of foci formation in
soft agar, neither was there any effect regarding mammosphere
formation or increased stem cell content as judged by
immunocytochemistry of the embryonic stem cell genes Oct4 or nanog,
or by quantitative western blots (data not shown).
Long-term continuous exposure of MCF-12A
cells to lower doses of ethanol or acetaldehyde than the ones
applied in the short-term incubations induce changes in morphology,
cell growth, and anchorage-independence
In order to examine the impact of more prolonged
exposure to ethanol or acetaldehyde, so as to better model the long
term processes affecting tissues in the alcohol-drinking human,
MCF-12A monolayer cultures were incubated in the presence of one or
the other of these compounds for 4 weeks. However, in contrast to
our previous experience with MCF7 cells, whose proliferation was
stimulated by 25 mM ethanol (24),
this high concentration led, strikingly, to MCF-12A cell death
after 2 weeks, with only a very small fraction of cells surviving.
Parallel incubations with lower concentrations (10 and 5 mM)
allowed growth but caused a considerable slowing of cell
proliferation, and only even lower concentrations (2.5 and 1.0 mM)
allowed normal replication of MCF-12A cells.
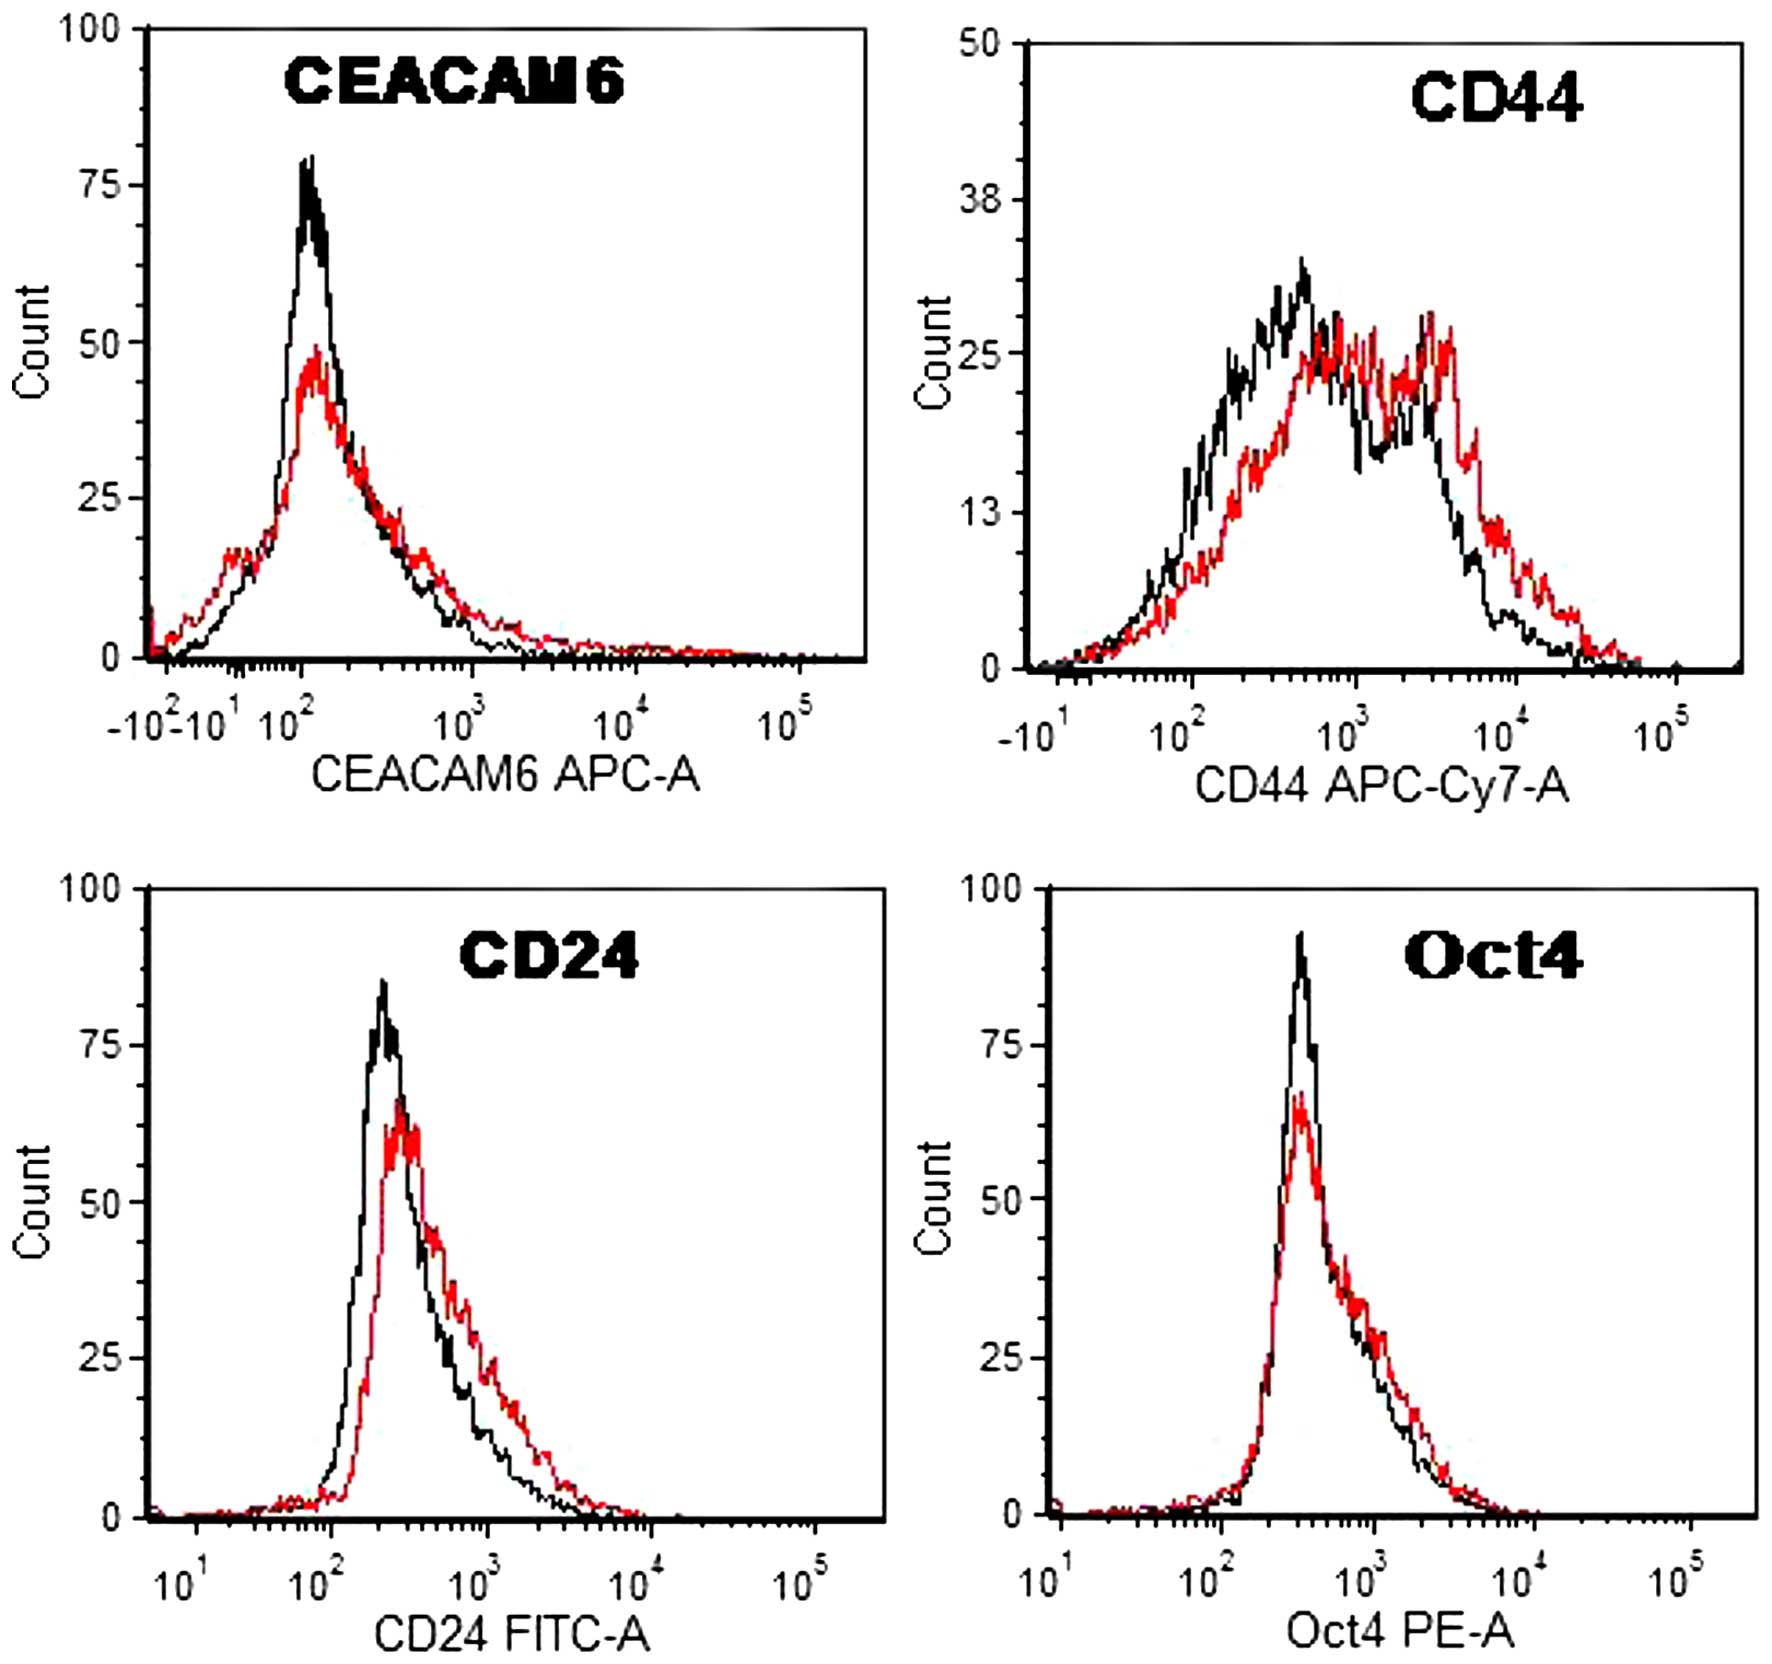
Flow cytometry of the cells exposed to 2.5 mM
ethanol failed to show an enrichment of CEACAM6+ cells
which had been observed in the case of the MCF7 cells incubated
with ethanol at 25 mM (24). Flow
cytometry also failed to show Oct4+ cells that would
denote stem cells (Fig. 2), but
showed the presence of CD44+/CD24(low) cells that are
suspected as breast cancer stem cells (48). This finding prompted us to
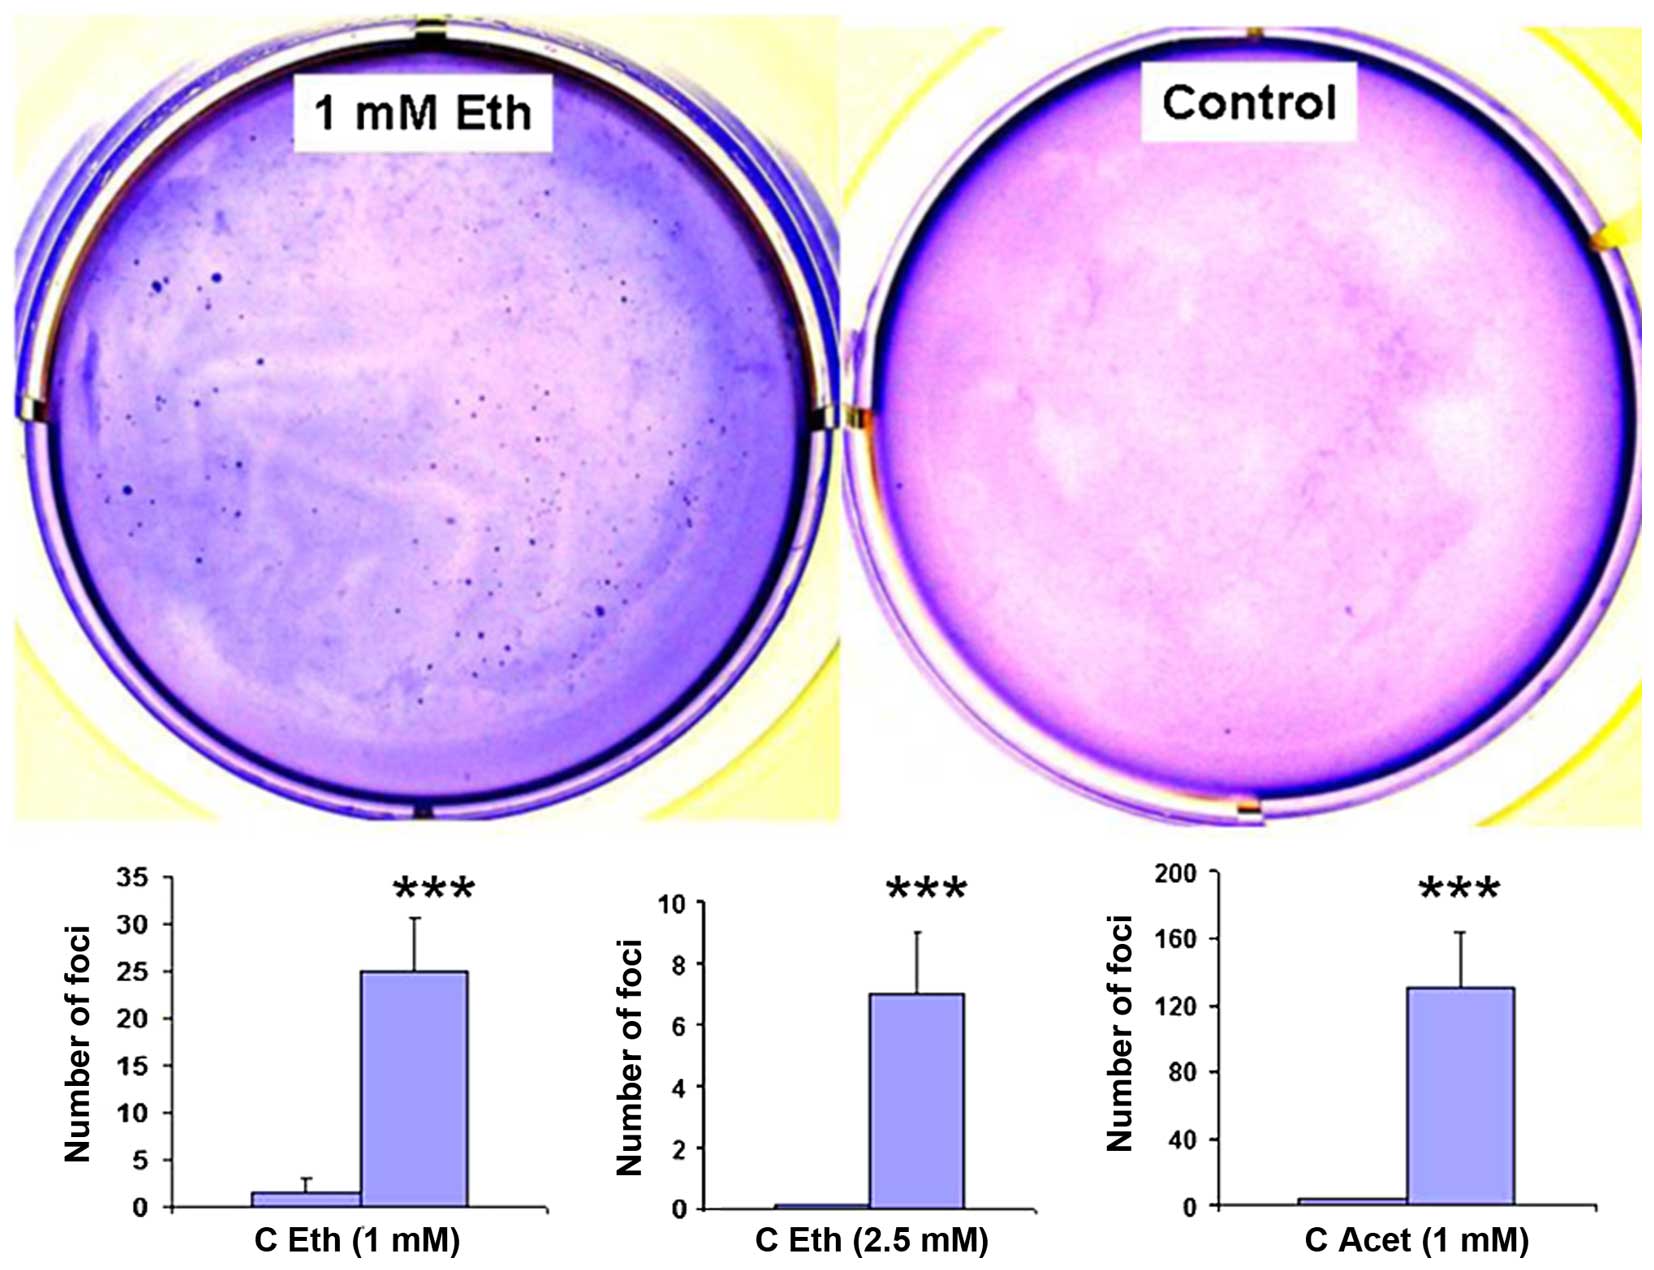
investigate whether ethanol exposure was associated with the
induction of anchorage-independence as would be shown by foci
formation in soft agar. Fig. 3
shows that this is the case, with 2.5 mM and as low as 1 mM
ethanol, and that in contrast to the 1 week incubations with 2.5 mM
acetaldehyde, which had not caused any oncogenic phenotype change,
acetaldehyde exposure for 4 weeks at 1.0 mM increased the number of
foci considerably.
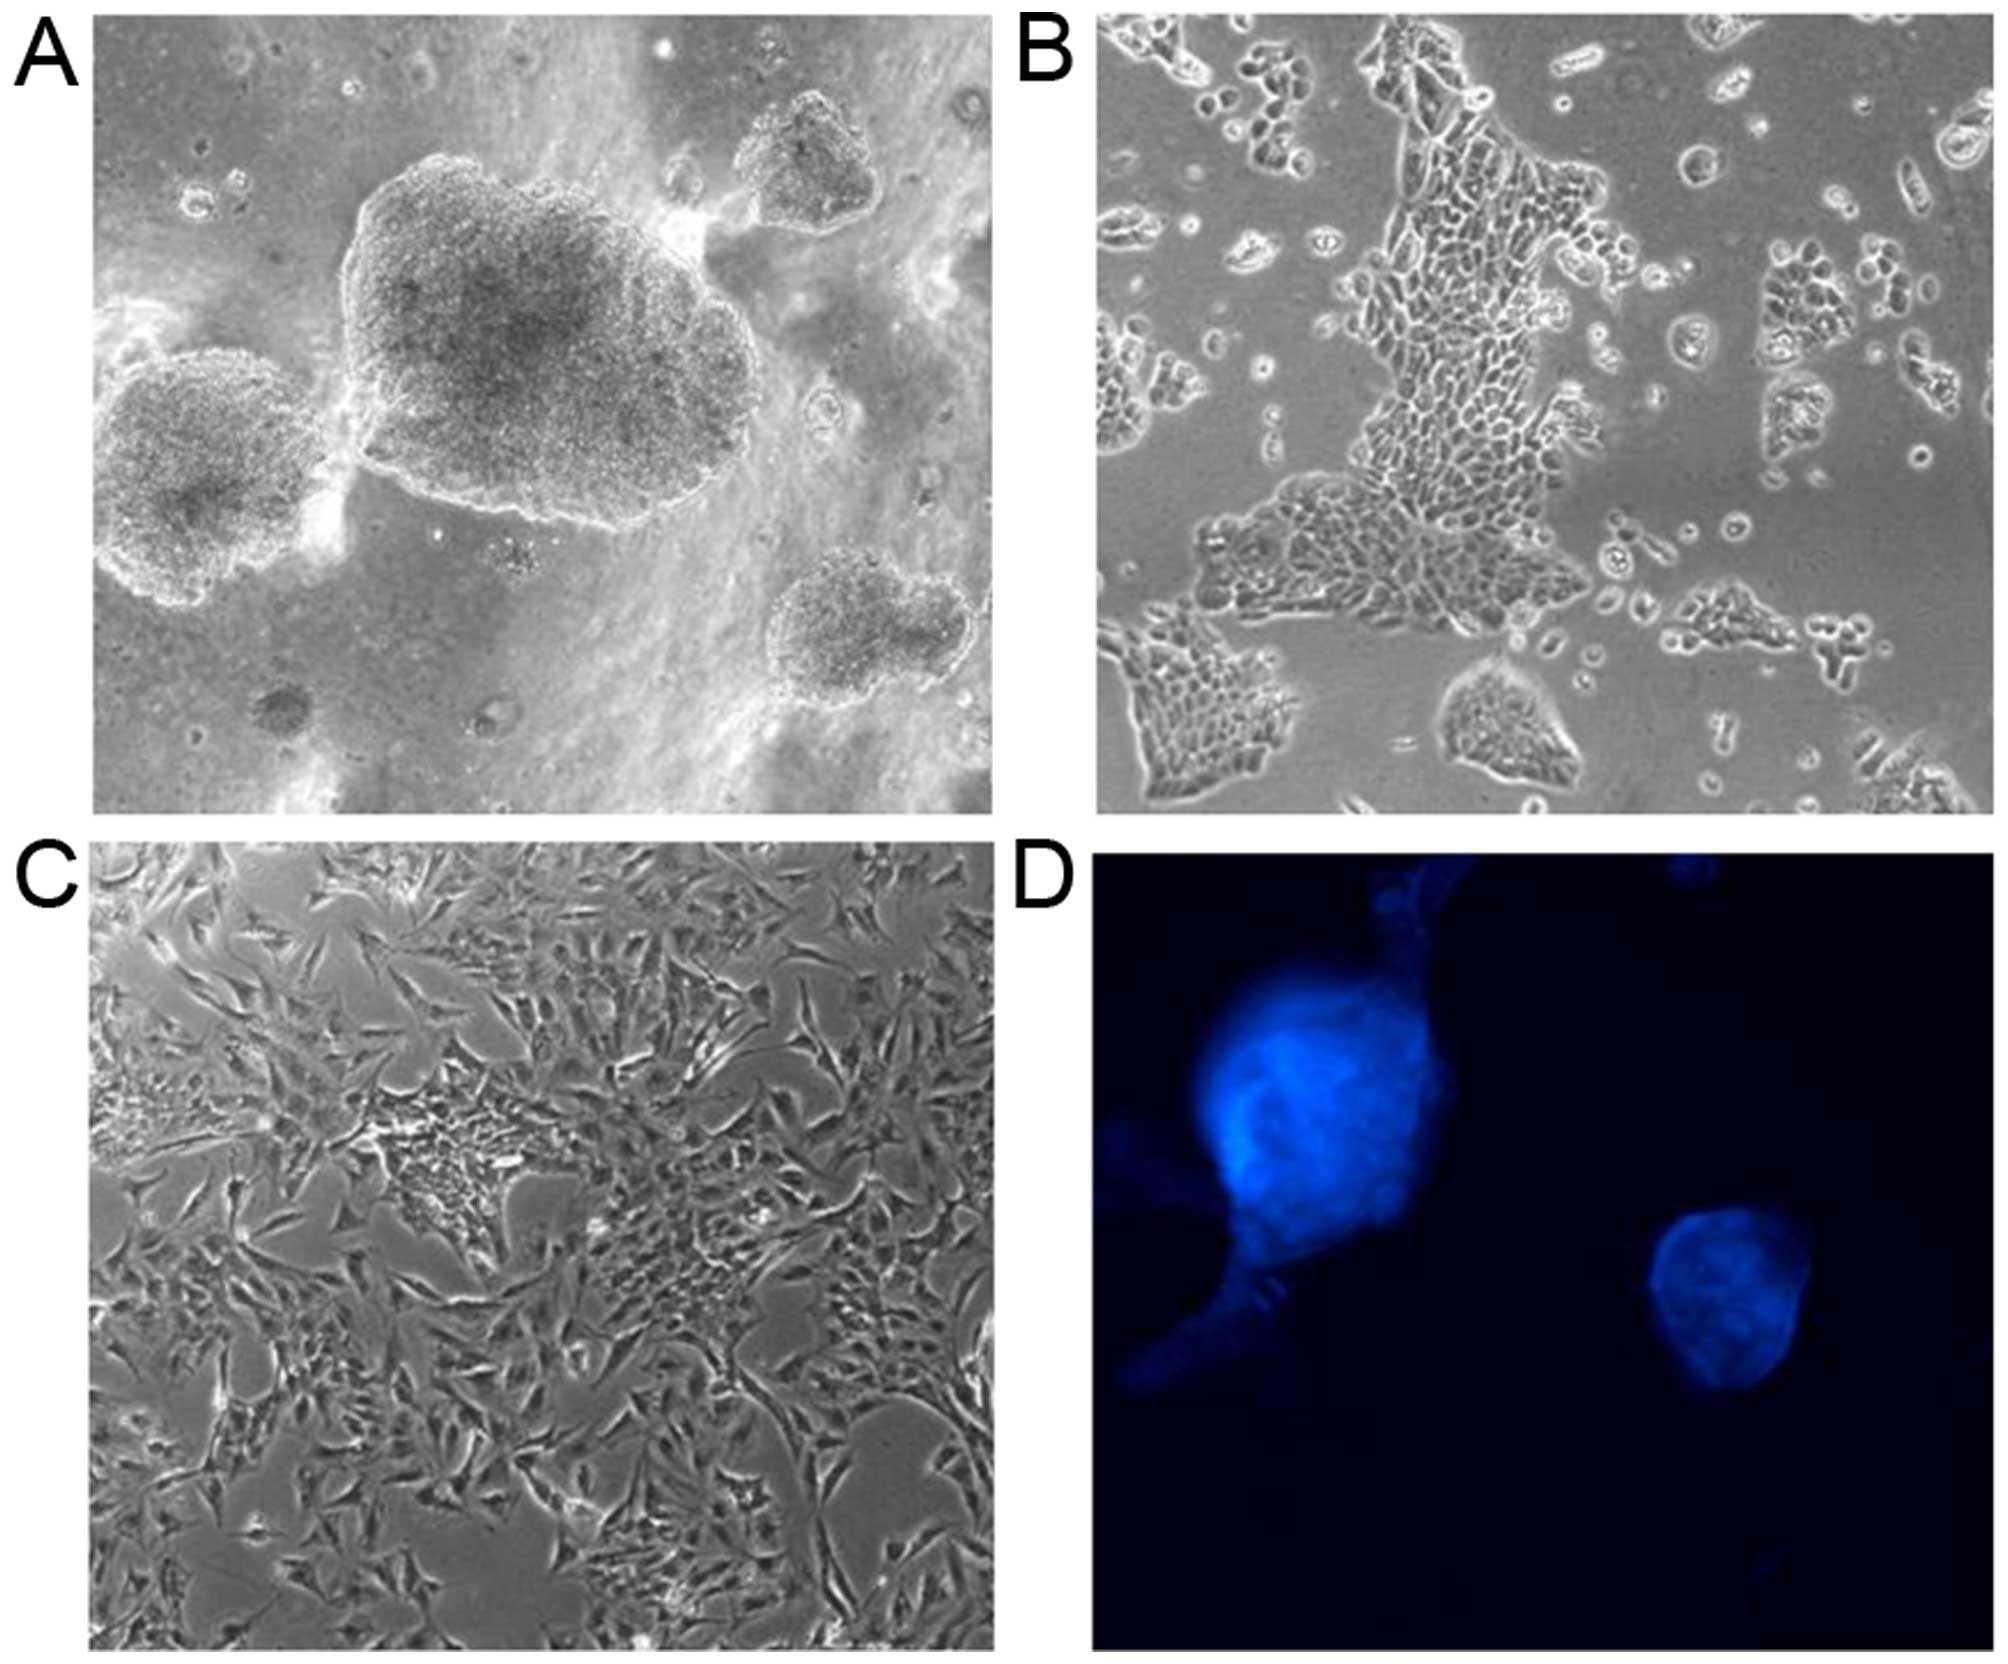
The foci from the 2.5 mM ethanol incubations
(Fig. 4A) are able to grow in
monolayer and although initially they show the cobblestone
morphology of standard MCF-12A cells (Fig. 4B), after growth for approximately 4
weeks they develop typical mesenchymal morphology (Fig. 4C). This is suggestive of the EMT
that the 1 week incubation with 25 mM alcohol suggested, as shown
in Table II. Moreover, these
cloned cells coalesced to form multiple mammospheres in the
appropriate medium (Fig. 4D). The
cells persist for several months in culture and can be stored
stably at liquid nitrogen temperature.
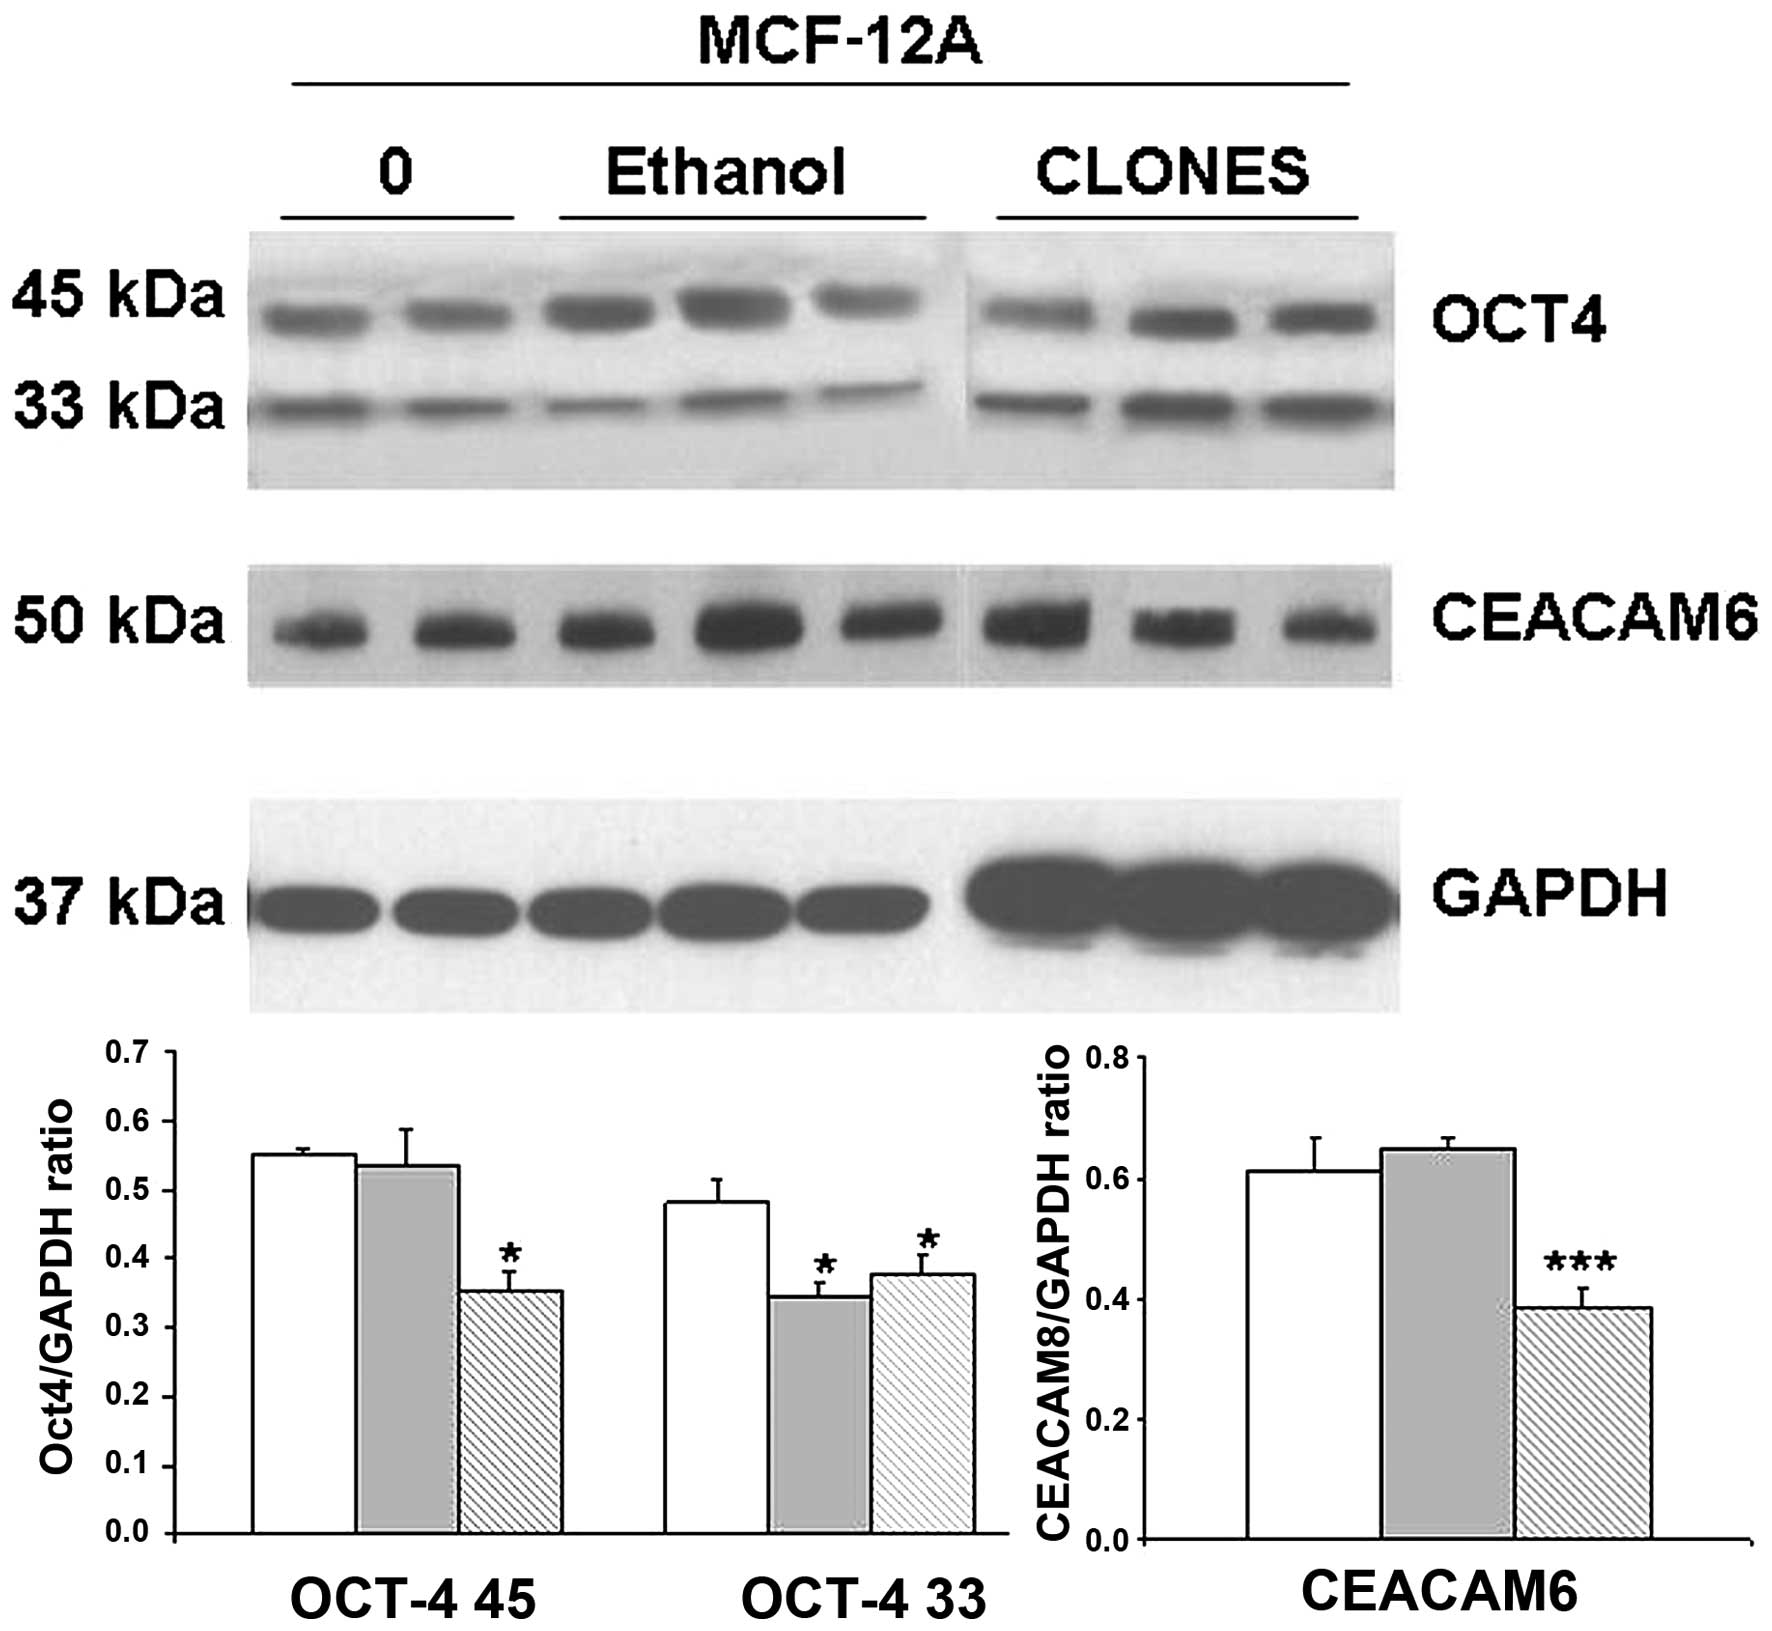
We expected, based on preliminary results with MCF7
cells, that CEACAM6, indicative of oncogenesis, or Oct4, indicative
of stemness, would be overexpressed after the 4-week exposure to
2.5 mM ethanol and particularly in the soft agar selected cells
(SASC). However, western blot analysis showed either no change or a
significant decrease (Fig. 5).
Continuous exposure of MCF-12A cells to
low dose ethanol is associated with significant alterations in the
global transcriptional signature, including changes consistent with
induction of EMT
DNA microarray assays were performed on RNAs
isolated from the MCF-12A cells growing in monolayer in the absence
of treatment (control) and from the 2.5 mM ethanol and 1.0 mM
acetaldehyde incubations, as well as from the soft agar selected
cells (SA clone) described above. Table III shows six families of genes
that are targeted by or markers of EMT: claudin, integrin, keratin,
cadherin, serpin, and laminin. Incubation with ethanol
substantially downregulated six keratins and two claudins, with
none upregulated, whereas in the case of integrins, cadherins,
serpins and laminins, some were upregulated and some downregulated.
Remarkably, out of the 26 substantial changes caused by ethanol,
only 5 genes (keratin 10, cadherin related member 1, cadherin 2,
serpin E2 and laminin 4) were similarly affected by
acetaldehyde.
| Table IIIGene expression analysis of MCF-12A
grown in monolayer in the presence or absence of ethanol, or as
soft agar selected cell clones compared with control
MCF-12A.a |
Table III
Gene expression analysis of MCF-12A
grown in monolayer in the presence or absence of ethanol, or as
soft agar selected cell clones compared with control
MCF-12A.a
| | Monolayer | SA Clone |
|---|
| |
|
|
|---|
| Gene ID | Gene
description | Eth/cont | Act/cont | SASC/cont |
|---|
| Claudin and
Integrin families |
| CLDN8 | Claudin 8 | 0.95 | 0.95 | 0.25 |
| CLDN4 | Claudin 4 | 0.9 | 1.0 | 0.21 |
| CLDN7 | Claudin 7 | 0.17 | 0.8 | 0.15 |
| CLDN 1 | Claudin 1 | 0.09 | 0.9 | 0.07 |
| ITGB8 | Integrin, β8 | 1.2 | 1.0 | 3.5 |
| ITGBL1 | Integrin β like
1 | 1.3 | 1.0 | 3.3 |
| ITGA3 | Integrin, α3 | 1.3 | 1.0 | 2.5 |
| ITGB4 | Integrin, β4 | 0.33 | 0.8 | 0.2 |
| ITGB6 | Integrin, β6 | 0.46 | 1.0 | 0.18 |
| ITGA6 | Integrin, α6 | 0.36 | 0.9 | 0.16 |
| Serpin family |
| SERPINE2 | Serpin E2 | 22 | 7.7 | 9 |
| SERPINB1 | Serpin B1 | 1.7 | 1.6 | 3 |
| SERPINH1 | Serpin H1 | 1.5 | 1.2 | 2.9 |
| SERPINB5 | Serpin B5 | 0.6 | 1.0 | 0.3 |
| SERPINA3 | Serpin A3 | 0.5 | 1.0 | 0.2 |
| SERPINB13 | Serpin B13 | 0.1 | 0.7 | 0.06 |
| SERPINB3 | Serpin B3 | 0.05 | 1.0 | 0.02 |
| Keratin and
Cadherin families |
| KRT5 | Keratin 5 | 0.6 | 1.0 | 0.32 |
| KRT6C | Keratin 6c | 0.6 | 1.0 | 0.19 |
| KRT16P3 | Keratin 16
pseudogene 3 | 0.3 | 1.1 | 0.1 |
| KRt17 | Keratin 17 | 0.1 | 1.2 | 0.05 |
| KRT16 | Keratin 16 | 0.1 | 1.2 | 0.02 |
| KRT10 | Keratin 10 | 0.1 | 0.3 | 0.01 |
| CDHR1 | Cad rel-member
1 | 22 | 16 | 0.66 |
| CDH2 | Cad 2, t1,
N-cadherin | 3 | 1.9 | 4.9 |
| CDH13 | Cad 13,
H-cadherin | 1.7 | 1.2 | 0.43 |
| CDH1 | Cad1, type 1,
E-cadher | 0.1 | 1.1 | 0.05 |
| CDH3 | Cad 3, t1,
P-cadherin | 0.13 | 0.9 | 0.02 |
| Laminin family |
| LAMA4 | α4 | 8.1 | 2.2 | 25 |
| LAMC1 | γ1 | 2.1 | 1.5 | 2.3 |
| LAMA3 | α3 | 0.38 | 0.9 | 0.33 |
| LAMB3 | β3 | 0.32 | 0.7 | 0.07 |
| LAMC2 | γ2 | 0.43 | 1.0 | 0.06 |
The most striking changes were seen in the SASC
clone, where virtually every change induced by ethanol in the
monolayer was magnified to a remarkable extent, except for a few
genes (serpinE2, LAMC1, CLDN7, CLDN1, and LAMA3). There were a few
other genes not changed in the ethanol treated monolayer which
appeared in the SASC changed population. This suggests that most of
the alterations seen in the monolayer were due to changes to a
subfraction of cells which are reflected in the cloned foci
selected by soft agar growth.
The EMT signature was confirmed by changes in the
expression of key gene families triggering EMT, such as
inter-leukins, TGFβ, and IGF families, as well as the Twist1/Snail
pathways (Table IV). Twist1 is of
particular interest since it was also induced by acetaldehyde, and
the SASC clone over-expression was much lower than that seen in
monolayer. Some similar patterns described in Table III were seen: ethanol inducing in
monolayer interleukin up- and down-regulation, upregulated genes in
the TGFβ and IGF families, and most of these changes amplified in
the SASC clone. However, a few genes did not follow this trend in
the SASC clone as compared with the monolayer, such as IL1R2, CD36
and IGFBP4. Of note, acetaldehyde treated cells differed from the
results shown in Table III.
| Table IVEffects of long-term ethanol exposure
of MCF-12A cells on the expression of key gene families triggering
EMT.a |
Table IV
Effects of long-term ethanol exposure
of MCF-12A cells on the expression of key gene families triggering
EMT.a
| | SA Clone | Monolayer |
|---|
| |
|
|
|---|
| Gene ID | Gene
description | SASC/cont | Eth/cont | Act/cont |
|---|
| Interleukin
family |
| IL7R | Interleukin 7
receptor | 92.1 | 13.5 | 9.1 |
| IL1R1 | Interleukin 1
receptor, type 1 | 10.5 | 8.1 | 5.5 |
| IL6ST | Interleukin 6
signal transducer | 5.1 | 2.2 | 1.4 |
| IL1R2 | Interleukin 1
receptor type II | 3.4 | 10.3 | 10.0 |
| CXCR1 | Chemokine (C-X-C
motif) receptor 1 | 0.75 | 1.0 | 1.0 |
| IL22RA1 | Interleukin 22
receptor α1 | 0.44 | 1.0 | 1.0 |
| IL1A | Interleukin 1 | 0.18 | 0.18 | 0.64 |
| IL1RAP | Interleukin 1
receptor accessory protein | 1.29 | 0.59 | 0.83 |
| IL18 | Interleukin 18 (ifn
γ inducing factor) | 0.13 | 0.22 | 1.0 |
| IGF family |
| CTGF | Connective tissue
growth factor | 11.9 | 10 | 4.6 |
| IGFBP4 | Insulin-like growth
factor binding protein 4 | 6.9 | 6.0 | 4.3 |
| IGFBP3 | Insulin-like growth
factor binding protein 3 | 5.0 | 4.5 | 2.7 |
| IGFBP2 | Insulin-like growth
factor binding protein 2 | 4.0 | 1.7 | 1.0 |
| IGF2R | Insulin-like growth
factor 2 receptor | 3.7 | 1.6 | 1.1 |
| IGF2BP3b | Insulin-like GF2
mRNA binding protein 3 | 2.0 | 1.0 | 1.0 |
| Others |
| ANGPT1 | Angiopoieitin | 47 | 15 | 9 |
| FN1b | Fibronectin 1 | 8.7 | 5.8 | 4.5 |
| ZEB2 | Zinc finger E-box
binding homeobox 2 | 5.5 | 5.2 | 2.6 |
| EGFR | Epidermal growth
factor receptor | 0.49 | 0.44 | 0.76 |
| PPARgC1A | PPARγ coactivator
1α | 3.4 | 1.2 | 1.0 |
| ZEB1 | Zinc finger E-box
binding homeobox 1 | 3.3 | 3 | 1.9 |
| TWIST1 | Twist basic
helix-loop-helix transcription factor 1 | 2.4 | 6.7 | 4.5 |
| TGFβ and IGF
families |
| TGFb2 | Transforming growth
factor β2 | 34 | 19 | 7.1 |
| FSL1 | Follistatin-like
1 | 33.6 | 11.5 | 9.3 |
| THBS1 | Thrombospondin
1 | 26.9 | 2.4 | 1.9 |
| CD36 | CD36 molecule
(thrombospondin receptor) | 9.5 | 21.1 | 3.9 |
| TGFBR2 | Transforming growth
factor, β receptor 2 | 8.6 | 2.4 | 1.3 |
| BMPR1Ab | Bone morphogenetic
protein receptor, type 1A | 3.9 | 0.9 | 0.9 |
| BMPR2 | Bone morphogenetic
protein receptor, type II | 3.7 | 1.1 | 1.1 |
| TGFBRAP1 | TGFβ associated
receptor assoc protein 1 | 3.1 | 0.9 | 0.8 |
| SMAD7 | Smad family member
7 | 0.49 | 1.0 | 1.0 |
| GDF15 | Growth
differentiation factor 15 | 0.4 | 0.5 | 0.7 |
| TGFB1 | Transforming growth
factor β1 | 0.3 | 1.5 | 1.3 |
| THBD | Thrombomodulin | 0.07 | 0.4 | 0.9 |
| Aldehyde/Alcohol
metabolism |
| AOX1 | Aldehyde oxidase
1 | 18.5 | 7.9 | 4.2 |
| ALDH1B1 | Aldehyde
dehydrogenase 1 family, member b1 | 4.9 | 1.2 | 1.0 |
| AKR1B1 | Aldo-keto reductase
family 1, member B1 | 2.9 | 1.9 | 1.5 |
| ADH5 | Alcohol
dehydrogenase 5 | 2.56 | 1.05 | 1.00 |
| ALDH1L2 | Aldhyde
dehydrogenase 1 family, member L2 | 2.10 | 0.47 | 0.75 |
| ALDH1A3 | Aldehyde
dehydrogenase 1 family, member A3 | 0.43 | 0.75 | 0.86 |
| ALDH3B2 | Aldehyde
dehydrogenase 3 family, member B2 | 0.17 | 0.70 | 1.00 |
| AKR1B10 | Aldo-keto reductase
family 1, member B10 | 0.01 | 0.14 | 1.46 |
Table IV (bottom)
shows changes that are to be expected in the transcription of genes
related to aldehyde and alcohol metabolism, although acetaldehyde
(with the exception of aldehyde oxidase 1) did not change their
expression substantially. As in the other cases, the changes
induced by ethanol were much higher in the SASC clone than in the
monolayer culture. Other isolated gene expression alterations are
compiled, particularly the increase in angiopoietin and
fibronectin1 (Table IV:
others).
MCF-12A transcriptional signature changes
caused by long-term exposure to low doses of ethanol also include
changes in cancer-related gene families and microRNAs
Ethanol also affects genes directly related to
breast cancer as well as some genes with a possible relationship to
oncogenesis (Table V). This was
only observed in the current study in the SASC, and not in the
parent monolayer exposed to ethanol or acetaldehyde. Upregulation
is observed in 5 members of the BRCA family of tumor-suppressor
genes, particularly related to breast cancer, such as BRCA1/BRCA2
and their complex BRCC3, at levels of 2.3- to 4.5-fold. Some
members of the myc family (such as RLF, MYCBP2 and MINA) are
upregulated from 2.9- to 3.3-fold. Within a group of genes still
not well defined in relation to cancer, 9 members of the
neuroblastoma breakpoint family (NBPFs) are all upregulated from
2.2- to 2.7-fold, and three members of the small nucleolar RNA
family (SNORD) are upregulated by 2.0- to 2.5-fold, versus four
others down-regulated (0.12 to 0.32).
| Table VEffects of long-term ethanol exposure
of MCF-12A cells on the expression of key cancer related gene
families.a |
Table V
Effects of long-term ethanol exposure
of MCF-12A cells on the expression of key cancer related gene
families.a
| | SA Clone | Monolayer |
|---|
| |
|
|
|---|
| Gene ID | Gene
description | SASC/cont | Eth/cont | Act/cont |
|---|
| BRCA family |
| BRCC3 |
BRCA1/BRCA2-containing complex, subunit
3 | 4.5 | 0.85 | 1.0 |
| BRCA2 | Breast cancer 2,
early onset | 2.6 | 0.80 | 0.88 |
| PALB2 | Partner and
localizer of BRCA2 | 2.6 | 0.9 | 0.9 |
| BRCA1 | Breast cancer 1,
early onset | 2.3 | 1.0 | 1.0 |
| BAP1 | BRCA1 associated
protein-1 | 2.2 | 1.1 | 0.96 |
| Neuroblastoma
breakpoint family |
| NBPF10b | Neuroblastoma
breakpoint family, member 10 | 2.6 | 1.0 | 1.0 |
| NBPF15 | Neuroblastoma
breakpoint family, member 15 | 2.7 | 1.0 | 1.0 |
| NBPF16b | Neuroblastoma
breakpoint family, member 16 | 2.6 | 1.0 | 1.0 |
| NBPF11b | Neuroblastoma
breakpoint family, member 11 | 2.6 | 1.0 | 1.0 |
| NBPF1 | Neuroblastoma
breakpoint family, member 1 | 2.6 | 1.0 | 1.0 |
| NBPF9 | Neuroblastoma
breakpoint family, member 1 | 2.5 | 1.0 | 1.1 |
| NBPF14 | Neuroblastoma
breakpoint family, member 14 | 2.4 | 1.0 | 1.1 |
| NBPF3b | Neuroblastoma
breakpoint family, member 3 | 2.2 | 1.0 | 1.0 |
| Others |
| MCAM | Melanoma cell
adhesion molecule | 5.7 | 2.1 | 1.5 |
| ERBB2 | v-erb-b2 eryth leuk
vir onc homol | 2.6 | 1.0 | 1.0 |
| TPD52L2 | Tumor protein
D52-like | 1.8 | 1.0 | 1.0 |
| EHF | Ets homologous
factor | 0.1 | 0.2 | 1.0 |
| MYC family |
| RLF | Rearranged L-myc
fusion | 3.3 | 1.1 | 1.0 |
| MYCBP2 | MYC binding protein
2 | 3.2 | 1.1 | 1.1 |
| MINAb | Myc induced nuclear
antigen | 2.4 | 1.0 | 1.0 |
| MAX | Myc associated
factor X | 2.0 | 1.0 | 1.0 |
| RBBP7 | Retinoblastoma
binding protein 7 | 2.1 | 1.1 | 1.0 |
| Small nucleolar RNA
family |
| SNORD78 | Small nucleolar
RNA, C/D box 78 | 2.5 | 0.9 | 1.0 |
| SNORD22 | Small nucleolar
RNA, C/D box 22 | 2.4 | 1.0 | 1.0 |
| SNORD4B | Small nucleolar
RNA, C/D box 4B | 2.0 | 0.9 | 0.9 |
| SNORD82 | Small nucleolar
RNA, C/D box 82 | 0.32 | 1.0 | 1.0 |
| SNORD5 | Small nucleolar
RNA, C/D box 5 | 0.31 | 1.2 | 1.5 |
| SNORD6 | Small nucleolar
RNA, C/D box 6 | 0.31 | 0.9 | 0.9 |
| SNORD14E | Small nucleolar
RNA, C/D box 14E | 0.12 | 1.0 | 1.0 |
Considering the observed changes in mRNA levels, it
is logical to investigate what changes occur in their potential
regulators, the microRNAs (miRs). Surprisingly, ethanol in
monolayer cultures of MCF-12A did not cause substantial changes in
the global miR expression. Acetaldehyde was somewhat more active
but changes were still marginal. However, as in the DNA microarray
data, the SASC clone derived from ethanol exposure showed 15 miRs
upregulated by 2- to 3-fold, and 28 downregulated between 2- and
100-fold.
In particular, the miR-200 family, which
modulates EMT and MET, is considerably altered in MCF-12A exposed
to ethanol
Of particular interest are the members of the
miR-200 family which were highly downregulated in the SASC clone.
This family regulates EMT through its effects on EMT-provoking
peptides including Zeb1, Zeb2, and Twist1, and is allegedly
involved in cancer progression, including the EMT phase, which
involves downregulated miR-200s, and later the mesenchymal to
epithelial transition (MET) which involves return of miR-200
expression (49). In this study,
the miR-200 family members miR-200b, miR-200c, and miR-141 were
down-regulated by 25–100-fold in the SASC clone (Table VI). These results are consistent
with the gene expression analysis for the EMT inducing peptides
Zeb1, Zeb2 and Twist1, which were all upregulated in the SASC clone
(see Table IV).
| Table VIEffects of long-term ethanol exposure
of MCF-12A cells on the miRNA global profile.a |
Table VI
Effects of long-term ethanol exposure
of MCF-12A cells on the miRNA global profile.a
| SA Clone | Monolayer | | SA Clone | Monolayer |
|---|
|
|
| |
|
|
|---|
| miR | SASC/cont | Eth/cont | Act/cont | miR | SASC/cont | Eth/cont | Act/cont |
|---|
| 99a-5p | 2.89 | 1.37 | 2.15 | 24-3p | 0.34 | 0.98 | 1.44 |
| 125a-5p | 2.66 | 0.94 | 0.92 | 103a-3p | 0.34 | 1 | 1.75 |
| 320d | 2.64 | 1.18 | 0.62 | 27a-3p | 0.32 | 0.88 | 1.37 |
| 320e | 2.6 | 1.15 | 0.6 | 106b-5p | 0.28 | 0.97 | 1.56 |
| 320c | 2.55 | 1.13 | 0.66 | 19a-3p | 0.23 | 1.11 | 1.77 |
| 99b-5p | 2.53 | 0.82 | 1.04 | 29b-3p | 0.22 | 1.16 | 1.44 |
| 320a | 2.51 | 1.27 | 0.65 | 20b-5p | 0.22 | 0.85 | 1.47 |
| 125b-5p | 2.46 | 1.17 | 1.75 | 106a-5p | 0.22 | 0.84 | 1.29 |
| 320b | 2.45 | 1.15 | 0.68 | 20a-5p | 0.21 | 0.9 | 1.34 |
| let-7b-5p | 2.44 | 1.12 | 0.43 | 17-5p | 0.21 | 0.86 | 1.33 |
| 100-5p | 2.37 | 1.22 | 1.56 | 494 | 0.17 | 0.53 | 0.84 |
| 181b-5p | 2.35 | 0.99 | 1.04 | 101-3p | 0.17 | 1.01 | 2.14 |
| let-7e-5p | 2.28 | 1.13 | 0.37 | 183-5p | 0.16 | 0.96 | 0.51 |
| let-7c | 1.96 | 1.09 | 0.35 | 182-5p | 0.16 | 0.94 | 1.37 |
| let-7d-5p | 1.92 | 1.09 | 0.4 | 19b-3p | 0.15 | 1.24 | 1.42 |
| 22-3p | 0.69 | 0.96 | 1.84 | 200c-3p | 0.04 | 0.94 | 0.85 |
| 31-5p | 0.63 | 1.21 | 2.17 | 200b-3p | 0.03 | 0.9 | 0.85 |
| 29c-3p | 0.54 | 0.87 | 1.47 | 141-3p | 0.01 | 0.92 | 1.92 |
| 23a-3p | 0.53 | 0.93 | 1.24 | 96-5p | 0.01 | 0.72 | 1.8 |
| 15a-5p | 0.5 | 0.91 | 1.18 | 203a | 0.01 | 0.65 | 1.88 |
| 93-5p | 0.44 | 1.01 | 1.43 | 205-5p | 0.01 | 0.89 | 1.13 |
| 425-5p | 0.4 | 0.84 | 1.58 | | | | |
| 16-5p | 0.37 | 0.84 | 1.08 | | | | |
| 107 | 0.34 | 1.02 | 1.7 | | | | |
Importantly, in addition to the miRs involved in
EMT, there are several miRs that are known to function as tumor
suppressors in some systems, and which were strongly downregulated
in the SASC clone. These include miR-205 (which can function either
as a tumor suppressor or in an oncogenic role) (50,51),
miR-203a (52) which is reported
to be upregulated in primary tumors but downregulated in metastatic
growth, and involved in SNAI2 induction of EMT (53), miR-101 (54,55),
and others (Table VI). By
contrast, some miRs thought to be oncogenic such as miR-19a,
miR-19b (56) and miR-103
(57) were down-regulated in the
SASC clone. The microRNAs miR-22 and mir-31 have been reported to
be involved in cancer suppression (58,59)
and miR-31 may function both in suppression and oncogenesis
(60). In the current study,
mir-22 showed modest downregulation in the SASC sample, essentially
no change after ethanol treatment in monolayers, and a modest
upregulation after acetaldehyde treatment of monolayers. The mir-31
results were similar to the mir-21 results.
Clinical laboratory testing
There are several clinical laboratory tests
available for gene expression in tissue samples taken from breast
cancers (see Discussion). Some of the genes whose transcription is
altered in MCF-12A by ethanol exposure are accepted markers for
breast cancer in the clinical setting. Table VII shows the results for our SASC
clone for the gene set from one of those tests. Ki67 and STK15 show
considerable upregulation, consistent with the oncogenic phenotype
displayed by these cells.
| Table VIIGenes used in clinical laboratory
analysis of breast cancer and analyzed for gene expression in the
soft agar selected cell (SASC) clones.a |
Table VII
Genes used in clinical laboratory
analysis of breast cancer and analyzed for gene expression in the
soft agar selected cell (SASC) clones.a
| Gene | Cont | SASC/cont | Gene ID | Description |
|---|
| Ki67 | 58.8 | 6.73 | MKi67 | Nuc protein |
| STK15 | 194.2 | 2.23 | AURKA | Aurora kinase
A |
| Survivin | 226 | 0.99 | BIRC5 | Inhibits
apoptosis |
| CCNB1 | 174.1 | 2.05 | CCNB1 | Cyclin B1 |
| MYBL2 | 127.1 | 1.69 | MYBL2 | V-myb oncogene
homology |
| MMP11 | 135.2 | 1.12 | MMP11 | Matrix metallopr 11
aka stromelysin 3 |
| CTSL2 | 74.4 | 0.49 | CTSL2 | Cathepsin L2 |
| GRB7 | 951.4 | 0.07 | GRB7 | Growth factor rec
bound protein 7 |
| HER2 | 336.5 | 0.9 | ERBB2 | HER2 |
| GSTM1 | 86.3 | 1.33 | GSTM1 | Glutathione
S-transferase mu 1 |
| CD68 | 1045 | 0.94 | CD68 | CD68 molecule |
| BAG1 | 204.1 | 0.77 | BAG1 | BCL2 associated
athanogene |
| ERb | 45.1 | 0.83 | ESR1 | Estrogen rec 1 |
| PGR | 23.3 | 0.61 | PGR | Progesterone
rec |
| BCL2 | 113.7 | 1.07 | BCL2 | B-cell CLL/lymphoma
2/blocks apoptosis |
| SCUBE2 | 49.1 | 1.09 | SCUBE2 | Signal peptide, cub
domain, EGF-like 2 |
Discussion
To our knowledge this is the first report on normal
human epithelial breast cells in monolayer culture involving
continuous exposure for 1 week to a moderate concentration of
ethanol (25 mM) which: i) causes changes in the global
transcriptional signature, showing induction of the metallothionein
gene family and changes in alcohol metabolism genes, and in other
genes suggesting the initiation of EMT, but without evident related
phenotypic changes; ii) these transcriptional changes do not seem
to be mediated by the main ethanol metabolite, acetaldehyde, since
concentrations (2.5 mM) considerably higher than the ones that
would result in vivo from this alcohol exposure, are
virtually inactive; iii) the alteration in the expression of the
metallothionein genes resembles that which was previously reported
by us in preliminary experiments for similar incubations of the
breast cancer epithelial cell line MCF7 (24) but no upregulation of stem cell
genes like Oct4 was observed in the MCF-12A cells; iv) these
changes suggest that early initiation by exposure to 25 mM ethanol
provokes an EMT process in normal breast epithelial cells.
Even more significantly, this is also the first
report that longer continuous exposure (4 weeks) of these normal
breast epithelial cells to ethanol or acetaldehyde induces a late
transformation consistent not only with EMT but also with
oncogenesis, since: v) ethanol at 25 mM or acetaldehyde at 2.5 mM
arrests cell growth and eventually causes cell death, in contrast
to MCF7 (24); but vi) much lower
concentrations of ethanol (2.5 or 1.0 mM) or acetaldehyde (1.0 mM)
not only induce EMT but also result in oncogenic phenotypic changes
that lead to the selection by 2.5 mM ethanol of anchorage
independent cells able to grow in soft agar.
These growth and morphological changes induced by
long-term exposure are paralleled by profound alterations in the
global transcriptional signatures, particularly in the soft
agar-selected cells, such as: vii) the silencing of metallothionein
changes observed in the early exposure, and the amplification of
the previous alcohol metabolism changes; viii) mRNA level
alterations consistent not only with the induction of EMT but with
the oncogenic phenotype, as well as changes in the levels of key
related miRs; ix) these changes are particularly amplified in the
ethanol-induced soft agar selected cells, suggesting that it is a
subset of cells with the same changes as shown in soft agar
selected cells that is responsible for the EMT and oncogenic
transformation seen in the parent monolayer cultures; x) with the
exception of the stimulation of cell growth in soft agar, the
alterations induced by long-term incubation with 2.5 mM ethanol on
MCF-12A cells are considerably more significant and rather
different from the ones induced by 25 mM ethanol in MCF7 cells
(24), specifically on the
transcriptional signatures; xi) the long-term effects suggest that
low concentrations of ethanol, with little or no mediation by
acetaldehyde, induce the EMT and oncogenic transformation of normal
breast epithelial cells, specifically MCF-12A cells, in contrast to
the much higher concentrations of ethanol required to stimulate the
growth and oncogenesis of MCF7 breast cancer epithelial cells
(24), and act possibly by
different mechanisms.
These in vitro results establish a proof of
concept for potential EMT and carcinogenic effects of alcohol but,
as such, are difficult to translate directly to actual human
exposure to ethanol from drinking alcoholic beverages. The 2.5 mM
ethanol (approximately 0.01%) is roughly equivalent to the peak
level in blood after about 1/6 drink in a 50–60 kg woman, with one
full drink being 0.06% (24).
However, in the in vitro studies reported here, this
concentration was maintained at a nearly constant level during a 28
day exposure, versus probably only around 30 min to 1 h in women
who have consumed alcoholic beverages. It is impossible to
extrapolate to the in vivo human situation, but
speculatively we consider that the constant in vitro
exposure of MCF-12A to the low 0.01% ethanol concentration may be
even lower than that which occurs in an alcoholic woman drinking
3–4 drinks a day during the same 4 week period. However, this
equivalence needs to be ascertained in laboratory animals to
achieve a meaningful translation from cell culture to human blood
and breast tissue. However, the current study suggests for the
first time a new molecular paradigm for the potential oncogenic
effects of excessive alcohol consumption. This is in agreement with
what epidemiological studies of breast cancer incidence in
alcoholic women suggest about ethanol and breast cancer risks
(50). In addition, our study
opens up multiple potential mechanisms by which alcohol targets
certain gene families and their miR regulators.
It is interesting that, as in the case of MCF7
(24), ethanol induced an early
upregulation of metallothioneins in the MCF-12A cells that was not
present at 4 weeks (although for MCF-12A cells, long-term
incubation was carried out with 2.5 mM ethanol rather than 25 mM
ethanol, as in the previous study). It is likely that this
increased expression of metallothioneins is due to the known fact
that they are induced by ethanol (61). However, there may be a possibility
that metallothioneins also play an early role in the oncogenic
transformation of MCF-12A by ethanol, since MT-I and MT-II are
antiapoptotic, proliferative, angiogenic, and oncogenic (62), and are increased in breast cancer
and other tumors, correlating with higher tumor grade/stage,
increased recurrence and poor survival in the highly malignant
invasive ductal breast carcinomas, and predictive of poor prognosis
in estrogen receptor-negative patients.
The early upregulation of aldehyde oxidase 1 (AOX1)
and the decrease of aldehyde dehydrogenase 3B2 (ALDH3B2),
maintained after 4 weeks, also observed in MCF7 (24), may be related to alcohol
metabolism. AOX1 is a xenobiotic metabolizing protein that is found
in the liver and produces reactive oxygen species (ROS), but
paradoxically is reduced by heavy chronic alcohol consumption
(63), and has not been related to
breast cancer. Very little is known regarding the specific ALDH
isoform ALDH3B2 other than being associated with alcohol dependence
(64), but no relationship with
cancer has been reported, in contrast to other isoforms.
The induction by ethanol of EMT associated changes
in gene expression after long-term exposure to 2.5 mM ethanol,
particularly in the soft agar-selected cells (SASC), is remarkable,
since very little is available in the literature on the
experimental effects of ethanol on EMT (or of alcoholic beverages
in literature searches under the more general term alcohol). Our
results showing increased levels of the transcription factors and
key EMT inducers, Twist1, Snail1, Zeb1 and Zeb2, but not of Snail2
(Slug) are in agreement with the higher expression of Snail in
immortalized human pancreatic ductal epithelial cells, with lower
induction of Slug (44). Another
study showed that alcohol upregulated the signature EMT phenotypic
marker vimentin via Snail, as well as matrix metalloproteases
MMP-2, MMP-7, and MMP-9 in colon and breast cancer cells (55). Snail siRNA knockdown prevented
alcohol-stimulated vimentin expression, and in vivo Snail
expression was significantly elevated in colonic mucosal biopsies
from alcoholics (45).
The ethanol-induced SASC cultures showed strikingly
different expression of some other EMT inducers, such as TGFβ2
(upregulated 34-fold) and TGFβ1 (downregulated 3-fold), when in
general they act synergistically in inducing EMT (65,66),
although in some cases, one or the other predominates (67). Similar situations occurred with
IL7R vs IL1R, and THBS1 vs THBD, although the pattern of the joint
involvement of the overall IL, IGF, and TGFβ families is in
agreement with their cooperative role as EMT inducers (68). The considerable upregulation by
ethanol of CTGF is also in agreement with its well known role in
EMT (69), but the concerted
upregulation of IGFBPs 2, 3 and 4 is more intriguing, considering
the paucity of studies and some conflicting evidence for their pro-
versus anti-EMT effects (70–72).
The upregulation of IGFR2 is in agreement with the higher levels
observed in breast cancer tissue (73).
The pattern of EMT occurring in the ethanol-induced
SASC is typical, since it shows the expected downregulation of
keratins, known markers of epithelial cells, with 6 members
affected, whereas 3 integrins and 2 laminins, mesenchymal markers,
were upregulated. Specifically, the upregulation of laminin α4 is
present in EMT, involving a switch from laminin-5 to laminin-4
expression, which may be directly controlled by Snai (74).
As in the case of members of the TGFß family, some
integrins such as integrin β4 go in the opposite direction of some
of the other integrins, such as β8 or A3, but in addition, these
effects may be associated with potential metastatic ability, since
the combination of low ITGβ4, exclusively expressed in polarized
epithelial cells, with high miR-21 and low PDCD4 expression is able
to predict the presence of metastasis (75). This agrees with the downregulation
of claudin 1, since the loss of apical cell adhesions (tight
junctions) has been associated with malignant transformation, a
process most often accompanied by a concomitant loss of claudin
expression (76).
The EMT gene expression changes induced in MCF-12A
by 4 week of incubation with 2.5 mM ethanol, and particularly
manifested in the resulting SASC, are concordant with the
acquisition of anchorage-independence, evidenced by their selection
in soft agar, although they can also continue growing in monolayer
after acquiring the mesenchymal phenotype, similarly to what was
previously observed with keratinocytes undergoing EMT (77). This would suggest, as occurs with
many cells undergoing EMT, that this would be associated with
invasiveness, i.e., a potential tumor progression/metastatic
phenotype, but no in vitro assays of invasion or in
vivo tests of tumorigenesis and metastasis have been performed
to test this point. In fact, the upregulation, rather than
downregulation, of the BRCA1/2 family is difficult to reconcile
with oncogenic progression because of their nature as tumor
suppressors, unless they represent a cell defense response
(78,79). Since no investigation of BRCA
mutations was performed, this issue remains unresolved. Similarly,
the relationship of some of the MYC, NBPF, or SNORD members with
cancer, and specifically breast cancer, is not well defined.
Among the changes to RNA abundance resulting from
exposure to ethanol, some of the most dramatic involve members of
the miR-200 family, which, among other things, are involved in
controlling the induction of EMT and its opposite, the mesenchymal
epithelial transition (MET), both of which are critical elements in
the metastatic process. As such, these miRs are involved in more
than one phase of oncogenesis. The EMT phase represents a danger of
progression following tumor formation, but prior to the
colonization by tumor cells at potential sites of metastasis.
The most upregulated and downregulated miRs are
presented in Table VI. They
represent not only miRs which are involved in EMT, but also miRs
which appear to be oncogenic in other ways, as well as miRs which
would appear to be, at least potentially, capable of tumor
suppression. Taken as a whole, the results suggest that the
influence of long-term, low concentration ethanol on normal
epithelial breast cell miRs is of a variable nature. The immediate
mechanism(s) by which ethanol and acetaldehyde influence miR
abundance is unclear at present, but is worthy of further
study.
Another interesting aspect is the implication of our
results for clinical assays of breast cancer gene expression in the
pathology lab based on different gene sets. For example, the 21
gene recurrence score has been evaluated in terms of prognosis with
respect to chemotherapy (80,81).
In addition to reference gene expression values, the assay set
includes proliferation genes Ki67, STK15, Survivin, CCNB1 (cyclin
B1), MYBL2, invasive genes MMP11 (Stromolysin 3), CTSL2 (cathepsin
L2), Her 2 genes GRB7 and HER2, as well as GSTM1, CD68, BAG1, and
estrogen related genes ER, PGR, BCL2, and SCUBE2. In the SASC
clone, Ki67 was upregulated in comparison with control MCF-12A
cells by a factor of 6.73. STK15 (aka aurora kinase A) was
upregulated by 2.23 fold, cyclin B1 by 2.05, and MYBL2 by 1.69. By
comparison, reference genes showed SASC/control ratios closer to 1,
with the maximal being beta actin, with a ratio of 1.55, GAPDH at
1.21, the ribosomal protein gene RPLPO at 0.99, and the transferrin
receptor gene at 1.33.
These results suggest that a subset of the 16
oncogenes and tumor suppressors that are represented in this
clinical assay are upregulated by ethanol treatment as selected by
soft agar growth. In contrast, two genes, cathepsin L2 and the
growth factor receptor bound protein 7 were substantially
downregulated. The majority of the 16 genes were essentially
unchanged between the control and SASC clone cultures.
In conclusion, our study suggests that a prolonged
exposure of epithelial breast cells to alcohol in vivo may
induce EMT and oncogenic changes, but the clinical translation of
our findings still requires confirmation in animal models of breast
cancer.
Acknowledgements
Financial support by a pilot grant to NGC from the
NIH/NCI U54 CA14393-01 program grant to J.V., from U54 MD007598 to
J.V. and N.G.-C., as well as from grant NIH/NIEHS 1U01ES020887-01
to N.G.-C. covering some DNA microarray and miR work, as well as
support from CRECD R25 MD007610 to R.G. are gratefully
acknowledged. We thank Dr David Heber for invaluable advice.
Abbreviations:
|
miR
|
microRNA
|
|
SASC
|
soft agar selected clone
|
References
|
1
|
Seitz HK, Pelucchi C, Bagnardi V and La
Vecchia C: Epidemiology and pathophysiology of alcohol and breast
cancer: Update 2012. Alcohol Alcohol. 47:204–212. 2012. View Article : Google Scholar : PubMed/NCBI
|
|
2
|
Coronado GD, Beasley J and Livaudais J:
Alcohol consumption and the risk of breast cancer. Salud Publica
Mex. 53:440–447. 2011.
|
|
3
|
Pelucchi C, Tramacere I, Boffetta P, Negri
E and La Vecchia C: Alcohol consumption and cancer risk. Nutr
Cancer. 63:983–990. 2011. View Article : Google Scholar : PubMed/NCBI
|
|
4
|
Chen WY, Rosner B, Hankinson SE, Colditz
GA and Willett WC: Moderate alcohol consumption during adult life,
drinking patterns, and breast cancer risk. JAMA. 306:1884–1890.
2011. View Article : Google Scholar : PubMed/NCBI
|
|
5
|
Narod SA: Alcohol and risk of breast
cancer. JAMA. 306:1920–1921. 2011. View Article : Google Scholar : PubMed/NCBI
|
|
6
|
Saxena T, Lee E, Henderson KD, Clarke CA,
West D, Marshall SF, Deapen D, Bernstein L and Ursin G: Menopausal
hormone therapy and subsequent risk of specific invasive breast
cancer subtypes in the California Teachers Study. Cancer Epidemiol
Biomarkers Prev. 19:2366–2378. 2010. View Article : Google Scholar : PubMed/NCBI
|
|
7
|
Kabat GC, Kim M, Shikany JM, Rodgers AK,
Wactawski-Wende J, Lane D, Powell L, Stefanick ML, Freiberg MS,
Kazlauskaite R, et al: Alcohol consumption and risk of ductal
carcinoma in situ of the breast in a cohort of postmenopausal
women. Cancer Epidemiol Biomarkers Prev. 19:2066–2072. 2010.
View Article : Google Scholar : PubMed/NCBI
|
|
8
|
Wong AW, Dunlap SM, Holcomb VB and Nunez
NP: Alcohol promotes mammary tumor development via the estrogen
pathway in estrogen receptor alpha-negative HER2/neu mice. Alcohol
Clin Exp Res. 36:577–587. 2012. View Article : Google Scholar
|
|
9
|
Wang S, Xu M, Li F, Wang X, Bower KA,
Frank JA, Lu Y, Chen G, Zhang Z, Ke Z, et al: Ethanol promotes
mammary tumor growth and angiogenesis: The involvement of
chemoattractant factor MCP-1. Breast Cancer Res Treat.
133:1037–1048. 2012. View Article : Google Scholar :
|
|
10
|
Masso-Welch PA, Tobias ME, Vasantha Kumar
SC, Bodziak M, Mashtare T Jr, Tamburlin J and Koury ST: Folate
exacerbates the effects of ethanol on peripubertal mouse mammary
gland development. Alcohol. 46:285–292. 2012. View Article : Google Scholar : PubMed/NCBI
|
|
11
|
Hong J, Holcomb VB, Tekle SA, Fan B and
Núñez NP: Alcohol consumption promotes mammary tumor growth and
insulin sensitivity. Cancer Lett. 294:229–235. 2010. View Article : Google Scholar : PubMed/NCBI
|
|
12
|
Castro GD, de Castro CR, Maciel ME,
Fanelli SL, de Ferreyra EC, Gómez MI and Castro JA: Ethanol-induced
oxidative stress and acetaldehyde formation in rat mammary tissue:
Potential factors involved in alcohol drinking promotion of breast
cancer. Toxicology. 219:208–219. 2006. View Article : Google Scholar
|
|
13
|
Watabiki T, Okii Y, Tokiyasu T, Yoshimura
S, Yoshida M, Akane A, Shikata N and Tsubura A: Long-term ethanol
consumption in ICR mice causes mammary tumor in females and liver
fibrosis in males. Alcohol Clin Exp Res. 24(Suppl): S117–S122.
2000.
|
|
14
|
Singletary KW, Frey RS and Yan W: Effect
of ethanol on proliferation and estrogen receptor-alpha expression
in human breast cancer cells. Cancer Lett. 165:131–137. 2001.
View Article : Google Scholar : PubMed/NCBI
|
|
15
|
Etique N, Chardard D, Chesnel A, Merlin
JL, Flament S and Grillier-Vuissoz I: Ethanol stimulates
proliferation, ERalpha and aromatase expression in MCF-7 human
breast cancer cells. Int J Mol Med. 13:149–155. 2004.
|
|
16
|
Etique N, Flament S, Lecomte J and
Grillier-Vuissoz I: Ethanol-induced ligand-independent activation
of ERalpha mediated by cyclic AMP/PKA signaling pathway: An in
vitro study on MCF-7 breast cancer cells. Int J Oncol.
31:1509–1518. 2007.PubMed/NCBI
|
|
17
|
Etique N, Grillier-Vuissoz I, Lecomte J
and Flament S: Crosstalk between adenosine receptor (A2A isoform)
and ERalpha mediates ethanol action in MCF-7 breast cancer cells.
Oncol Rep. 21:977–981. 2009.PubMed/NCBI
|
|
18
|
Przylipiak A, Rabe T, Hafner J, Przylipiak
M and Runnebaum R: Influence of ethanol on in vitro growth of human
mammary carcinoma cell line MCF-7. Arch Gynecol Obstet.
258:137–140. 1996. View Article : Google Scholar : PubMed/NCBI
|
|
19
|
Meng Q, Gao B, Goldberg ID, Rosen EM and
Fan S: Stimulation of cell invasion and migration by alcohol in
breast cancer cells. Biochem Biophys Res Commun. 273:448–453. 2000.
View Article : Google Scholar : PubMed/NCBI
|
|
20
|
Luo J and Miller MW: Ethanol enhances
erbB-mediated migration of human breast cancer cells in culture.
Breast Cancer Res Treat. 63:61–69. 2000. View Article : Google Scholar : PubMed/NCBI
|
|
21
|
Izevbigie EB, Ekunwe SI, Jordan J and
Howard CB: Ethanol modulates the growth of human breast cancer
cells in vitro. Exp Biol Med (Maywood). 227:260–265. 2002.
|
|
22
|
Etique N, Chardard D, Chesnel A, Flament S
and Grillier-Vuissoz I: Analysis of the effects of different
alcohols on MCF-7 human breast cancer cells. Ann N Y Acad Sci.
1030:78–85. 2004. View Article : Google Scholar
|
|
23
|
Etique N, Grillier-Vuissoz I and Flament
S: Ethanol stimulates the secretion of matrix metalloproteinases 2
and 9 in MCF-7 human breast cancer cells. Oncol Rep. 15:603–608.
2006.PubMed/NCBI
|
|
24
|
Vernet D, Gelfand R, Sarkissyan S, Heber
D, Vadgama J and Gonzalez-Cadavid NF: Long-term exposure of breast
cell lines to ethanol affects the transcriptional signature for
some oncogenic gene families, but has little effect on this
phenotype in mammospheres or on the expression of stem cell
markers. Cancer Res. 71(Suppl 8): 55592011. View Article : Google Scholar
|
|
25
|
Zhang Q, Jin J, Zhong Q, Yu X, Levy D and
Zhong S: ERα mediates alcohol-induced deregulation of Pol III genes
in breast cancer cells. Carcinogenesis. 34:28–37. 2013. View Article : Google Scholar :
|
|
26
|
Dai J, Jian J, Bosland M, Frenkel K,
Bernhardt G and Huang X: Roles of hormone replacement therapy and
iron in proliferation of breast epithelial cells with different
estrogen and progesterone receptor status. Breast. 17:172–179.
2008. View Article : Google Scholar
|
|
27
|
Feifei N, Mingzhi Z, Yanyun Z, Huanle Z,
Fang R, Mingzhu H, Mingzhi C, Yafei S and Fengchun Z: MicroRNA
expression analysis of mammospheres cultured from human breast
cancers. J Cancer Res Clin Oncol. 138:1937–1944. 2012. View Article : Google Scholar : PubMed/NCBI
|
|
28
|
Cortez MA, Welsh JW and Calin GA:
Circulating microRNAs as noninvasive biomarkers in breast cancer.
Recent Results Cancer Res. 195:151–161. 2012. View Article : Google Scholar : PubMed/NCBI
|
|
29
|
Krell J, Frampton AE, Jacob J, Castellano
L and Stebbing J: miRNA sin breast cancer: Ready for real time?
Pharmacogenomics. 13:709–719. 2012. View Article : Google Scholar : PubMed/NCBI
|
|
30
|
Shore AN, Herschkowitz JI and Rosen JM:
Noncoding RNAs involved in mammary gland development and
tumorigenesis: There's a long way to go. J Mammary Gland Biol
Neoplasia. 17:43–58. 2012. View Article : Google Scholar : PubMed/NCBI
|
|
31
|
Valastyan S: Roles of microRNAs and other
non-coding RNAs in breast cancer metastasis. J Mammary Gland Biol
Neoplasia. 17:23–32. 2012. View Article : Google Scholar : PubMed/NCBI
|
|
32
|
Fernandez SV: Estrogen, alcohol
consumption, and breast cancer. Alcohol Clin Exp Res. 35:389–391.
2011. View Article : Google Scholar : PubMed/NCBI
|
|
33
|
Fernandez-Cobo M, Holland JF and Pogo BG:
Transcription profiles of non-immortalized breast cancer cell
lines. BMC Cancer. 6:992006. View Article : Google Scholar : PubMed/NCBI
|
|
34
|
Seitz HK and Stickel F: Molecular
mechanisms of alcohol-mediated carcinogenesis. Nat Rev Cancer.
7:599–612. 2007. View Article : Google Scholar : PubMed/NCBI
|
|
35
|
Hirano T: Alcohol consumption and
oxidative DNA damage. Int J Environ Res Public Health. 8:2895–2906.
2011. View Article : Google Scholar : PubMed/NCBI
|
|
36
|
Balbo S, Meng L, Bliss RL, Jensen JA,
Hatsukami DK and Hecht SS: Time course of DNA adduct formation in
peripheral blood granulocytes and lymphocytes after drinking
alcohol. Mutagenesis. 27:485–490. 2012. View Article : Google Scholar : PubMed/NCBI
|
|
37
|
Seitz HK and Stickel F: Acetaldehyde as an
underestimated risk factor for cancer development: Role of genetics
in ethanol metabolism. Genes Nutr. 5:121–128. 2010. View Article : Google Scholar :
|
|
38
|
Jelski W, Chrostek L, Szmitkowski M and
Markiewicz W: The activity of class I, II, III and IV alcohol
dehydrogenase isoenzymes and aldehyde dehydrogenase in breast
cancer. Clin Exp Med. 6:89–93. 2006. View Article : Google Scholar : PubMed/NCBI
|
|
39
|
Guttilla IK, Adams BD and White BA: ERα,
microRNAs, and the epithelial-mesenchymal transition in breast
cancer. Trends Endocrinol Metab. 23:73–82. 2012. View Article : Google Scholar : PubMed/NCBI
|
|
40
|
Jain P and Alahari SK: Breast cancer stem
cells: A new challenge for breast cancer treatment. Front Biosci
(Landmark Ed). 16:1824–1832. 2011. View
Article : Google Scholar
|
|
41
|
Di Cello F, Flowers VL, Li H,
Vecchio-Pagán B, Gordon B, Harbom K, Shin J, Beaty R, Wang W,
Brayton C, et al: Cigarette smoke induces epithelial to mesenchymal
transition and increases the metastatic ability of breast cancer
cells. Mol Cancer. 12:902013. View Article : Google Scholar : PubMed/NCBI
|
|
42
|
Schedin PJ, Eckel-Mahan KL, McDaniel SM,
Prescott JD, Brodsky KS, Tentler JJ and Gutierrez-Hartmann A: ESX
induces transformation and functional epithelial to mesenchymal
transition in MCF-12A mammary epithelial cells. Oncogene.
23:1766–1779. 2004. View Article : Google Scholar : PubMed/NCBI
|
|
43
|
Chan IS, Guy CD, Machado MV, Wank A,
Kadiyala V, Michelotti G, Choi S, Swiderska-Syn M, Karaca G,
Pereira TA, et al: Alcohol activates the hedgehog pathway and
induces related procarcinogenic processes in the alcohol-preferring
rat model of hepatocarcinogenesis. Alcohol Clin Exp Res.
38:787–800. 2014. View Article : Google Scholar :
|
|
44
|
Ward ST, Dangi-Garimella S, Shields MA,
Collander BA, Siddiqui MA, Krantz SB and Munshi HG: Ethanol
differentially regulates snail family of transcription factors and
invasion of premalignant and malignant pancreatic ductal cells. J
Cell Biochem. 112:2966–2973. 2011. View Article : Google Scholar : PubMed/NCBI
|
|
45
|
Forsyth CB, Tang Y, Shaikh M, Zhang L and
Keshavarzian A: Alcohol stimulates activation of Snail, epidermal
growth factor receptor signaling, and biomarkers of
epithelial-mesenchymal transition in colon and breast cancer cells.
Alcohol Clin Exp Res. 34:19–31. 2010. View Article : Google Scholar
|
|
46
|
Reed TE, Kalant H, Gibbins RJ, Kapur BM
and Rankin JG: Alcohol and acetaldehyde metabolism in Caucasians,
Chinese and Amerinds. Can Med Assoc J. 115:851–855. 1976.PubMed/NCBI
|
|
47
|
Shimada J, Miyahara T, Otsubo S,
Yoshimatsu N, Oguma T and Matsubara T: Effects of
alcohol-metabolizing enzyme inhibitors and beta-lactam antibiotics
on ethanol elimination in rats. Jpn J Pharmacol. 45:533–544. 1987.
View Article : Google Scholar : PubMed/NCBI
|
|
48
|
Al-Hajj M, Wicha MS, Benito-Hernandez A,
Morrison SJ and Clarke MF: Prospective identification of
tumorigenic breast cancer cells. Proc Natl Acad Sci USA.
100:3983–3988. 2003. View Article : Google Scholar : PubMed/NCBI
|
|
49
|
Hilmarsdottir B, Briem E, Bergthorsson JT,
Magnusson MK and Gudjonsson T: Functional role of the microRNA-200
family in breast morphogenesis and neoplasia. Genes (Basel).
5:804–820. 2014.
|
|
50
|
Wu H and Mo YY: Targeting miR-205 in
breast cancer. Expert Opin Ther Targets. 13:1439–1448. 2009.
View Article : Google Scholar : PubMed/NCBI
|
|
51
|
Orang AV, Safaralizadeh R and Hosseinpour
Feizi MA: Insights into the diverse roles of miR-205 in human
cancers. Asian Pac J Cancer Prev. 15:577–583. 2014. View Article : Google Scholar : PubMed/NCBI
|
|
52
|
Wang C, Zheng X, Shen C and Shi Y:
MicroRNA-203 suppresses cell proliferation and migration by
targeting BIRC5 and LASP1 in human triple-negative breast cancer
cells. J Exp Clin Cancer Res. 31:582012. View Article : Google Scholar : PubMed/NCBI
|
|
53
|
Zhang Z, Zhang B, Li W, Fu L, Fu L, Zhu Z
and Dong JT: Epigenetic silencing of miR-203 upregulates SNAI2 and
contributes to the invasiveness of malignant breast cancer cells.
Genes Cancer. 2:782–791. 2011. View Article : Google Scholar
|
|
54
|
Zhang X, Schulz R, Edmunds S, Krüger E,
Markert E, Gaedcke J, Cormet-Boyaka E, Ghadimi M, Beissbarth T,
Levine AJ, et al: MicroRNA-101 suppresses tumor cell proliferation
by acting as an endogenous proteasome inhibitor via targeting the
proteasome assembly factor POMP. Mol Cell. 59:243–257. 2015.
View Article : Google Scholar : PubMed/NCBI
|
|
55
|
Liu X, Lei Q, Yu Z, Xu G, Tang H, Wang W,
Wang Z, Li G and Wu M: MiR-101 reverses the hypomethylation of the
LMO3 promoter in glioma cells. Oncotarget. 6:7930–7943. 2015.
View Article : Google Scholar : PubMed/NCBI
|
|
56
|
Jia Z, Wang K, Zhang A, Wang G, Kang C,
Han L and Pu P: miR-19a and miR-19b overexpression in gliomas.
Pathol Oncol Res. 19:847–853. 2013. View Article : Google Scholar : PubMed/NCBI
|
|
57
|
Xia W, Ni J, Zhuang J, Qian L, Wang P and
Wang J: MiR-103 regulates hepatocellular carcinoma growth by
targeting AKAP12. Int J Biochem Cell Biol. 71:1–11. 2016.
View Article : Google Scholar
|
|
58
|
Sibbesen NA, Kopp KL, Litvinov IV, Jønson
L, Willerslev-Olsen A, Fredholm S, Petersen DL, Nastasi C,
Krejsgaard T, Lindahl LM, et al: Jak3, STAT3, and STAT5 inhibit
expression of miR-22, a novel tumor suppressor microRNA, in
cutaneous T-Cell lymphoma. Oncotarget. 6:20555–20569. 2015.
View Article : Google Scholar : PubMed/NCBI
|
|
59
|
Valastyan S and Weinberg RA: miR-31: A
crucial overseer of tumor metastasis and other emerging roles. Cell
Cycle. 9:2124–2129. 2010. View Article : Google Scholar : PubMed/NCBI
|
|
60
|
Kim HS, Lee KS, Bae HJ, Eun JW, Shen Q,
Park SJ, Shin WC, Yang HD, Park M, Park WS, et al: MicroRNA-31
functions as a tumor suppressor by regulating cell cycle and
epithelial-mesenchymal transition regulatory proteins in liver
cancer. Oncotarget. 6:8089–8102. 2015. View Article : Google Scholar : PubMed/NCBI
|
|
61
|
Ono S, Ishizaki Y, Tokuda E, Tabata K,
Asami S and Suzuki T: Different patterns in the induction of
metallothionein mRNA synthesis among isoforms after acute ethanol
administration. Biol Trace Elem Res. 115:147–156. 2007. View Article : Google Scholar : PubMed/NCBI
|
|
62
|
Pedersen MO, Larsen A, Stoltenberg M and
Penkowa M: The role of metallothionein in oncogenesis and cancer
prognosis. Prog Histochem Cytochem. 44:29–64. 2009. View Article : Google Scholar : PubMed/NCBI
|
|
63
|
Fu C, Di L, Han X, Soderstrom C, Snyder M,
Troutman MD, Obach RS and Zhang H: Aldehyde oxidase 1 (AOX1) in
human liver cytosols: Quantitative characterization of AOX1
expression level and activity relationship. Drug Metab Dispos.
41:1797–1804. 2013. View Article : Google Scholar : PubMed/NCBI
|
|
64
|
Zhang R, Miao Q, Wang C, Zhao R, Li W,
Haile CN, Hao W and Zhang XY: Genome-wide DNA methylation analysis
in alcohol dependence. Addict Biol. 18:392–403. 2013. View Article : Google Scholar : PubMed/NCBI
|
|
65
|
Do TV, Kubba LA, Du H, Sturgis CD and
Woodruff TK: Transforming growth factor-beta1, transforming growth
factor-beta2, and transforming growth factor-beta3 enhance ovarian
cancer metastatic potential by inducing a Smad3-dependent
epithelial-to-mesenchymal transition. Mol Cancer Res. 6:695–705.
2008. View Article : Google Scholar : PubMed/NCBI
|
|
66
|
Kimura C, Hayashi M, Mizuno Y and Oike M:
Endothelium-dependent epithelial-mesenchymal transition of tumor
cells: Exclusive roles of transforming growth factor β1 and β2.
Biochim Biophys Acta. 1830.4470–4481. 2013.
|
|
67
|
Yu Y, Xiao CH, Tan LD, Wang QS, Li XQ and
Feng YM: Cancer-associated fibroblasts induce
epithelial-mesenchymal transition of breast cancer cells through
paracrine TGF-β signalling. Br J Cancer. 110:724–732. 2014.
View Article : Google Scholar :
|
|
68
|
Maleszewska M, Moonen JR, Huijkman N, van
de Sluis B, Krenning G and Harmsen MC: IL-1β and TGFβ2
synergistically induce endothelial to mesenchymal transition in an
NFκB-dependent manner. Immunobiology. 218:443–454. 2013. View Article : Google Scholar
|
|
69
|
Yang Z, Sun L, Nie H, Liu H, Liu G and
Guan G: Connective tissue growth factor induces tubular epithelial
to mesenchymal transition through the activation of canonical Wnt
signaling in vitro. Ren Fail. 37:129–135. 2015. View Article : Google Scholar
|
|
70
|
Natsuizaka M, Ohashi S, Wong GS, Ahmadi A,
Kalman RA, Budo D, Klein-Szanto AJ, Herlyn M, Diehl JA and Nakagawa
H: Insulin-like growth factor-binding protein-3 promotes
transforming growth factor-{beta}1-mediated
epithelial-to-mesenchymal transition and motility in transformed
human esophageal cells. Carcinogenesis. 31:1344–1353. 2010.
View Article : Google Scholar : PubMed/NCBI
|
|
71
|
Vijayan A, Guha D, Ameer F, Kaziri I,
Mooney CC, Bennett L, Sureshbabu A, Tonner E, Beattie J, Allan GJ,
et al: IGFBP-5 enhances epithelial cell adhesion and protects
epithelial cells from TGFβ1-induced mesenchymal invasion. Int J
Biochem Cell Biol. 45:2774–2785. 2013. View Article : Google Scholar : PubMed/NCBI
|
|
72
|
Mehta HH, Gao Q, Galet C, Paharkova V, Wan
J, Said J, Sohn JJ, Lawson G, Cohen P, Cobb LJ, et al: IGFBP-3 is a
metastasis suppression gene in prostate cancer. Cancer Res.
71:5154–5163. 2011. View Article : Google Scholar : PubMed/NCBI
|
|
73
|
Kalla Singh S, Tan QW, Brito C, De León M
and De León D: Insulin-like growth factors I and II receptors in
the breast cancer survival disparity among African-American women.
Growth Horm IGF Res. 20:245–254. 2010. View Article : Google Scholar : PubMed/NCBI
|
|
74
|
Takkunen M, Ainola M, Vainionpää N,
Grenman R, Patarroyo M, García de Herreros A, Konttinen YT and
Virtanen I: Epithelial-mesenchymal transition downregulates laminin
alpha5 chain and upregulates laminin alpha4 chain in oral squamous
carcinoma cells. Histochem Cell Biol. 130:509–525. 2008. View Article : Google Scholar : PubMed/NCBI
|
|
75
|
Ferraro A, Kontos CK, Boni T, Bantounas I,
Siakouli D, Kosmidou V, Vlassi M, Spyridakis Y, Tsipras I, Zografos
G, et al: Epigenetic regulation of miR-21 in colorectal cancer:
ITGB4 as a novel miR-21 target and a three-gene network
(miR-21-ITGβ4-PDCD4) as predictor of metastatic tumor potential.
Epigenetics. 9:129–141. 2014. View Article : Google Scholar :
|
|
76
|
Stebbing J, Filipović A and Giamas G:
Claudin-1 as a promoter of EMT in hepatocellular carcinoma.
Oncogene. 32:4871–4872. 2013. View Article : Google Scholar : PubMed/NCBI
|
|
77
|
Geiger T, Sabanay H, Kravchenko-Balasha N,
Geiger B and Levitzki A: Anomalous features of EMT during
keratinocyte transformation. PLoS One. 3:e15742008. View Article : Google Scholar : PubMed/NCBI
|
|
78
|
Jiang Q and Greenberg RA: Deciphering the
BRCA1 tumor suppressor network. J Biol Chem. 290:17724–17732. 2015.
View Article : Google Scholar : PubMed/NCBI
|
|
79
|
Lee H: Cycling with BRCA2 from DNA repair
to mitosis. Exp Cell Res. 329:78–84. 2014. View Article : Google Scholar : PubMed/NCBI
|
|
80
|
Albain KS, Barlow WE, Shak S, Hortobagyi
GN, Livingston RB, Yeh IT, Ravdin P, Bugarini R, Baehner FL,
Davidson NE, et al; Breast Cancer Intergroup of North America.
Prognostic and predictive value of the 21-gene recurrence score
assay in postmenopausal women with node-positive,
oestrogen-receptor-positive breast cancer on chemotherapy: A
retrospective analysis of a randomised trial. Lancet Oncol.
11:55–65. 2010. View Article : Google Scholar
|
|
81
|
Paik S, Shak S, Tang G, Kim C, Baker J,
Cronin M, Baehner FL, Walker MG, Watson D, Park T, et al: A
multigene assay to predict recurrence of tamoxifen-treated,
node-negative breast cancer. N Engl J Med. 351:2817–2826. 2004.
View Article : Google Scholar : PubMed/NCBI
|