Introduction
Renal cell carcinoma (RCC) is the most common kidney
cancer type, accounting for ~3% of all adult malignancies in
western countries (1,2). Radical nephrectomy can be curative in
early stage disease, but ~30% of patients present with advanced
disease, including locally invasive or metastatic RCC at the time
of diagnosis, which seems to be resistant to cytotoxic
chemotherapies, hormone therapies and radio-therapies (3,4). The
most common histological type of RCC is renal clear cell carcinoma
(CC), that accounts for ~70–80% of all renal neoplasms and appears
to be the only histological subtype that shows any consistent
response to immunotherapeutic approaches (5–7).
Cytokine-based immunotherapy, such as interleukin (IL)-2 and
interferon (IFN)-α, either as single agents or in combination
(8), has previously been adopted
in the adjuvant setting of RCC, but produced only occasional
benefits. The limited success indicates the potential value of
optimizing cell-based immunotherapy for RCC with the aim of
increasing the number of durable responses, as has already been
done with some success in melanoma, in which this approach resulted
highly effective for metastatic patients refractory to other
treatments (9). One important
aspect of cell-based immunotherapy is the in vitro
generation of tumor-reactive T cells that can exert an antitumor
activity in vivo. To achieve this aim, it is necessary to
select and expand tumor-specific T cells after culture with highly
immunogenic tumor cell lines, or identify new RCC tumor-associated
antigens (TAAs). Recent progress in proteomic technologies, such as
the development of quantitative proteomic methods, high-resolution,
high-speed and high-sensitivity mass spectrometry, has opened up
new avenues for the discovery of TAAs. Studies of global protein
expression in human tumors using proteomic technologies have led to
the identification of various biomarkers that will potentially be
useful in identifying cancer in different organs, including the
liver, prostate, breast, bladder, colon, stomach, lung and ovaries
(10–18). Several groups have studied protein
expression in RCC cell lines with two-dimensional gel
electrophoresis technology in combination with mass spectrometry
(MS) to detect RCC markers (19–21)
but in the present study, for the first time, we have applied
system biology to characterize an immunogenic cell line by means of
genomic and proteomic approaches. Proteomics is a powerful tool for
screening and identifying novel TAAs that could be used to devise
prospective cell-based vaccines for RCC patients. Changes in TAAs
expression levels may also be effectively monitored using two
dimensional electrophoresis/matrix absorption laser desorption
ionization/time of flight/mass spectrometry (2-DE/MALDI/TOF/MS)
analysis, that allows rapid and systematic analysis of thousands of
proteins.
Materials and methods
Ethics statement
The cell line was generated from primary kidney
tissue explants, after obtaining written informed consent. The
protocol was approved by ethics commission of the medical faculty
of the University Hospital of Bari, Italy.
Isolation and cloning of RCC85#21 cell
line
The primary tumor was histological type grade I
according to the Fuhrman et al classification (22), non-aggressive and did not invade
the renal artery or vena cava. The tissue was composed mainly of
clear cells with an alveolar/tubular arrangement. The tumoral
tissue was minced and digested using an enzymatic cocktail, as
previously described (23). The
cellular suspension was filtered (100 μm), washed and centrifuged
500 μg for 10 min. The pellet was resuspended in AR5 medium
[RPMI-1640 medium supplemented with 20% fetal bovine serum (FBS),
20 μg/ml insulin, 10 μg/ml transferrin, 25 nM sodium selenite, 50
nM hydrocortisone, 1 ng/ml epidermal growth factor, 10 μM
ethanolamine, 10 μM phosphorylethanolamine, 100 pM
triiodothyronine, 2 mg/ml bovine serum albumin, 10 mM HEPES buffer,
2 mM L-glutamine and 0.5 mM sodium pyruvate] and incubated for 5
days. In the subsequent step, the cells were resuspended in basal
medium composed of RPMI medium supplemented with 20% FBS, 2 mM
L-glutamine, 100 IU/ml penicillin, 100 mg/ml streptomycin and 10 mM
HEPES, and placed in culture flasks incubated at 37°C and 5%
CO2. The RCC85 cell line was cloned using the ‘limiting
dilution’ technique: 1×10⁵ tumor cells at passage 39
were diluted in basal medium and plated in 96-well plates;
1×10⁴ ‘feeder cells’ (NIH 3T3) irradiated with 10,000
rad were added to each well to ensure the viability and
proliferation of tumor cells. After 16 h of incubation the cells
were diluted to obtain 1–10 cells per well. After one week, cell
clones presenting cell proliferation were identified by microscopic
observation, and the tumor cells were expanded by transferring the
plates from 48- and 24-wells. The final result was the isolation of
a stabilized, immunogenic clone of renal tumor cells. Epstein-Barr
virus (EBV)-transformed lymphoblastoid cell lines (EBV-LCL) were
also generated from patient RCC85 PBMC using the B95.8 (type 1)
virus isolate.
Immunocytochemistry
Samples taken from cell culture flasks were retained
in PreservCyt™. Subsequently, cytological preparations were
obtained in monolayer apparatus with ThinPrep, the first of which
was colored by Papanicolaou staining. The others were used for
immunocytochemical staining, performed with the
avidin-biotin-peroxidase technique in an automatic immunostainer
(DakoCytomation, Carpinteria, CA, USA), using the following primary
antibodies: cytokeratin AE1/AE3 (dilution 1/5), cytokeratin 18
(dilution 1/2), cytokeratin 19 (dilution 1/100), epithelial
membrane antigen (EMA) (dilution 1/100), Ki-67 (dilution 1/100),
mitochondria (dilution 1/75), vimentin (dilution 1/2) and the
detection system LSAB Plus (DakoCytomation). The sections were
incubated with primary antibodies for 16 h at 4°C and then with
biotinylated secondary antibodies and avidin-peroxidase for 30 min
at 37°C. Detection was done with diaminobenzidine chromogen (DAB)
for 20 min at 20°C and nuclear contrast was obtained by immersion
for 2 min in Meyer's hematoxylin. The sections were finally mounted
with glycerine and special coverslips. At least 3 experiment for
each sample were performed.
Real-time PCR
Total RNA was isolated from RCC85#21, HeLa (human
cervical cancer cells) and HK2 (normal human kidney cells) cell
lines with the TRIzol® reagent (Invitrogen, Carlsbad,
CA, USA) and cDNA was synthesized with the High Capacity cDNA
Reverse Transcription kit (Life Technologies Europe BV, The
Netherlands) according to the manufacturer's instructions. The
expression levels of the following tumor antigen and inflammatory
antigen/cytokine genes were analysed by real-time PCR on a 7500
Fast Real-Time PCR system (Life Technologies): telomerase reverse
transcriptase (TERT), ribosomal protein SA or laminin receptor 1
(RPSA alias OFA/iLRP), carboxylesterase 1 (CES1) and interleukin-6
(IL6). Real-time PCR reactions were performed using the TaqMan
Universal PCR Master Mix and the following TaqMan Gene Expression
assays (Life Technologies): Hs00972656_m1 (TERT), Hs01080364_m1
(RPSA), Hs00275607_m1 (CES1) and Hs00985639_m1 (IL-6). Each assay
contains two unlabeled PCR primers (each final concentration being
900 nM) and one FAM dye labeled TaqMan MGB probe (final
concentration 250 nM). Human ACTB (β actin) was used as endogenous
control (VIC/MGB Probe, Life Technologies). Negative controls
(samples without reverse transcriptase) were included. Quantitative
values were obtained from the Ct (threshold cycle) data determined
using default threshold settings. Gene expression data were
normalized to human ACTB (β actin) and the relative quantification
(RQ) was calculated with the 2-ΔΔCt method. The data are presented
as relative quantity (RQ) of target genes, normalized with respect
to ACTB and the calibrator sample (HK2). At least 3 experiment for
each sample were performed.
Genetics instability
Genomic DNA was extracted from RCC cell lines and
lymphocytes with the Blood and Cell Midi kit (Qiagen, Milan,
Italy), according to the manufacturer's instructions. Then, DNA
samples were evaluated for microsatellite instability (MSI) and
loss of heterozygosity (LOH) by polymerase chain reaction (PCR) and
a panel of 5 microsatellite markers: BAT25 and BAT26
(mononucleotide repeat), D2S123, D5S346 and D17S250 (dinucleotide
repeat) (23). PCR reactions were
performed in a final volume of 15 μl with 50 ng of genomic DNA and
using the following reaction profile: 2 min initial denaturation at
95°C followed by 95°C × 20 sec, 55°C × 20 sec, 72°C × 20 sec for 30
cycles and 5′ of final extension at 72°C. The primer set sequences
used, the number of GDB/Genebanks and the size of amplified
products are shown in Table I. The
microsatellite analysis was carried out by SSCP (single-strand
conformation polymorphism) using a vertical electrophoresis system
in polyacrylamide gel at 10% (acrylamide/bis acrylamide 19:1)
containing 8 M urea. The electrophoretic run was performed at 56°C
using the D-GENE System (Bio-Rad, Hercules, CA, USA). Silver
staining for visualization of the bands was carried out with 0.2%
silver nitrate. Positive MSI results were confirmed by repetition
in independent PCR reactions at least twice. Allelic loss (LOH) was
determined in cases where one of the normal alleles for a given
marker was missing.
 | Table IPrimer set for genetics
instability. |
Table I
Primer set for genetics
instability.
| Primer
sequences | No. of GDB | Size (kbp) |
|---|
| BAT-25 |
| Forward:
5′-TCGCCTCCAAGAATGTAAGT-3′ | 9834508 | 120 |
| Reverse:
5′-TCTGCATTTTAACTATGGCTC-3′ | U63834 | |
| BAT-26 |
| Forward:
5′-TGACTACTTTTGACTTCAGCC-3′ | 9834505 | 116 |
| Reverse:
5′-AACCATTCAACATTTTTAACCC-3′ | L47575 | |
| D5S346 (DP1) |
| Forward:
5′-ACTCACTCTAGTGATAAATCGGG-3′ | 181171 | 96–122 |
| Reverse:
5′-AGCAGATAAGACAGTATTACTAGTT-3′ | | |
| D2S123 |
| Forward:
5′-AAACAGGATGCCTGCCTTTA-3′ | 187953 | 197–227 |
| Reverse:
5′-GGACTTTCCACCTATGGGAC-3′ | | |
| D17S250 |
| Forward:
5′-GGAAGAATCAAATAGACAAT-3′ | 177030 | 151–169 |
| Reverse:
5′-GCTGGCCATATATATATTTAAACC-3′ | X54562 | |
Two-dimensional electrophoresis
(2DE)
RCC85#21 clones were cultured until confluence at
the 40th passage. Cells, 3.5×10⁶, were resuspended in
sample buffer (8 M urea, 4% CHAPS, 40 mM Tris-base, 65 mM DTT, and
a trace amount of bromophenol blue). The total protein
concentration was measured by colorimetric assay based on the
Bradford dye-binding method (Bio-Rad protein assay) and samples
were stored at −80°C until use. Isoelectrofocusing was carried out
using a 13-cm immobiline DryStrip of pH 3.0–10.0 non-linear range.
The IPG strips were rehydrated for 8–10 h at room temperature with
250 ml rehydration solution [8 M urea, 2% (w/v) CHAPS, 0.5%
ampholine pH 3.0–10.0, 18 mM DTT, 0.002% (w/v) bromophenol blue].
Proteins (60 mg) were loaded onto rehydrated IPG strips for
analysis and 1 g protein was loaded for preparative 2-D PAGE. IEF
of the proteins was performed at 40 kkVolt hour total produced by
overnight run. After IEF, IPG strips were incubated at room
temperature for 15 min in 130 mM DTT equilibration buffer [75 mM
Tris-HCl, pH 8.8; 6 M urea; 30% (v/v) glycerol 87%; 2% (w/v) SDS;
0.002% bromophenol blue, then for 15 min in 270 mM IAA
equilibration buffer]. The second dimension was carried out on
in-house polyacrylamide/PDA (12.5% T/2.6% C) lab gels in SDS-PAGE
running buffer. Analytical 2-DE gels were stained with the PlusOne
silver stain kit. Preparative 2-DE gels were stained with 0.05%
(w/v) Coomassie Brilliant Blue R-250. Stained gels were scanned
with a flat-bed ImageScanner (Amersham Pharmacia Biotech) to
generate digital images. The 2-DE gel images were analyzed using
Image Master 2D Platinum software (Amersham Biosciences, Uppsala,
Sweden). At least 3 replicate gels for each sample were
performed.
MALDI-TOF/MS analysis
The protein spots on 2-DE gels were manually
excised, and underwent in-gel tryptic digestion by an adaptation of
the procedure by Shevchenko et al (25). Peptide digests were analysed using
a MALDI-TOF/MS (Autoflex II, Bruker Daltonics, Bremen, Germany)
instrument. Prior to mass spectrometry analysis, the tryptic
peptide mixture was desalted and concentrated using
ZipTip® Pipette Tips packed with C18 resin
(Millipore, USA). The peptides were eluted from ZipTip directly
onto the Prespotted Anchor Chip™ (PAC, Bruker Daltonics) a MALDI
sample carrier with spotted matrix (α-cyano-4-hydroxycinnaminic
acid) positioned beside the pre-spotted calibration point. The
MALDI mass spectra were acquired on an Autoflex II mass
spectrometer equipped with a 337-nm nitrogen laser. All spectra
were collected in reflecting mode with a delayed extraction time of
110 ns, except for PSD spectra which were collected without
post-ionization delayed extraction. Post source decay (PSD) spectra
were externally calibrated using abundant fragment ion peaks
derived from angiotensin I, ACTH 1–17 and ACTH 18–39. The selection
of precursor ions for PSD analysis was done with an ion gate at a
resolution of ~100 FWHM (full width half the maximum). A total of
300–400 laser shots at a 50-Hz repetition rate were collected over
different areas of the sample/matrix spot to generate averaged
precursor ion and PSD mass spectra. Mass spectra were acquired from
each sample in the 400–3500-m/z range. All mass values are reported
as monoisotopic masses. The program used to create the 'peak list'
from the raw acquired data was FlexAnalysis 2.1 with the default
parameters. Protein identification was achieved by database search
via Biotools 2.2 and MASCOT search algorithm (http://www.matrix.science.com) against the MSDB,
NCBInr and Swissprot databases using the following parameters:
Homo sapiens as taxonomic category, trypsin as enzyme,
carbamidomethyl as fixed modification for cysteine residues,
oxidation of methionine as variable modification, and one missing
cleavage and 100 ppm as mass tolerance for the monoisotopic peptide
masses.
Immunophenotypic analysis
The following fluorescein isothiocyanate
(FITC)-conjugated or phycoerythrin (PE)-conjugated mAbs were used
for immunofluorescent staining of the RCC85#21 cell line: anti-HLA
class I, anti-HLA-DR, anti-CD54, anti-CD80, anti-CD40 and anti-CD86
(BD Pharmingen). In order to stimulate the expression of
costimulatory markers, RCC85#21 cells were incubated with IFN-γ for
48 h at the concentration of 500 IU/ml. Cells were washed and
resuspended in FACS buffer (phosphate-buffered saline pH 7.2, 0.2%
bovine serum albumin, and 0.02% sodium azide) and incubated with
fluorochrome-conjugated mAbs for 15 min at 4°C, then washed with
the same buffer before flow cytometric analysis. Data were acquired
using an EPICS XL flow cytometer (Beckman Coulter, USA) and
analysed using WinMDI Version 2.8 software. The area of positivity
was determined using an isotype-matched mAb, and a total of
104 events for each sample were acquired. At least 3
experiment for each sample were performed.
Mixed lymphocyte and tumor cell cultures
(MLTC)
Peripheral blood mononuclear cells (PBMCs) were
obtained at the time of diagnosis from whole blood of autologous
RCC85 patient, after obtaining informed consent, under an
institutional review board-approved protocol, and were isolated by
Ficoll-Hypaque density gradient centrifugation (Sigma Chemical Co.,
St. Louis, MO, USA), washed twice in phosphate-buffered saline and
used in mixed lymphocyte/tumor cell cultures as described below.
The RCC85#21 line was prior incubated with IFN-γ (100 IU/ml) for 48
h. Autologous PBMCs were co-cultured in 24-well plates (Costar,
Corning, CA, USA) at 106 cells/well with irradiated RCC
stimulator cells (105 cells/well) in AIM-V medium (Life
Technologies, Invitrogen, Italy) supplemented with 10%
heat-inactivated pooled human serum [Sigma (medium Mb)].
Recombinant human IL-2 was added on day 3 (250 IU/ml; Proleukin,
Chiron, and Emeryville, CA, USA). Responder lymphocytes were
restimulated weekly with 105 irradiated tumor cells in
IL-2-containing Mb medium for a further 2 weeks. On day 21 (T21)
CD8+ lymphocytes were selected by immunomagnetic
CD8+ microbeads (Miltenyi Biotec, Milan, Italy) and
positively-isolated T cells were cultured for an additional 2
weeks. On day 35 of culture, CD8+ T cell responders were
used as effector cells in functional and molecular analyses.
Enzyme-linked immunosorbent spot assays
(ELISPOT)
CD8+ responder T cells were assessed for
specific cytokine production using hIFN-γ enzyme-linked
immunosorbent spot (ELISPOT) assays (Mabtech, Mariemont, OH, USA),
as previously described (22).
Determinations were performed in triplicate and spots were counted
using an ELISPOT plate reader (Zeiss-Kontron, Jena, Germany).
HLA-restriction of T cell recognition was determined by the
addition of blocking antibodies (W6/32, an anti-HLA class I kindly
donated by W.J. Storkus) at final concentrations of 100 mg/ml to
replicate ELISPOT wells. At least 3 experiments for each sample
were performed.
Cytotoxicity test
Responder CD8+ T cells stimulated by MLTC
assay were evaluated at day 30 + 6 for their ability to kill target
cells, including the patient-derived RCC cell line, EBV-LCL, and
K562 cells (erythroid cell line) in standard 4-h
51Cr-release assays (23).
Statistical analysis
The results of quantitative variables are expressed
as mean ± SD. All experiments were repeated more than three times
and similar results were observed. Comparisons between data groups
were performed using the nonparametric Mann-Whitney rank sum U
test. Values of p≤0.05 were considered statistically
significant.
Results
RCC85#21 cell line isolation and
cloning
The RCC85 tumor cell line was cultured in complete
medium added with 20% FBS and cloned by the scalar dilution method
to obtain a single cell per culture plate well. The RCC85#21 clone
showed a homogeneous cell shape, being polygonal and multinucleated
with nuclei positioned at the center of the cytoplasm, and tended
to form cellular clusters. The proliferative rate remained constant
with trypsinization to 90% cells confluence every 72 h. The
clinical and pathological characteristics of the RCC 85 patients
are listed in Table II. RCC85
cells were cloned by the limiting dilution technique at step P39.
Through this procedure, several clones were isolated from a single
cell placed in culture in a 96-well plate, but only one, the
RCC85#21 clone named Elthem, showed morphological and functional
characteristics that could define an immunogenic renal tumor cell
line.
| Table IIFeatures of the primary tumor and
RCC85#21 derived cell clone. |
Table II
Features of the primary tumor and
RCC85#21 derived cell clone.
| Clinical
features | |
|---|
| Age/gender | 62/M |
| Size | 10 cm |
| Histological
grade | 1 |
| Cytology | Clear cell |
| Invasion of
artery/vein | No |
| Lymph node
metastasis | T3aN0M0 |
| Cell line
(RCC85#21) |
| Start date of
culture | 17/07/01 |
| Number of
passages | 50 |
| Doubling time | 72 h |
| Cell contour | Flat |
| Nuclei | Multinucleated |
| Cell
appearance | Polygonal |
Phenotypic characterization of the
RCC85#21 cell line
The tumor phenotype characterization and
confirmation of the epithelial origin of RCC85#21 cells were
performed by immunocytochemistry and flow cytometry analysis.
Trypsin was not used to avoid altering the membrane antigens and
subsequent specific binding with the antibody used for
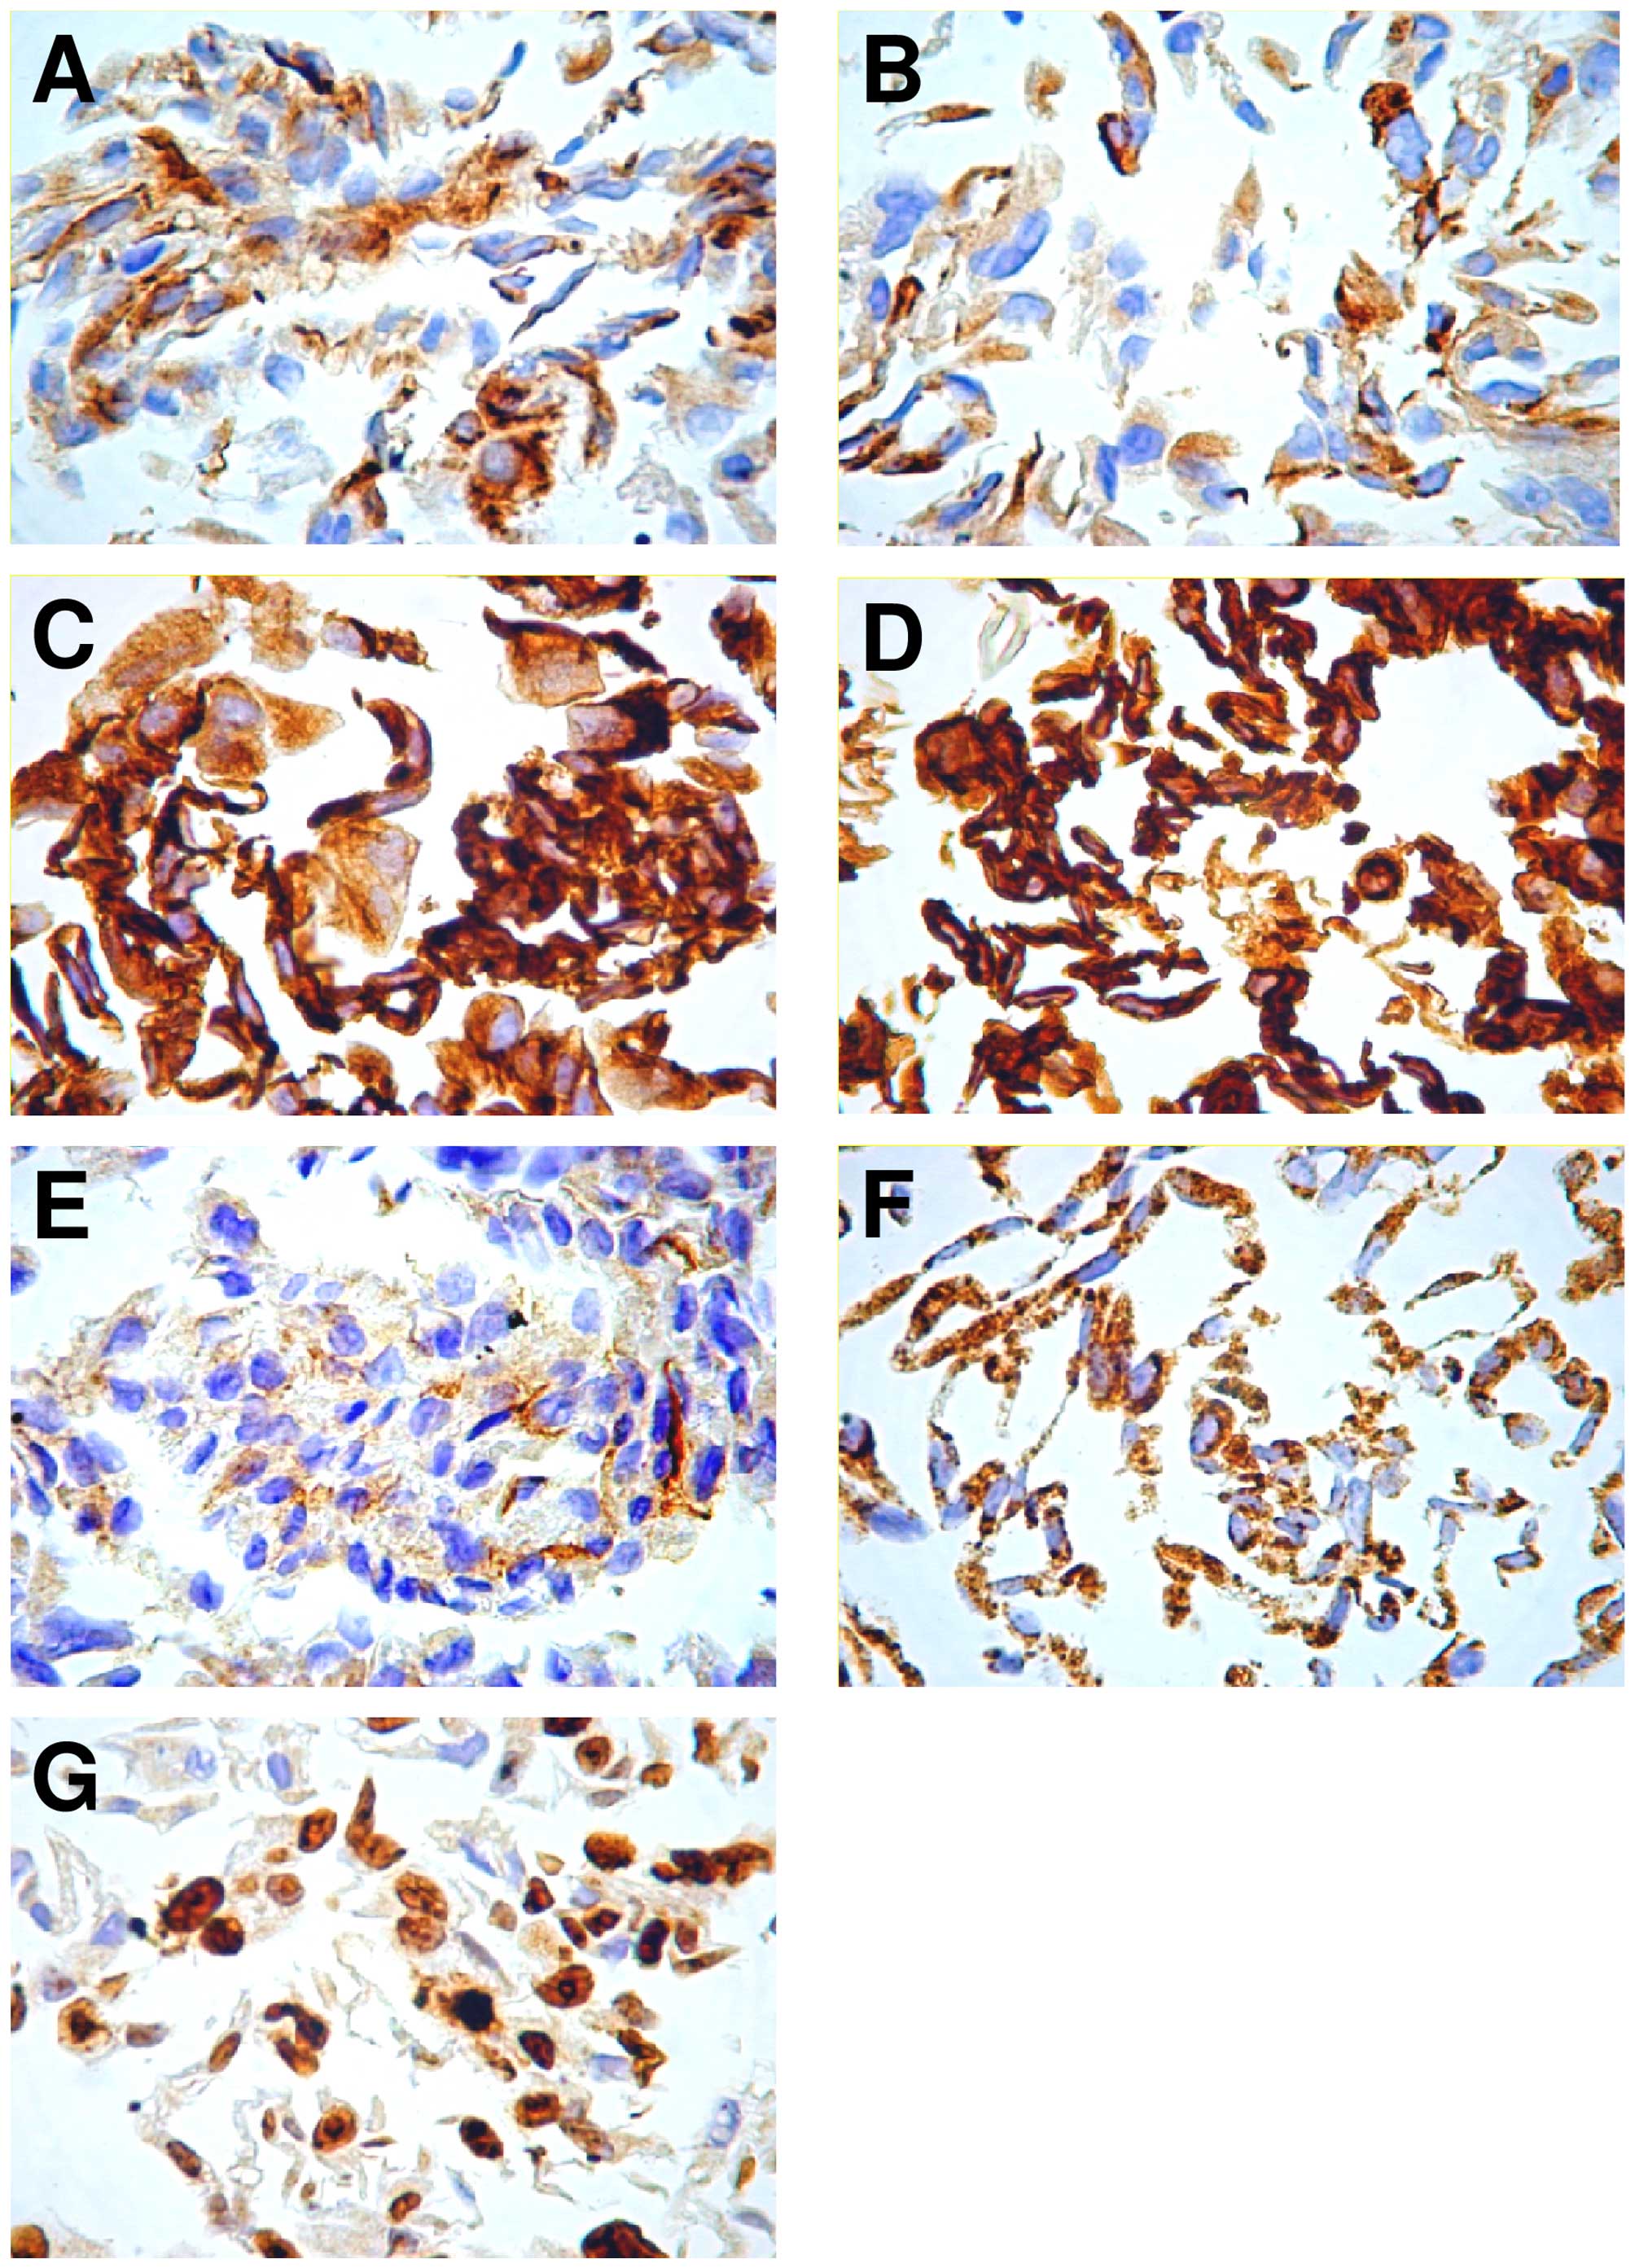
immunostaining. Cells were inbedded in paraffin. Cytokeratins 18, a
marker of mitochondria, vimentin and Ki-67, were strongly positive
(40–90%) and cytokeratins AE1/AE3, cytokeratins 19 and EMA were
weakly positive (5–30%) (Fig. 1).
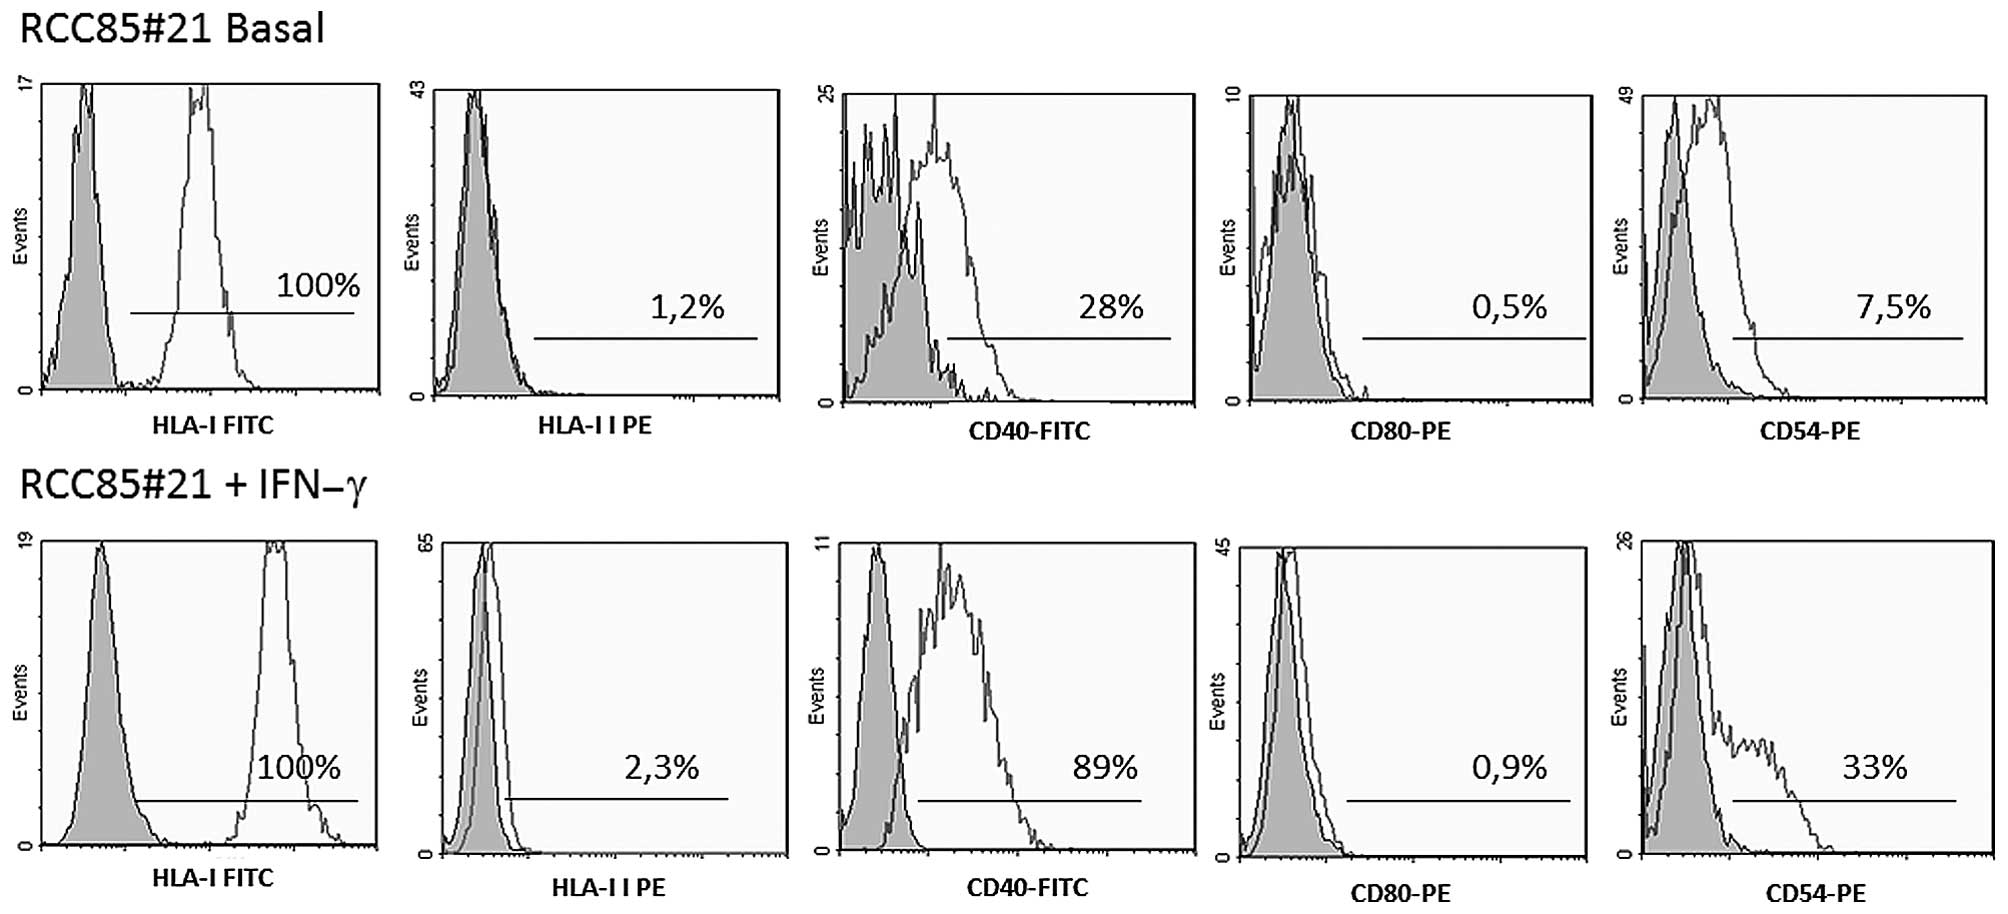
Flow cytometry analysis revealed that RCC85#21 cells expressed a
high percentage of HLA-class-I (100%) and a lower rate of CD40
(28%) and CD54 (7.5%) molecules when compared with cells stimulated
with IFN-γ (Fig. 2). By contrast,
HLA-class-II and costimulatory CD80 molecules were not detectable
under basal conditions nor after stimulation with IFN-γ.
Real-time PCR and genetic
instability
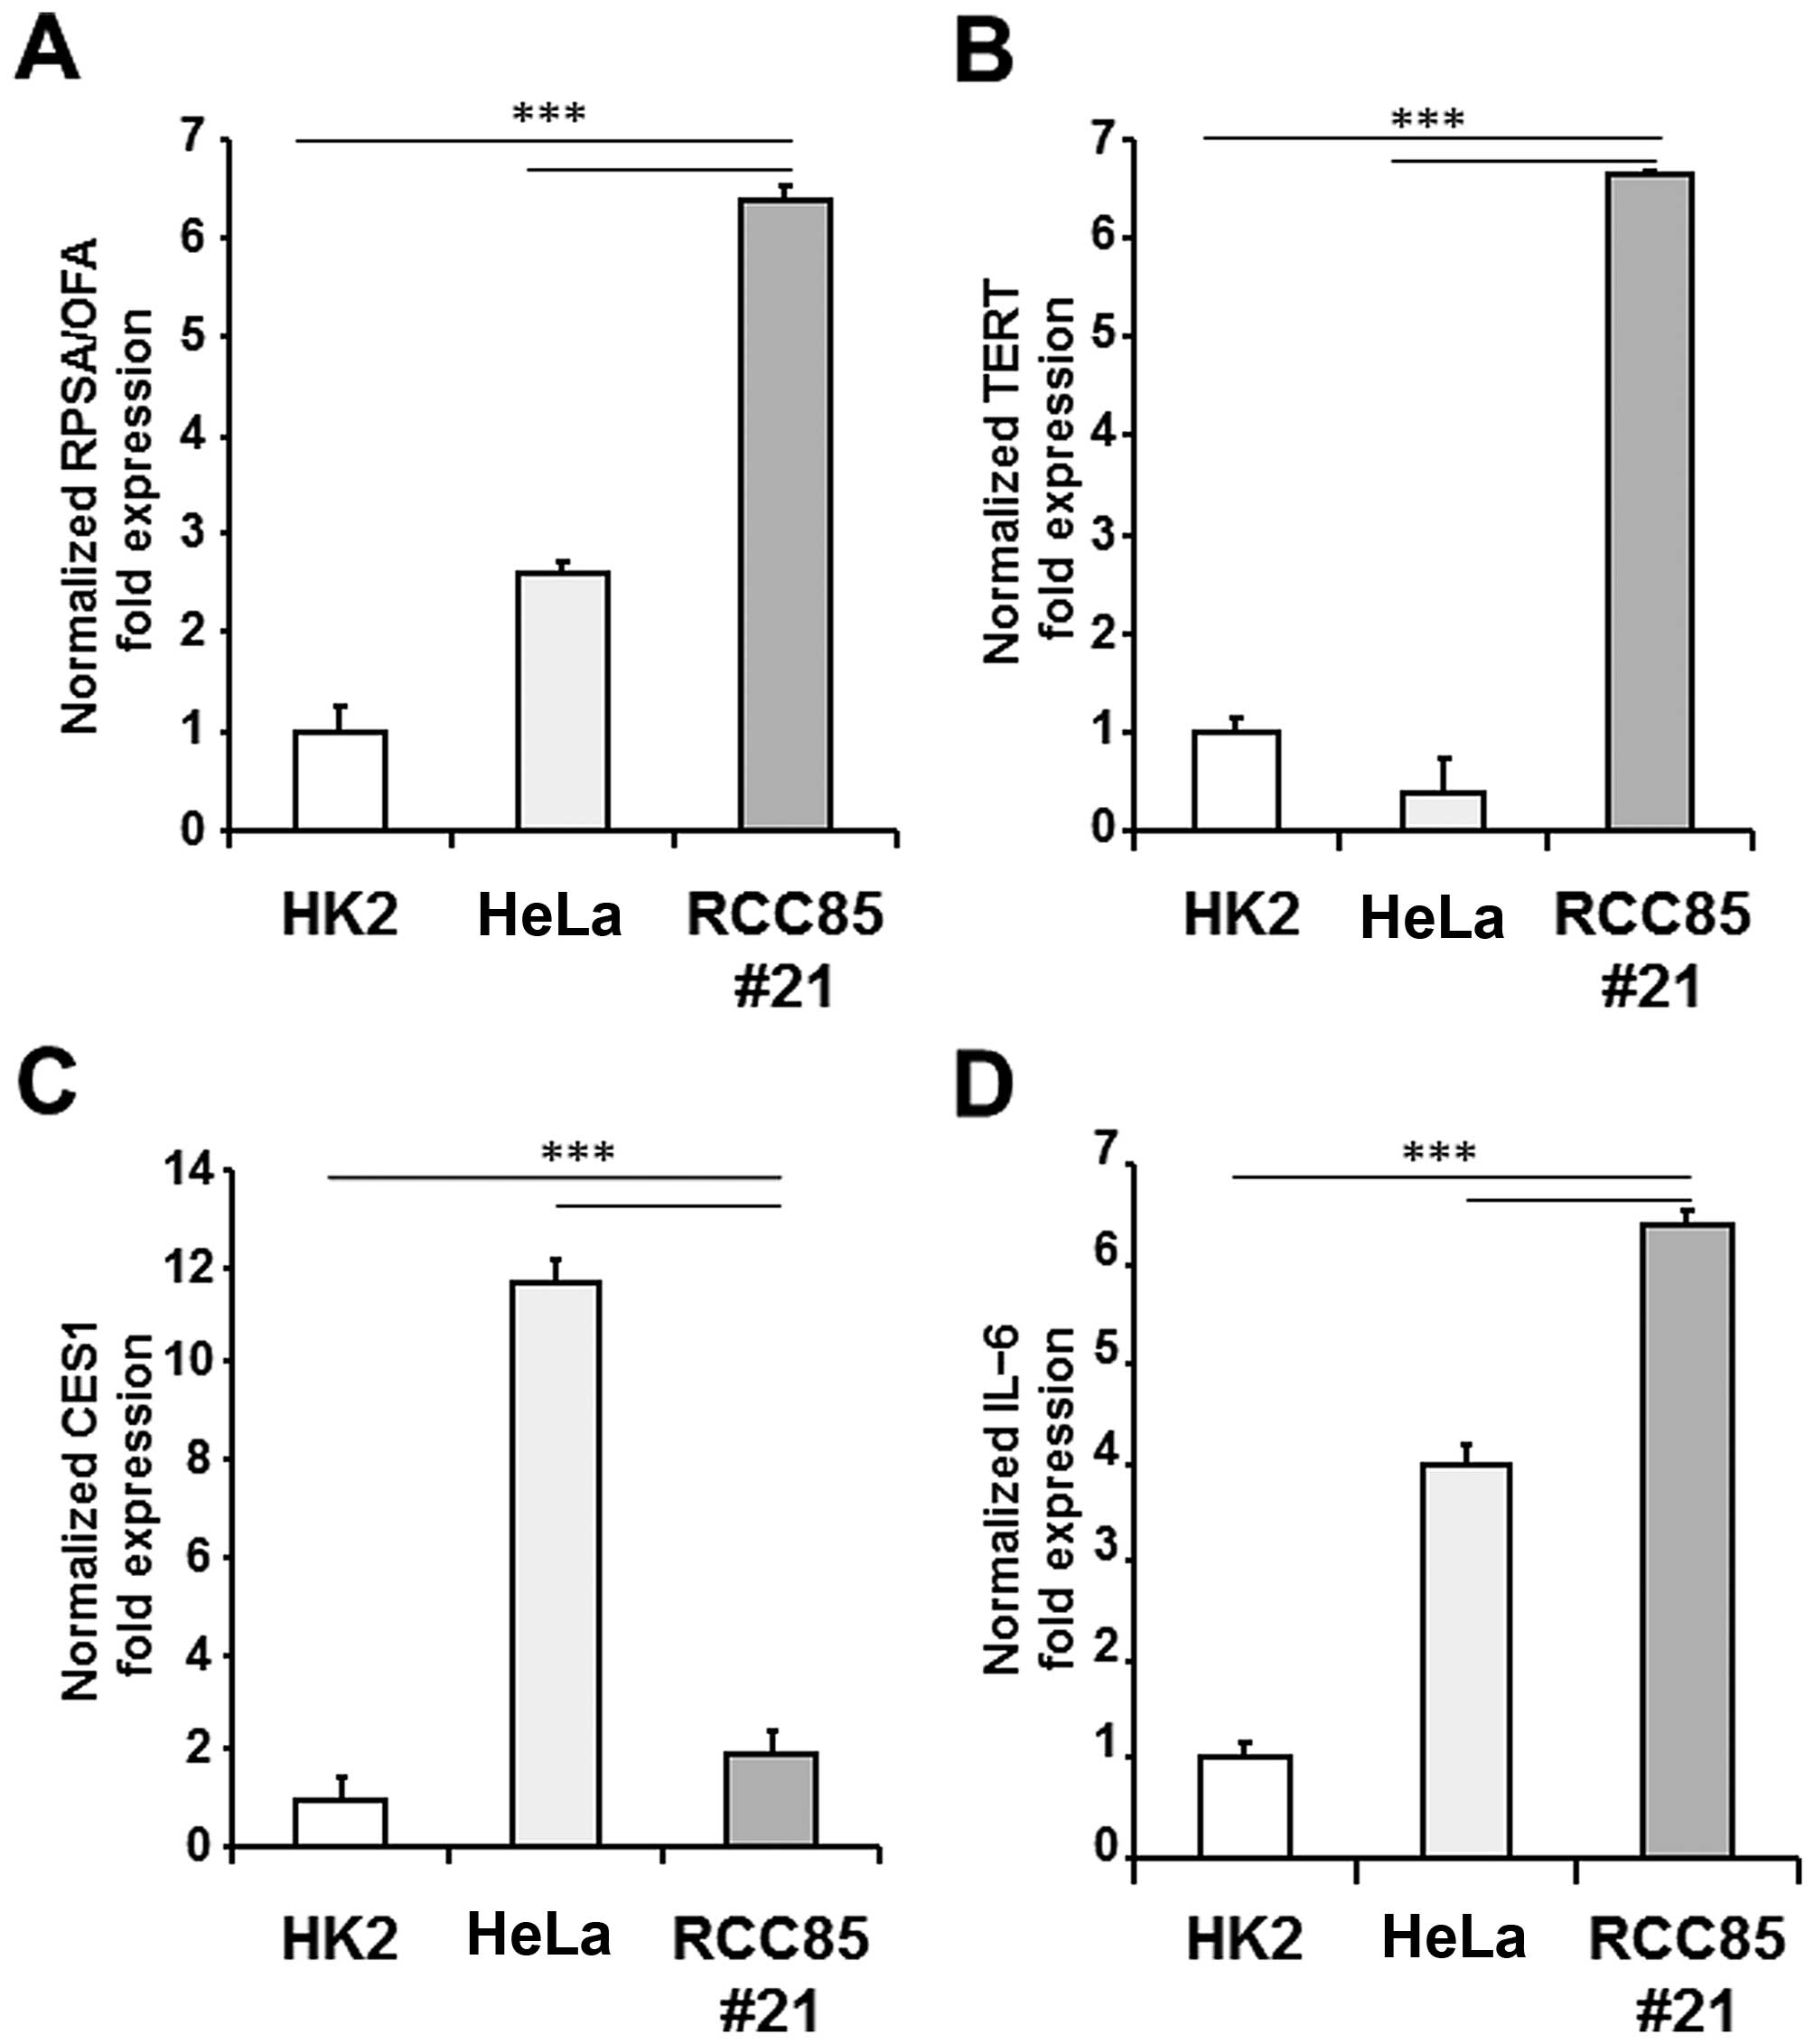
The RCC85#21 clone was characterized by real-time
PCR to evaluate the expression of tumor and inflammatory
biomarkers, such as RPSA alias OFA/iLRP (RQ = 6.3±0.15), TERT (RQ =
2.0±0.28), CES1 (RQ = 6.6±0.05) and IL-6 (RQ = 6.3±0.20). As shown
in Fig. 3, the expression levels
of RPSA/OFA, TERT and IL-6 genes were significantly upregulated in
the RCC85#21 cell line as compared to HK2 cells and HeLa cells
(p<0.001). The expression level of CES1 was significantly
upregulated in the RCC85#21 cell line as compared to HK2
(p<0.001), while CES1 gene expression resulted decreased as
compared to HeLa tumor cells (p<0.001). Genome instability was
studied by evaluating microsatellite instability (MSI) and loss of
heterozygosity (LOH) with a standard panel of 5 markers, already
used to characterize other tumors (24). No difference in MSI in the RCC85#21
cell line was found as compared to control (Fig. 3). LOH was observed at the locus DP1
or D5S346 in the RCC85#21 clone but not in the renal cancer cell
lines from which it was generated (Fig. 4) (26).
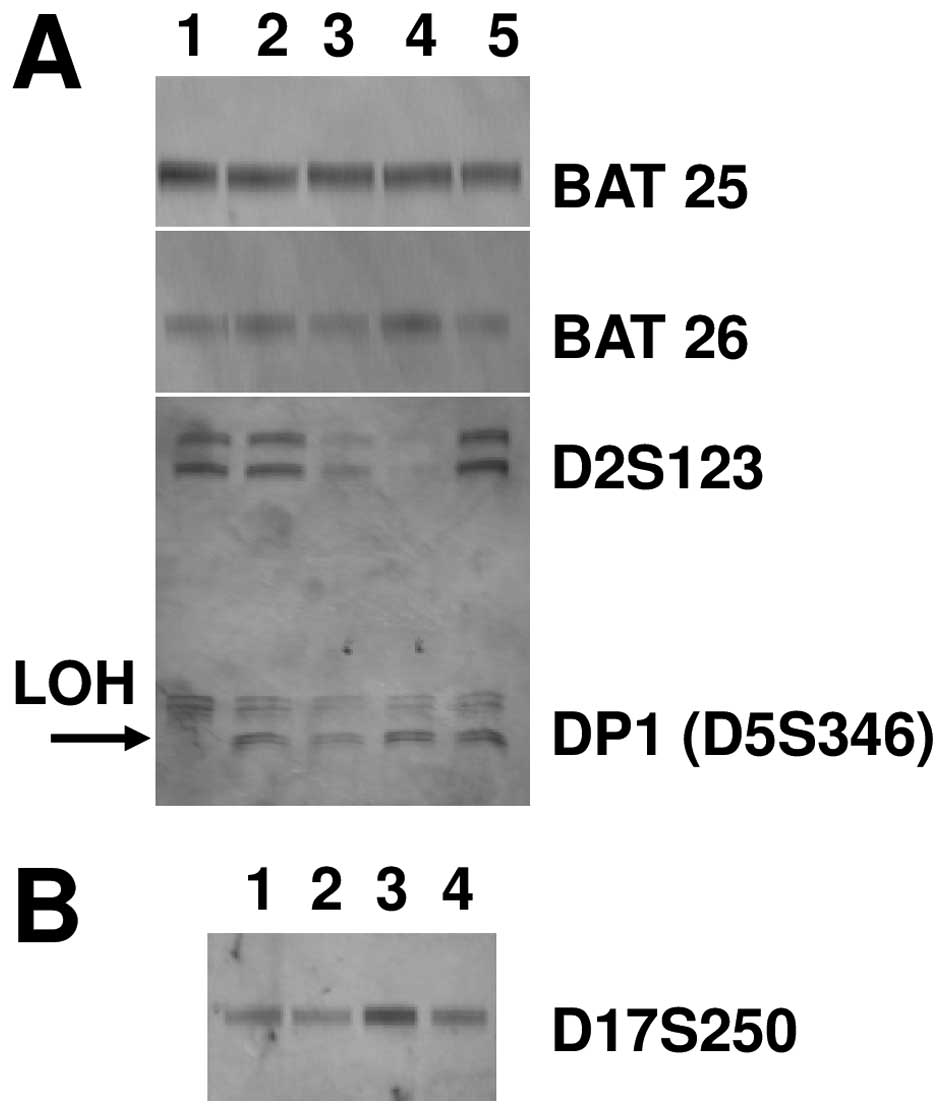 | Figure 4Microsatellite instability (MSI) and
loss of heterozygosity (LOH) of the RCC85#21 clone. Data are
representative of three independent experiments. (A) No difference
in MSI in the RCC85#21 cell line was found as compared to control
at the locus BAT25, BAT26 and D2S123 (lane 1, RCC85#21; lane 2,
PBMC, peripheral blood mononuclear cells; lane 3, RCC1; lane 4,
RCC3; lane 5, RCC2), but LOH was observed at the locus DP1 or
D5S346 in the RCC85#21 clone but not in the renal cancer cell lines
from which it was generated (RCC1/RCC2/RCC3). (B) No difference in
MSI in the RCC85#21 cell line was found as compared to control at
the locus D17S250 (lane 1, RCC2; lane 2, RCC3; lane 3, RCC85#21;
lane 4, PBMC, peripheral blood mononuclear cells). |
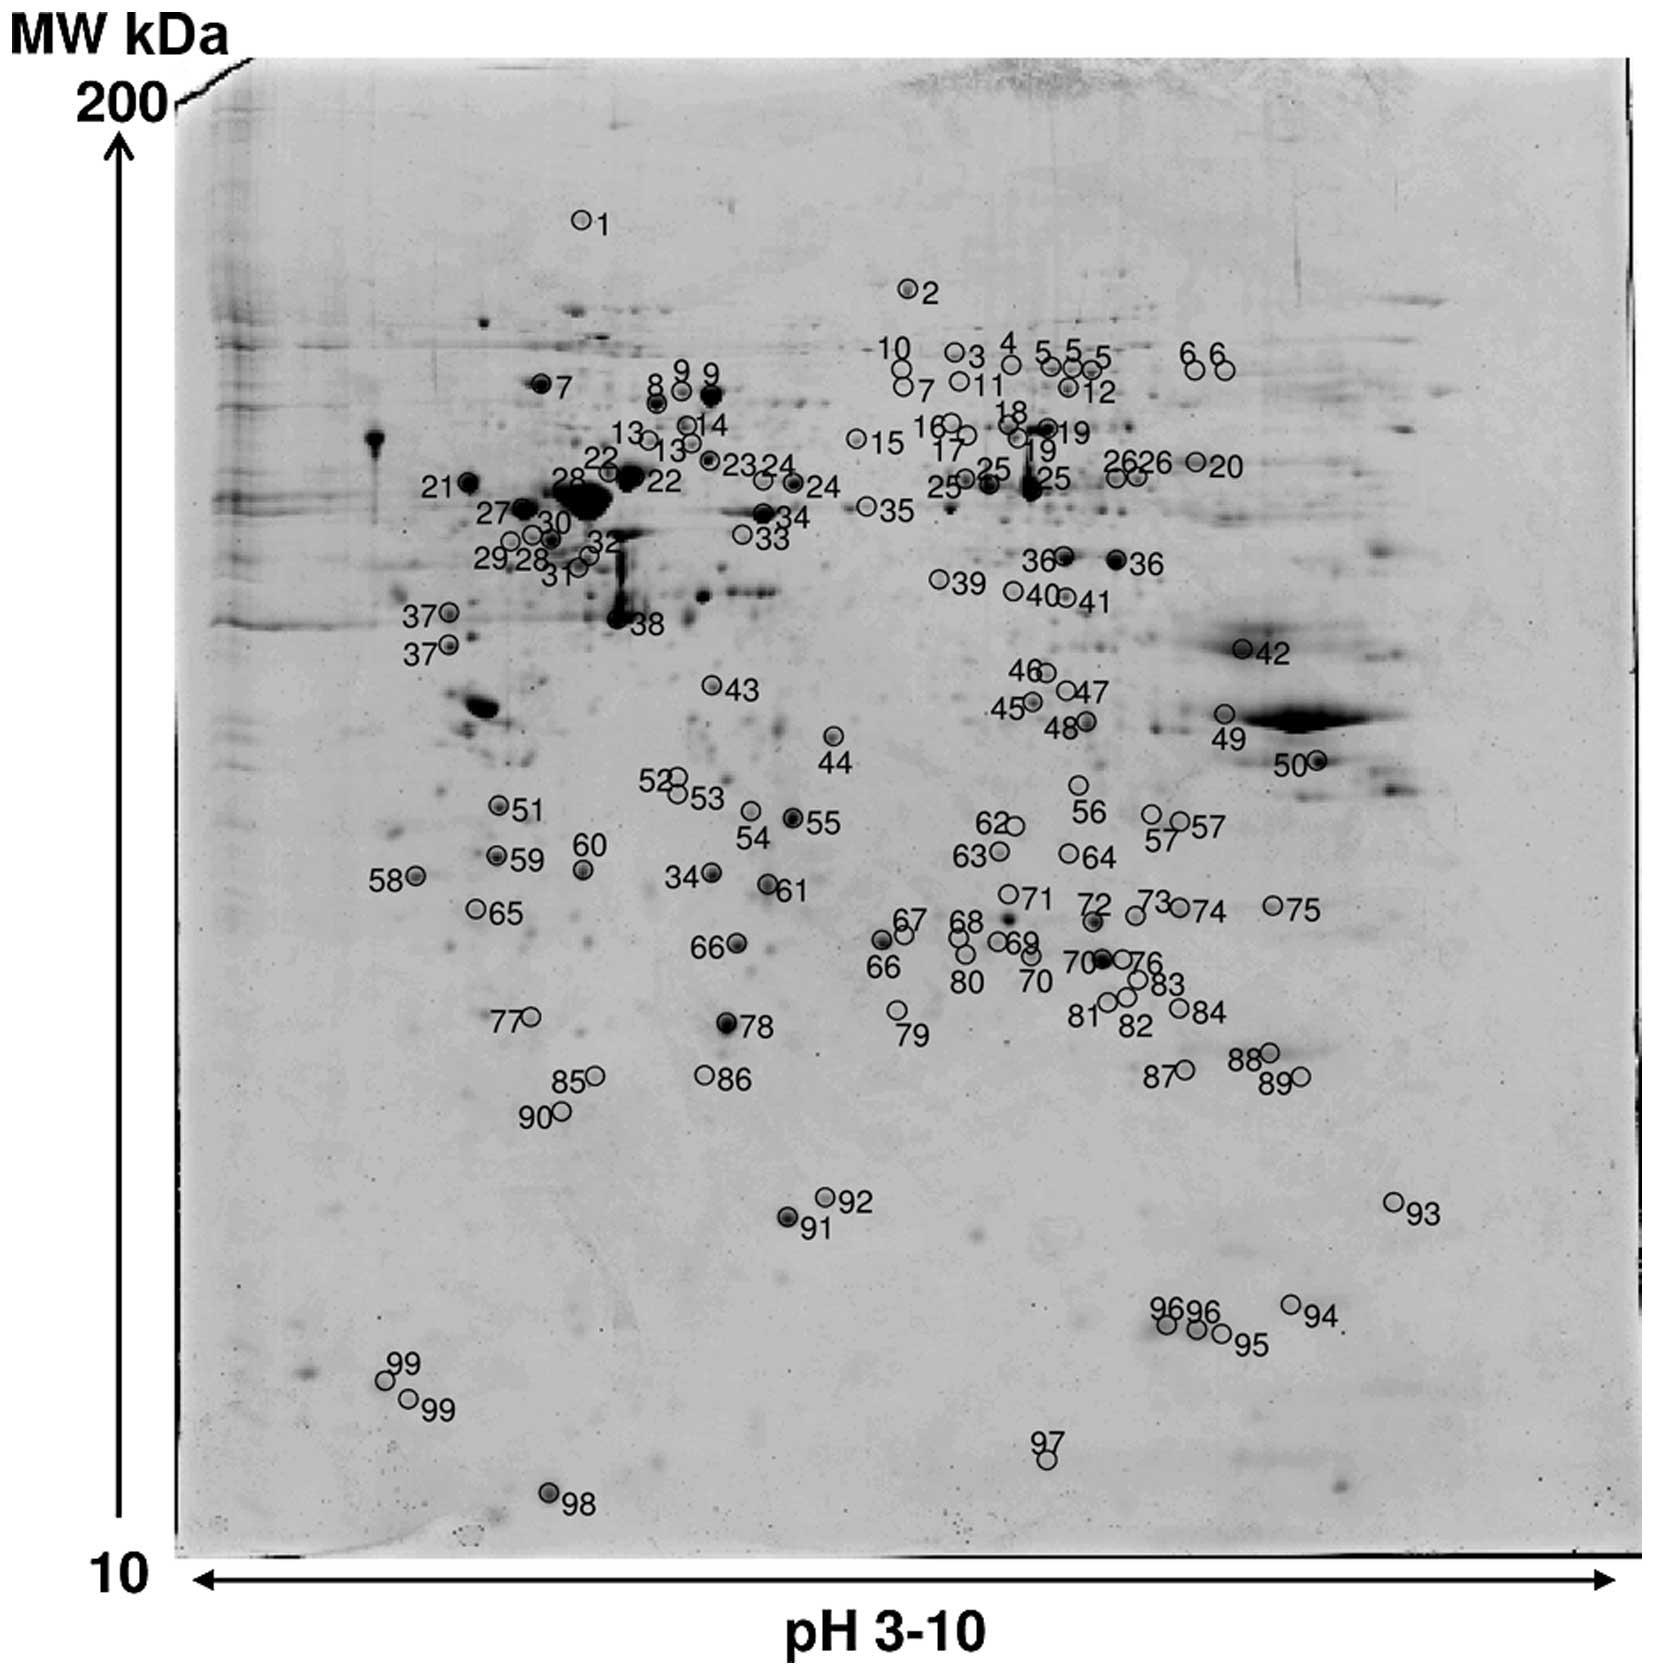
2DE and MS analysis
Image analysis of silver stained RCC85#21 gels
showed 700±26 spots. An average of 250 spots was selected from two
different Coomassie Blue-stained preparative gels representing the
total proteome displayed; among them 119 spots were identified,
corresponding to 99 different proteins. The proteome map was drawn
by identifying protein spots present in at least three out of four
analytical gels. Table III lists
all the identified proteins corresponding to the protein spots
presented on Fig. 5. Their
function and localization was derived from the databases of NCBI
and SWISS-PROT (http://www.ncbi.nlm.nih.gov, http://us.expasy.org/sprot/). Cytoskeleton proteins
(structural proteins), chaperones, proteins involved in energy,
carbohydrates, amino acids and the basal metabolism were
identified. Different enzymes were identified as isomerases,
oxidoreductases and proteases, as well as the channel protein
family, the proteasome complex, actin and calcium binding proteins
and proteins involved in apoptotic and proliferative processes.
Most of the identified proteins are cytoplasmic proteins
(structural proteins). Several lysosomal enzymes were identified,
as well as membrane proteins (protein channels and receptors). The
cellular function of each identified protein was searched for in
several proteic and bibliographic databases (SWISS-PROT and PubMed)
to assess the impact on the biology of the tumor, confirming their
role in several pathophysiological mechanisms. Some of these
identified proteins were components of the cytoskeleton such as
Lamin-A/C, vimentin and the tropomyosin α-3 chain. Vimentin has
already been shown to be abundant in kidney cancer cell lines
(27). Cofilin-1, the F-actin
capping protein β-and α-1 subunit, Actin cytoplasmic 2 and
Stress-70 protein were essential in the reorganization of actin
filaments as a cellular response to various growth factors
(28). Enzymes with a different
catalytic activity were identified (phosphoglucomutase-1 and
α-enolase). Isomerases such as protein disulfide-isomerase A3, and
protein disulfide-isomerase A6, as well as calcium binding protein
(Annexin A4 and Reticulocalbin-1) were also identified, together
with proteins involved in the oxidation-reduction processes such as
Peroxiredoxin-1 and 6, Thioredoxin-dependent peroxide reductase,
Superoxide dismutase [Cu-Zn] and energy metabolism (ATP synthase
subunit β and carbonic anhydrase 2) (29). Apoptosis has an important role in
tumor growth and several proteins involved in the apoptosis
pathway, key feature of known tumors such as galectin-1 and 3,
programmed cell death 6-interacting protein, were identified. Among
the other identified proteins, elongation factor 1-β, eukaryotic
translation initiation factor 3 subunit 2, elongation factor Tu
were involved in protein synthesis, and pyruvate kinase M1/M2
isozymes and glutathione S-transferase P in general metabolism.
Finally, protein channels (chloride intracellular channel protein
1) and proteins belonging to the family of chaperones responsible
for the correct ‘folding’ of proteins (protein disulfide-isomerase
A3, heat shock cognate 71-kDa protein, glucose-regulated protein,
T-complex protein 1 subunit γ) were identified in RCC (30).
| Table IIIProtein spots identified by MALDI-TOF
analysis. |
Table III
Protein spots identified by MALDI-TOF
analysis.
| Spot ID | Accession no. | Protein name | Mascot score | Sequence coverage
(%) | N. matched
peptides | PI | PM (Da) |
|---|
| 1 | Q9Y4L1 | Oxygen-regulated
protein precursor | 126 | 20 | 22 | 5.16 | 111,266 |
| 2 | P18206 | Vinculin | 88a | 26 | 20 | 5.5 | 124,292 |
| 3 | Q8WUM4 | Programmed cell
death 6-interacting protein | 71 | 21 | 21 | 6.13 | 95,963 |
| 4 | Q12931 | Heat shock protein
75 | | 18 | 17 | 6.09 | 73,971 |
| 5 | P02545 | Lamin-A/C | 281 | 45 | 42 | 6.57 | 74,095 |
| 6 | Q92804 | TATA-binding
protein-associated factor 2N | 56a | 20 | 13 | 8.04 | 61,793 |
| 7 | P11021 | Glucose-regulated
protein precursor | 231 | 37 | 29 | 5.07 | 72,402 |
| 8 | P11142 | Heat shock cognate
71 kDa protein | 293 | 43 | 36 | 5.37 | 71,082 |
| 9 | P38646 | Stress-70
protein | 330 | 47 | 43 | 5.87 | 73,635 |
| 10 | Q59GB4 |
Dihydropyrimidinase-like 2 variant | 106 | 27 | 15 | 5.85 | 68,142 |
| 11 | P15311 | Ezrin | 73a | 20 | 16 | 5.94 | 69,199 |
| 12 | P49915 | GMP synthase
[glutamine-hydrolyzing] | 179a | 42 | 32 | 6.42 | 76,667 |
| 13 | P61978 | Heterogeneous
nuclear ribonucleusprotein K | 144 | 33 | 24 | 5.39 | 51,230 |
| 14 | Q03252 | Lamin-2 | 186a | 53 | 33 | 5.29 | 67,647 |
| 15 | P17987 | T-complex protein 1
subunit α | 140a | 33 | 24 | 5.8 | 60,306 |
| 16 | P49368 | T-complex protein 1
subunit γ | 174a | 37 | 27 | 6.1 | 60,495 |
| 17 | P36871 |
Phosphoglucomutase-1 | 91 | 36 | 19 | 6.32 | 61,279 |
| 18 | P31948 |
Stress-induced-phosphoprotein 1 | 104 | 36 | 25 | 6.40 | 62,599 |
| 19 | P31939 | Bifunctional purine
biosynthesis protein | 107 | 22 | 14 | 6.39 | 64,425 |
| 20 | P14618 | Pyruvate kinase
isozyme M1/M2 | 110 | 27 | 13 | 7.96 | 58,470 |
| 21 | P07237 | Protein
disulfide-isomerase precursor | 300 | 55 | 38 | 4.76 | 57,480 |
| 22 | P10809 | Heat shock protein,
mitochondrial precursor | 131 | 34 | 21 | 5.7 | 61,187 |
| 23 | P48643 | T-complex protein 1
subunit ɛ | 176a | 37 | 23 | 5.45 | 59,633 |
| 24 | P30101 | Protein
disulfide-isomerase A3 precursor | 166 | 38 | 24 | 5.98 | 57,146 |
| 25 | P00352 | Retinal
dehydrogenase 1 | 206 | 37 | 22 | 6.29 | 54,696 |
| 26 | O60701 | UDP-glucose
6-dehydrogenase | 189 | 44 | 22 | 6.73 | 55,674 |
| 27 | P07437 | Tubulin β
chain | 57 | 15 | 5 | 4.78 | 50,095 |
| 28 | P08670 | Vimentin | 369 | 82 | 43 | 5.06 | 53,676 |
| 29 | Q969G3 | SWI/SNF-related
matrix-associated actin-dependent regulator of chromatin subfamily
E member 1 | 93 | 31 | 14 | 4.85 | 46,621 |
| 30 | P06576 | ATP synthase
subunit β, mitochondrial precursor | 133 | 25 | 9 | 5.26 | 56,525 |
| 31 | P43686 | 26S protease
regulatory subunit 6B | 114 | 31 | 14 | 5.09 | 47,337 |
| 32 | Q15084 | Protein
disulfide-isomerase A6 precursor | 64 | 19 | 7 | 4.95 | 48,091 |
| 33 | Q9Y230 | RuvB-like 2 | 99 | 43 | 19 | 5.49 | 50,994 |
| 34 | Q13561 | Dynactin subunit
2 | 80a | 42 | 14 | 5.1 | 44,318 |
| 35 | P31943 | Heterogeneous
nuclear ribonucleusprotein H | 116 | 31 | 14 | 5.89 | 49,484 |
| 36 | P06733 | α-enolase | 233 | 60 | 29 | 7.01 | 47,481 |
| 37 | Q15293 | Reticulocalbin-1
precursor | 91 | 29 | 7 | 4.86 | 38,866 |
| 38 | P63261 | Actin, cytoplasmic
2 | 79a | 38 | 8 | 5.31 | 42,108 |
| 39 | O60664 | Mannose-6-phosphate
receptor-binding protein 1 | 105 | 45 | 12 | 5.3 | 47,189 |
| 40 | P61163 | α-centractin | 94 | 30 | 9 | 8 | 42,701 |
| 41 | P49411 | Elongation factor
Tu, mitochondrial precursor | 121a | 45 | 16 | 7.26 | 49,852 |
| 42 | P04075 |
Fructose-bisphosphate aldolase A | 66 | 38 | 11 | 8.3 | 39,851 |
| 43 | Q13347 | Eukaryotic
translation initiation factor 3 subunit 2 | 117 | 45 | 11 | 5.38 | 36,878 |
| 44 | P52907 | F-actin capping
protein subunit α-1 | 81 | 50 | 9 | 5.45 | 33,073 |
| 45 | Q99439 | Calponin-2 | 64a | 43 | 12 | 6.95 | 34,074 |
| 46 | Q96PM5 | RING finger and CHY
zinc finger domain-containing protein 1 | 64a | 28 | 6 | 6.26 | 31,743 |
| 47 | P31942 | Heterogeneous
nuclear ribonucleus protein H3 | 61a | 47 | 12 | 6.37 | 36,960 |
| 48 | Q5T0U0 | Coiled-coil
domain-containing protein 122 | 71a | 44 | 12 | 6.54 | 32,415 |
| 49 | Q8TBZ5 | Zinc finger protein
502 | 65a | 15 | 9 | 9.02 | 65,046 |
| 50 | P22626 | Heterogeneous
nuclear ribonucleoproteins A2/B1 | 64 | 35 | 12 | 8.97 | 37,464 |
| 51 | P09493 | Tropomyosin α-1
chain | 91 | 26 | 10 | 4.69 | 32,746 |
| 52 | Q15181 | Inorganic
pyrophosphatase | 103 | 50 | 9 | 5.54 | 33,095 |
| 53 | Q9HC38 | Glyoxalase
domain-containing protein 4 | 65a | 19 | 9 | 5.4 | 35,170 |
| 54 | P47756 | F-actin capping
protein subunit β | 72 | 32 | 10 | 5.36 | 31,331 |
| 55 | P09525 | Annexin A4 | 227 | 61 | 28 | 5.84 | 35,860 |
| 56 | P10768 | S-formylglutathione
hydrolase | 118a | 37 | 11 | 6.54 | 31,956 |
| 57 | P63244 | Guanine
nucleotide-binding protein subunit β-2-like 1 | 202 | 58 | 17 | 7.6 | 35,055 |
| 58 | P24534 | Elongation factor
1-β | 116 | 44 | 12 | 4.5 | 24,748 |
| 59 | P06753 | Tropomyosin α-3
chain | 230 | 58 | 23 | 4.75 | 29,015 |
| 60 | O00299 | Chloride
intracellular channel protein 1 | 207 | 64 | 14 | 5.09 | 26,906 |
| 61 | P07339 | Cathepsin D chain
B | 100a | 28 | 9 | 5.31 | 26,229 |
| 62 | Q13011 |
Delta(3,5)-Delta(2,4)-dienoyl-CoA
isomerase | 89 | 29 | 8 | 8.16 | 35,793 |
| 63 | P25786 | Proteasome subunit
α type-1 | 173 | 46 | 16 | 6.15 | 29,537 |
| 64 | Q8WUF0 | ω-amidase NIT2 | 131a | 40 | 9 | 6.82 | 30,561 |
| 65 | Q6P3U9 | 14-3-3 protein
ζ/δ | 115 | 36 | 15 | 4.73 | 27,899 |
| 66 | P04792 | Heat shock protein
β-1 | 133 | 51 | 11 | 5.98 | 22,826 |
| 67 | Q9NVS9 |
Pyridoxine-5′-phosphate oxidase | 95 | 43 | 9 | 6.62 | 29,969 |
| 68 | P30040 | Endoplasmic
reticulum resident protein 29 | 65 | 27 | 8 | 6.77 | 28,975 |
| 69 | P30041 |
Peroxiredoxin-6 | 114 | 39 | 11 | 6 | 25,133 |
| 70 | P60174 | Triosephosphate
isomerase | 183 | 63 | 15 | 6.45 | 26,938 |
| 71 | P18669 | Phosphoglycerate
mutase 1 | 130 | 60 | 14 | 6.67 | 28,900 |
| 72 | P00918 | Carbonic anhydrase
2 | 94 | 50 | 9 | 6.87 | 29,228 |
| 73 | Q15056 | Eukaryotic
translation initiation factor 4H | 89 | 35 | 8 | 6.67 | 27,368 |
| 74 | O15305 | Phosphomannomutase
2 | 70a | 25 | 10 | 6.35 | 28,406 |
| 75 | P17931 | Galectin-3 | 149a | 40 | 13 | 8.58 | 26,172 |
| 76 | Q9Y5U2 | Protein TSSC4 | 64a | 24 | 9 | 5.02 | 34,436 |
| 77 | Q04760 | Lactoylglutathione
lyase | 76 | 60 | 9 | 5.12 | 20,992 |
| 78 | P09211 | Glutathione
S-transferase P | 95 | 48 | 8 | 5.43 | 23,569 |
| 79 | P30048 |
Thioredoxin-dependent peroxide
reductase | 72 | 30 | 6 | 7.67 | 28,017 |
| 80 | Q9Y224 | UPF0568 protein
C14orf166 | 72 | 40 | 8 | 6.19 | 28,051 |
| 81 | P25787 | Proteasome subunit
α type-2 | 116 | 44 | 11 | 6.92 | 25,882 |
| 82 | Q92507 | ES1 protein
homolog, mitochondrial precursor | 111 | 65 | 12 | 8.5 | 28,153 |
| 83 | Q99714 | Hydroxyacyl-CoA
dehydrogenase type-2 | 60 | 22 | 6 | 7.66 | 27,134 |
| 84 | P30043 | Flavin reductase
(NADPH-dependent diaphorase) | 127 | 58 | 12 | 7.13 | 22,105 |
| 85 | O75947 | ATP synthase D
chain, mitochondrial | 77a | 65 | 11 | 5.21 | 18,537 |
| 86 | P07741 | Adenine
phosphoribosyltransferase | 68a | 32 | 6 | 5.78 | 19,595 |
| 87 | P30086 |
Phosphatidylethanolamine-binding protein
1 | 100a | 55 | 7 | 7.01 | 21,044 |
| 88 | Q06830 |
Peroxiredoxin-1 | 84 | 24 | 5 | 8.27 | 22,096 |
| 89 | P37802 | Transgelin-2 | 76 | 35 | 6 | 8.41 | 22,377 |
| 90 | P30626 | Sorcin | 72 | 49 | 11 | 5.32 | 21,947 |
| 91 | P00441 | Superoxide
dismutase [Cu-Zn] | 57 | 38 | 5 | 5.7 | 16,154 |
| 92 | Q86XQ2 | Nucleoside
diphosphate kinase A | 131 | 49 | 9 | 5.42 | 19,641 |
| 93 | P23284 | Peptidyl-prolyl
cis-trans isomerase B | 97 | 42 | 12 | 9.33 | 22,785 |
| 94 | P23528 | Cofilin-1 | 117 | 71 | 11 | 8.22 | 18,719 |
| 95 | P14550 | Alcohol
dehydrogenase [NADP+] fragment | 118 | 42 | 16 | 6.32 | 36,892 |
| 96 | P62937 | Peptidyl-prolyl
cis-trans isomerase A | 90 | 53 | 12 | 7.68 | 18,229 |
| 97 | P49773 | Histidine triad
nucleotide-binding protein 1 | 62 | 75 | 8 | 6.43 | 13,907 |
| 98 | P09382 | Galectin-1 | 109 | 47 | 7 | 5.34 | 15,048 |
| 99 | P60660 | Myosin light
polypeptide 6 | 68 | 47 | 10 | 4.56 | 17,090 |
In vitro evaluation of the immunogenic
property of the RCC85#21 cell line
The RCC85#21 clone immunogenicity was evaluated
after 35 days of MLTC stimulation, where autologous PBMCs were
co-cultured with irradiated RCC85#21 cells. After three weeks of
culture CD8+ T cells were isolated and restimulated for
two further weeks, in order to obtain and expand RCC-specific
CD8+ T cells. The degree of immunogenicity was evaluated
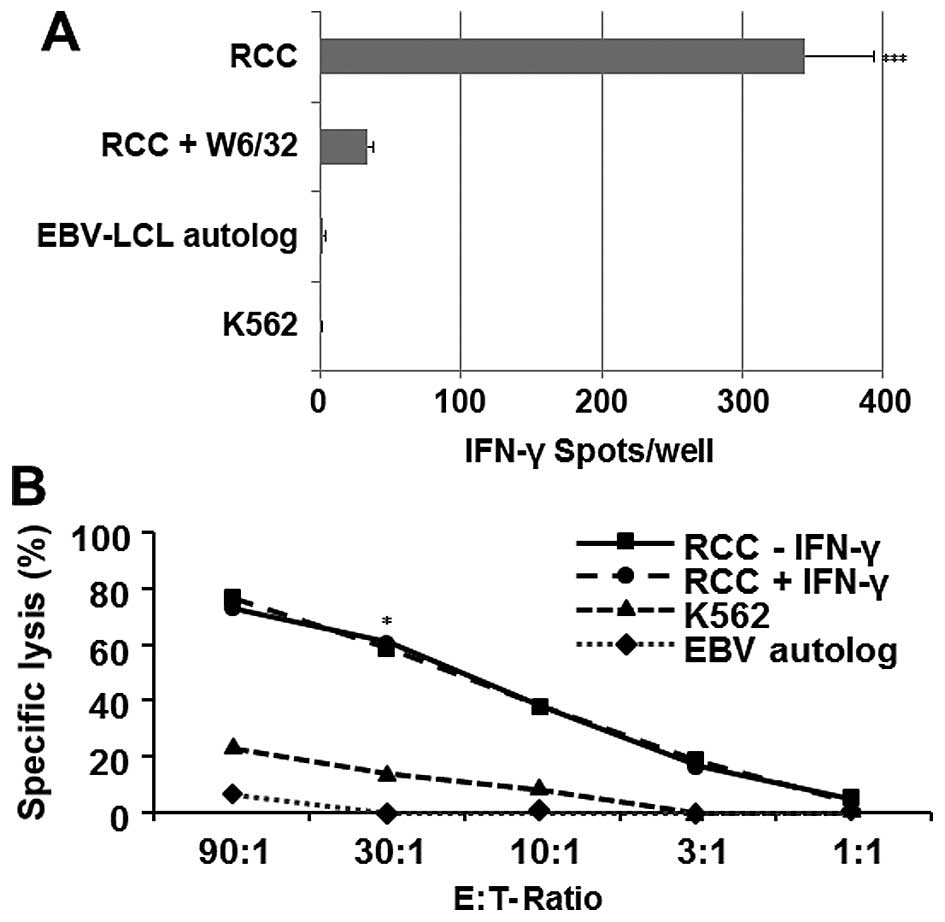
by testing the release of IFN-γ by responder CD8+ T
lymphocytes with the ELISPOT assay (Fig. 6A). CD8+ T cells isolated
from PBMC patient significantly displayed an elevated (HLA class
I-restricted) reactivity against RCC85#21, but they failed to react
against autologous EBV-LCL cells and the K562 target cell lines
(p<0.001). These CD8+ cytotoxic lymphocytes (CTL)
recognized the RCC85#21 cell line in a predominantly class
I-restricted manner, based on the ability of the anti-HLA class I
mAbs (W6–32) to inhibit responses by 91%. Analysis of cytotoxic
CD8+ T cell responses using 51Cr-release
assays similarly indicated that MLTC responder CD8+ T
cells efficiently lysed the RCC85#21 clone (60%, E/T ratio 30:1),
while the erythroid K562 line, used to assess non-specific
cytotoxicity, showed a low percentage of lysis (<20%, E/T ratio
30:1, p<0.03) (Fig. 6B).
Discussion
Immunogenicity is the principal aspect to be
considered in the isolation and characterization of cancer cells,
being this feature not always present in cancer cells cultivated
in vitro over the past 30 years. In this report, we describe
a new tumor cells clone derived from renal primary lesions of
ccRCC, that is capable of eliciting a tumor-specific T cell
response in vitro. We characterized the RCC85#21 clone
derived from a RCC patient with histological grade T3aN0M0. The
cell line was called Elthem, patented and properly licensed. This
cell line has a potential range of benefits in somatic therapy for
the treatment of patients affected by RCC. The RCC85#21 cell line,
obtained by limiting dilution, is a cell clone that is
morphologically similar to the tissue of origin, namely
multi-nucleated and polygonal cells with a characteristic cluster
growth. The RCC85#21 cell line showed a typical tumor cell
phenotype given its positivity for the characteristic tumor markers
of epithelial origin (cytokeratin CAM 5.2, mitochondrial markers,
vimentin, cytokeratin AE1/AE3, cytokeratin 19, EMA and Ki-67).
Following tumor cell expansion, antigenic characteristics of RCC
cell lines were studied and confirmed. We found that RCC85#21 lacks
the costimulatory molecules CD80 and CD86, suggesting that T cell
priming against the RCC85#21 cell line could be activated in the
absence of costimulation. Other groups have previously analysed the
capacity to induce CTL responses of B7.1 (CD80) or B7.2 (CD86) in
modified tumor cells (31). In
melanoma cell lines, B7 expression appeared to be necessary to
induce allogenic responses, whereas this was not found in the
RCC85#21 line. In fact, based on its immunogenic potential, the
RCC85#21 line was selected as a well-characterized human renal cell
carcinoma line that is capable of inducing autologous and allogenic
CD3+CD8+ tumor-associated responses by
MLTC.
In addition, the expression levels of some tumor
(RPSA/OFA and TERT) and inflammatory (CES1 and IL-6) biomarkers
were evaluated by real-time PCR to confirm the tumorigenic and
immunogenic capacity of the RCC85#21 cell line. The expression
levels of RPSA/OFA, TERT and IL-6 genes were significantly
upregulated in the RCC85#21 cell line as compared to HK2 and HeLa
cells, while CES1 gene expression was increased in RCC85#21 cell
line when compared with HK2 control cells, but decreased when
compared to HeLa tumor cells. These data confirmed the
tumorigenicity of the RCC85#21 cell line. MSI and LOH were also
evaluated, no differences being observed in MSI, while LOH was
identified at locus DP1 or D5S346 on chromosome 5q. LOH on 5q was
previously described in 7/42 (17%) sporadic RCC patients (26). The minimum region of deletion on 5q
to account for LOH was mapped to 5q31.1 (interferon regulatory
factor-1; IRF-1 locus), suggesting that LOH on 5q could play an
important role in the pathogenesis of RCC. However, recent data
have highlighted the low percentage of tumors showing LOH on 5q and
this seems to suggest that LOH does not occur sequentially but
independently (32). In this
study, the RCC85#21 cell proteome was characterized by 2DE combined
with mass spectrometry analysis (MALDI-TOF/MS). Among an overall
total of 250 protein spots, 119 spots were identified corresponding
to 99 different proteins (not redundant). Multiple spots on the gel
identified the same protein, suggesting that different isoforms for
the same protein were present, probably due to post-translational
protein modifications. In literature, several proteomic maps of
kidney tumor cell lines have been drawn (33–36),
but none for an immunogenic cell line. The results obtained in this
study show that several of the proteins identified have already
been described in the literature as characteristic of RCC proteins
(37,38). However, several others have still
to be defined. Protein analysis using NCBI and SWISS-PROT
functional annotation showed enrichment of many cancer-related
biological processes and pathways such as oxidative phosphorylation
and glycolysis pathways.
Functional analysis by IFN-γ-ELISPOT assay confirmed
that the RCC85#21 clone immunogenicity was able to induce high
CD8+ T cells reactivity in a predominantly class
I-restricted manner. The cytotoxicity tests showed that activated
CD8+ lymphocytes have a high capacity to lyse the
autologous cell line RCC85#21. In vitro experiments
demonstrated a high immunogenicity of the RCC85#21 clone, although
the tumor antigens expressed by renal cells have not yet been
identified.
The RCC85#21 cell line represents an immunogenic
cell line suitable for immune stimulation. The identification of
novel TAAs by the proteomic approach will allow the evaluation of
the immune response in vitro and, subsequently, in
vivo, paving the way for new immunotherapeutic strategies in
the RCC setting.
Acknowledgements
We thank Dr Grazia Bortone, Marta Centra and Roberto
D'Amore for their technical support and fruitful discussion. This
study was supported by Progetto Strategico Regione Puglia grant
(E.R., 2008), Ministero dell'Istruzione, dell'Università e della
Ricerca (MIUR) FIRB, CAROMICS grant (E.R., 2011).
Abbreviations:
|
RCC
|
renal cell carcinoma
|
|
TAAs
|
tumor associated antigens
|
|
MSI
|
microsatellite instability
|
|
LOH
|
loss of heterozygosity
|
|
2-DE
|
two-dimensional electrophoresis
|
|
MALDI/TOF
|
matrix absorption laser desorption
ionization/time of flight
|
|
MLTC
|
mixed lymphocytes tumor cell
cultures
|
References
|
1
|
Mydlo JH: Growth factors and renal cancer:
Characterization and therapeutic implications. World J Urol.
13:356–363. 1995. View Article : Google Scholar : PubMed/NCBI
|
|
2
|
Cohen HT and McGovern FJ: Renal-cell
carcinoma. N Engl J Med. 353:2477–2490. 2005. View Article : Google Scholar : PubMed/NCBI
|
|
3
|
Dutcher JP, Mourad WF and Ennis RD:
Integrating innovative therapeutic strategies into the management
of renal cell carcinoma. Oncology. 26:526–530.
5325342012.PubMed/NCBI
|
|
4
|
Shablak A, Hawkins RE, Rothwell DG and
Elkord E: T cell-based immunotherapy of metastatic renal cell
carcinoma: Modest success and future perspective. Clin Cancer Res.
15:6503–6510. 2009. View Article : Google Scholar : PubMed/NCBI
|
|
5
|
Pate PH, Chaganti RSK and Motzer RJ:
Target therapy for meta-static renal cell carcinoma. Br J Cancer.
94:914–919. 2006.
|
|
6
|
Singer EA, Gupta GN and Srinivasan R:
Update on targeted therapies for clear cell renal cell carcinoma.
Curr Opin Oncol. 23:283–289. 2011. View Article : Google Scholar : PubMed/NCBI
|
|
7
|
Finke J, Kierstead LS, Ranieri E and
Storkus WJ: Immunologic response to RCC. Renal Cell Carcinoma:
Molecular Biology, Immunology and Clinical Management. Bukowski RM
and Novick AC: Humana Press; pp. 39–62. 2000, View Article : Google Scholar
|
|
8
|
McDermott DF: Immunotherapy of metastatic
renal cell carcinoma. Cancer. 115(Suppl): 2298–2305. 2009.
View Article : Google Scholar : PubMed/NCBI
|
|
9
|
Fregni G, Perier A, Pittari G, Jacobelli
S, Sastre X, Gervois N, Allard M, Bercovici N, Avril MF and
Caignard A: Unique functional status of natural killer cells in
metastatic stage IV melanoma patients and its modulation by
chemotherapy. Clin Cancer Res. 17:2628–2637. 2011. View Article : Google Scholar : PubMed/NCBI
|
|
10
|
Ward DG, Cheng Y, N'Kontchou G, Thar TT,
Barget N, Wei W, Billingham LJ, Martin A, Beaugrand M and Johnson
PJ: Changes in the serum proteome associated with the development
of hepatocellular carcinoma in hepatitis C-related cirrhosis. Br J
Cancer. 94:287–292. 2006. View Article : Google Scholar : PubMed/NCBI
|
|
11
|
Adam BL, Qu Y, Davis JW, Ward MD, Clements
MA, Cazares LH, Semmes OJ, Schellhammer PF, Yasui Y, Feng Z, et al:
Serum protein fingerprinting coupled with a pattern-matching
algorithm distinguishes prostate cancer from benign prostate
hyperplasia and healthy men. Cancer Res. 62:3609–3614.
2002.PubMed/NCBI
|
|
12
|
Pawlik TM, Hawke DH, Liu Y, Krishnamurthy
S, Fritsche H, Hunt KK and Kuerer HM: Proteomic analysis of nipple
aspirate fluid from women with early-stage breast cancer using
isotope-coded affinity tags and tandem mass spectrometry reveals
differential expression of vitamin D binding protein. BMC Cancer.
6:682006. View Article : Google Scholar : PubMed/NCBI
|
|
13
|
Li J, Zhang Z, Rosenzweig J, Wang YY and
Chan DW: Proteomics and bioinformatics approaches for
identification of serum bio-markers to detect breast cancer. Clin
Chem. 48:1296–1304. 2002.PubMed/NCBI
|
|
14
|
Mueller J, von Eggeling F, Driesch D,
Schubert J, Melle C and Junker K: ProteinChip technology reveals
distinctive protein expression profiles in the urine of bladder
cancer patients. Eur Urol. 47:885–893; discussion 893–894. 2005.
View Article : Google Scholar : PubMed/NCBI
|
|
15
|
Chen YD, Zheng S, Yu JK and Hu X:
Artificial neural networks analysis of surface-enhanced laser
desorption/ionization mass spectra of serum protein pattern
distinguishes colorectal cancer from healthy population. Clin
Cancer Res. 10:8380–8385. 2004. View Article : Google Scholar : PubMed/NCBI
|
|
16
|
Poon TC, Sung JJ, Chow SM, Ng EK, Yu AC,
Chu ES, Hui AM and Leung WK: Diagnosis of gastric cancer by serum
proteomic fingerprinting. Gastroenterology. 130:1858–1864. 2006.
View Article : Google Scholar : PubMed/NCBI
|
|
17
|
Yang SY, Xiao XY, Zhang WG, Zhang LJ,
Zhang W, Zhou B, Chen G and He DC: Application of serum SELDI
proteomic patterns in diagnosis of lung cancer. BMC Cancer.
5:832005. View Article : Google Scholar : PubMed/NCBI
|
|
18
|
Zhang Z, Bast RC Jr, Yu Y, Li J, Sokoll
LJ, Rai AJ, Rosenzweig JM, Cameron B, Wang YY, Meng XY, et al:
Three biomarkers identified from serum proteomic analysis for the
detection of early stage ovarian cancer. Cancer Res. 64:5882–5890.
2004. View Article : Google Scholar : PubMed/NCBI
|
|
19
|
Raimondo F, Salemi C, Chinello C,
Fumagalli D, Morosi L, Rocco F, Ferrero S, Perego R, Bianchi C,
Sarto C, et al: Proteomic analysis in clear cell renal cell
carcinoma: Identification of differentially expressed protein by
2-D DIGE. Mol Biosyst. 8:1040–1051. 2012. View Article : Google Scholar : PubMed/NCBI
|
|
20
|
Valera VA, Li-Ning-T E, Walter BA, Roberts
DD, Linehan WM and Merino MJ: Protein expression profiling in the
spectrum of renal cell carcinomas. J Cancer. 1:184–196. 2010.
View Article : Google Scholar : PubMed/NCBI
|
|
21
|
Sun CY, Zang YC, San YX, Sun W and Zhang
L: Proteomic analysis of clear cell renal cell carcinoma.
Identification of potential tumor markers. Saudi Med J. 31:525–532.
2010.PubMed/NCBI
|
|
22
|
Fuhrman SA, Lasky LC and Limas C:
Prognostic significance of morphologic parameters in renal cell
carcinoma. Am J Surg Pathol. 6:655–663. 1982. View Article : Google Scholar : PubMed/NCBI
|
|
23
|
Kausche S, Wehler T, Schnürer E, Lennerz
V, Brenner W, Melchior S, Gröne M, Nonn M, Strand S, Meyer R, et
al: Superior antitumor in vitro responses of allogeneic matched
sibling compared with autologous patient CD8+ T cells.
Cancer Res. 66:11447–11454. 2006. View Article : Google Scholar : PubMed/NCBI
|
|
24
|
Boland CR, Thibodeau SN, Hamilton SR,
Sidransky D, Eshleman JR, Burt RW, Meltzer SJ, Rodriguez-Bigas MA,
Fodde R, Ranzani GN, et al: A National Cancer Institute Workshop on
Microsatellite Instability for cancer detection and familial
predisposition: Development of international criteria for the
determination of microsatellite instability in colorectal cancer.
Cancer Res. 58:5248–5257. 1998.PubMed/NCBI
|
|
25
|
Shevchenko A, Wilm M, Vorm O and Mann M:
Mass spectrometric sequencing of proteins silver-stained
polyacrylamide gels. Anal Chem. 68:850–858. 1996. View Article : Google Scholar : PubMed/NCBI
|
|
26
|
Sugimura J, Tamura G, Suzuki Y and Fujioka
T: Allelic loss on chromosomes 3p, 5q and 17p in renal cell
carcinomas. Pathol Int. 47:79–83. 1997. View Article : Google Scholar : PubMed/NCBI
|
|
27
|
Siu KW, DeSouza LV, Scorilas A, Romaschin
AD, Honey RJ, Stewart R, Pace K, Youssef Y, Chow TF and Yousef GM:
Differential protein expressions in renal cell carcinoma: New
biomarker discovery by mass spectrometry. J Proteome Res.
8:3797–3807. 2009. View Article : Google Scholar : PubMed/NCBI
|
|
28
|
Cohan CS, Welnhofer EA, Zhao L, Matsumura
F and Yamashiro S: Role of the actin bundling protein fascin in
growth cone morphogenesis: Localization in filopodia and
lamellipodia. Cell Motil Cytoskeleton. 48:109–120. 2001. View Article : Google Scholar : PubMed/NCBI
|
|
29
|
Sarto C, Marocchi A, Sanchez JC, Giannone
D, Frutiger S, Golaz O, Wilkins MR, Doro G, Cappellano F, Hughes G,
et al: Renal cell carcinoma and normal kidney protein expression.
Electrophoresis. 18:599–604. 1997. View Article : Google Scholar : PubMed/NCBI
|
|
30
|
Atkins D, Lichtenfels R and Seliger B:
Heat shock proteins in renal cell carcinomas. Contrib Nephrol.
148:35–56. 2005. View Article : Google Scholar : PubMed/NCBI
|
|
31
|
Oizumi S, Strbo N, Pahwa S, Deyev V and
Podack ER: Molecular and cellular requirements for enhanced antigen
cross-presentation to CD8 cytotoxic T lymphocytes. J Immunol.
179:2310–2317. 2007. View Article : Google Scholar : PubMed/NCBI
|
|
32
|
Chen M, Ye Y, Yang H, Tamboli P, Matin S,
Tannir NM, Wood CG, Gu J and Wu X: Genome-wide profiling of
chromosomal alterations in renal cell carcinoma using high-density
single nucleotide polymorphism arrays. Int J Cancer. 125:2342–2348.
2009. View Article : Google Scholar : PubMed/NCBI
|
|
33
|
Seliger B, Lichtenfels R and Kellner R:
Detection of renal cell carcinoma-associated markers via proteome-
and other ‘ome’-based analyses. Brief Funct Genomics Proteomics.
2:194–212. 2003. View Article : Google Scholar
|
|
34
|
Perego RA, Bianchi C, Corizzato M, Eroini
B, Torsello B, Valsecchi C, Di Fonzo A, Cordani N, Favini P,
Ferrero S, et al: Primary cell cultures arising from normal kidney
and renal cell carcinoma retain the proteomic profile of
corresponding tissues. J Proteome Res. 4:1503–1510. 2005.
View Article : Google Scholar : PubMed/NCBI
|
|
35
|
Craven RA, Stanley AJ, Hanrahan S, Dods J,
Unwin R, Totty N, Harnden P, Eardley I, Selby PJ and Banks RE:
Proteomic analysis of primary cell lines identifies protein changes
present in renal cell carcinoma. Proteomics. 6:2853–2864. 2006.
View Article : Google Scholar : PubMed/NCBI
|
|
36
|
Nakamura K, Yoshikawa K, Yamada Y, Saga S,
Aoki S, Taki T, Tobiume M, Shimazui T, Akaza H and Honda N:
Differential profiling analysis of proteins involved in
anti-proliferative effect of interferon-alpha on renal cell
carcinoma cell lines by protein biochip technology. Int J Oncol.
28:965–970. 2006.PubMed/NCBI
|
|
37
|
Hwa JS, Park HJ, Jung JH, Kam SC, Park HC,
Kim CW, Kang KR, Hyun JS and Chung KH: Identification of proteins
differentially expressed in the conventional renal cell carcinoma
by proteomic analysis. J Korean Med Sci. 20:450–455. 2005.
View Article : Google Scholar : PubMed/NCBI
|
|
38
|
Atrih A, Mudaliar MAV, Zakikhani P, Lamont
DJ, Huang JT-J, Bray SE, Barton G, Fleming S and Nabi G:
Quantitative proteomics in resected renal cancer tissue for
biomarker discovery and profiling. Br J Cancer. 110:1622–1633.
2014. View Article : Google Scholar : PubMed/NCBI
|