Introduction
PHLDA1 was identified as a gene involved in
Fas (CD95) expression and apoptosis induced after an anti-TCR
antibody binding to mouse T cell hybridoma cells (1). In humans the gene is located on the
long arm of the chromosome 12 [12q15 (2)] and encodes a 401 amino acid (aa)
protein (45 kDa) named pleckstrin-homology-like domain family A,
member 1 (PHLDA1, synonyms include: DT1P1B11, PHRIP,
‘proline-histidine rich protein’, TDAG51, based on www.genecards.org).
Several research groups have aimed to characterize
involvement of PHLDA1 in biology of cancer cells, including its
function in apoptosis. Thus, Neef et al measured levels of
mRNA of PHLDA1 in three sets of cell lines, derived from
paired samples of primary and metastatic melanoma tumors, and
reported that PHLDA1 was downregulated in the latter. PHLDA1
was detected by the authors in benign melanocytic nevi, and its
level was shown to decrease with progression of malignant
melanomas. Also, constitutive expression of the PHLDA1 protein in a
melanoma cell line Mel Rif has led to cell growth reduction along
with an increase in basal apoptosis and sensitivity to doxorubicin
and camptothecin (3). In 2006,
Hayashida et al showed that PHLDA1 is a heat shock
inducible gene regulated by HSF1 and when overexpressed in HeLa
cells has pro-apoptotic functions (4). In yet another report, Nagai et
al have reported that downregulation of PHLDA1 is a strong
predictor of poor outcome in patients with breast cancer (5). On the contrary, Coutinho-Camillo
et al reported that PHLDA1 and PAR-4 were associated with an
advanced clinical stage in oral squamous cell carcinomas (6). In some in vitro models, i.e.,
apoptosis induced by oxidative stress in mouse embryonic
fibroblasts and apoptosis induced with hydrogen sulfide in an oral
cancer cell line Ca9-22, the lack of PHLDA1 correlated with
activation of caspase-3, suggesting that the protein is a
suppressor of apoptosis (7,8).
Hence, it can be concluded that functions of PHLDA1 in regulation
of cancer cell fate are not yet definitely determined and should be
further investigated.
Examples of proteins interacting with PHLDA1 have
already been identified. Thus, HSP110, HSP70, HSP40 were shown to
directly bind to PHL domain of PHLDA1 (4). In a yeast two hybrid system three
proteins involved in regulation of translation, including RPL14,
were found to bind PHLDA1 (9). In
2011, Johnson et al have shown that the mitotic kinase
Aurora A, an oncoprotein overexpressed in the majority of breast
cancer tumors, and PHLDA1 associate regulating each other in
MDA-MB-231 breast cancer cells (10). In neuroblastoma, the most common
extra-cranial tumor of childhood, Aurora A (encoded by
AURKA) and MYCN are partners in driving the malignancy and
negative prognostic factors (11,12).
Importantly, this interaction provides an opportunity to target
high risk MYCN-amplified neuroblastoma tumors with Aurora A
inhibitors (13,14), as MYCN due to its function of a
transcription factor is viewed as ‘undruggable’ (15).
GD2 ganglioside is a marker of neuroblastoma,
involved in maintaining malignant phenotype of the tumor. Also, the
glycolipid is the target for Dinutuximab, a chimeric human/mouse
antibody (Unituxin™, ch14.18), approved in 2015 by FDA to treat
patients with high risk neuroblastoma (16). Previously, we have reported that
treatment of MYCN-amplified IMR-32 neuroblastoma cells with
the anti-GD2 ganglioside mouse monoclonal antibody 14G2a (mAb),
sharing a paratope with ch14.18, and a specific Aurora A inhibitor
MK-5108 increased expression of PHLDA1, when used alone or combined
together (17). Incubation of the
mAb with IMR-32 neuroblastoma cell line led to cell death with
involvement of apoptosis (17,18)
and this correlated with a decrease in the Aurora A protein level
and its activating phosphorylation, a decrease of the cytoplasmic
level of MYCN, and an increase in the p53 level (17).
Based on our prior findings, we aimed to further
study roles of PHLDA1 in our model. Thus, we set goals to silence
PHLDA1 expression in the cell line and investigated effects
of that on Aurora A and its direct or indirect targets (19), e.g., Akt, MYCN, p53, PARP, p21, p27
(among others). Pathways of molecular cross talk between apoptosis,
programmed necrosis, and mitochondrial autophagy (mitophagy)
signaling have recently been advanced by Dorn and Kitsis. They
postulate that these processes are ‘components of a unified and
integrated quality control mechanism’ (20). Encouraged by the aforementioned
accounts, we sought to determine how PHLDA1 is interlinked to both
apoptosis and autophagy pathways in our model.
Here, we report that IMR-32 cells with stable
downregulation of PHLDA1 showed enhanced cellular levels of ATP,
increased mitochondrial membrane potential (MMP), and were less
susceptible to apoptosis, as compared to control cells. Also, we
demonstrated that downregulation of PHLDA1 leads to a significant
increase in the expression of AURKA. Furthermore, we
measured increased phosphorylation of p-Aurora A (Thr288) and p-Akt
(Thr308), and lower levels of cleaved PARP and caspase-3 in the
cells. Additionally, we correlated expression of products of two
genes regulating cell cycle, i.e., CDKN1A and CDKN1B
and showed that mRNA of the CDKN1A gene and the p27 protein
are reduced in the PHLDA1-silenced settings. Next, profiles
of transcripts of some differentiation markers, related to
prognosis of neuroblastoma outcome such as NTRK1 (encoding
TRKA) and NTRK2 (encoding TRKB) were altered in our model.
Also the protein levels of TRKB were increased in the clones with
PHLDA1 downregulation. Our data show an inverse correlation of
expression of PHLDA1 and Aurora A in some cell lines and shed new
light on functions of PHLDA1 in neuroblastoma tumor cells,
suggesting a role as a pro-apoptotic protein. Also, our results
show possible links of the protein to regulation of features of
mitochondria and formation of autophagosomes.
Materials and methods
Cell culture and antibody
purification
The following cell lines were used: IMR-32 (ATTC,
Lomianki, Poland, CCL-127), LA-N-1 (ECACC, Sigma-Aldrich, Poznan,
Poland, 06041201), CHP-134 (ECACC, 06122002), LA-N-5 (ACC 673,
Leibniz-Institut DSMZ - Deutsche Sammlung von Mikroorganismen und
Zellkulturen GmbH, Braunschweig, Germany), Kelly (ACC 355, DSMZ),
SK-N-SH (ATTC, HTB-11), HTLA230 (kindly provided by Dr Lizzia
Raffaghello, Laboratory of Oncology, G. Gaslini Institute, Genova,
Italy). The hybridoma cell line producing the 14G2a mAb (IgG2a),
binding to GD2, was kindly provided by Dr R.A. Reisfeld (Scripps
Institute, La Jolla, CA, USA). Cells were cultured as described in
detail (17). The 14G2a mAb was
purified from FBS (fetal bovine serum) free cell culture
supernatant as described in detail (17).
Lentiviral transduction
IMR-32 (2.5×10⁵) cells were plated in 2
ml of complete medium in a 12-well plate, 24 h prior to viral
infection. On the day of infection media were replaced with 2 ml of
complete medium with Polybrene® (sc-134220, Santa Cruz
Biotechnology, Dallas, TX, USA) at the final concentration of 5
μg/ml. Next, cells were infected by adding 40 μl of the shRNA
Lentiviral Particles stock (sc-36631-V, Santa Cruz Biotechnology)
to the culture (for the PHLDA1 gene silencing) and 45 μl of
the shRNA Lentiviral Particles stock (sc-29731-V, Santa Cruz
Biotechnology) to the culture (for the AURKA gene
silencing). Additionally, for both PHLDA1 and AURKA
shRNA silencing one well with cells was transduced with Control
shRNA Lentiviral Particles (sc-108080, Santa Cruz Biotechnology)
and one well was used as non-transduced control cells. Finally,
separate wells with cells were also transduced with copGFP Control
Lentiviral Particles (sc-108084, Santa Cruz Biotechnology) for
measuring transduction efficiency. On the third day media were
replaced with 2 ml of complete medium (without Polybrene). On the
fourth day cells were split and to both PHLDA1- and
AURKA-silenced and mock cells, puromycin dihydrochloride
(sc-108071, Santa Cruz Biotechnology) was added to the fresh medium
to the concentration of 5 μg/ml. Medium was replaced with fresh
puromycin-containing medium every 3–4 days, until resistant
colonies were identified. Then these colonies were picked with
small pipette tips, expanded and assayed for effects of stable
shRNA expression by RT-qPCR and western blot analyses to derive
PHLDA1-stably silenced clones. To derive
AURKA-transiently silenced cell pools, cells were collected
4 days after adding puromycin dihydrochloride.
Flow cytometry analyses
The 14G2a mAb (IgG2a) was used to detect presence of
GD2 ganglioside on cell clones (WT, Mock1, S2, S4). The PK136 mAb
(IgG2a) was used as an isotype control (17). Binding of the antibodies were
detected using mouse Ig-specific FITC-conjugated goat
F(ab′)2 fragments (cat. no. 55526, Cappel, MP
Biomedicals, LLC, Warszawa, Poland), a detailed protocol can be
seen in ref. 17. Cell cycle
analyses were performed using the protocols for adherent cells
described in detail (21). For
mitochondrial potential analyses MitoTracker® Red CMXRos
was used (cat. no. M7512, Invitrogen, Warszawa, Poland) and the
staining protocol was optimized according to the manufacturer's
instructions. Briefly, cells (0.5×10⁶ cells per tube)
were incubated for 25 min at 37°C with 500 nM of the dye in
complete medium. Then, cells were washed once with medium with 2%
FBS and collected by centrifugation. Cells were resuspended in
medium with 2% FBS prior to analysis. To determine pools containing
mostly intact cells that were used for analyses of mitochondrial
membrane potential, first separate samples of cells stained with
propidium iodide were analyzed (17). Samples were run in duplicates. In
all experiments samples were analyzed using BD™ LSR II with BD
FACSDiva software (BD Biosciences, Warszawa, Poland).
Measurements of ATP levels in cell
cultures
Respective IMR-32 clones (5×10³) (WT,
Mock1, S1, S2, S4) were cultured for 6 days in 100 μl of complete
medium in a 96-well plate. Comparison of metabolic activity was
made between PHLDA1-silenced clones, mock and wild-type
cells at selected time-points (1–6 days) by measuring cellular ATP
contents using ATPlite - luminescence ATP detection assay system
(cat. no. 6016947, Perkin-Elmer, Warszawa, Poland) according to the
manufacturer's protocol. Studies were run in triplicates. Relative
ATP levels were calculated as follows: relative ATP level = ATP
level at specific time-point / ATP level at day 1. Samples were
analyzed using the Infinite M200 reader (TECAN, Männedorf,
Switzerland).
Measurements of levels of LDH and
activity of caspases-3 and -7 in cell cultures
Respective IMR-32 clones (5×10³) (WT,
Mock1, S2, S4) were cultured for 6 days in 150 μl of complete
medium in a 96-well plate (samples were analyzed in triplicates).
On days 1 and 6, 100 μl of culture supernatant was transferred to a
separate plate and LDH measurements were performed using
Cytotoxicity Detection kit (cat. no. 11644793001, Roche, Warszawa,
Poland) according to the manufacturer's protocol. Signals were
analyzed using Versa max microplate reader (Molecular Devices,
Sunnyvale, CA, USA). For measurements of activity of caspases-3 and
-7 remaining cell cultures were analyzed using
Caspase-Glo® 3/7 assay (cat. no. G8091, Promega,
Warszawa, Poland) according to the manufacturer's protocol. All
samples were analyzed in triplicates. Signals were analyzed using
the Infinite M200 reader.
Antibody and drug treatments
WT, Mock1, S1, S2, S4 clones were incubated with the
14G2a mAb (40 μg/ml) or PBS (control cells) for 1 h on ice. Next,
the cells were seeded on 96-well plates (2×10⁴ cells/100
μl/well), and incubated for 1–6 days, and then the ATP levels were
determined. To isolate proteins (whole cell extracts), cells were
cultured in 6-well plates (1×10⁶ cells in 5 ml of
culture medium for all the clones) and treated for 48 h with the
14G2a mAb or PBS. In some experiments Aurora A kinase inhibitor
(MK-5108, cat. no. S2770, Selleck, STI, Poznan, Poland) was used in
range of concentrations from 0.1 to 1 μM. Two dual PI3K/mTOR dual
inhibitors were also used. BEZ-235 (NVP-BEZ235, cat. no. S1009,
Selleck) was used in the range from 0.01 to 1 μM and LY294002
(#9901, Cell Signaling, Lab-JOT, Warszawa, Poland) was used in
concentrations from 0.1 to 30 μM. Inhibitors were added to cell
cultures for 72 h, and then ATP levels were determined. Control
cells were treated with equivalent volume of DMSO or water
(solvents for the inhibitors).
RNA isolation and quantitative RT-PCR
(RT-qPCR)
Samples of total RNA were isolated from cell clone
using TRI-Reagent® (cat. no. TR118, Lab Empire, Rzeszow,
Poland) as described in the manufacturer's protocol (Molecular
Research Center, Inc., Cincinnati, OH, USA) as can be seen in more
detail in ref. 17. Total RNA (2
μg) was used for reaction with reverse transcriptase (M-MLV reverse
transcriptase, cat. no. M1302, Sigma-Aldrich), using Oligo(dT) 20
Primer (cat. no. 1841802, Invitrogen). The Eco (Illumina) system
and KAPA SYBR FAST qPCR Master Mix (Kapa Biosystems, cat. no.
KK4602, Polgen, Lodz, Poland) were used for RT-qPCR (cDNA dilutions
were optimized within the range of 20–100 times). For normalization
of samples, the amount of cDNA of eukaryotic translation elongation
factor 2 (eEF-2) or ribosomal protein S13 (RPS13) were measured.
Unless otherwise stated, primers were designed using Primer-BLAST
(http://www.ncbi.nlm.nih.gov/tools/primer-blast/).
Following primers were used: PHLDA1 (F:
TGCCTGAAAGGGGCAGCTCC, R: TGATCTGGTGCGGGGCGGA) (17); AURKA (F:
GTCAAGTCCCCTGTCGGTTC, R: CGGTCCATGATGCCTCTAGC); MYCN (F:
ACCACAAGGCCCTCAGTACCT, R: GTGGTGACAGCCTTGGTGTTG) (22); CDKN1A (F:
CGATGGAACTTCGACTTTGTCA, R: GCACAAGGGTACAAGACAGTG, previously
described (23); CDKN1B (F:
GAAGCGACCTGCAACCGACGATT, R: CAGGCTTCTTGGGCGTCTGCTC) (24); ID1 (F:
TCAGCACCCTCAACGGCGAGAT, R: CCAGGTACCCGCAAGGATGGGA) (25); ID2 (F: TCAGCCTGCATCACCAGAGA,
R: CTGCAAGGACAGGATGCTGAT); NTRK1 [F: GGGCCTCTCCTTACAGGAAC,
R: CTGACTGCTCCAGCTCTGTG, previously described (26)]; NGF [F:
TCCGGACCCAATAACAGTTT, R: CAGTGTCAAGGGAATGCTGA, previously described
(26)]; NTRK2 [F:
GGGACACCACGAACAGAAGTA, R: ACCACAGCATAGACCGAGAGA, previously
described(27)];BDNF[F:TAACGGCGGCAGACAAAAAGA,
R: GAAGTATTGCTTCAGTTGGCCT, previously described (28)]; DKK3 [F:
ACAGCCACAGCCTGGTGTA, R: CCTCCATGAAGCTGCCAAC, previously described
(29)]; eEF-2 (F:
GACATCACCAAGGGTGTGCAG, R: TCAGCACACTGGCATAGAGGC) (30); RPS13 (F:
TCGGCTTTACCCTATCGACGCAG, R: ACGTACTTGTGCAACACCATGTGA) (31). Sample quantification was performed
in triplicates and results were analyzed using the ‘ΔΔCq’ relative
quantification method.
Protein extract isolation and
immunoblotting
Whole cell extracts were obtained according to the
TRI-Reagent method or using RIPA buffer (25 mM Tris-HCl pH 7.6, 150
mM NaCl, 1% sodium deoxycholate, 0.1% SDS) supplemented with Halt
Phosphatase Cocktail (cat. no. 1862495, Thermo Scientific,
Warszawa, Poland) and cOmplete (cat. no. 11697498001, Roche), and
the protein content in cell extracts was measured using BCA method
(32). Western blot analyses were
performed as previously described in detail (17). The first group of antibodies (Ab)
was from Cell Signaling Technology. Dilutions of all rabbit
monoclonal anti-human antibodies were 1:1,000 for: anti-Aurora A Ab
(#4718), anti-phospho-Aurora A
(Thr232)/AuroraB(Thr232)/AuroraC(Thr198)Ab(#2914), anti-phospho-Akt
(Thr308) Ab (#2965); anti-phospho-mTOR (Ser2448) Ab (#5536),
anti-cleaved caspase-3 Ab (#9664), anti-cleaved PARP Ab (#5625),
anti-LC3A/B Ab (#12741), anti-Atg7 Ab (#8558), anti-HSF-1 Ab
(#4356), anti-HSP40 Ab (#4871), anti-α-tubulin Ab (#2125), anti-p21
Ab (#2947), anti-p27 Ab (#2552), anti-p53 (#2527), anti-TRKB Ab
(#4603). The second group of antibodies was from Santa Cruz
Biotechnology (USA) and their dilutions were as follows: mouse
monoclonal anti-PHLDA1 Ab, sc-23866, (1:500); rabbit polyclonal
anti-MYCN Ab, sc-791 (1:1,000). Mouse anti-human GAPDH antibody,
G8795, was used in dilution 1:40,000 (Sigma-Aldrich). Following
HRP-conjugated antibodies were applied: goat anti-rabbit IgG
antibodies (Cell Signaling Technology), #7074 (1:2,000) or rabbit
anti-mouse IgG antibodies (Sigma-Aldrich), A-9044 (1:40,000).
Immunoreactive bands were visualized by the ECM reagent (enhanced
chemiluminescence method, Immobilon Western HRP Substrate, cat. no.
WBKLS05000, Millipore, Warszawa, Poland) according to the
manufacturer's protocol. Intensity of bands was quantified (Quest
Spot Cutter, Quantity One Analysis Software, Bio-Rad) after
detection of chemiluminescence with the MicroChemi system (DNR
Bio-Imagining Systems Ltd., Jerusalem, Israel). Glyceraldehyde
3-phosphate dehydrogenase (GAPDH) or α-tubulin were used as
reference proteins for normalization of signals of proteins of
interest in samples. In figures, levels of the protein expression
in control samples were set as 1.
Statistical analyses
Data shown on graphs are presented as means ± SEM (a
standard error of the mean). All experiments were repeated at least
three times. Series of pairwise tests (t-test), comparing, e.g., WT
clones with other clones, or means of control cells with treated
cells were applied to measure statistical significance [p-values:
p<0.05 (*), p<0.01 (**), p<0.001
(***)]. Statistical analyses were performed with the
Excel software (Microsoft, USA).
Results
Characterization of levels of PHLDA1 and
Aurora A in human neuroblastoma cell lines
We analyzed expression levels of PHLDA1, MYCN,
Aurora A in several MYCN-amplified neuroblastoma cell lines
i.e., Kelly, CHP-134, LA-N-1, LA-N-5, HTLA230, IMR-32 and in a
MYCN-non amplified SK-N-SH neuroblastoma cell line. For the
PHLDA1 gene, we observed by far the highest mRNA (Fig. 1A) and protein (Fig. 1B and G) expression levels in IMR-32
and SK-N-SH cells. Thus, for IMR-32 and SK-N-SH cells the mean mRNA
levels were 5.2 (±0.6) and 3.4 (±0.5) times statistically
significantly higher than in Kelly cells (set as control, equal to
1), respectively. For the protein levels, in IMR-32 and SK-N-SH
cells, the means were 7.9 (±4.7) and 11.3 (±5.5) times higher than
in Kelly, respectively. In other cell lines, i.e., CHP-134, LA-N-1,
LA-N-5, HTLA230, the mean expression levels ranged from 0.5 to 1.3
for mRNA of the PHLDA1 gene and from 1.0 to 4.9 for the
PHLDA1 protein, as compared to Kelly cells.
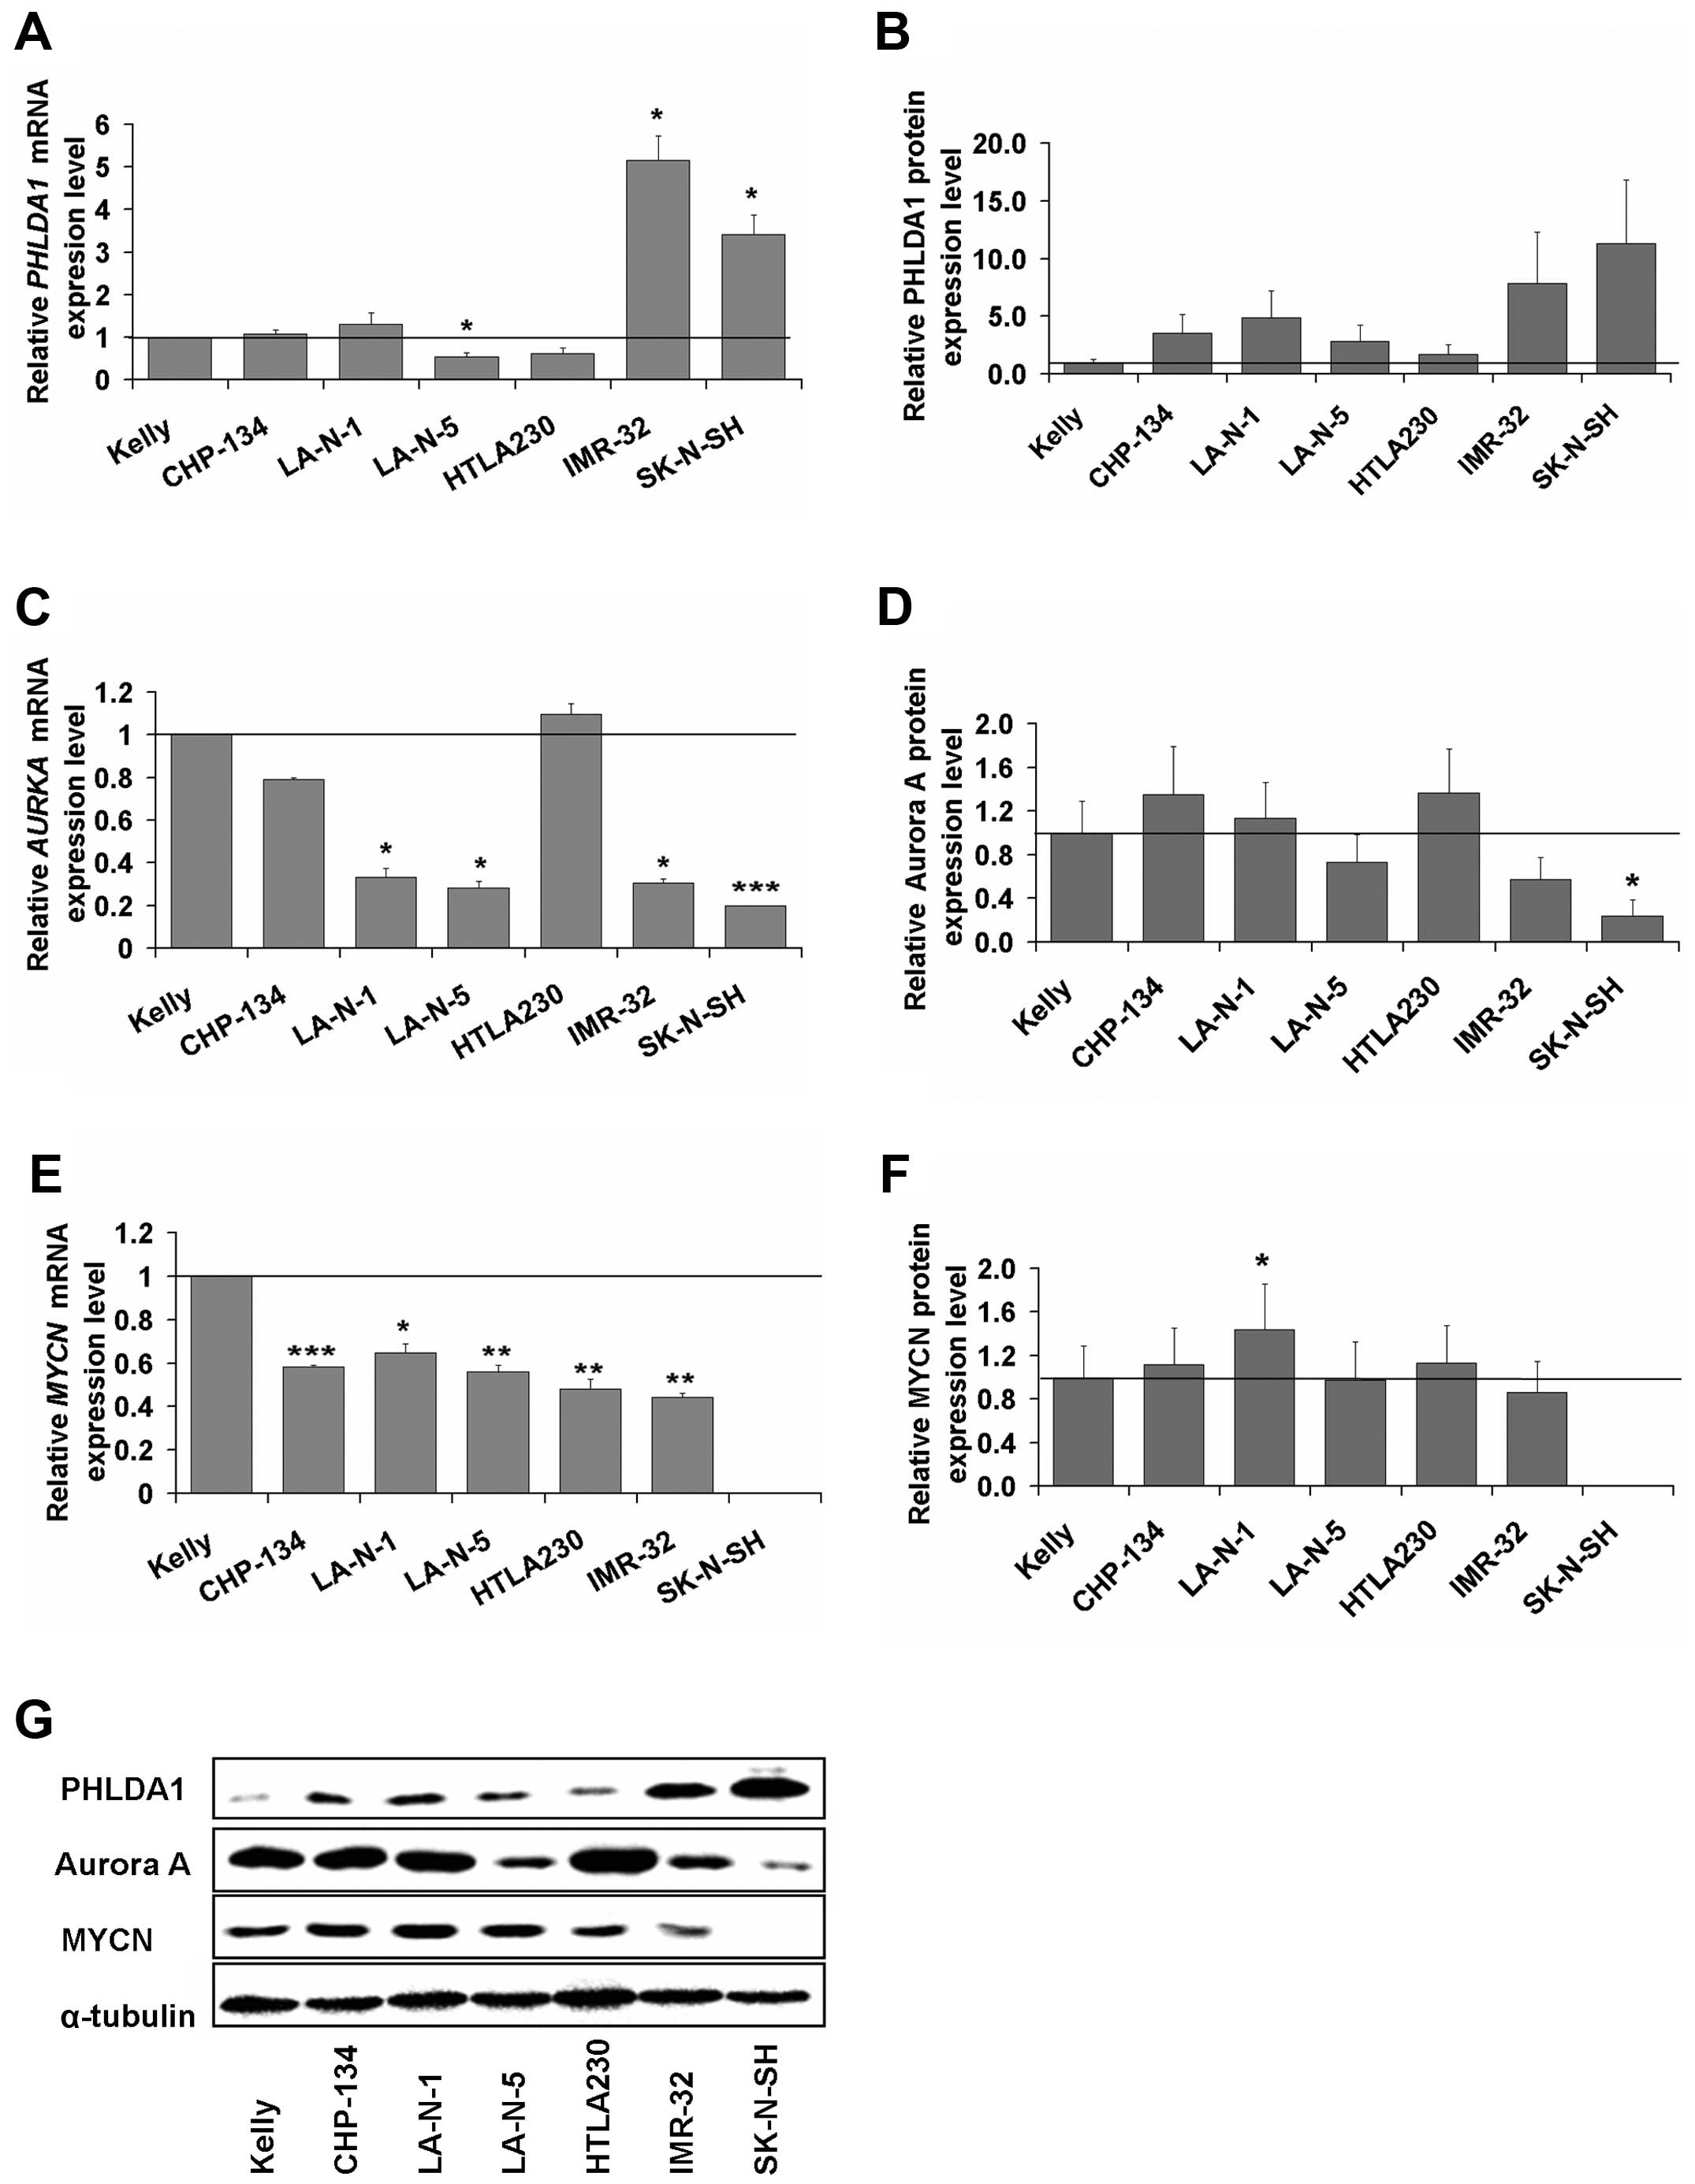 | Figure 1Levels of mRNA and protein of the
PHLDA1, AURKA and MYCN genes in neuroblastoma cell
lines. Levels of mRNA of PHLDA1 (A), AURKA (C) and
MYCN (E) were measured by RT-qPCR in the Kelly, CHP-134,
LA-N-1, LA-N-5, HTLA230, IMR-32 and SK-N-SH neuroblastoma cell
lines. RPS13 cDNA was used as the reference. Data are
presented as means of triplicates from three independent
experiments (± SEM). Expression of the PHLDA1 (B), Aurora A (D),
MYCN (F) proteins was measured by western blot analyses and
normalized to α-tubulin. The mRNA and protein levels of PHLDA1,
AURKA and MYCN in Kelly cells equals 1 (black baseline).
P-values for t-test were as follows: *p<0.05,
**p<0.01, ***p<0.001. Representative
immunoblotings for each protein were presented as a separate
section of the figure (G). |
Further, we examined possible correlations of
expression profiles of PHLDA1, AURKA and MYCN (mean
values are shown on Fig. 1). The
highest levels of mRNA of AURKA (Fig. 1C) were observed in Kelly, HTLA230
and CHP-134 cells and accompanied by low levels of mRNA of
PHLDA1. The opposite results were measured for IMR-32 and
SK-N-SH cells (Fig. 1A and C). For
cell lines such as LA-N-1, LA-N-5, IMR-32 and SK-N-SH, expression
of AURKA transcript was significantly lower i.e., 0.33
(±0.11), 0.28 (±0.03), 0.31 (±0.11), 0.20 (±0.02), respectively (as
compared to signal from the Kelly cells, set as 1). Aurora A
protein level (Fig. 1D and G) was
the highest in CHP-134 (1.35±0.25) and HTLA230 (1.36±0.10) cells.
Among all cell lines analyzed, the highest mRNA level of
MYCN (Fig. 1E) was observed
in Kelly cells (set as control, equal to 1), while in other cell
lines the expression was significantly lower (in the range from
0.44±0.02 to 0.65±0.04). However, levels of MYCN protein expression
(Fig. 1F and G) were comparable
for majority of neuroblastoma lines tested (ranged from 0.86±0.16
to 1.13±0.13), with exception of LA-N-1, for which significantly
increased expression (1.44±0.08) was noted. As reported in the
literature (33) for
MYCN-non amplified SK-N-SH cells, expression of MYCN
transcript and protein was not detected. Based on the above
results, we decided to generate IMR-32 clones with PHLDA1
downregulation to gather more data on functions of the protein in
our model of GD2-positive cells targeted with 14G2a mAb. Hence, GD2
negative SK-N-SH cells were not further investigated.
Silencing of PHLDA1 enhances ATP levels,
mitochondrial membrane potential and decreases activity of
caspases-3 and -7
Previously, we showed that PHLDA1 expression
is upregulated in IMR-32 neuroblastoma cells by treatment with the
14G2a mAb (17). Thus, we aimed to
verify roles of PHLDA1 in our model, as there is still controversy
regarding functions of the protein in cancer cells. To address the
issue, we decided to silence PHLDA1 expression in
MYCN-amplified IMR-32 cells and verify effects of that on
phenotype of the cell line. Although the PHLDA1 gene
expression was not completely abolished, a significant decrease of
PHLDA1 expression was observed both on mRNA and protein
levels in selected clones as compared to control (Mock1 and Mock2)
and non-transduced cells (wild-type, WT, set here as control, equal
to 1) (Fig. 2A and B). The
expression of mRNA of PHLDA1 was measured for S1, S2, S3, S4
clones and determined as 0.23 (±0.1), 0.16 (±0.1), 0.28 (±0.08),
0.12 (±0.06), respectively (p<0.01). Also, a significant
decrease in PHLDA1 protein expression was noted for S1, S2, S4
clones (used for further experiments) as compared to Mock1 and
non-transduced cells.
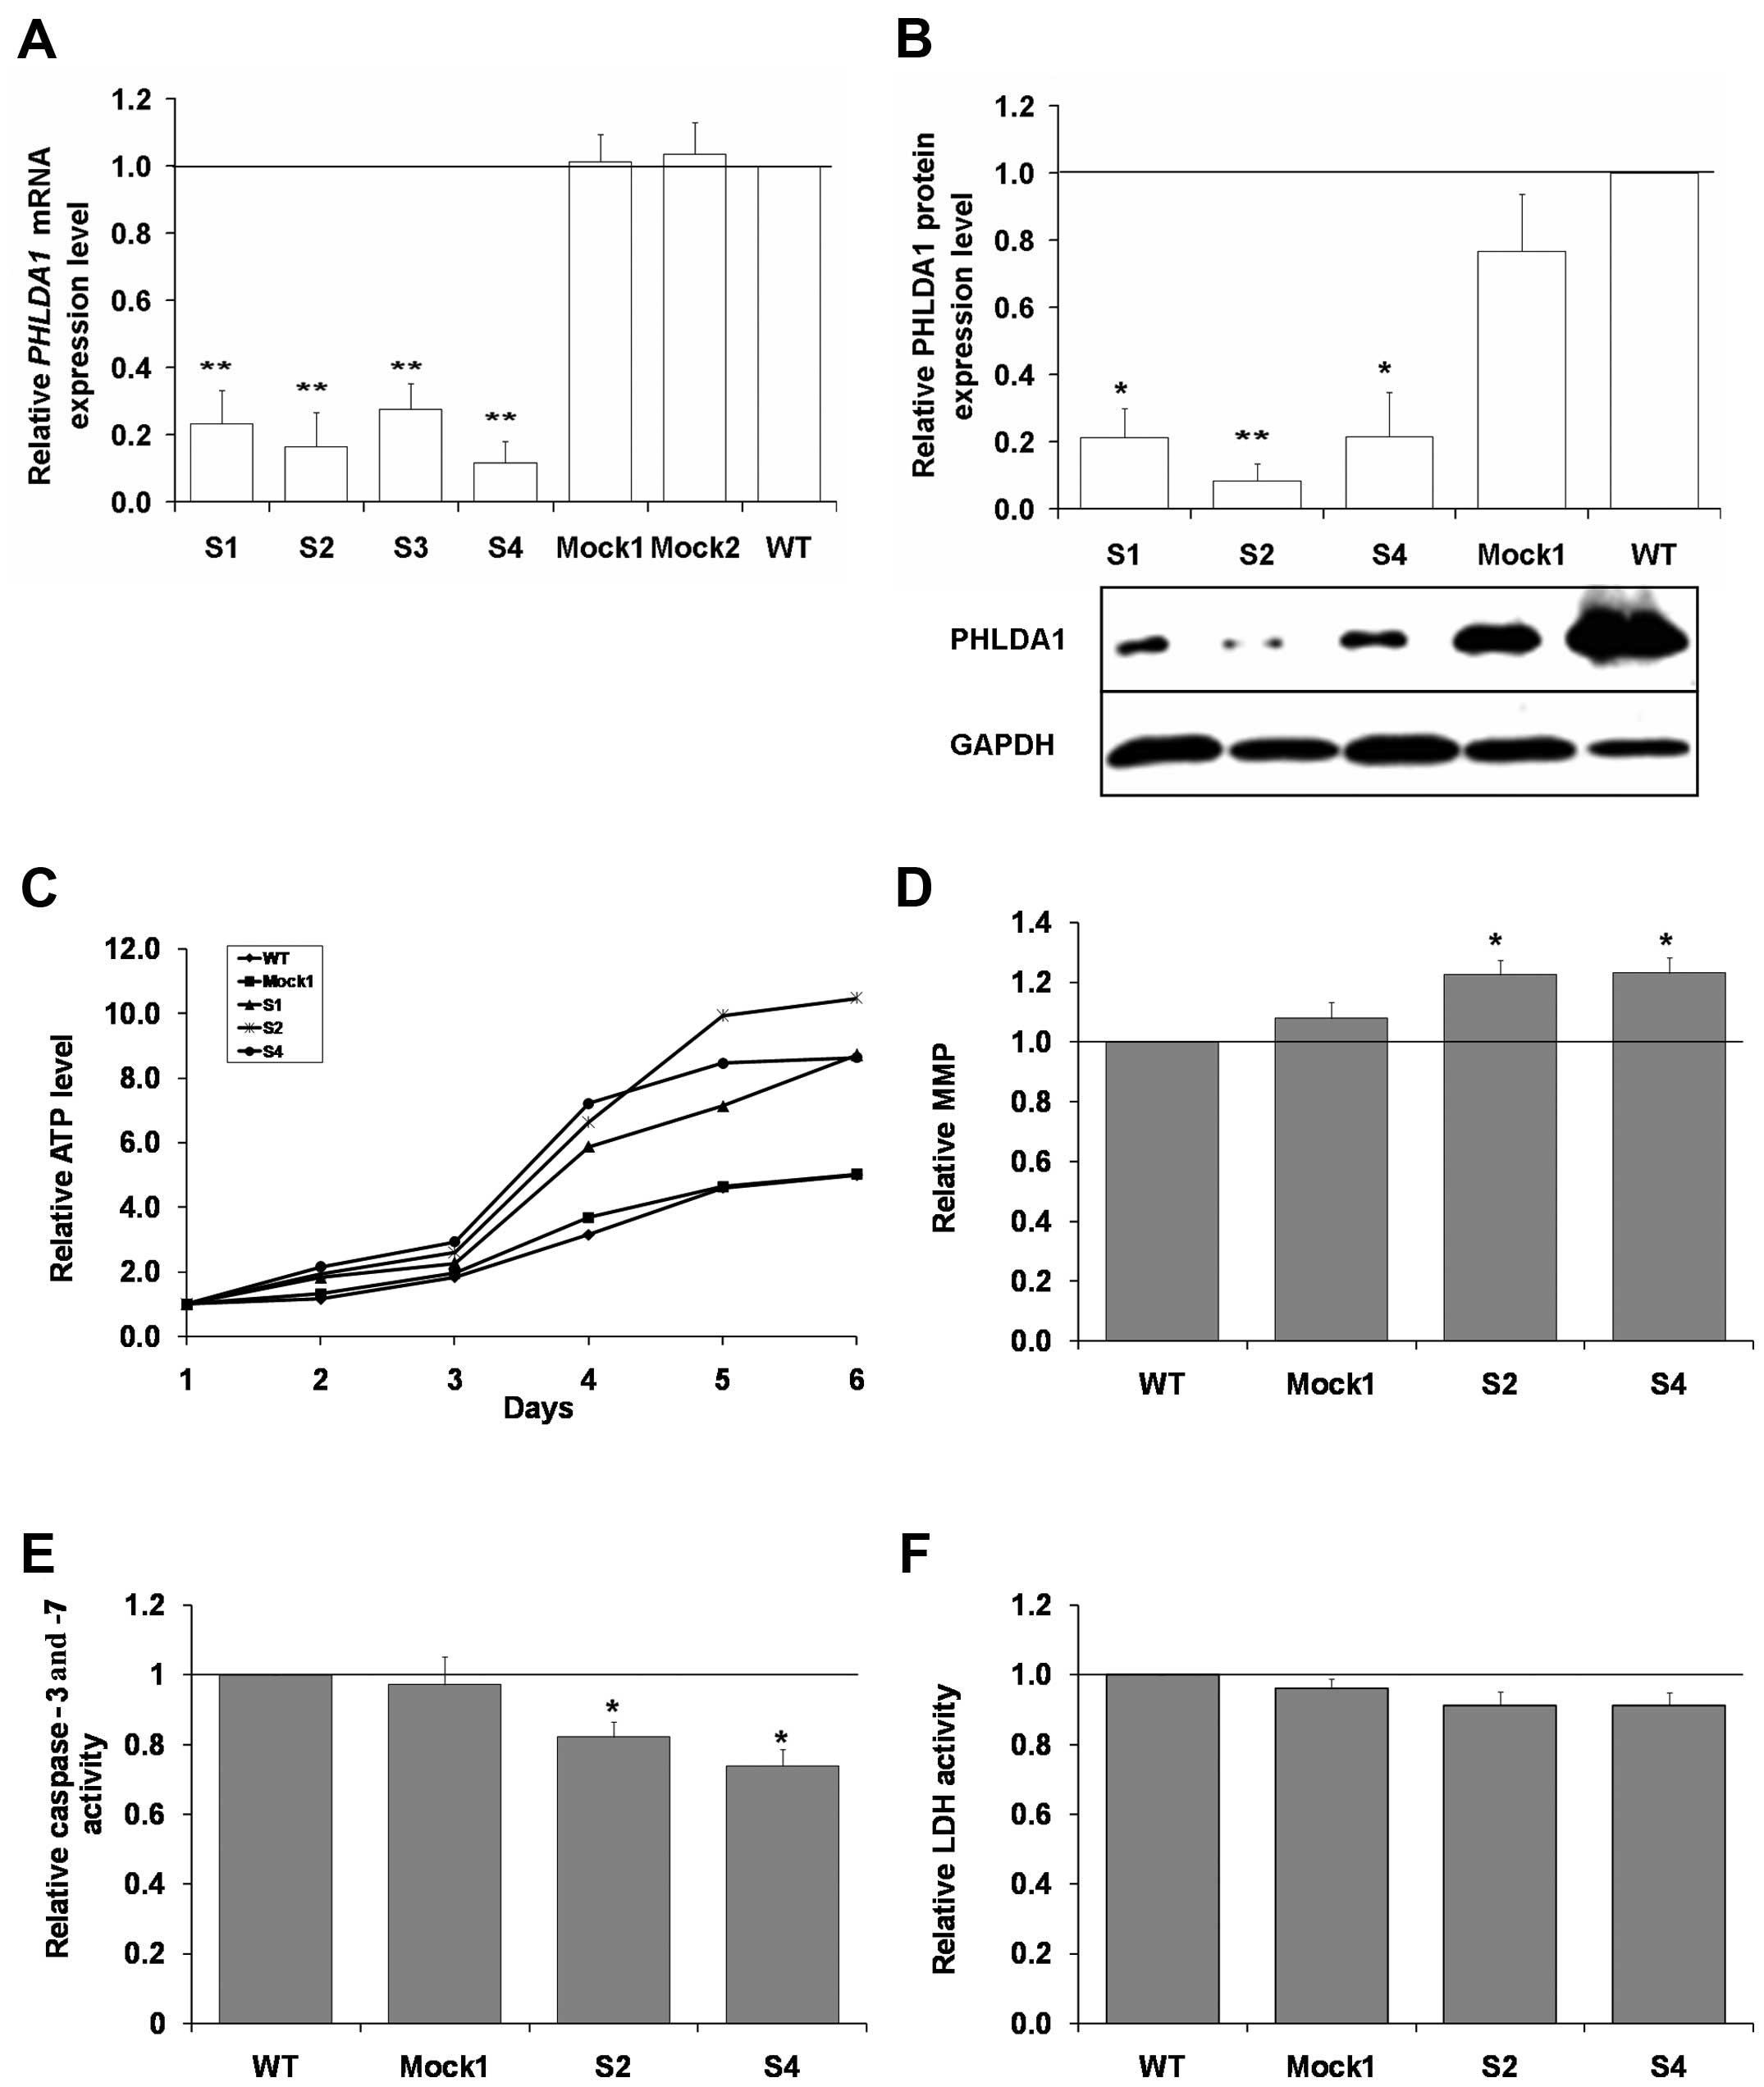 | Figure 2Characterization of clones of IMR-32
with stable silencing of PHLDA1 (S1–4), Mock1, Mock2, and WT
cells. (A) mRNA levels of PHLDA1 were measured by RT-qPCR in
PHLDA1-silenced (S1, S2, S3, S4), Mock1, Mock2, and WT cells
at 24 h after seeding of cells. eEF-2 cDNA was used as the
reference. mRNA of PHLDA1 in WT cells equals 1. Data are
presented as means of triplicates from three independent
experiments (± SEM) and calculated versus control values for WT
cells, set as 1 (black baseline). (B) The PHLDA1 protein expression
was measured at 48 h after seeding of cells in
PHLDA1-silenced (S1, S2, S4), Mock1 and WT cells at 48 h and
normalized to GAPDH. Below the chart a representative immunoblot is
presented. (C) Relative cellular ATP level was analyzed in
PHLDA1-silenced (S1, S2, S4), Mock1 and WT cells. The y-axis
shows the relative ATP level calculated as luminescent signal at
specific time-point/luminescent signal at day 1. Standard errors of
the mean bars were omitted from the graph for clarity, but were
<0.9 for all data points. (D) Levels of mitochondrial membrane
potential (MMP) were measured using flow cytometry to detect
accumulation of the MitoTracker Red CMXRos dye. Samples were run in
duplicates. Relative activities of caspase-3 and -7 (E), LDH (F)
were analyzed in PHLDA1-silenced (S2, S4), Mock1 and WT
cells and calculated as caspase-3/7 or LDH activity at specific
time-point/caspase-3 and -7 or LDH activity at day 1. Means of
three independent experiments (± SEM) are calculated versus control
values for WT cells, set as 1 (black baseline). P-values for t-test
were as follows: *p<0.05, **p<0.01. |
Next, we aimed to characterize behavior of clones
with PHLDA1 downregulation in cell culture. We compared metabolic
activity of S1, S2, S4 clones to control Mock1 and WT cells by
measuring ATP levels in the cultured cells for up to 6 days
(Fig. 2C). From the experiments,
we concluded that from day 4 of culture a clearly visible increase
in ATP levels can be measured for all three clones with a decreased
expression of PHLDA1 (p<0.05 for the S2 clone for the days 1–6;
and for the S4 and S1 clones, the days 4–6, as compared to
wild-type cells). By flow cytometry, we could not correlate the
higher ATP levels in cell cultures of the clones S2 and S4 with
increased cell proliferation (Table
I). On the contrary, for S2 and S4 clones, we measured slightly
higher (ca., 8–9%, p<0.05) percentage of cells in G0/G1 phase
for the clones with down-regulation of PHLDA1 and lower number of
cells in S and G2/M phases, as compared to WT cells. Interestingly,
we also measured lower numbers of apoptotic cells in the S2 and S4
cells. Such findings prompted us to analyze MMP, activity of
apoptosis-executing caspase-3 and -7 in cells, and levels of LDH
released to culture media (Fig.
2D–F). We measured ca. 20% higher intensity of fluorescence due
to accumulation of the dye MitoTracker Red CMXRos (p<0.05),
which was used for analysis of mitochondrial membrane potential in
the cells with partial PHLDA1 silencing, as compared to WT
cells (set as 1). Also, we report that the clones S2 and S4 showed
lower activity of the caspases (on the day 6 of culture,
p<0.05). LDH leakage was slightly and insignificantly decreased
in the S2 and S4 clones. To summarize, downregulation of PHLDA1 in
IMR-32 cells can be linked to firm changes in cell phenotypes and
to some extent explain the higher ATP levels measured for the S2
and S4 clones.
 | Table IFlow cytometry analysis of DNA
content in IMR-32 clones with downregulation of PHLDA1 (S2, S4) and
WT and Mock1 clones.a |
Table I
Flow cytometry analysis of DNA
content in IMR-32 clones with downregulation of PHLDA1 (S2, S4) and
WT and Mock1 clones.a
| WT | Mock1 | S2 | S4 |
|---|
| Apoptotic | 4.6 | 4.5 | 2.5 | 2.3 |
| G0/G1 | 64.9 | 64.8 | 70.0 | 69.6 |
| S | 17.7 | 18.0 | 16.2 | 16.3 |
| G2/M | 13.5 | 13.5 | 12.3 | 12.8 |
Characterization of expression of
selected genes involved in neuroblastoma cell fate
Aurora A is an important oncogenic driver
overexpressed in majority of high risk neuroblastomas (34). In MDA-MB-231 breast cancer cells,
Aurora A is a partner of PHLDA1 and more importantly both proteins
are engaged in mutual regulation (10). Additionally, among several
substrates, Aurora A complexes MYCN and stabilizes the
transcription factor by preventing it from Fbxw7-driven proteasomal
degradation (11). Hence, we
decided to analyze the expression of the AURKA and
MYCN genes in PHLDA1-silenced clones: S2 and S4
(Fig. 3A). We observed that in the
PHLDA1-silenced clones, expression of mRNA of AURKA
was statistically significantly induced to 1.33±0.01 in S2 and to
1.48±0.03 in S4, as compared to non-transduced cells (set as 1).
Moreover, we measured a statistically meaningful increase in Aurora
A levels in the clones S2 and S4 (Fig.
3B, p<0.05). However, MYCN expression was unchanged
in the clone S2 and increased ca. 20% in the clone S4 (but without
statistical significance) (Fig.
3A). This further prompted us to check the effect of silencing
of Aurora A on expression of its two partners, i.e., PHLDA1 and
MYCN. As AURKA expression is crucial for cell mitosis, we
were unable to select single clones of IMR-32 cells with the gene
knockout, due to their poor proliferation (data not shown).
However, in pools of IMR-32 cells, collected 4 days after
lentiviral transduction, there was a statistically significant
decrease in both mRNA and protein levels of AURKA, along
with a meaningful increase in levels of mRNA and protein of
PHLDA1 and a decrease of mRNA and protein of MYCN
(Fig. 3C–E). Also, as previously
reported by others (11), we can
confirm that in AURKA-knockout experiments, the MYCN level
was decreased along with silencing of expression of
AURKA.
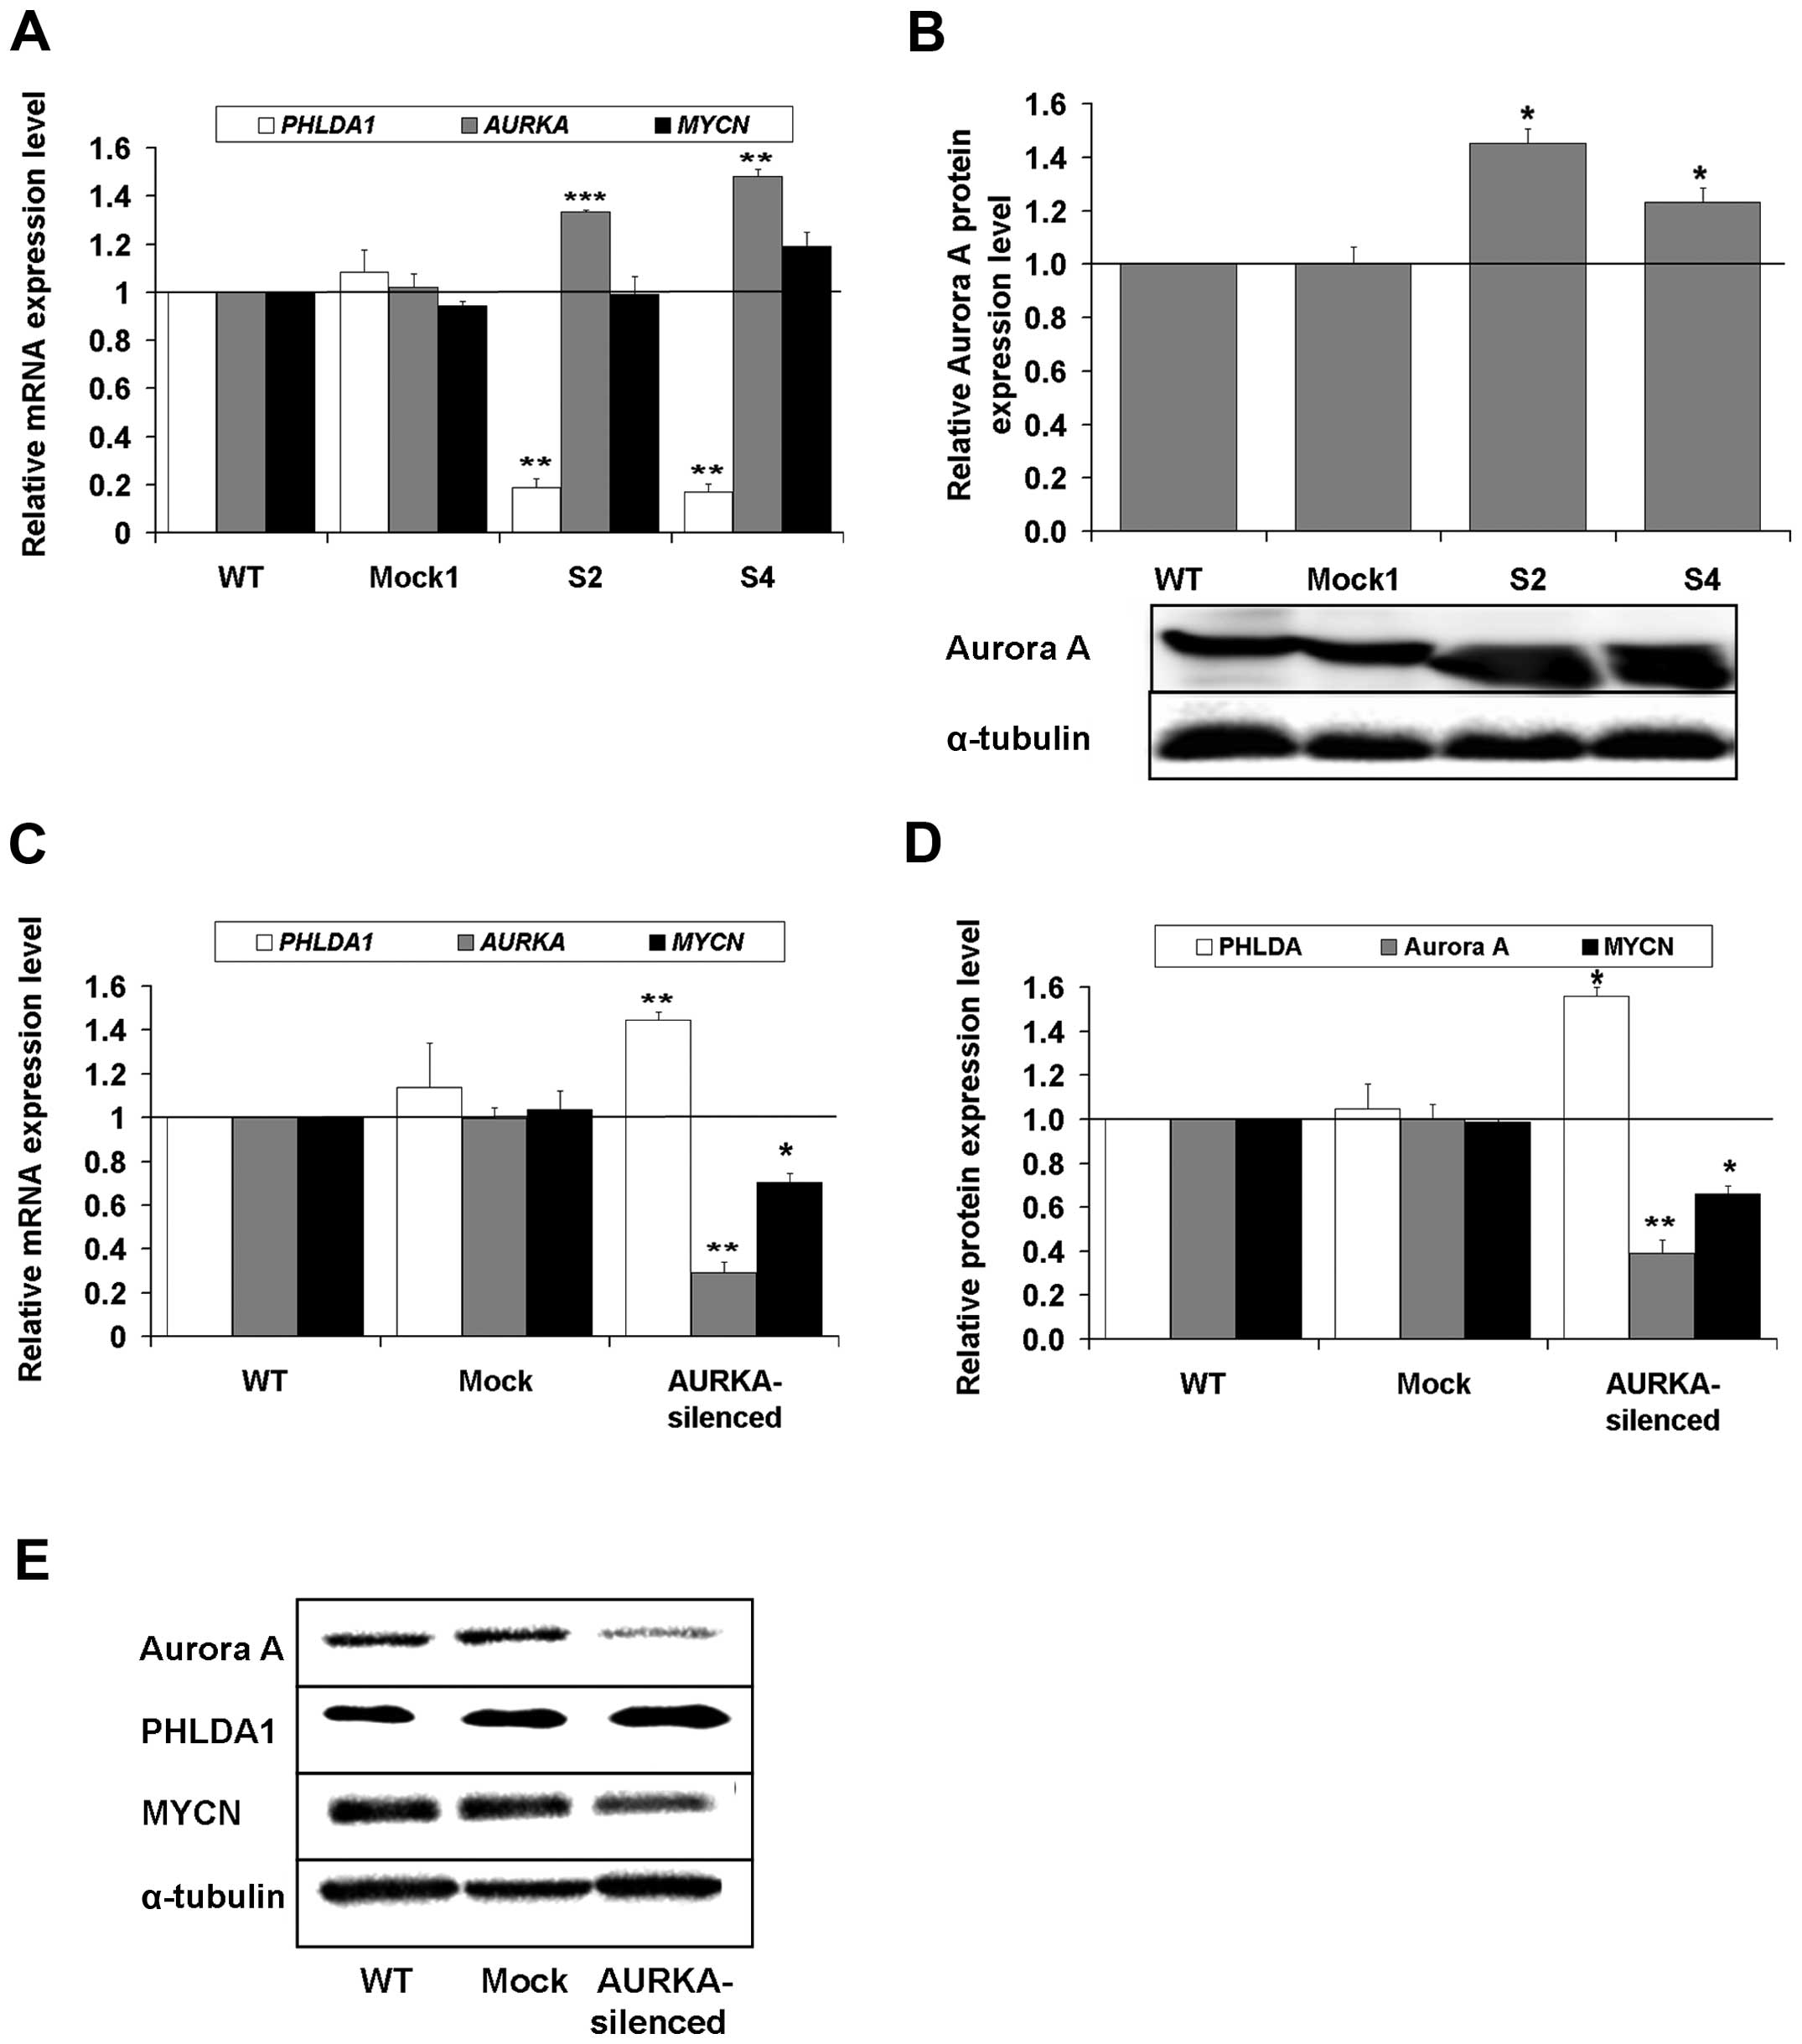 | Figure 3The expression of mRNA and protein of
the PHLDA1, AURKA and MYCN genes in
PHLDA1-stably silenced, Mock1 and WT IMR-32 cells and in
AURKA-transiently silenced, Mock and WT IMR-32 cells. (A)
mRNA levels of PHLDA1, AURKA and MYCN were measured
by RT-qPCR in PHLDA1-silenced, Mock1 and WT cells.
RPS13 cDNA was used as the reference. (B) Aurora A protein
expression was measured in PHLDA1-silenced (S2, S4), Mock1
and WT cells at 48 h after seeding and normalized to α-tubulin.
Below the chart a representative immunoblot is presented. (C) mRNA
levels of PHLDA1, AURKA and MYCN were measured in
AURKA-silenced, Mock and WT cells. eEF-2 cDNA was
used as the reference. AURKA, MYCN and PHLDA1
expression in wild-type cells equals 1 (black baseline). (D)
Expression levels of the Aurora A, PHLDA1 and MYCN proteins were
measured by western blot analysis and normalized to α-tubulin. Data
are presented as means of triplicates from three independent
experiments (± SEM). P-values for t-test were as follows:
*p<0.05, **p<0.01,
***p<0.001. (E) Representative immunoblots are
presented as a separate section of the figure. |
We extended the above findings with analyses by
RT-qPCR of mRNA levels of genes important for cell cycle and
differentiation, such as CDKN1A (encoding for p21),
CDKN1B (encoding for p27), ID1, ID2, NTRK1 (encoding
TRKA), NTRK2 (encoding TRKB), BDNF (encoding one of the two
main ligands of TRKB), NGF (encoding the main ligand of
TRKA) and DKK3 in PHLDA1-silenced clones (as compared to
controls, set as 1) (Fig. 4). The
transcript of CDKN1A was decreased, but no changes for the
transcript of CDKN1B were observed (Fig. 4A and B). We report meaningfully
significant decrease of ID1 (for S2 and S4, p<0.01) and
ID2 expression (for S4, p<0.05). An inverse correlation
between transcripts of NTRK1 and NGF was measured.
Thus, expression of NTRK1 was decreased ca. 4-fold
(p<0.05) and expression of NGF was increased ca. 2-fold
(p<0.05). Also, expression of NTRK2 was advanced ca.
2-fold (p<0.01), while expression of one of the genes encoding
for its ligand, BDNF, was only slightly increased. The
transcript of DKK3 was not statistically significantly
affected (Fig. 4C). Finally, we
measured a statistically meaningful increase in TRKB levels in the
clones S2 and S4 (Fig. 4D,
p<0.05). The data show that PHLDA1 downregulation affects
transcripts of some of the aforementioned genes involved in cell
cycle and differentiation. Also, levels of TRKB were raised in the
clones with PHLDA1-downregulation. Levels of p21 and p27 were
investigated in the clones S2, S4, Mock1 and WT in both 14G2a
mAb-treated and untreated cells (as can be seen in more detail in
‘PHLDA1 downregulation affects apoptosis- and autophagy-related
proteins in IMR-32 cells’ and in Fig. 8A and B). However, to draw further
conclusions levels of remaining proteins should be
investigated.
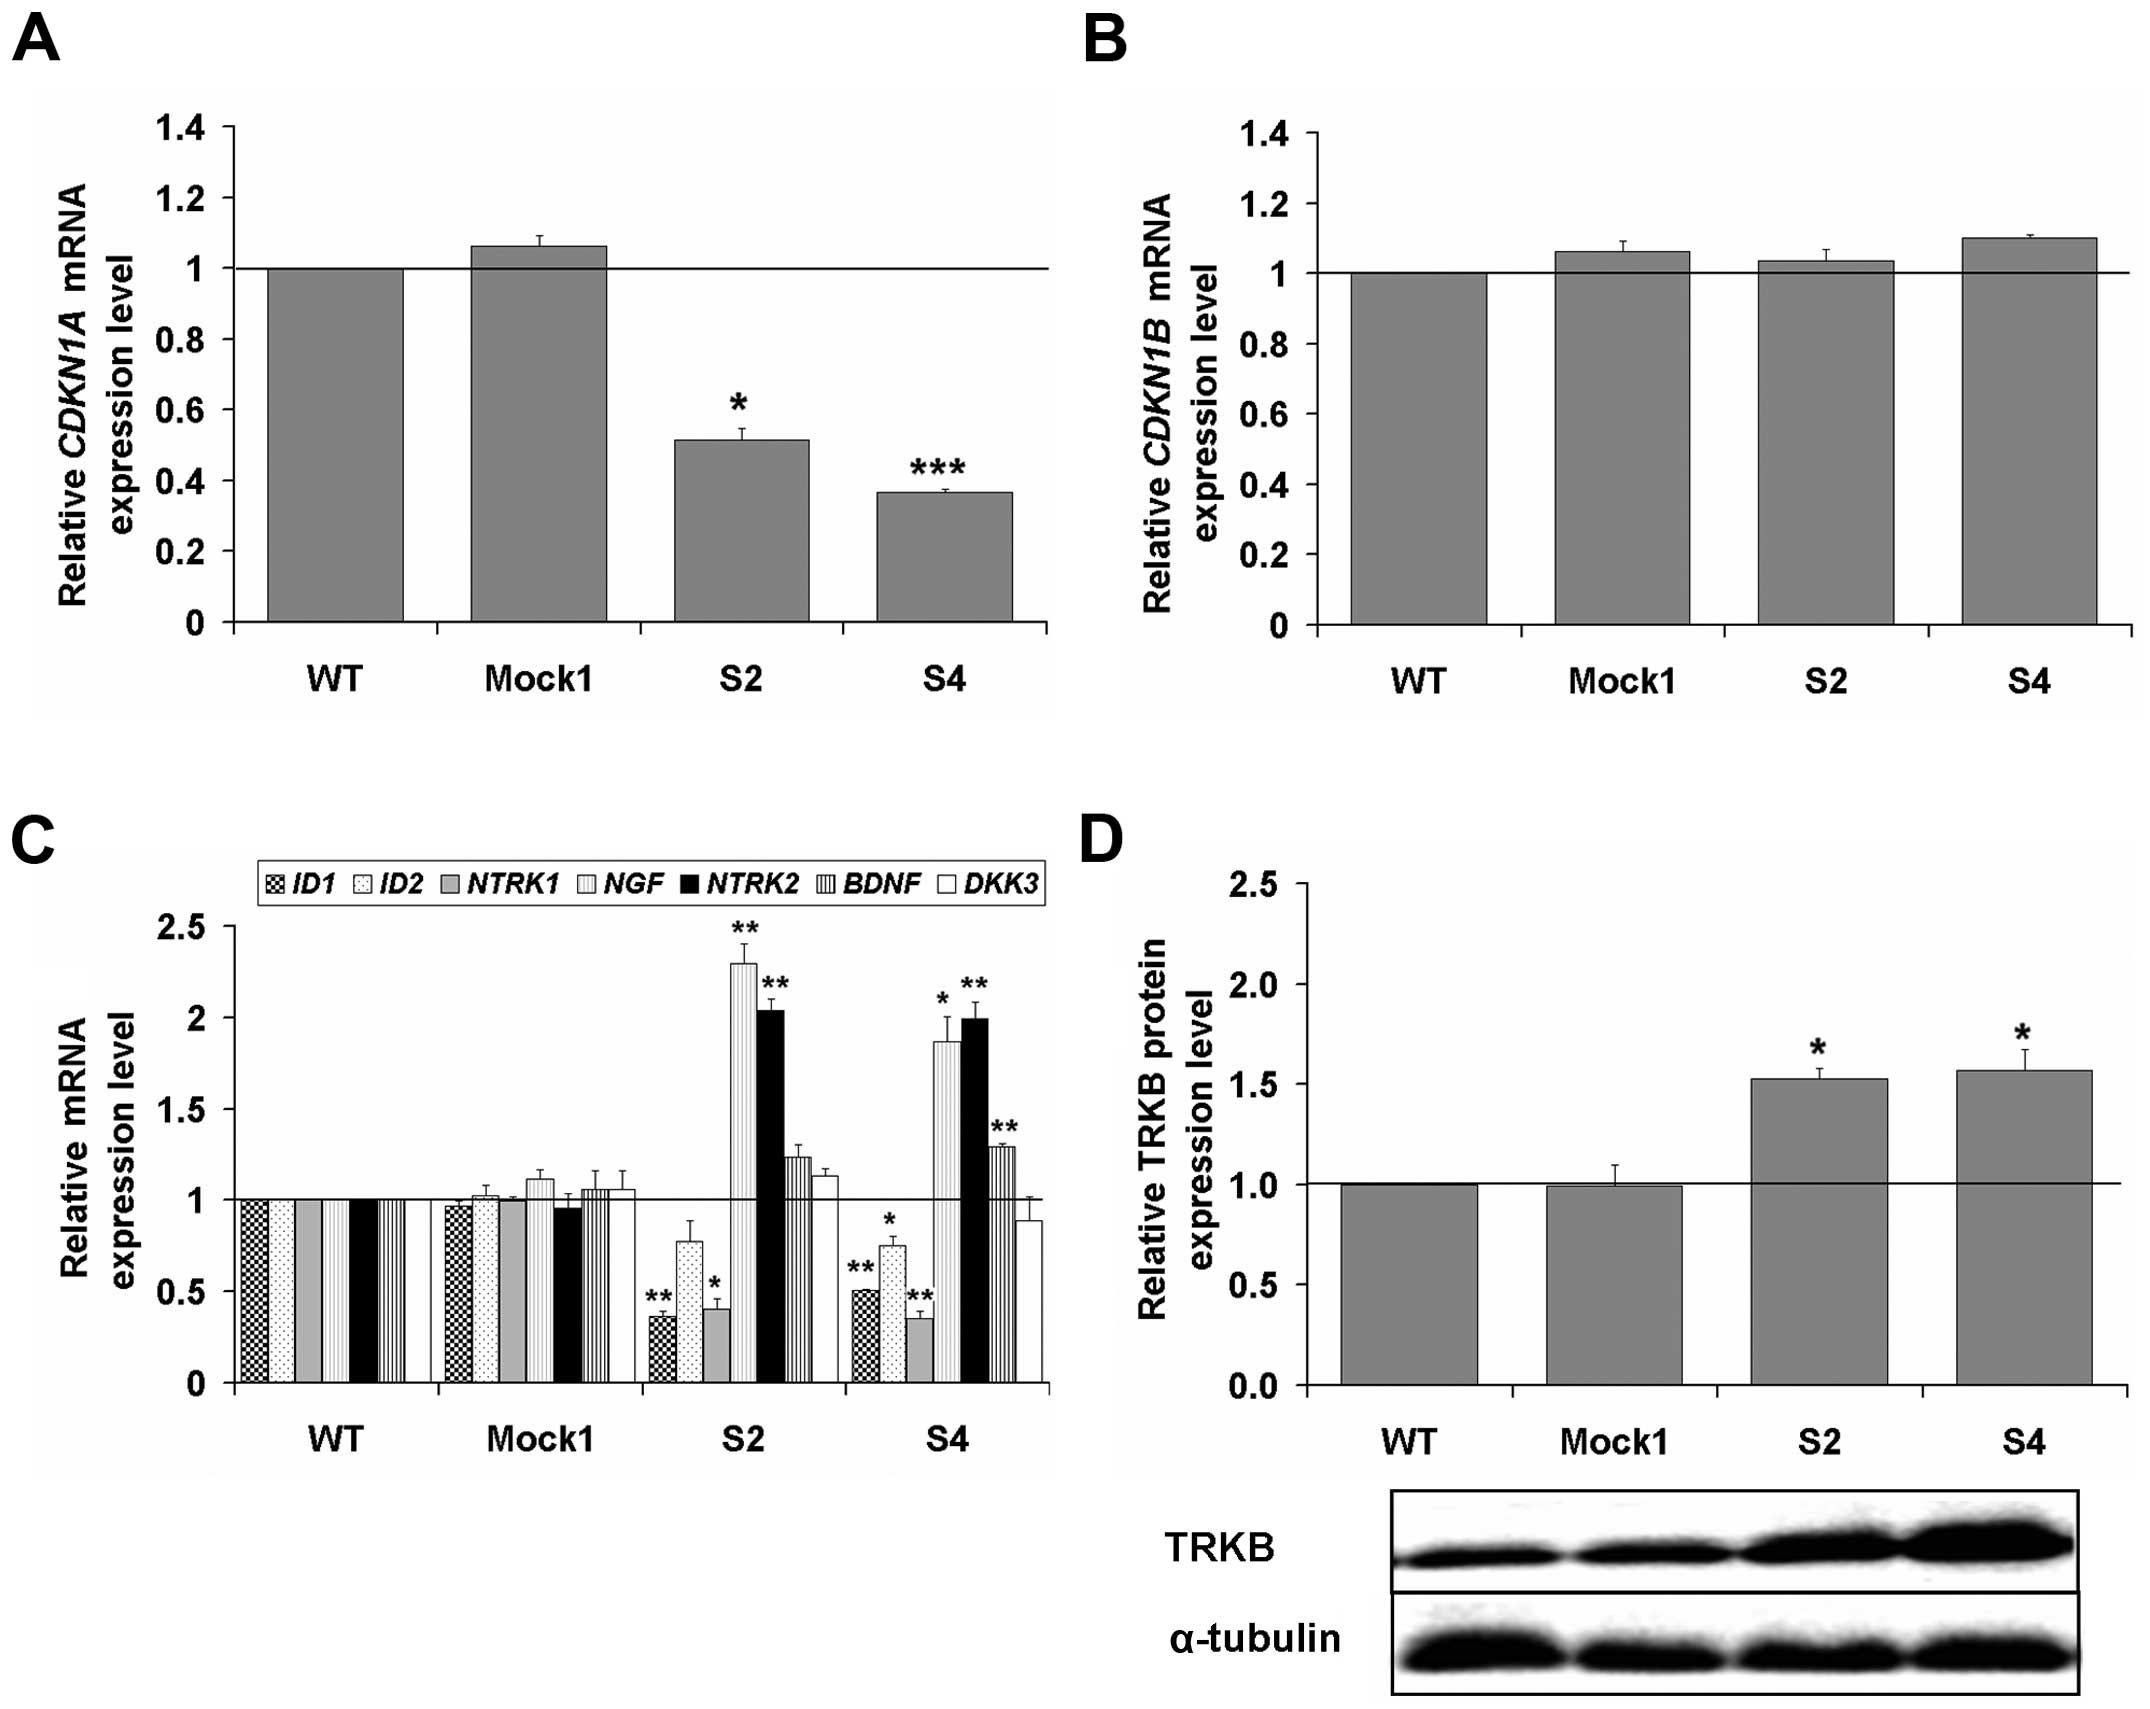 | Figure 4Expression levels of the
CDKN1A and CDKN1B genes and selected markers of
differentiation in PHLDA1-silenced, Mock1 and WT IMR-32
cells. Expression of CDKN1A (A) and CDKN1B (B) genes
was measured by RT-qPCR in PHLDA1-silenced, Mock1 and WT
cells. (C) Gene expression levels of differentiation markers:
ID1, ID2, NTRK1, NGF, NTRK2, BDNF, DKK3 were measured by
RT-qPCR. RPS13 cDNA was used as the reference. Gene
expression in WT cells equals 1 (black baseline). (D) TRKB protein
expression was measured in PHLDA1-silenced (S2, S4), Mock1
and WT cells at 48 h after seeding and normalized to α-tubulin.
Below the chart a representative immunoblot is presented. Data are
presented as means of triplicates from three independent
experiments (± SEM). P-values for t-test were as follows:
*p<0.05, **p<0.01,
***p<0.001. |
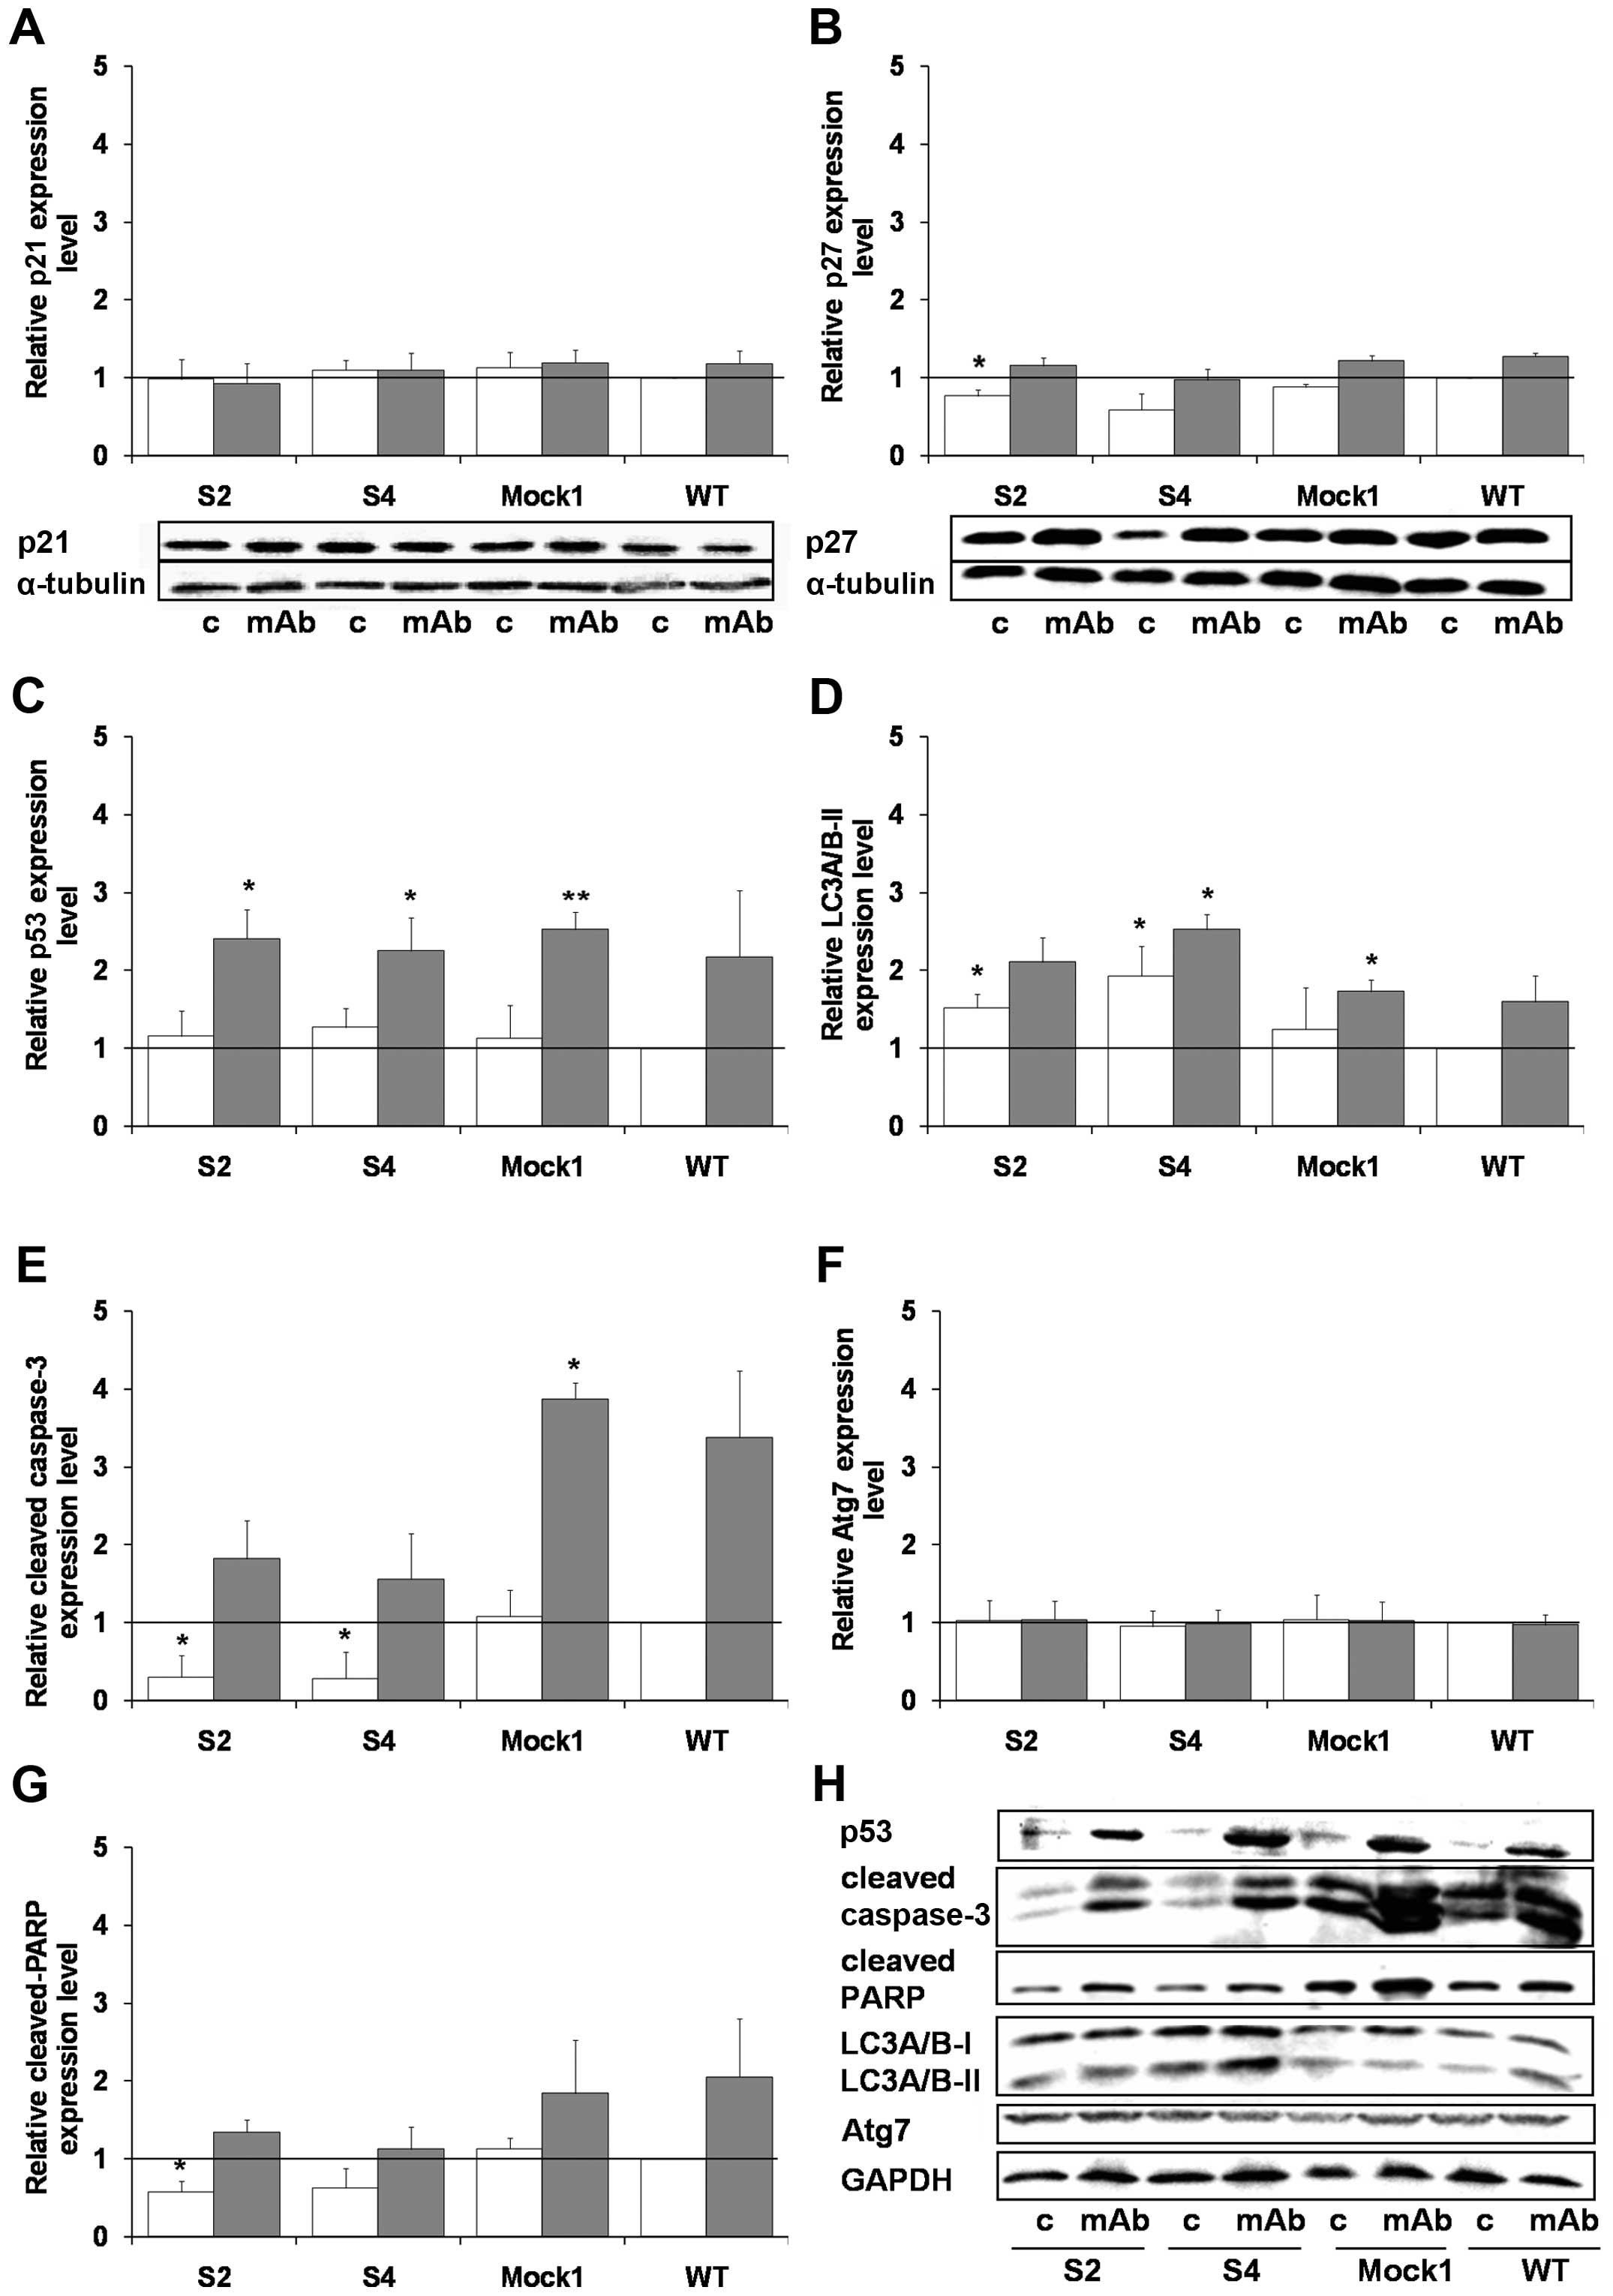 | Figure 8Effects of the 14G2a mAb on
expression of apoptosis- and autophagy-associated proteins in
PHLDA1-silenced, Mock1 and WT cells. Expression levels of
p21 (A), p27 (B), p53 (C), LC3A/B-II (D), cleaved caspase-3 (E),
cleaved PARP (G), and Atg7 (F) were measured at 48 h and normalized
to α-tubulin (for p21 and p27) or GAPDH (for the rest of the
proteins). Representative immunoblots are presented below A and B
charts and in a separate section of the figure (H): c, control
cells; mAb, mAb-treated cells (40 μg/ml). Mean values of three
separate experiments (± SEM) obtained for the 14G2a mAb-treated
IMR-32 are presented (grey bars) and calculated versus control
values (white bars). Expression level of proteins in WT IMR-32
cells was used as the reference (black baseline, set as 1).
P-values for t-test were as follows: *p<0.05,
**p<0.01, ***p<0.001. |
PHLDA1 downregulation increases
phosphorylation of Aurora A and Akt kinases
Previously, we reported that IMR-32 cells are
sensitive to direct cytotoxicity of 14G2a mAb with partial
involvement of apoptosis (18).
Hence, using the model, we tested if the knockout of PHLDA1
expression will affect sensitivity of the clones to treatment with
the 14G2a mAb (40 μg/ml). First, we analyzed expression of GD2
ganglioside on the clones S2 and S4 by flow cytometry and concluded
that the glycolipid level was unchanged as compared to controls
(data not shown). Next, we measured ATP levels of clones treated
with 14G2a for up to 6 days (Fig.
5A) and we report that the clone S2 was the most refractory to
incubation with 14G2a from the three clones and controls tested
(p<0.05 for the S2 clone, days 1–6; for the S4 clone, day 4; and
the S1 clone, days 2–3; as compared to wild-type cells).
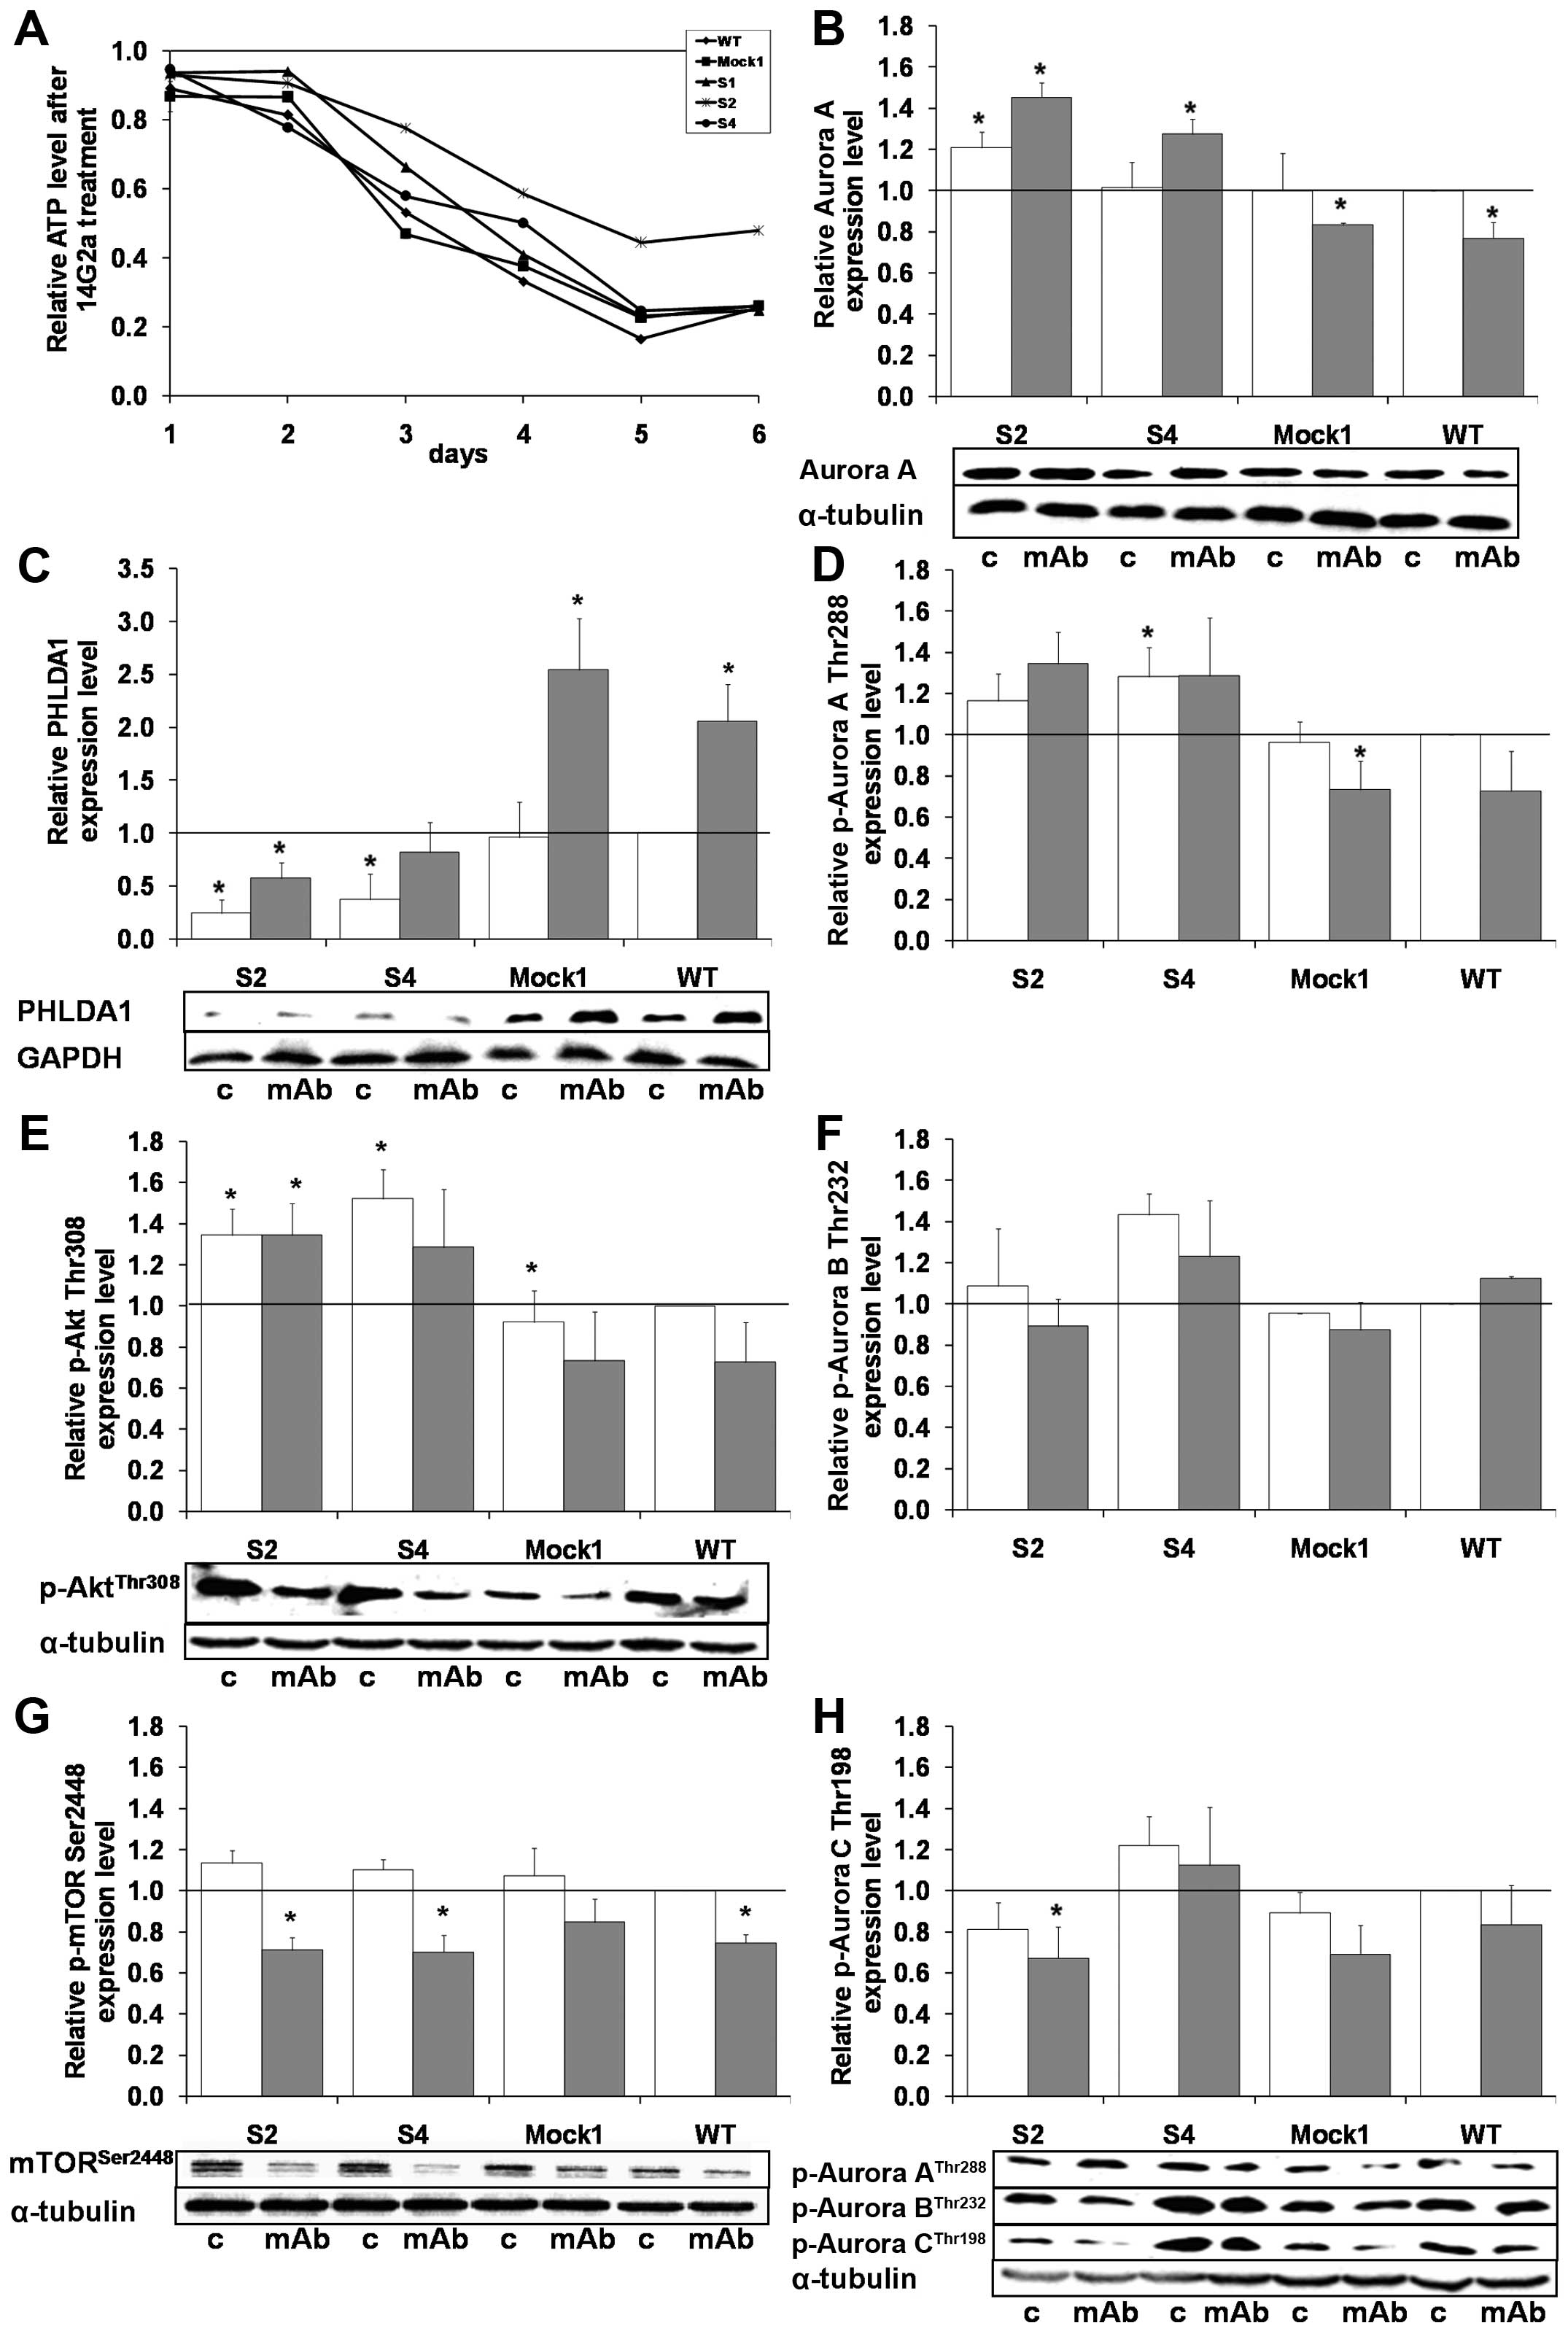 | Figure 5Effects of the 14G2a mAb on cellular
ATP, levels of PHLDA1, Aurora A, selected activating
phosphorylations of aurora kinases, Akt, mTOR in
PHLDA1-silenced, Mock1 and WT cells. (A) Relative cellular
ATP levels were analyzed in PHLDA1-silenced (S1, S2, S4),
Mock1 and WT cells. The y-axis shows the relative ATP level
calculated as luminescent signal at specific time-point/luminescent
signal at day 1. Means of three independent experiments (± SEM) are
calculated. The relative ATP level of particular type of cells
after the 14G2a mAb treatment was calculated versus control values
- untreated cells (black baseline at the top of the chart), set as
1. Standard errors of the mean were omitted from the graph for
clarity, but were <0.4 for all data points. Aurora A (B) and
PHLDA1 (C) expression levels as well as phosphorylation of Aurora A
[(D) p-Aurora A, Thr288], Aurora B [(F) p-Aurora B, Thr232], Aurora
C [(H) p-Aurora C, Thr198], Akt [(E) p-Akt, Thr308] and mTOR [(G)
p-mTOR, Ser2448] kinases were measured at 48 h in 14G2a-treated and
control cells. The proteins were normalized to GAPDH (for PHLDA1)
or α-tubulin (for the rest of proteins). Representative immunoblots
are presented below the charts in (B, C, E, G and H): c, control
cells; mAb, mAb-treated cells (40 μg/ml). Mean values of three
separate experiments (± SEM) obtained for the 14G2a mAb-treated
IMR-32 are presented (grey bars) and calculated versus control
values (white bars). Expression levels of individual proteins in WT
IMR-32 cells were used as the reference (black baseline, set as 1).
P-value for t-test was: *p<0.05. |
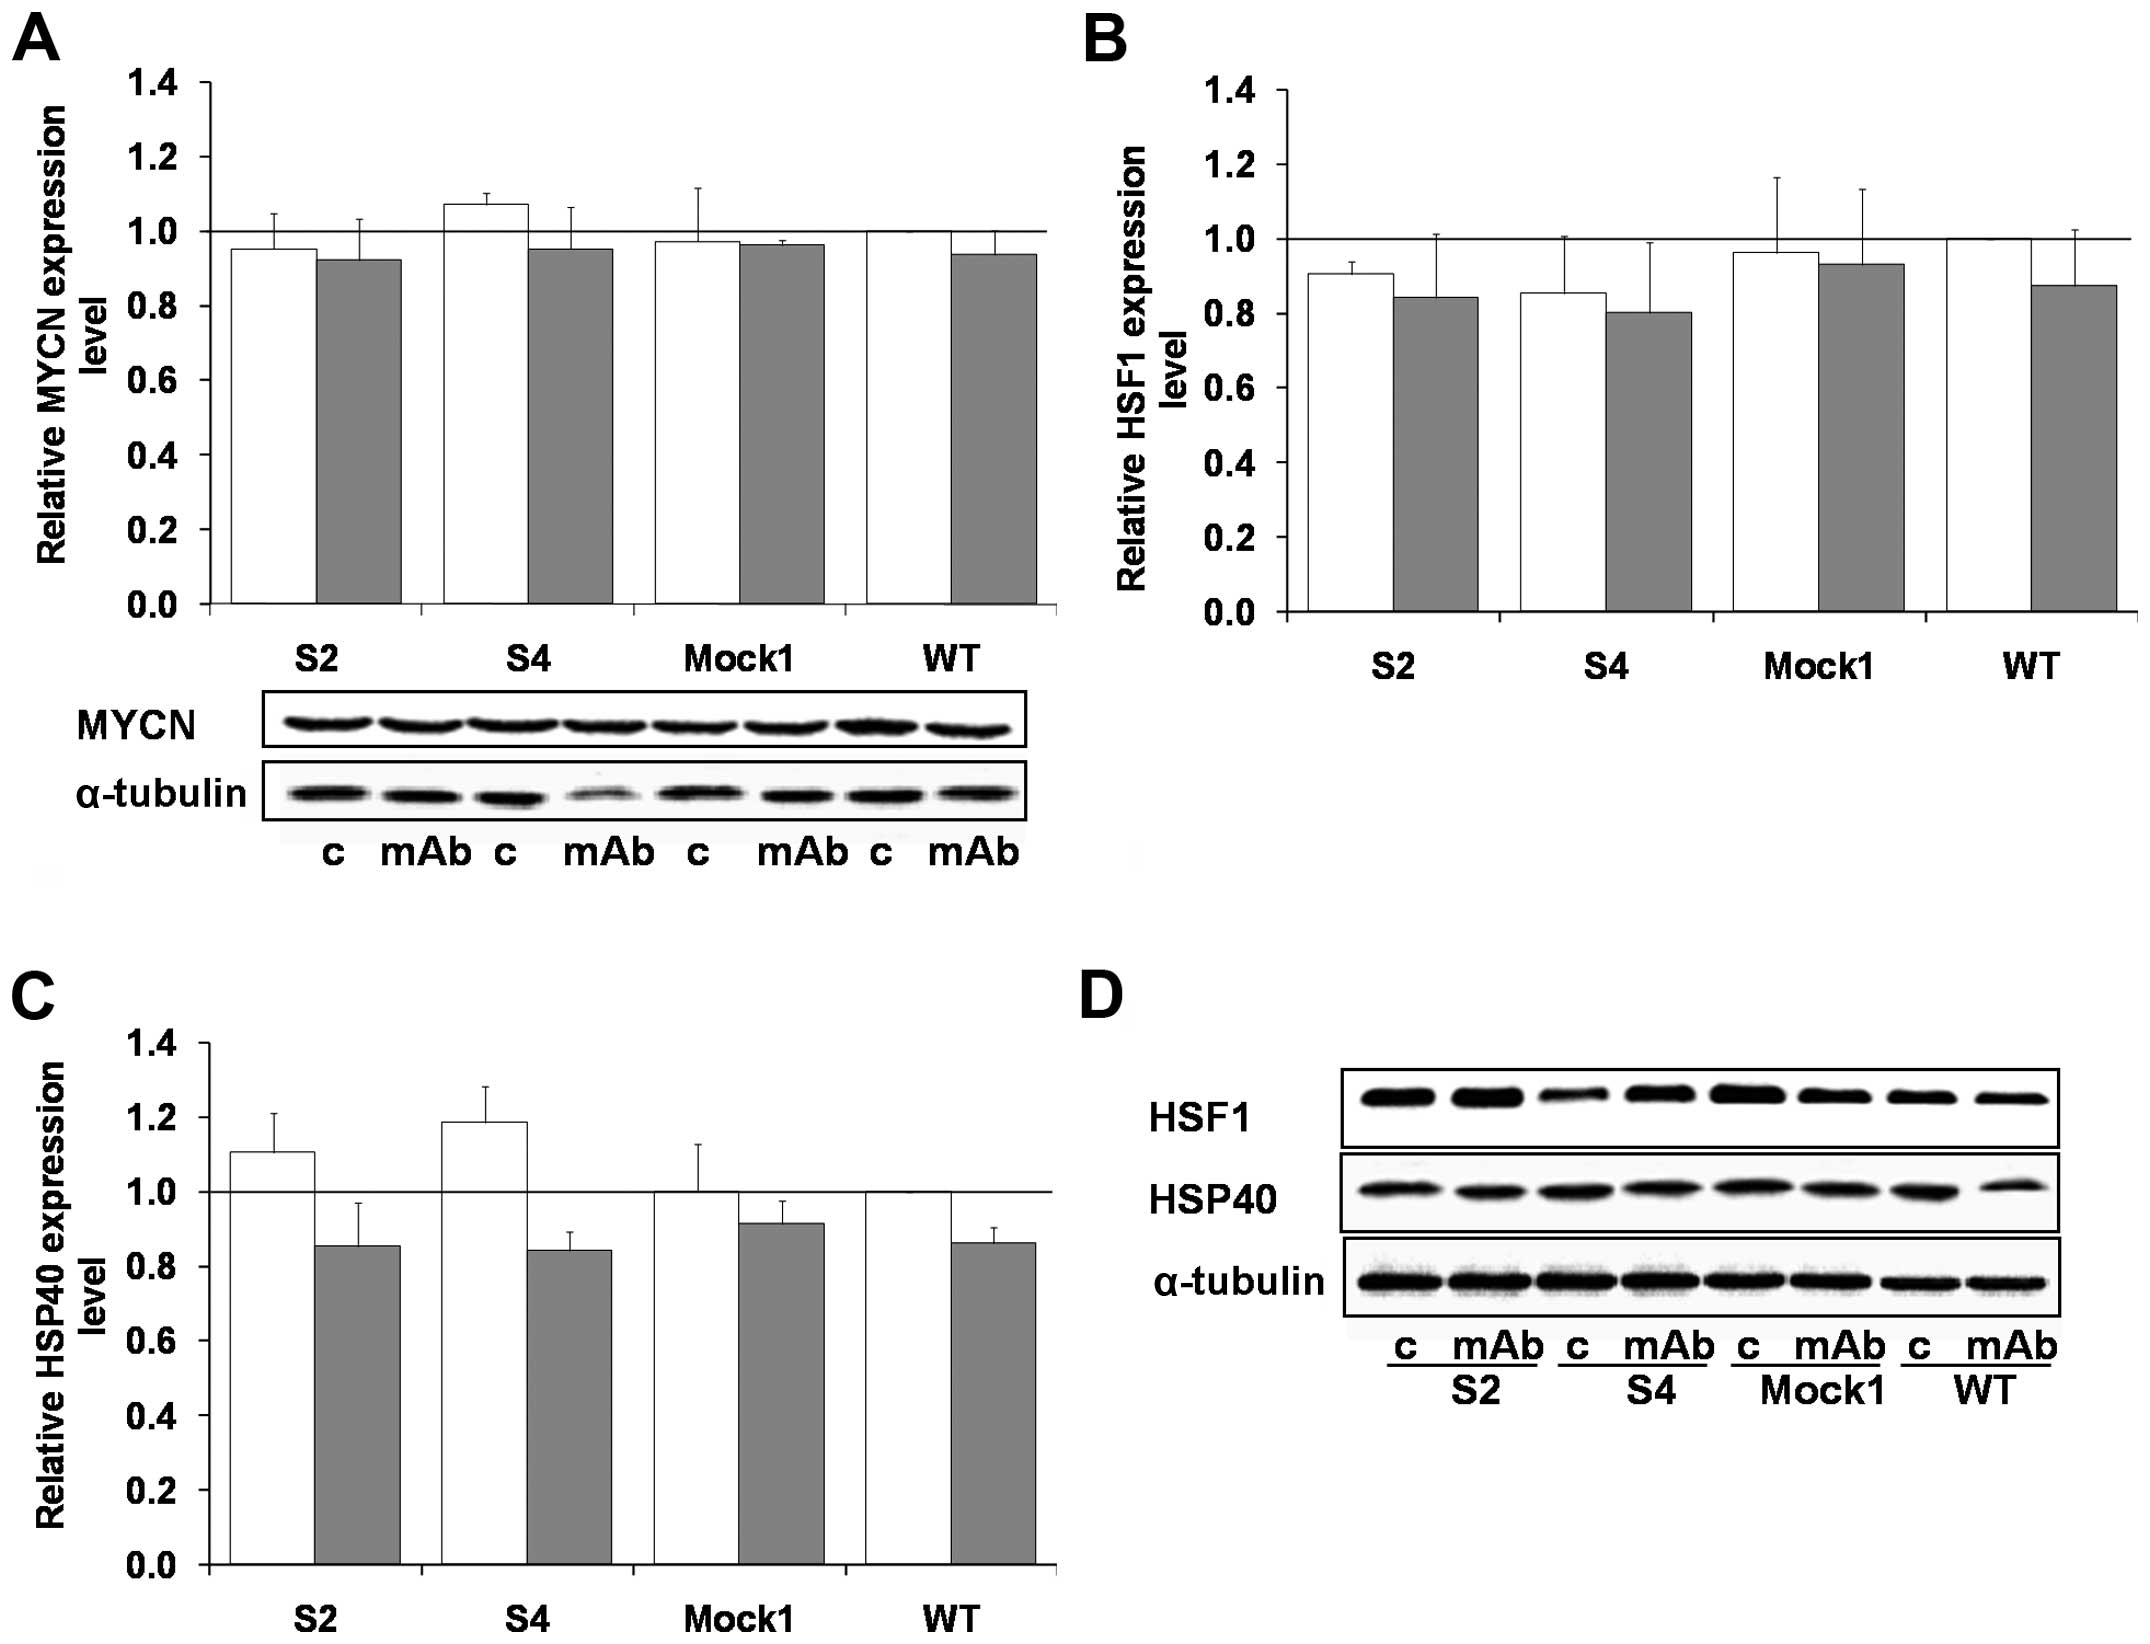
Our earlier studies showed that treatment of IMR-32
cells with 14G2a led to increase in PHLDA1 levels in IMR-32 cells,
accompanied by a decrease in: total levels of MYCN (25), Aurora A and B, activating
phosphorylations of Aurora A (Thr288), Aurora B (Thr232), Aurora C
(Thr198) (17), Akt (Thr308), and
mTOR (Ser2448) in whole cell extracts (24). Thus, we compared the levels of the
aforementioned proteins between the S2 and S4 clones and control
cells after 48 h of the 14G2a-treatment (Figs. 5B–H and 6A). Since PHLDA1 levels were detectable
in the clones S2 and S4, we could also measure an increase in the
protein levels, as a result of addition of 14G2a (Fig. 5C). Moreover, we report that
concomitantly with the highest resistance to treatment with 14G2a
of the S4 clone, the level of phosphorylated Aurora A (Thr288) was
the highest in both treated and untreated cells among all tested
samples. Similar effects can be observed for the S2 clone (Fig. 5D and the blot below H).
Interestingly, in the S4 clone the levels of phosphorylated Aurora
B (Thr232) and Aurora C (Thr198) were also elevated (Fig. 5F and H). Finally, levels of
phosphorylated Akt (Thr308) were the highest in the clones S2 and
S4 (Fig. 5E). Strikingly, after
the 14G2a-mAb treatment, clearly opposite directions of the changes
of Aurora A, p-Aurora A (Thr288), p-Akt (Thr308) were observed in
PHLDA1-downregulated cells when compared to control cells (Fig. 5B, D and E and the blot below H).
Thus, for the S2 and S4 clones the levels of the proteins were
increased, but for Mock1 and wild-type clones the levels were
decreased. There were no changes in phosphorylated mTOR (Ser2448)
kinase expression levels between PHLDA1-silenced clones,
control and non-transduced cells (Fig.
5G). No statistically significant changes in MYCN, HSF1, HSP40
expression was observed for the cell populations tested, either in
the 14G2a mAb treated and untreated IMR-32 cells (Fig. 6).
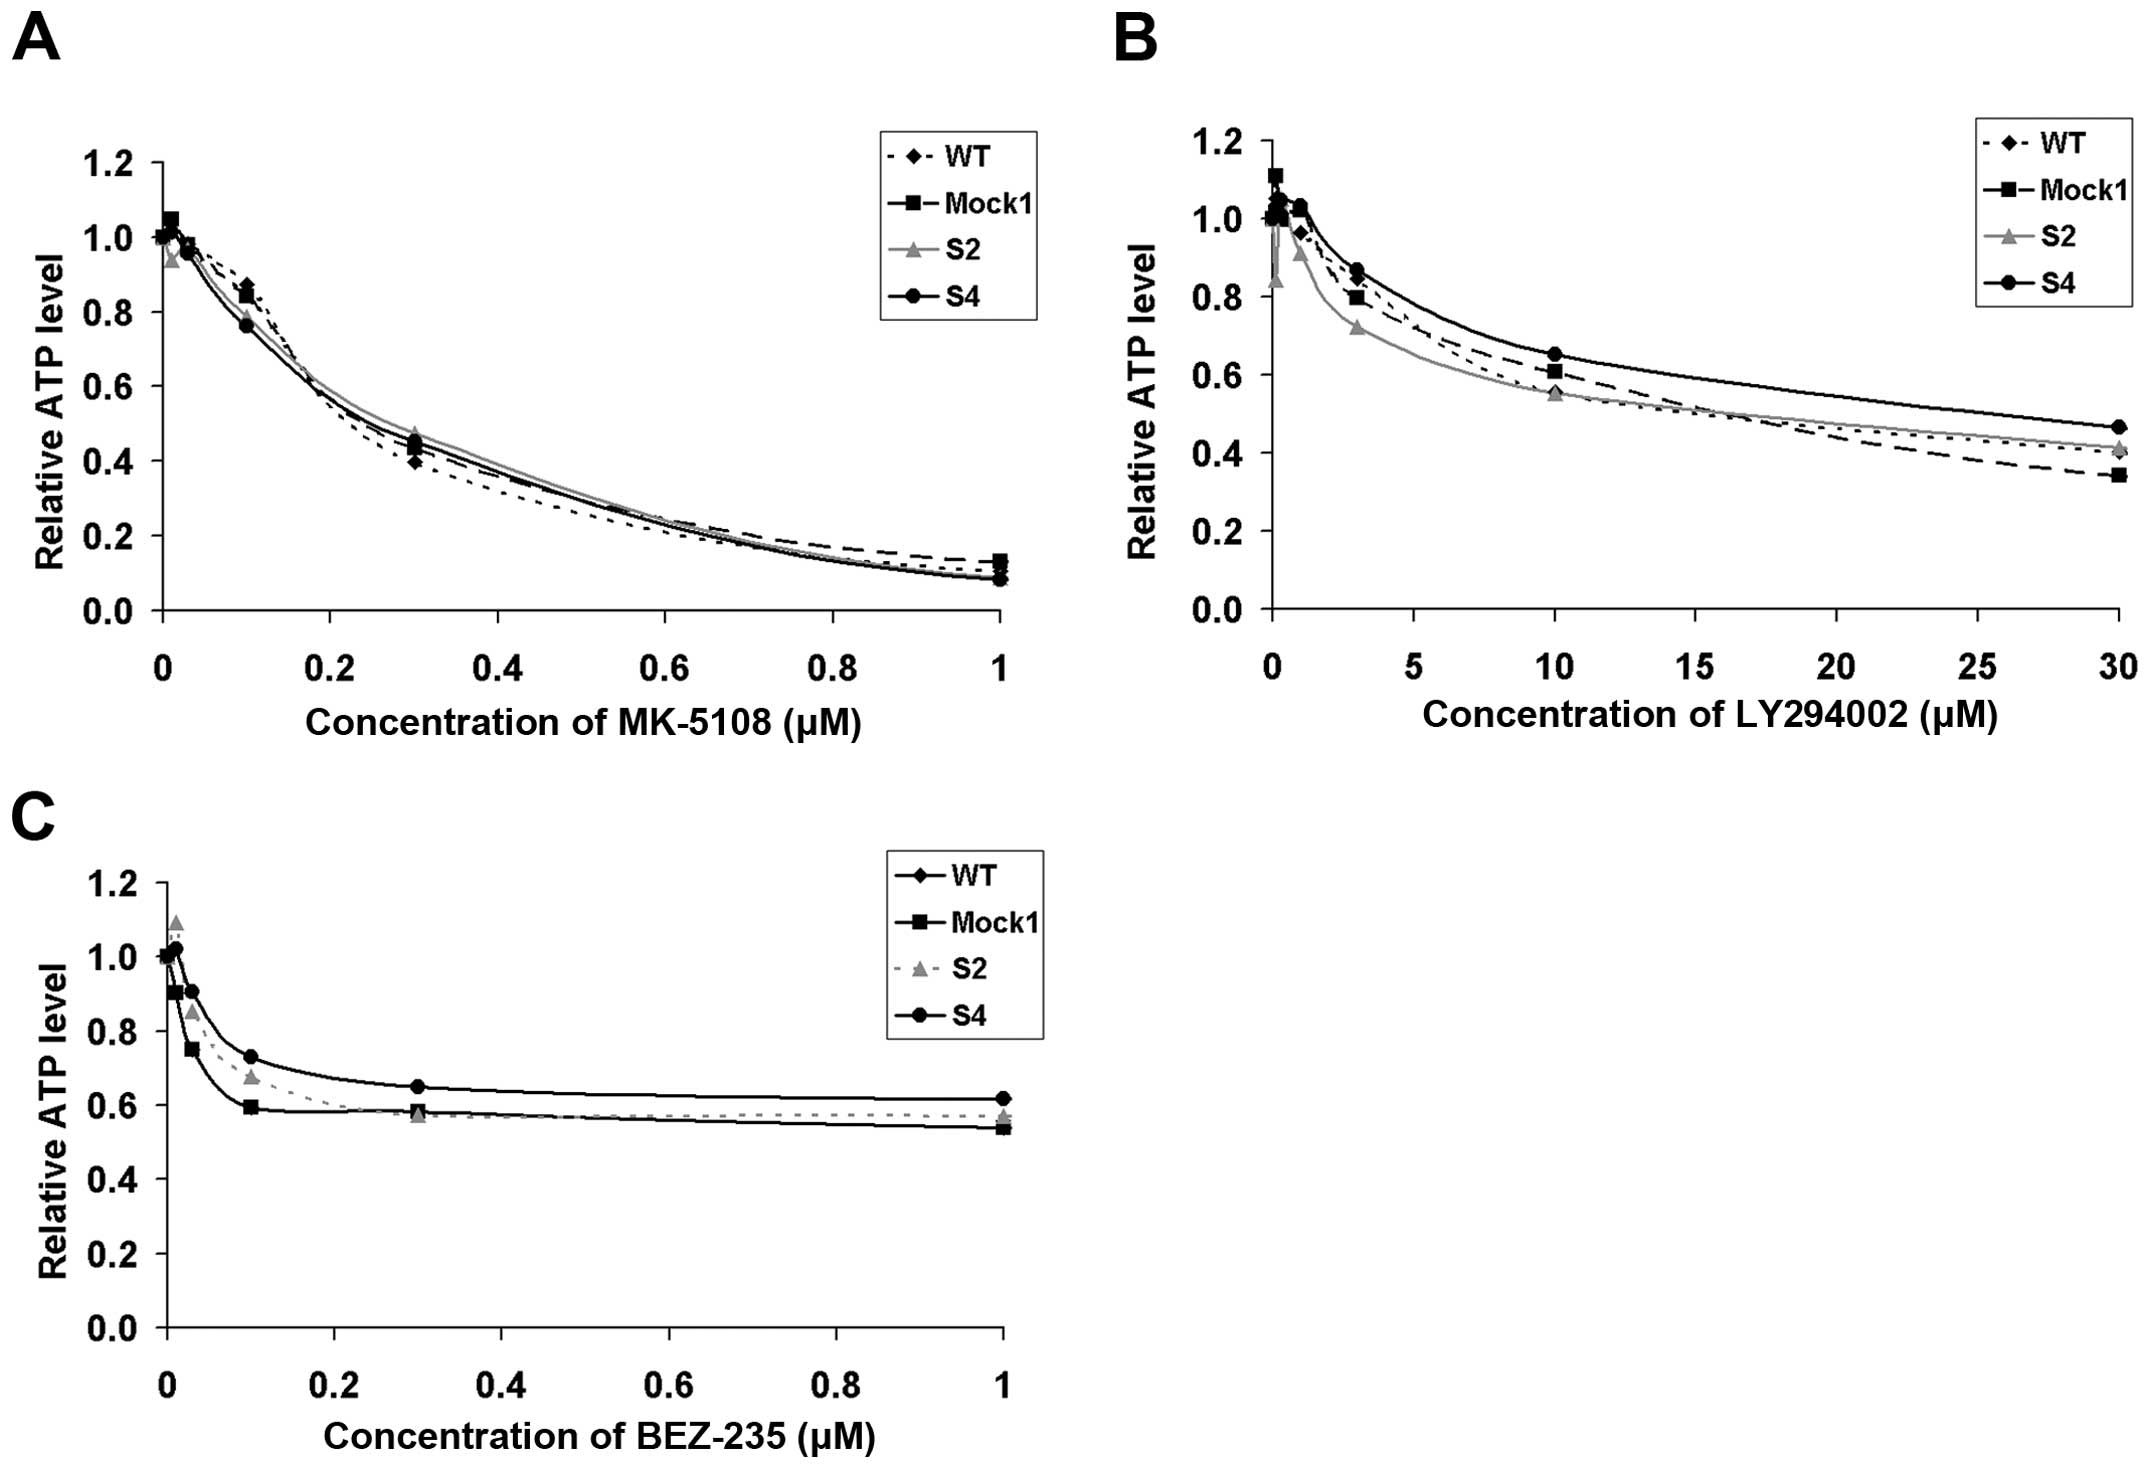
Aurora A and Akt are binding partners. Moreover,
Aurora A overexpression was reported responsible for induction of
chemoresistance via Akt phosphorylation of Ser473 (35). Thus, we checked whether the
reduction of levels of PHLDA1 and the accompanying rise of levels
of p-Aurora A (Thr288) and p-Akt (Thr308) would translate into a
higher resistance to selected inhibitors, i.e., MK-5108 (Aurora A
inhibitor), LY294002 and BEZ-235 (dual PI3K and mTOR inhibitors).
We report that susceptibility of PHLDA1-silenced clones to
aforementioned inhibitors remained unchanged as compared to
controls (Fig. 7). To conclude, we
could observe that effects of the 14G2a mAb addition on ATP levels
of tested cells were dependent on PHLDA1 levels in IMR-32 cells.
This confirms our previously reported observation that PHLDA1 is
linked to treatment with the 14G2a mAb. However, no such
correlations were found for the inhibitors used.
PHLDA1 downregulation affects apoptosis-
and autophagy-related proteins in IMR-32 cells
Previously we reported that incubation of IMR-32
cells with 14G2a led to induction of apoptosis (18). Also the cytotoxicity of the mAb was
linked to a meaningful rise of levels of p53 (17). To extend the findings, we analyzed
changes of p21, p27, p53, cleaved PARP and an apoptosis-executing
caspase-3 in the clones S2 and S4, as compared to controls
(Fig. 8). We report that p21 did
not change in the mAb or the control cells of any of the clones,
p27 decreased in the untreated S2 and S4 cell clones, and p53
increased to similar levels in all mAb-treated populations tested
(Fig. 8A–C and H). Levels of
caspase-3 and PARP were lower in the S2 and S4 clones. Moreover,
although an increase in cleaved caspase-3 and PARP was measured for
all cells treated with the 14G2a mAb, the levels of the proteins
were lower in the S2 and S4 samples, when compared to respective
controls (WT, set as 1, Fig. 8E, G and
H). On the contrary, we measured a rise in levels of an
autophagy-related protein, converted LC3A/B-II form in the S2 and
S4 clones, as compared to respective controls of both 14G2a-treated
and untreated groups (Fig. 8D and
H). This was accompanied by similar levels of Atg7 in all
samples tested (Fig. 8F and
H).
The data suggest that downregulation of PHLDA1 in
our model may make the cells less prone to apoptosis and positively
regulate autophagosome formation.
Discussion
The goal of our research was to characterize IMR-32
cells with a downregulation of PHLDA1. We were able to show several
differences in expression of transcripts and proteins of genes
important for neuroblastoma survival. Hence, in both S2, S4 clones
with decreased PHLDA1 levels, we found increased mRNA and protein
levels of AURKA and NTRK2 [Aurora A and TRKB are
markers of poor prognosis (34,36)], but a decrease in mRNA of
NTRK1 [TRKA is a marker of good prognosis (36)]. NTRK1 and NTRK2
encode key proteins involved in regulation of growth arrest and
differentiation of neuroblastomas. In the future, the above
findings should be extended with analyses of levels of proteins of
TRKA and TRKB and their ligands, also with more insights into
possible isoforms of the TRK receptors that result from alterantive
splicing and have differential influence on cell behaviour
(37,38).
Oncogenic functions of Aurora A in neuroblastoma are
well established (11). Akt and
Aurora A are partners and important targets for neuroblastoma
treatment (13,39). Akt was shown to transduce signal to
chemorestistance induced via TRKB/BDNF (40) and to participate in signaling
network from Aurora A that drives tumor growth (35). Also, Akt is able to phosphorylate
tumor suppressors p21 and p27, both on two sites, i.e., at Thr145
and Ser153 in p21 and at Thr157 and Thr198 in p27, thus leading to
cytoplasmic retention of the proteins (41,42).
On the protein level, we observed an increase in Aurora A,
activating phosphorylations of p-Aurora A (Thr288), p-Akt (Thr308),
and a decrease in p27 (for the clones S2 and S4). Together with the
aforementioned changes of expression of NTRK1 and
NTRK2, our data suggest that downregulation of PHLDA1 in
IMR-32 cells may affect regulation of cell growth and/or survival.
However, more research is needed to elucidate how silencing of
PHLDA1 expression may be linked to mechanism by which Aurora A and
Akt promote tumorigenesis, as an inverse correlation in expression
of PHLDA1 and selected phosphorylation of Aurora A and Akt was
observed in our model. Another group of our findings stems from
analyses of levels of PHLDA1 in IMR-32 cells with downregulation of
AURKA, where again such an inverse correlation between
expression of PHLDA1 and Aurora A was confirmed. Also, in the most
of the analyzed neuroblastoma cell lines, i.e., IMR-32, SK-N-SH,
Kelly, CHP-134, HTLA230 such inverse correlations can be stated.
Hence, the above findings allow us to hypothesize that in IMR-32
cells Aurora A and PHLDA1 are proteins that might negatively
regulate each other, as reported previously by Johnson et al
for the MDA-MB-231 breast cancer cells (10). Therefore, further experiments
should be performed to show a direct physical interactions of the
proteins. Also, experiments with additional cell lines or approches
aiming to overexpress PHLDA1 in cell lines such as HTLA230, Kelly,
and CHP-134 could add more data on the roles of the protein in
neuroblastoma cells.
Previously, we reported that the increased level of
PHLDA1 in IMR-32 cells treated with 14G2a mAb correlated with the
decreased level of Aurora A, p-Aurora A (Thr288) and p-Akt (Thr308)
(17,24). Also, a specific Aurora A inhibitor,
MK-5108, affected the PHLDA1 level in a time-dependent manner in
the cell line (17). As expected,
clones of IMR-32 cells with downregulation of PHLDA1 were
less sensitive to treatment with the 14G2a mAb. However, higher
levels of activating phosphorylations of Aurora A and Akt could not
be correlated with higher resistance to treatment with Aurora A
inhibitor (MK-5108), and two dual PI3K and mTOR inhibitors (BEZ-235
and LY294002). As the results of cytototoxicity experiments were
determined based on cellular ATP measurements we cannot exclude
that differences in ATP levels of given cell clones can affect the
results. In the future, the findings should be confirmed with other
methods.
We reported effects of PHLDA1 silencing in
IMR-32 cells on some features of mitochondria. Hence, we measured
an increase in mitochondrial membrane potential and enhanced
cellular ATP levels, as compared to control cells. Because MMP is
the driving force for mitochondrial ATP synthesis, gain of MMP may
result in increased ATP level (43). However, to gain more information on
possible changes of mitochondria in the cells, further tests should
be performed including application of other dyes (e.g., JC-1) to
confirm MMP changes as well as analyses of morphology and density
of the organelles.
In our model, the changes of levels of ATP were not
correlated with higher proliferation of the clones, but rather
lower number of apoptotic cells in untreated cell cultures,
decreased levels of cleaved caspase-3 and PARP, and decreased
activity of caspase-3/7. This sugesst that downregulation of PHLDA1
expression may contribute to apoptosis resistance in our model.
Such data support pro-apoptotic functions of PHLDA1 in IMR-32 cells
and suggest a possible role of the protein in regulation of
functions of mitochondria and/or mitochondrial-mediated apoptotic
pathways. Application of other than 14G2a inducers of apoptosis
could help to further substantiate our conclusions.
Interestingly, we also found a correlation between
decreased expression of PHLDA1 and increased levels of the
autophagy marker, LC3A/B-II. From our data, a negative correlation
between expression of PHLDA1 and LC3A/B-II in S2 and S4 clones
suggests that PHLDA1 seems to be limiting autophagosome formation.
Further studies are needed to determine if the observed rise of
expression of LC3A/B-II results in advanced autophagy or a block of
autophagolysomal maturation by analyzing the autophagic flux
(44).
Links between mitochondria, apoptosis and autophagy
are well known. Hence, mitophagy (a mitochondria specific
autophagy) operates to remove demaged or excessive mitochondria in
cells (45). Roles of
mitochondrial dynamic proteins such as MFN 1/2 (mitofusin 1 and 2),
OPA1 (optic athrophy 1), DRP1 (dynamin related protein 1), and
PINK1 (PTEN-induced kinase 1)/Parkin in the two cell processes were
previously described (45,46).
Our study links PHLDA1 and some proteins involved
in apoptosis and autophagy. However, based on the already published
reports, the exact funtions of the protein seem to be dependent on
a cell type tested and agents used to affect the PHLDA1 level. In
the future, we plan to perform more experiments to broaden our
knowledge on roles of PHLDA1 in functioning of the mitochondria.
One of the directions, could be finding the connection between MMP
and apoptosis in our model, as both hyper- and de-polarization of
mitochondrial membrane were associated with this type of cell death
(47). Also, more insights into
the two aforementioned cell processes and their relationships with
mitochondria can be analyzed in experiments focusing on changes of
levels of such proteins as BAX, BAK, BCL-2, BCL-xl, MCL-1, MFN 1/2,
OPA1, DRP1 and PINK1 in clones with downregulation of PHLDA1.
In conclusion, our findings show that in IMR-32
cells, the PHLDA1 protein affects mRNA and protein levels of
AURKA and NTRK2, Aurora A- and Akt-activating
phosphorylations, ATP levels and mitochondrial membrane potential.
Our data showing that the protein may be pro-apoptotic and limiting
autophagosome formation add to an ongoing debate on roles of PHLDA1
in tumor cells.
Acknowledgements
We thank Dr R. Reisfeld for providing us with the
hybridoma cell line producing the 14G2a mAb. We thank Dr L.
Raffaghello for the HTLA230 cell line. We are grateful to Dr M.
Bzowska (Department of Immunology of the Faculty of Biochemistry,
Biophysics and Biotechnology, Jagiellonian University) for help in
flow cytometry analyses. We acknowledge that Iwona Nowak, M.Sc.,
from the Laboratory of Molecular Genetics and Virology (Faculty of
Biochemistry, Biophysics and Biotechnology, Jagiellonian
University) searched literature to find sequences of starters
NTRK1, BDNF, NGF, DKK3 and designed starters ID2 to
detect expression of by RT-qPCR. We are grateful for that. This
study was supported by the grant no. NCN-2012/07/B/NZ1/02808 from
the Polish National Science Center (to Hanna Rokita), the grant no.
16/2015 from Research Project Competition for Young Researchers and
PhD Students of the Faculty of Biochemistry, Biophysics and
Biotechnology Jagiellonian University (to Małgorzata Durbas), and
DS/8/WBBiB UJ. Faculty of Biochemistry, Biophysics and
Biotechnology is a partner of the Leading National Research Center
(KNOW) supported by the Ministry of Science and Higher
Education.
Abbreviations:
|
Ab
|
antibody
|
|
FBS
|
fetal bovine serum
|
|
GD2
|
GD2 ganglioside
|
|
mAb
|
monoclonal antibody
|
|
MMP
|
mitochondrial membrane potential
|
|
RT-qPCR
|
quantitative RT-PCR
|
References
|
1
|
Park CG, Lee SY, Kandala G, Lee SY and
Choi Y: A novel gene product that couples TCR signaling to
Fas(CD95) expression in activation-induced cell death. Immunity.
4:583–591. 1996. View Article : Google Scholar : PubMed/NCBI
|
|
2
|
Kuske MD and Johnson JP: Assignment of the
human PHLDA1 gene to chromosome 12q15 by radiation hybrid mapping.
Cytogenet Cell Genet. 89:12000. View Article : Google Scholar : PubMed/NCBI
|
|
3
|
Neef R, Kuske MA, Pröls E and Johnson JP:
Identification of the human PHLDA1/TDAG51 gene: Down-regulation in
metastatic melanoma contributes to apoptosis resistance and growth
deregulation. Cancer Res. 62:5920–5929. 2002.PubMed/NCBI
|
|
4
|
Hayashida N, Inouye S, Fujimoto M, Tanaka
Y, Izu H, Takaki E, Ichikawa H, Rho J and Nakai A: A novel
HSF1-mediated death pathway that is suppressed by heat shock
proteins. EMBO J. 25:4773–4783. 2006. View Article : Google Scholar : PubMed/NCBI
|
|
5
|
Nagai MA, Fregnani JH, Netto MM, Brentani
MM and Soares FA: Down-regulation of PHLDA1 gene expression is
associated with breast cancer progression. Breast Cancer Res Treat.
106:49–56. 2007. View Article : Google Scholar : PubMed/NCBI
|
|
6
|
Coutinho-Camillo CM, Lourenço SV, Nonogaki
S, Vartanian JG, Nagai MA, Kowalski LP and Soares FA: Expression of
PAR-4 and PHLDA1 is prognostic for overall and disease-free
survival in oral squamous cell carcinomas. Virchows Arch.
463:31–39. 2013. View Article : Google Scholar : PubMed/NCBI
|
|
7
|
Murata T, Sato T, Kamoda T, Moriyama H,
Kumazawa Y and Hanada N: Differential susceptibility to hydrogen
sulfide-induced apoptosis between PHLDA1-overexpressing oral cancer
cell lines and oral keratinocytes: Role of PHLDA1 as an apoptosis
suppressor. Exp Cell Res. 320:247–257. 2014. View Article : Google Scholar
|
|
8
|
Park ES, Kim J, Ha TU, Choi JS, Soo Hong K
and Rho J: TDAG51 deficiency promotes oxidative stress-induced
apoptosis through the generation of reactive oxygen species in
mouse embryonic fibroblasts. Exp Mol Med. 45:e352013. View Article : Google Scholar : PubMed/NCBI
|
|
9
|
Hinz T, Flindt S, Marx A, Janssen O and
Kabelitz D: Inhibition of protein synthesis by the T cell
receptor-inducible human TDAG51 gene product. Cell Signal.
13:345–352. 2001. View Article : Google Scholar : PubMed/NCBI
|
|
10
|
Johnson EO, Chang KH, de Pablo Y, Ghosh S,
Mehta R, Badve S and Shah K: PHLDA1 is a crucial negative regulator
and effector of Aurora A kinase in breast cancer. J Cell Sci.
124:2711–2722. 2011. View Article : Google Scholar : PubMed/NCBI
|
|
11
|
Otto T, Horn S, Brockmann M, Eilers U,
Schüttrumpf L, Popov N, Kenney AM, Schulte JH, Beijersbergen R,
Christiansen H, et al: Stabilization of N-Myc is a critical
function of Aurora A in human neuroblastoma. Cancer Cell. 15:67–78.
2009. View Article : Google Scholar
|
|
12
|
Shang X, Burlingame SM, Okcu MF, Ge N,
Russell HV, Egler RA, David RD, Vasudevan SA, Yang J and Nuchtern
JG: Aurora A is a negative prognostic factor and a new therapeutic
target in human neuroblastoma. Mol Cancer Ther. 8:2461–2469. 2009.
View Article : Google Scholar : PubMed/NCBI
|
|
13
|
Brockmann M, Poon E, Berry T, Carstensen
A, Deubzer HE, Rycak L, Jamin Y, Thway K, Robinson SP, Roels F, et
al: Small molecule inhibitors of aurora-a induce proteasomal
degradation of N-myc in childhood neuroblastoma. Cancer Cell.
24:75–89. 2013. View Article : Google Scholar : PubMed/NCBI
|
|
14
|
Mossé YP, Lipsitz E, Fox E, Teachey DT,
Maris JM, Weigel B, Adamson PC, Ingle MA, Ahern CH and Blaney SM:
Pediatric phase I trial and pharmacokinetic study of MLN8237, an
investigational oral selective small-molecule inhibitor of Aurora
kinase A: A Children's Oncology Group Phase I Consortium study.
Clin Cancer Res. 18:6058–6064. 2012. View Article : Google Scholar : PubMed/NCBI
|
|
15
|
Huang M and Weiss WA: Neuroblastoma and
MYCN. Cold Spring Harb Perspect Med. 3:a0144152013. View Article : Google Scholar : PubMed/NCBI
|
|
16
|
Dhillon S: Dinutuximab: First global
approval. Drugs. 75:923–927. 2015. View Article : Google Scholar : PubMed/NCBI
|
|
17
|
Horwacik I, Durbas M, Boratyn E, Węgrzyn P
and Rokita H: Targeting GD2 ganglioside and Aurora A kinase as a
dual strategy leading to cell death in cultures of human
neuroblastoma cells. Cancer Lett. 341:248–264. 2013. View Article : Google Scholar : PubMed/NCBI
|
|
18
|
Kowalczyk A, Gil M, Horwacik I, Odrowaz Z,
Kozbor D and Rokita H: The GD2-specific 14G2a monoclonal antibody
induces apoptosis and enhances cytotoxicity of chemotherapeutic
drugs in IMR-32 human neuroblastoma cells. Cancer Lett.
281:171–182. 2009. View Article : Google Scholar : PubMed/NCBI
|
|
19
|
Wang Y, Sun H, Wang Z, Liu M, Qi Z, Meng
J, Sun J and Yang G: Aurora-A: A potential DNA repair modulator.
Tumour Biol. 35:2831–2836. 2014. View Article : Google Scholar
|
|
20
|
Dorn GW II and Kitsis RN: The
mitochondrial dynamism-mitophagy-cell death interactome: Multiple
roles performed by members of a mitochondrial molecular ensemble.
Circ Res. 116:167–182. 2015. View Article : Google Scholar :
|
|
21
|
Riccardi C and Nicoletti I: Analysis of
apoptosis by propidium iodide staining and flow cytometry. Nat
Protoc. 1:1458–1461. 2006. View Article : Google Scholar
|
|
22
|
Stock C, Bozsaky E, Watzinger F,
Poetschger U, Orel L, Lion T, Kowalska A and Ambros PF: Genes
proximal and distal to MYCN are highly expressed in human
neuroblastoma as visualized by comparative expressed sequence
hybridization. Am J Pathol. 172:203–214. 2008.Erratum in: Am J
Pathol 172: 1153, 2008. View Article : Google Scholar : PubMed/NCBI
|
|
23
|
Wang L, Wang G, Yang D, Guo X, Xu Y, Feng
B and Kang J: Euphol arrests breast cancer cells at the G1 phase
through the modulation of cyclin D1, p21 and p27 expression. Mol
Med Rep. 8:1279–1285. 2013.PubMed/NCBI
|
|
24
|
Durbas M, Horwacik I, Boratyn E, Kamycka E
and Rokita H: GD2 ganglioside specific antibody treatment
downregulates PI3K/Akt/mTOR signaling network in human
neuroblastoma cell lines. Int J Oncol. 47:1143–1159.
2015.PubMed/NCBI
|
|
25
|
Horwacik I, Durbas M, Boratyn E, Sawicka
A, Węgrzyn P, Krzanik S, Górka A, Drożniak J, Augustyniak E,
Kowalczyk A, et al: Analysis of genes involved in response to
doxorubicin and a GD2 ganglioside-specific 14G2a monoclonal
antibody in IMR-32 human neuroblastoma cells. Acta Biochim Pol.
62:423–433. 2015. View Article : Google Scholar : PubMed/NCBI
|
|
26
|
Matsumura S, Terao M, Murota H and
Katayama I: Th2 cytokines enhance TrkA expression, upregulate
proliferation, and downregulate differentiation of keratinocytes. J
Dermatol Sci. 78:215–223. 2015. View Article : Google Scholar : PubMed/NCBI
|
|
27
|
Bao W, Qiu H, Yang T, Luo X, Zhang H and
Wan X: Upregulation of TrkB promotes epithelial-mesenchymal
transition and anoikis resistance in endometrial carcinoma. PLoS
One. 8:e706162013. View Article : Google Scholar : PubMed/NCBI
|
|
28
|
Zuccato C, Marullo M, Vitali B, Tarditi A,
Mariotti C, Valenza M, Lahiri N, Wild EJ, Sassone J, Ciammola A, et
al: Brain-derived neurotrophic factor in patients with Huntington's
disease. PLoS One. 6:e229662011. View Article : Google Scholar : PubMed/NCBI
|
|
29
|
Gu YM, Ma YH, Zhao WG and Chen J:
Dickkopf3 overexpression inhibits pancreatic cancer cell growth in
vitro. World J Gastroenterol. 17:3810–3817. 2011. View Article : Google Scholar : PubMed/NCBI
|
|
30
|
Skalniak A, Boratyn E, Tyrkalska SD,
Horwacik I, Durbas M, Lastowska M, Jura J and Rokita H: Expression
of the monocyte chemotactic protein-1-induced protein 1 decreases
human neuroblastoma cell survival. Oncol Rep. 31:2385–2392.
2014.PubMed/NCBI
|
|
31
|
Dupasquier S, Delmarcelle AS, Marbaix E,
Cosyns JP, Courtoy PJ and Pierreux CE: Validation of housekeeping
gene and impact on normalized gene expression in clear cell renal
cell carcinoma: Critical reassessment of YBX3/ZONAB/CSDA
expression. BMC Mol Biol. 15:92014. View Article : Google Scholar : PubMed/NCBI
|
|
32
|
Smith PK, Krohn RI, Hermanson GT, Mallia
AK, Gartner FH, Provenzano MD, Fujimoto EK, Goeke NM, Olson BJ and
Klenk DC: Measurement of protein using bicinchoninic acid. Anal
Biochem. 150:76–85. 1985. View Article : Google Scholar : PubMed/NCBI
|
|
33
|
Edsjö A, Nilsson H, Vandesompele J,
Karlsson J, Pattyn F, Culp LA, Speleman F and Påhlman S:
Neuroblastoma cells with overexpressed MYCN retain their capacity
to undergo neuronal differentiation. Lab Invest. 84:406–417. 2004.
View Article : Google Scholar : PubMed/NCBI
|
|
34
|
Maris JM: Unholy matrimony: Aurora A and
N-Myc as malignant partners in neuroblastoma. Cancer Cell. 15:5–6.
2009. View Article : Google Scholar
|
|
35
|
Yang H, He L, Kruk P, Nicosia SV and Cheng
JQ: Aurora-A induces cell survival and chemoresistance by
activation of Akt through a p53-dependent manner in ovarian cancer
cells. Int J Cancer. 119:2304–2312. 2006. View Article : Google Scholar : PubMed/NCBI
|
|
36
|
Brodeur GM, Minturn JE, Ho R, Simpson AM,
Iyer R, Varela CR, Light JE, Kolla V and Evans AE: Trk receptor
expression and inhibition in neuroblastomas. Clin Cancer Res.
15:3244–3250. 2009. View Article : Google Scholar : PubMed/NCBI
|
|
37
|
Tacconelli A, Farina AR, Cappabianca L,
Desantis G, Tessitore A, Vetuschi A, Sferra R, Rucci N, Argenti B,
Screpanti I, et al: TrkA alternative splicing: A regulated
tumor-promoting switch in human neuroblastoma. Cancer Cell.
6:347–360. 2004. View Article : Google Scholar : PubMed/NCBI
|
|
38
|
Haapasalo A, Sipola I, Larsson K, Akerman
KE, Stoilov P, Stamm S, Wong G and Castren E: Regulation of TRKB
surface expression by brain-derived neurotrophic factor and
truncated TRKB isoforms. J Biol Chem. 277:43160–43167. 2002.
View Article : Google Scholar : PubMed/NCBI
|
|
39
|
Li Z, Tan F, Liewehr DJ, Steinberg SM and
Thiele CJ: In vitro and in vivo inhibition of neuroblastoma tumor
cell growth by AKT inhibitor perifosine. J Natl Cancer Inst.
102:758–770. 2010. View Article : Google Scholar : PubMed/NCBI
|
|
40
|
Li Z, Jaboin J, Dennis PA and Thiele CJ:
Genetic and pharmacologic identification of Akt as a mediator of
brain-derived neurotrophic factor/TrkB rescue of neuroblastoma
cells from chemotherapy-induced cell death. Cancer Res.
65:2070–2075. 2005. View Article : Google Scholar : PubMed/NCBI
|
|
41
|
Motti ML, De Marco C, Califano D, Fusco A
and Viglietto G: Akt-dependent T198 phosphorylation of
cyclin-dependent kinase inhibitor p27kip1 in breast cancer. Cell
Cycle. 3:1074–1080. 2004. View Article : Google Scholar : PubMed/NCBI
|
|
42
|
Viglietto G, Motti ML and Fusco A:
Understanding p27(kip1) deregulation in cancer: Down-regulation or
mislocalization. Cell Cycle. 1:394–400. 2002. View Article : Google Scholar
|
|
43
|
Perry SW, Norman JP, Barbieri J, Brown EB
and Gelbard HA: Mitochondrial membrane potential probes and the
proton gradient: A practical usage guide. Biotechniques. 50:98–115.
2011. View Article : Google Scholar : PubMed/NCBI
|
|
44
|
Mizushima N, Yoshimori T and Levine B:
Methods in mammalian autophagy research. Cell. 140:313–326. 2010.
View Article : Google Scholar : PubMed/NCBI
|
|
45
|
Li MX and Dewson G: Mitochondria and
apoptosis: Emerging concepts. F1000Prime Rep. 7:422015.PubMed/NCBI
|
|
46
|
Zhao J, Zhang J, Yu M, Xie Y, Huang Y,
Wolff DW, Abel PW and Tu Y: Mitochondrial dynamics regulates
migration and invasion of breast cancer cells. Oncogene.
32:4814–4824. 2013. View Article : Google Scholar
|
|
47
|
Gottlieb E, Vander Heiden MG and Thompson
CB: Bcl-x(L) prevents the initial decrease in mitochondrial
membrane potential and subsequent reactive oxygen species
production during tumor necrosis factor alpha-induced apoptosis.
Mol Cell Biol. 20:5680–5689. 2000. View Article : Google Scholar : PubMed/NCBI
|