Introduction
Liver cancer is one the most frequently encountered
cancers and the second most frequent cause of cancer-related death
worldwide (1,2). The most common type of liver cancer
is hepatocellular carcinoma (HCC) that accounts for 85–90% of the
liver cancer (3). Currently,
platinum-analogue agents are the widely used chemotherapeutic drugs
for treating HCC (4). The
platinum-based analogs, including cisplatin and carbo-platin,
formed DNA crosslinks that significantly attenuated the growth of
tumors. However, their use is restricted by the development of
resistance (5–7). The acquired drug resistance to
platinum analogue regimen is responsible for the diminished
efficacy in HCC patient treatments. Therefore, more new effective
therapy strategies are constantly needed.
Previously, we reported that a small molecular
weight indolylquinoline derivative with connection of indole and
quinoline functional groups,
3-((7-ethyl-1H-indol-3-yl)-methyl)-2-methylquinoline (EMMQ), that
reduced the growth of human lung cancer cells through apoptotic
death (8). The newly synthetic
EMMQ available in the authors’ group has not been assessed for
preventive, protective and usefulness in different diseases. To
demonstrate the effectiveness of the compound, more systematic
investigations in different types of cancer are undertaken. This
study found that EMMQ is effective in suppressing the growth in HCC
cells and the developed apoptosis accounts for the drug
sensitivity. The study showed that the reduced cell viabilities in
HepG2 cells began with DNA damage, followed by the decrease of
mitochondrial membrane potential (ΔΨm). Generation of reactive
oxygen species (ROS) and release of cytochrome c contributed
to final apoptotic cell death. The development of apoptosis in
HepG2 cells began with DNA damage and activation of tumor
suppressor p53 that contributed to cleavage of poly(ADP-ribose)
polymerase (PARP) and procaspase-3 in addition to attenuation of
pro-survival signals. Furthermore, transfection of small hairpin
RNA (shRNA) of p53 suppressed DNA damage and restored mitochondrial
functions that recovered cell viabilities and reduced drug
sensitivity. In view of the constant need to acquire more drugs for
chemotherapy, the elucidated mechanism provides EMMQ a new
perspective to treat human liver cancer cells.
Materials and methods
Cell culture and chemicals
Human hepatocellular carcinoma cell lines, HepG2
(wild-type p53) and Hep3B (p53-null) were acquired from the
American Type Culture Collection (ATCC; Manassas, VA, USA). Huh7
(mutant p53) cells were from the Japanese Collection of Research
Bioresources (http://p53.free.fr/Database/Cancer_cell_lines/HCC.html).
Normal human liver cell line L02 was purchased from the Chinese
Academy of Science Committee Type Culture Collection Cell Bank
(Wuhan, China). The cells were cultured in Dulbecco’s modified
Eagle’s medium (DMEM) supplemented with L-glutamine, sodium
pyruvate and 10% fetal bovine serum (FBS) at 37°C in a humidified
atmosphere with 5% CO2. The synthetic indolylquinoline,
EMMQ, was prepared according to the procedures previously described
(8).
Cell growth assay
Cell growth inhibition or cell numbers were
determined by measuring dye absorbance of
3-(4,5-dimeth-ylthiazol-2yl)-2,5-diphenyltetrazolium bromide (MTT)
or counting trypan blue exclusion cells. A density of
3×10³ cells/well were seeded in 96-well microtiter
plates for MTT assay. Cells were allowed to attach overnight and
then treated with various concentrations of EMMQ in 2%
serum-supplemented media at 37°C for 48 h. After removing the
supernatant, formazan crystals were dissolved in 100 μl dimethyl
sulfoxide (DMSO) and the absorbance measured at 570 nm. The
concentration inhibiting 50% growth was determined as
IC50.
Colony forming assay
Cells were seeded at 500 cells/well in a 12-well
plates for 16 h to allow for attachment. The cells were treated
with various concentrations of EMMQ or vehicle control for 48 h at
37°C and 5% CO2 in a humidified environment. After 10
days, the plates were washed twice in phosphate-buffered saline
(PBS), fixed with paraformaldehyde, stained with 0.05% crystal
violet, washed with PBS and air-dried. The sizes and numbers of
stained colonies composing of >50 cells were counted under
inverted phase contrast microscope. Colony formation containing
colony numbers with >50 cells was calculated and converted as
percentage relative to DMSO control.
Comet assay
The cells as cultured in 12-well plates at a density
of 1×10⁵ cells/well were incubated with various
concentrations of EMMQ at different time-points. Afterwards, cells
were harvested and mixed with low melting point agarose at 37°C.
This mixture was placed on the top of the slide with 0.5% agarose,
and then covered with a coverslip until solidified. Subsequently,
the coverslip was removed gently and more agarose added and covered
again. The slide was placed until the mixture became solid, and put
in chilled alkaline lysis buffer for electrophoresis. The slide was
then gently washed with neutralized buffer and stained with
propidium iodide (PI; Aldrich-Sigma, St. Louis, MO, USA). The tails
were observed under a fluorescence microscope and quantified using
CometScore™ software and scored for tail moment that equals the
measured tail length multiplied with fraction of total DNA in the
tail.
Flow cytometric analysis of the cell
cycle
Cells were pretreated with nocodazole (200 ng/ml;
Aldrich-Sigma) for 24 h to arrest cells at the
G2/M-phase and changed to fresh medium for 3 h to
synchronize cells in G1-phase before being treated with
EMMQ for 48 h and collected by trypsin-EDTA and 3,000 rpm
centrifugation for 5 min. The cell pellet was suspended with 70%
ethanol at −20°C overnight, washed with PBS, then incubated with
10μg/ml RNase A and PI, respectively, for 20 min in darkness at
37°C. Flow cytometry was used to detect cell cycle distribution.
Data were plotted and analyzed by FlowJo software.
Measurement of intracellular reactive
oxygen species
The intracellular reactive oxygen species (ROS) was
detected by staining cells with 2′,7′-dichlorofluorescein diacetate
(DCF-DA). The hepatocellular carcinoma cells were cultured in
12-well plates at a density of 1×10⁵ cells/well and
incubated with various concentrations of EMMQ for 6 and 24 h,
respectively. Cells were incubated with 10 μM DCF-DA for 30 min at
37°C. Cells were washed twice with PBS (pH 7.4), and the
fluorescence intensity was recorded by flow cytometer FACSCalibur™
(BD Bioscience, San Jose, CA, USA). Data were analyzed using FlowJo
software (FlowJo, LLC Ashland, OR, USA).
Double staining with Annexin V-FITC and
PI
Cells were seeded at 1×10⁵ cells/well in
12-well plates and treated with various concentrations of EMMQ and
incubated at 37°C for 48 h. The cells were trypsinized and stained
with 1 μl Annexin V/FITC (20 μg/ml; BD Biosciences) and 1 μl of PI
(50 μg/ml) at 37°C for 30 min in the dark. The early and late phase
of apoptosis was analyzed by Annexin V-FITC/PI apoptosis detection
kit (BD Biosciences). The flow cytometer FACSCalibur (BD
Biosciences) was used for analysis. Data were analyzed using the
FlowJo software.
Mitochondrial membrane potential
(ΔΨm)
Mitochondrial membrane potential was determined
using MitoPT™ JC-1 assay kit (ImmunoChemistry Technologies,
Bloomington, IN, USA). Briefly, the cells were cultured in medium
containing various concentration of EMMQ and incubated at 37°C for
different time-points. The collected cells were washed with 1X
assay buffer. After centrifugation at 1,000 rpm for 5 min, cell
pellets were stained with 250 μl mixture containing 5 μl of
5,5′,6,6′-tetrachloro-1,1′,3,3′-tetraethyl
benzimidazolocarbo-cyanine iodide (JC-1) with 995 μl 1X assay
buffer for 25 min at 37°C. The residual JC-1 were removed by
centrifugation at 1,000 rpm for 5 min. The pellet was mixed with 1X
assay buffer. JC-1 fluorescence was measured to assess the emission
shift from green (530 nm) to red (590 nm) using the 488 nm
excitation wavelength. Data were given as the relative ratio of
green to red fluorescence intensities, indicating the level of
depolarization of the mitochondrial membrane potential. The
FACSCalibur flow cytometer (BD Biosciences) was used for analysis.
Data were quantified and expressed as the percentage of
mitochondrial membrane potential decline relative to control
cells.
Western blot analysis
The collected cells were lysed and the protein
concentrations quantitated using BCA assay (Pierce Biotechnology,
Rockford, IL, USA). The total 20 μg of protein was resolved by
electrophoresis through SDS-PAGE gel. The gel was transferred to
nitrocellulose filters, blocked with 5% of skim milk (BD
Biosciences, Mansfield, MA, USA) and incubated with primary
antibody for 24 h followed by horseradish-conjugated secondary
antibodies. The emitted chemiluminescence signals were visualized
by ECL detection kit (Millipore, Darmstadt, Germany).
Transfection with small hairpin RNA
(shRNA)
The HepG2 hepatocellular carcinoma cells were seeded
at 5×10⁵ cells/dish in 60-mm dishes and incubated
overnight. Cells were transfected with shRNA targeting of p53 with
non-specific shRNA (NS) as control prior to treatment. After a
period of 24-h transfection, cells were treated with EMMQ for 48 h.
Cell lysates were collected for western blot analysis. Small
hairpin RNA targeting RNA sequence of p53 (CACCAUCCACUA CAACUACAU)
along with that of scrambled NS gene (CC GGACACUCGAGCACUUUUUG) were
acquired from the National RNAi Platform (Academia Sinica, Taipei,
Taiwan).
Isolation of mitochondria and cytosol
fractions
Mitochondria and cytosol fractions were separated
using the kit according to the manufacturer’s instructions
(BioVision, Milpitas, CA, USA). The total 5×10⁵ cells
were collected after centrifugation at 600 × g for 5 min at 4°C.
Cells were washed with 10 ml of ice-cold PBS and centrifuged at 600
× g for 5 min at 4°C. The supernatant was removed. Cells were mixed
with 1.0 ml of 1X cytosol extraction buffer mixture containing DTT
and protease inhibitors and incubated on ice for 10 min. The
homogenate was transferred to a 1.5 ml microcentrifuge tube and
centrifuged at 700 × g for 10 min in 4°C. The supernatant was
gathered and the pellet discarded. The collected supernatant was
centrifuged at 10,000 × g for 30 min at 4°C. The supernatant was
stored at −80°C (cytosol fraction) and the pellets were resuspended
in 100 μl of 1X mitochondrial extraction buffer mixture containing
1,4-dithiothreitol (Aldrich-Sigma) and protease inhibitors. The
mitochondrial fraction mixture was stored at −80°C. Both lysed
cytosol and mitochondrial fractions were used for western blot
analysis.
Statistical analysis
Experiments were performed independently three
times. The differences between the treated and the control cells
were analyzed using the Student’s t-test between the two groups, or
one-way ANOVA was applied to compare more than two groups. The data
were expressed as mean values ± SD of three independent experiments
and P<0.05 considered statistically significant.
Results
EMMQ inhibits cell proliferation in human
liver cancer cells
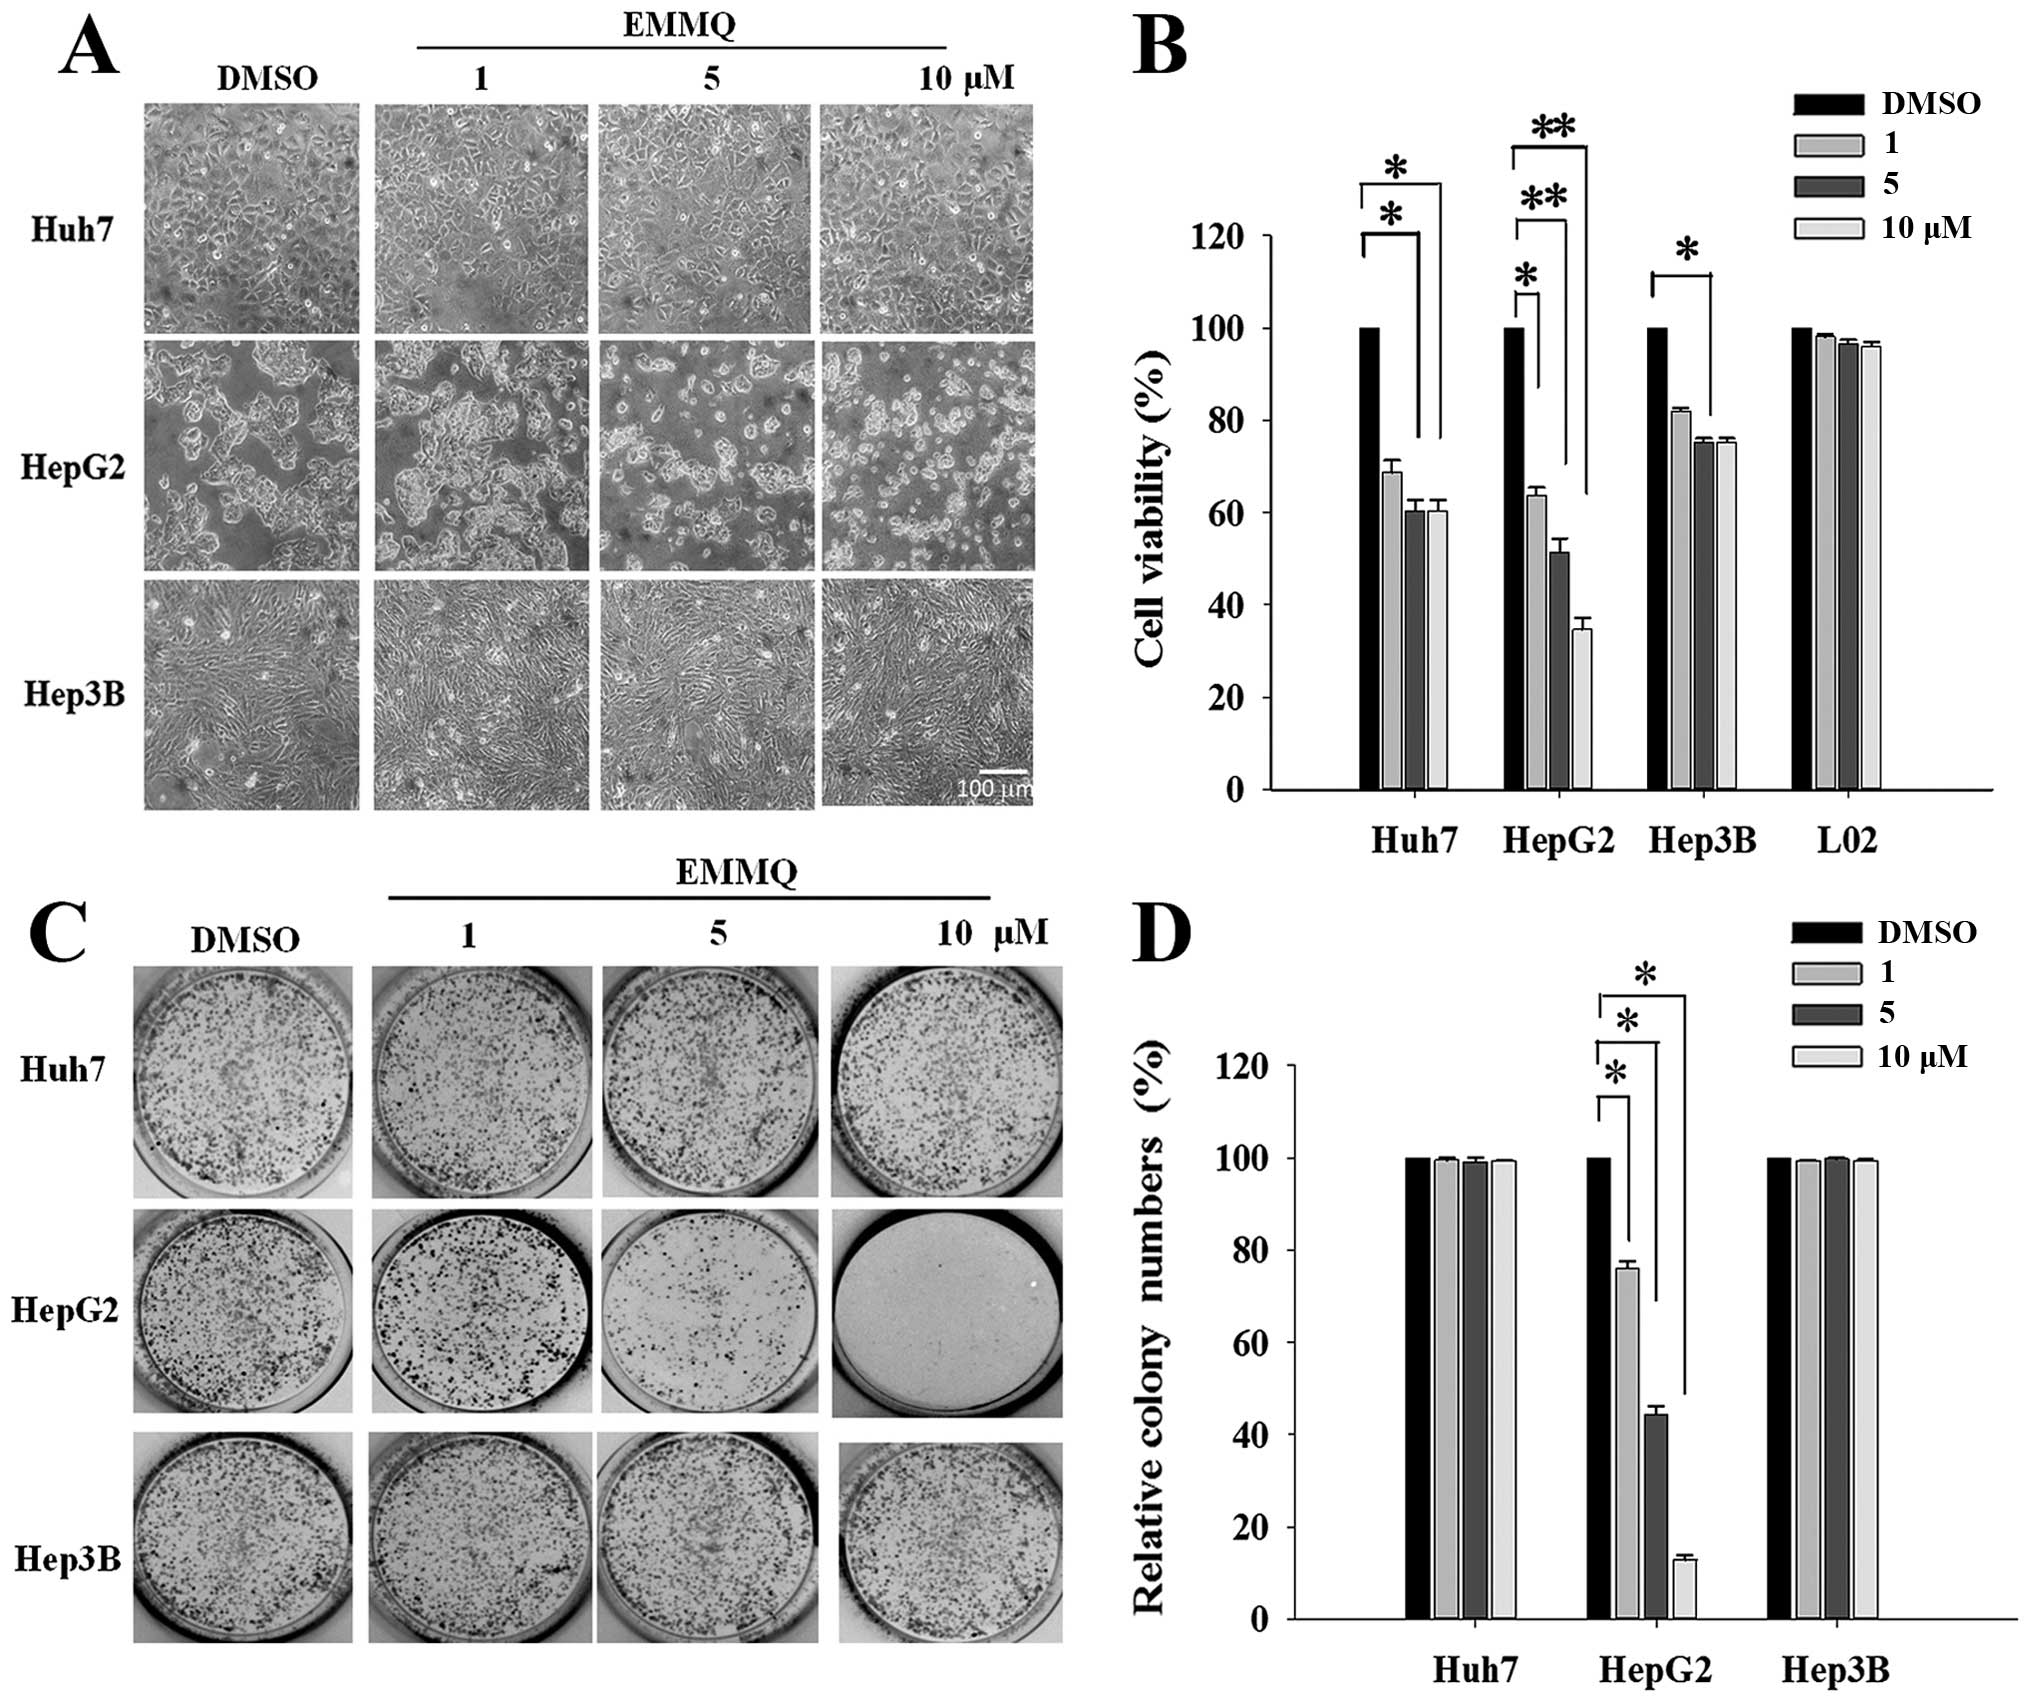
Morphological examination showed that HepG2 cells
became round and blunt in shape with smaller sizes as EMMQ
concentrations were increased after 48-h treatment; while there was
no effect observed in Huh7 and Hep3B cells (Fig. 1A). The EMMQ-reduced cell viability
in HepG2 cells was dose-dependent with an IC50 of 5 μM
as shown in MTT assay (Fig. 1B).
No apparent growth inhibition was observed in Huh7 and Hep3B cells
or normal human hepatic cells L02 within the concentrations
studied. In addition, the colony formation capacity was
significantly suppressed in HepG2 cells with increasing EMMQ
concentrations (Fig. 1C). The
number of colonies was reduced to <50% of the control as the
drug concentration was raised to 5 μM and there showed no apparent
inhibitory effect in cells with mutated p53 (Fig. 1D).
EMMQ increases sub-G1
population cells, G1 arrest and apoptosis in HepG2
cells
To evaluate whether EMMQ disturbed cell cycle
distribution, cells were treated with various concentrations of the
drug for 48 h and analyzed by flow cytometry following PI staining.
Compared with vehicle control, EMMQ increased sub-G1
populations in HepG2 cells and the effects were dose-dependent,
while both Huh7 and Hep3B cells were not changed (Fig. 2A). Furthermore, HepG2 cells exposed
to various concentrations of EMMQ were analyzed by Annexin V and PI
double staining-based assay flow cytometry (Fig. 2B). By treating with 10 μM of EMMQ
for 48 h, cells of early and late apoptotic phase populations rose
to 27 and 31%, respectively (Fig.
2C). The results implied that the enhanced sub-G1
populations contributed to decreased cell viabilities in HepG2
cells.
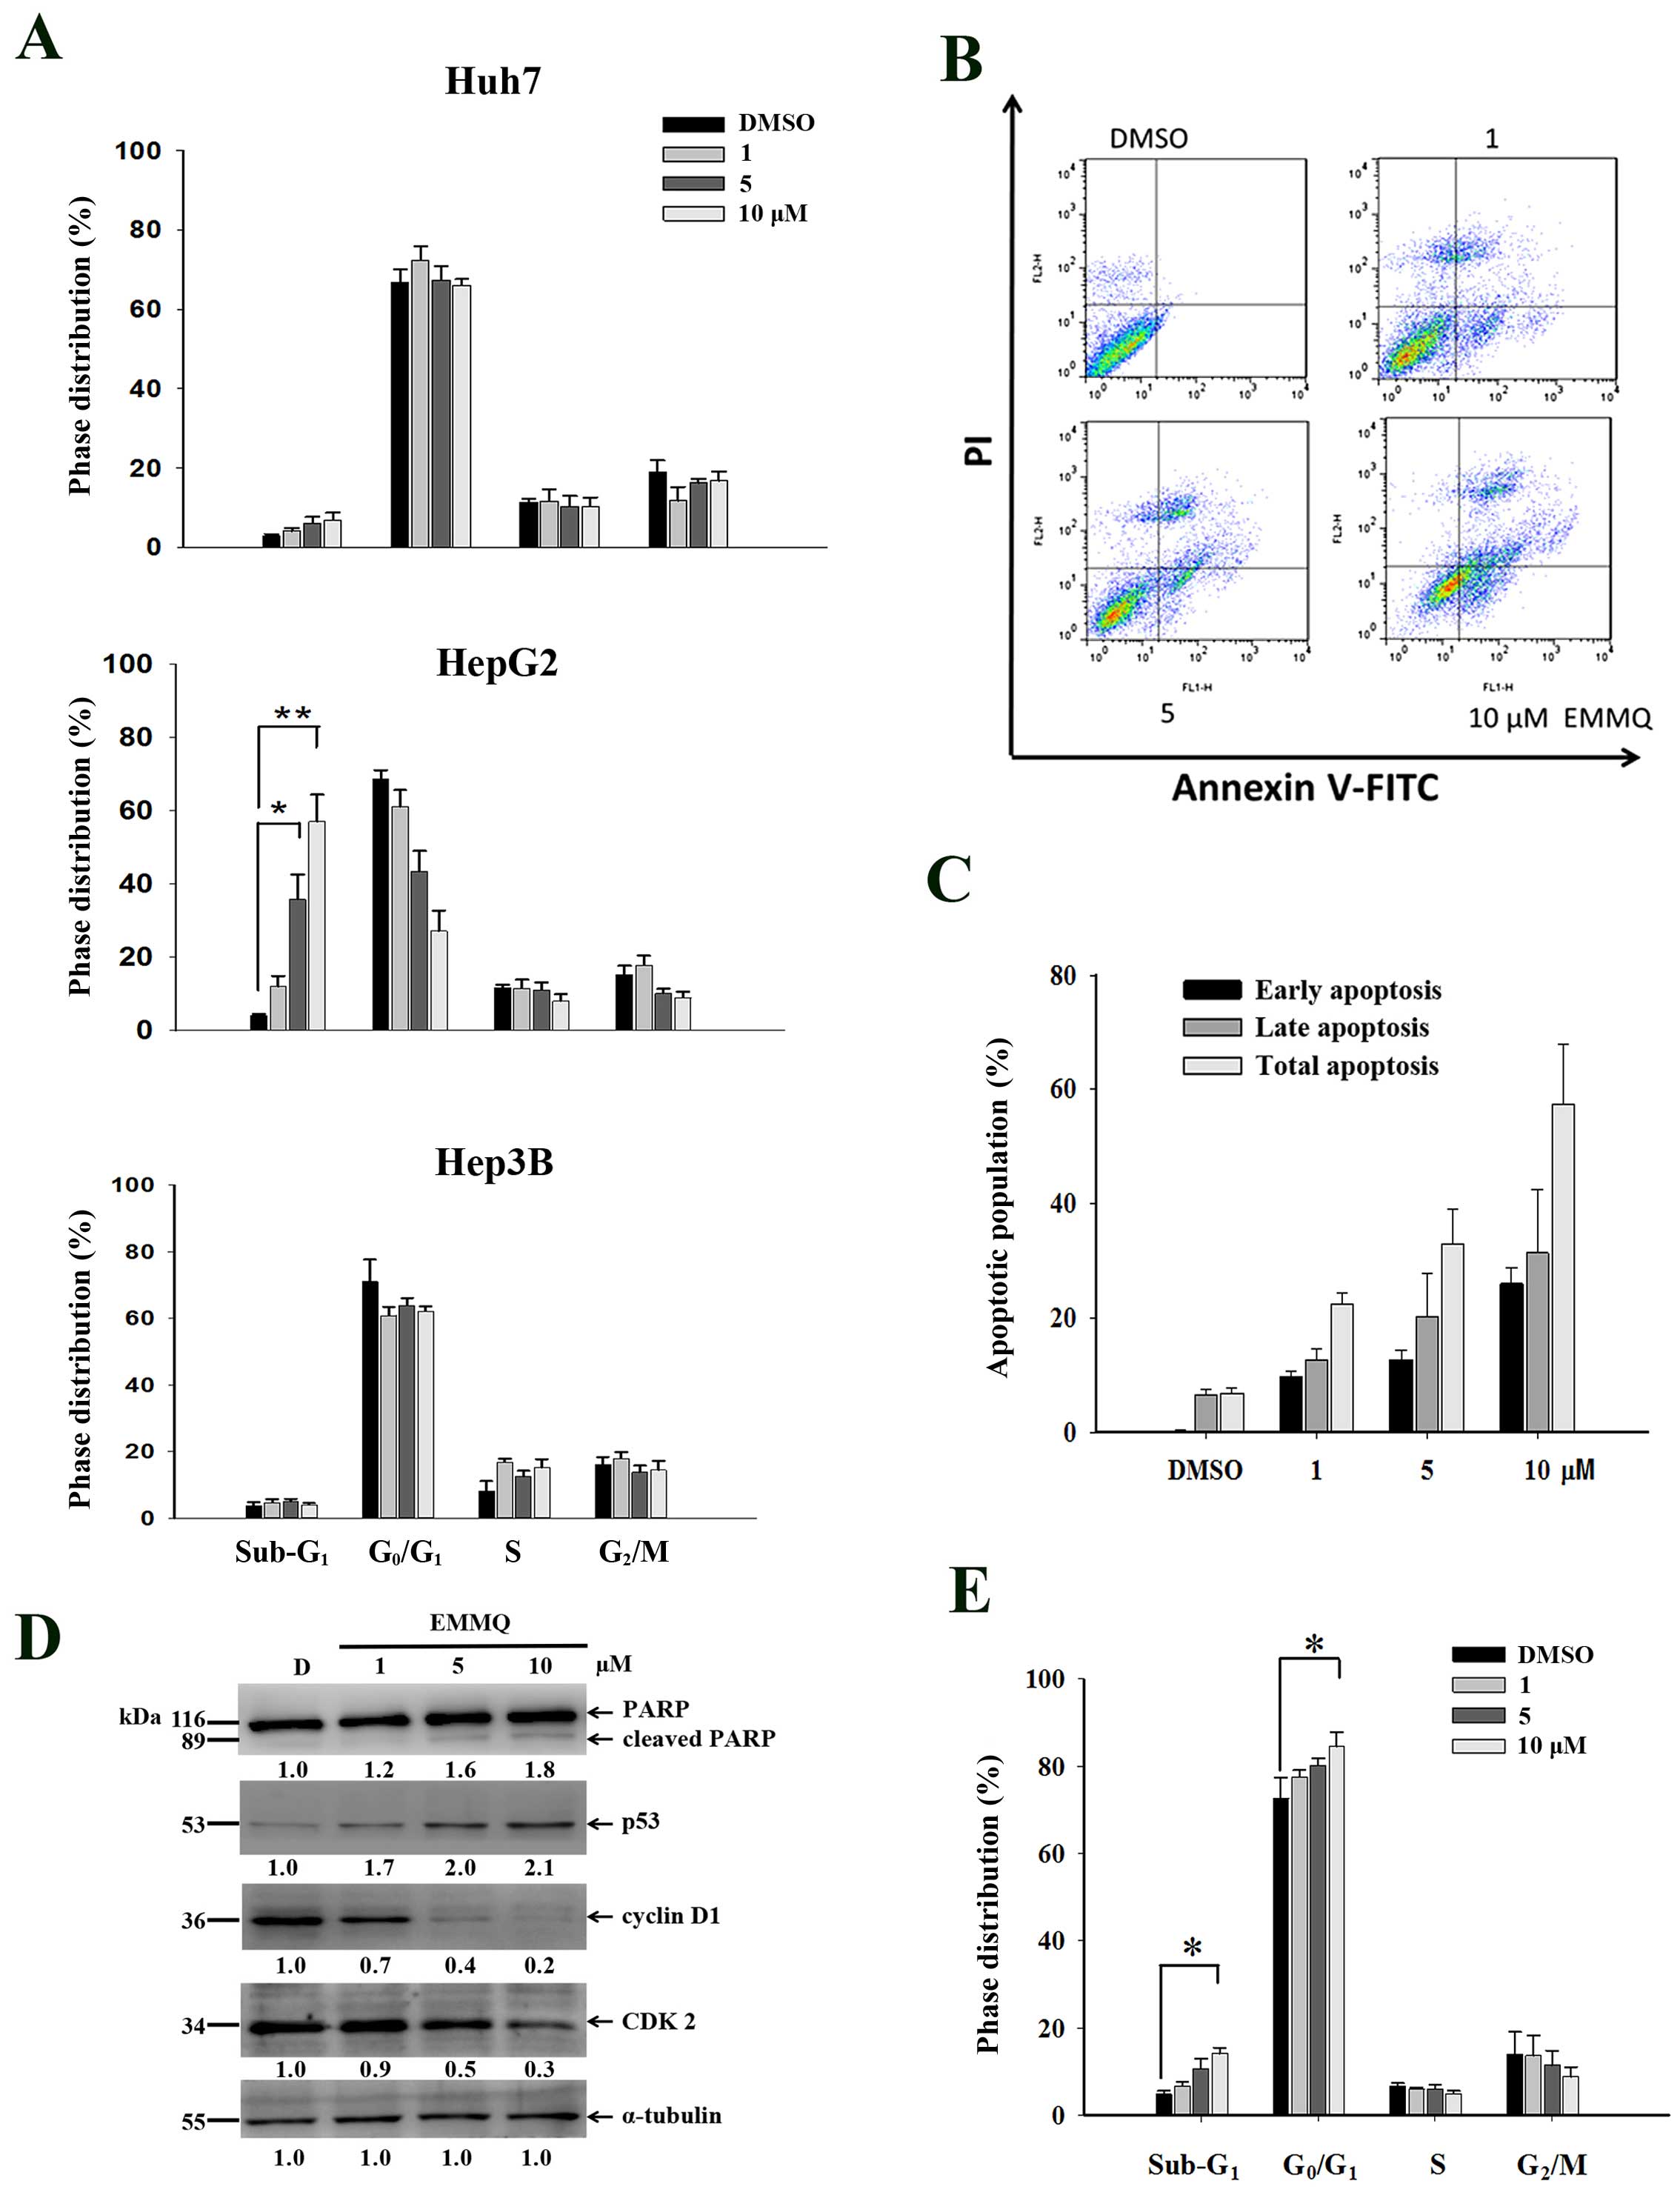 | Figure 2EMMQ treatment induced cell cycle
distribution changes. (A) Huh7, HepG2 and Hep3B cells were treated
with various concentrations of EMMQ, stained with PI and determined
for cell cycle distribution by flow cytometry as described in
Materials and methods. The sub-G1 phase cells were
increased with escalating EMMQ concentrations in HepG2 cell after
48 h. *P<0.05 and **P<0.01. (B)
Two-dimensional flow analysis in cells treated with various
concentrations of EMMQ for 48 h and analyzed by flow cytometry
after double staining cells with Annexin V-FITC/PI. (C)
Quantitative analysis of apoptotic cell populations. Both the early
(dark), late (grey) and total (light) apoptotic population
distribution in cells treated with various concentrations of EMMQ
or DMSO control, D, are expressed as mean values ± SD from three
independent experiments. (D) Protein lysates as collected from
HepG2 cells after treating with various concentrations of EMMQ for
24 h were subjected to western blot analysis by incubating with
antibodies against PARP, p53, cyclin D1, CDK2 and control
α-tubulin, followed by 1:3,000 dilution of horseradish
peroxidase-conjugated secondary antibody and then developed by ECL
detection system. The numbers underneath each band signify relative
intensities at each concentration by comparing with that of vehicle
control DMSO, D. (E) The induced G0/G1 cell
accumulation in HepG2 cells after 24 h with various concentrations
of EMMQ as analyzed by PI-stained flow cytometry.
*P<0.05. |
To assure DNA was affected during cell cycle
variation, western blot analysis of protein lysates in HepG2 cells
treated with EMMQ for 24 h showed that p53 began activated and PARP
was cleaved. The suppressed cyclin D1 and CDK2 expression (Fig. 2D) starting with 5 μM of EMMQ
progressively arrested cells (Fig.
2E) before the onset of apoptosis.
EMMQ induces HepG2 cell apoptosis because
of DNA damage
The extent of DNA damage at various concentrations
and different time-points were determined by comet assay. The
nucleus-excluded tails with migration smear indicating DNA lesions
emerged 3 h after EMMQ treatment (Fig.
3A). The dose-dependent development of the excluded tail length
in HepG2 cells began 3 h after EMMQ treatment and rose temporally
(Fig. 3B). There is no apparent
tail length formation in Huh7 and Hep3B cells within the
concentrations studied after 24-h treatment (Fig. 3C and D).
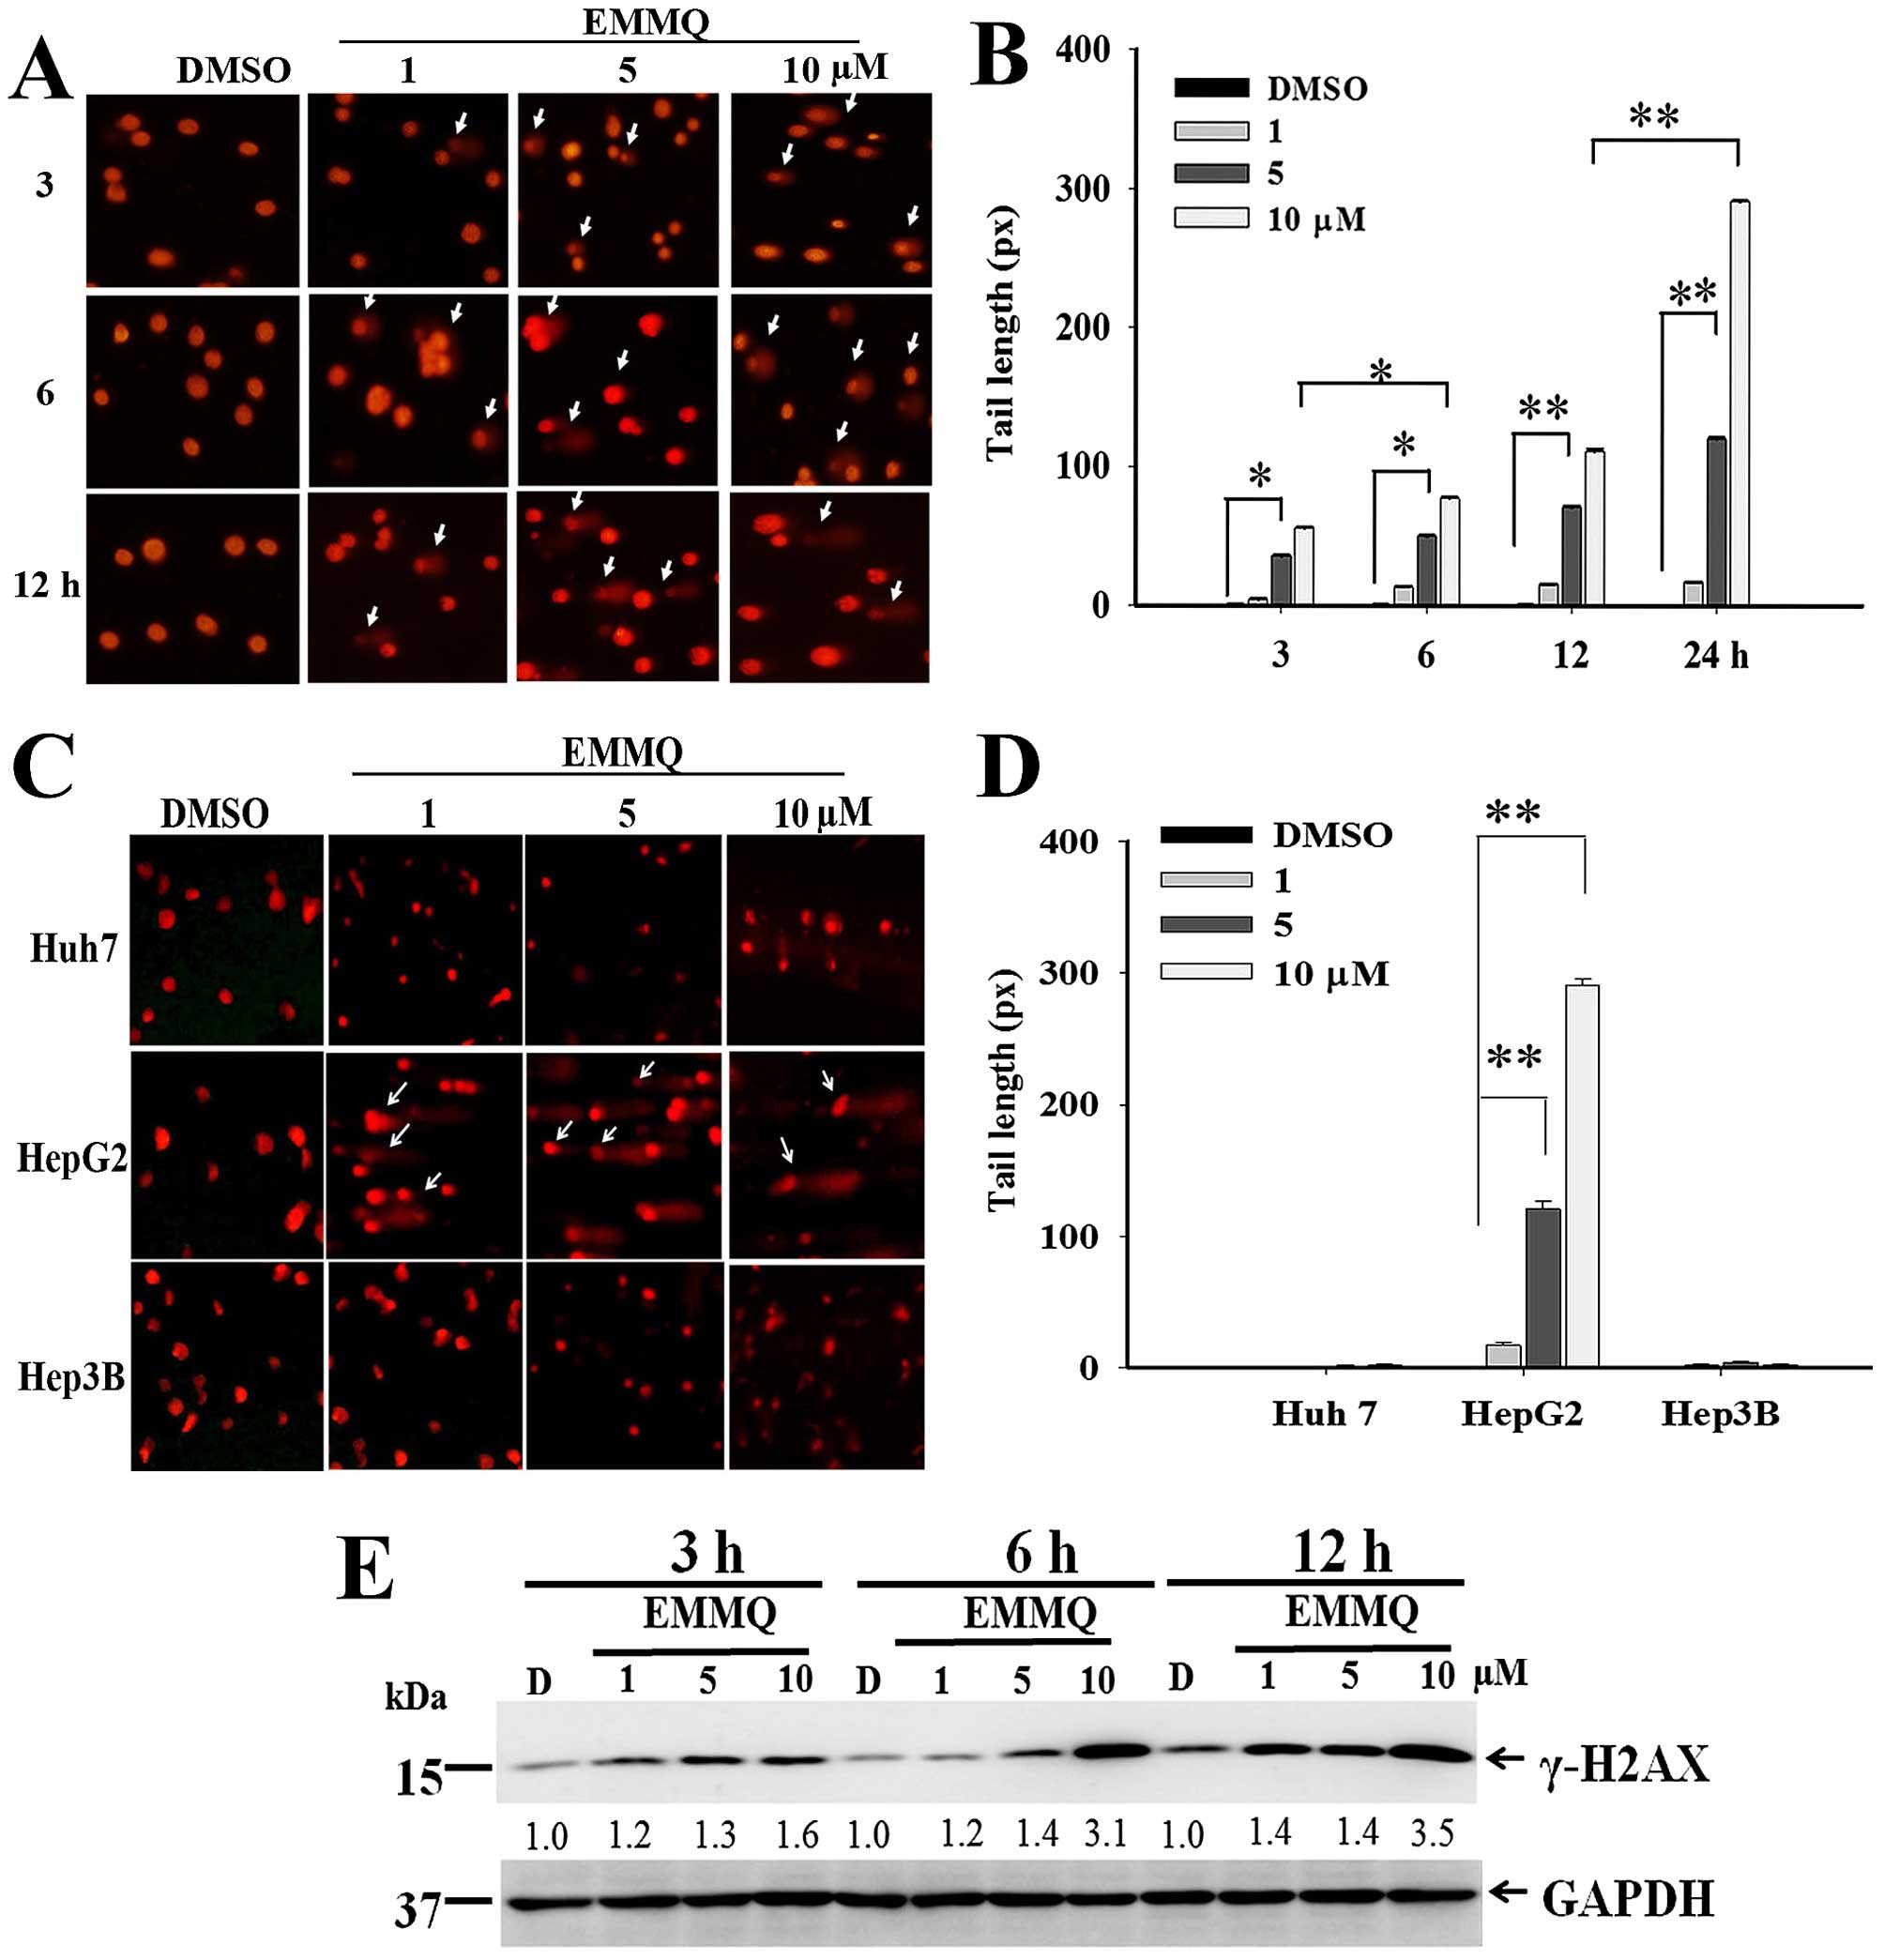 | Figure 3EMMQ induced DNA damage (A) HepG2
cells were treated with various concentrations of EMMQ for the time
periods as indicated. The collected cells were evaluated for DNA
damage by comet assay as described in Materials and methods. The
apparent tail formation (pointed arrow) marked time- and
dose-dependent DNA damage. (B) HepG2 cells as treated with EMMQ at
various concentrations for 3, 6, 12 and 24 h, respectively, were
analyzed for their DNA tail formations as observed under a
fluorescence microscope. The results were quantified using
CometScore™ software and scored for tail moments that equal the
measured tail length multiplied with fraction of total DNA in the
tail. The tail moments were expressed as mean values ± SD and
*P<0.05 and **P<0.01 indicate a
significant difference from three independent experiments. (C) All
Huh7, HepG2 and Hep3B cells were treated with EMMQ at various
concentrations for 24 h. Cells were evaluated for DNA damage by
comet assay. The increased DNA damage appeared as smeared tail
(pointed arrow) in HepG2 cells. (D) All Huh7, HepG2 and Hep3B cells
were treated with EMMQ at various concentrations for 24 h. The
results of comet assay were quantified using CometScore™ software
and scored for tail moments that equal the measured tail length
multiplied with fraction of total DNA in the tail. The tail moments
were expressed as mean values ± SD and *P<0.05 and
**P<0.01 indicate a significant difference from three
independent experiments. (E) Protein lysates as collected from
HepG2 cells after treating with various concentrations of EMMQ for
3, 6 and 12 h were examined for western blot analysis with GAPDH
(glyceraldehyde-3-phosphate dehydrogenase) as loading control. The
blots were incubated with γ-H2AX antibody, followed by secondary
antibody and visualized by ECL detection system. The numbers
underneath represented relative intensities by comparing treatment
of various concentrations with that of vehicle control DMSO, D, at
each time-point. |
Western blot analysis showed that EMMQ activated
double-strand DNA break marker γ-H2AX after 3-h treatment. The
increased drug concentrations accentuated time-course increment of
DNA damage signals (Fig. 3E). The
results suggested that human liver cancer cells with wild-type p53
were susceptible to DNA damage by EMMQ.
EMMQ induces HepG2 cells apoptosis
through mitochondrial membrane permeabilization (ΔΨm) loss and ROS
production
The mitochondria-related apoptotic pathway can be
linked to membrane potential disruption that signaled dysfunction
of the organelle. After 6-h treatment, EMMQ initiated loss of ΔΨm
by more than 50% in HepG2 cells compared with vehicle control
(Fig. 4A). As cells undergo
stress, ROS contributed to cell cycle arrest or final apoptosis.
Flow cytometry in cells stained with fluorescent dye DCF-DA is a
good marker to measure membrane potential variations. Compared to
DMSO treatment, the increased fluorescence intensities as measured
by flow cytometry suggested that intracellular ROS was developed in
HepG2 cells by EMMQ, but not in Hep3B and Huh7 cells (Fig. 4B), and the intensities arose to
more than 50% after 24-h treatment relative to control (Fig. 4C).
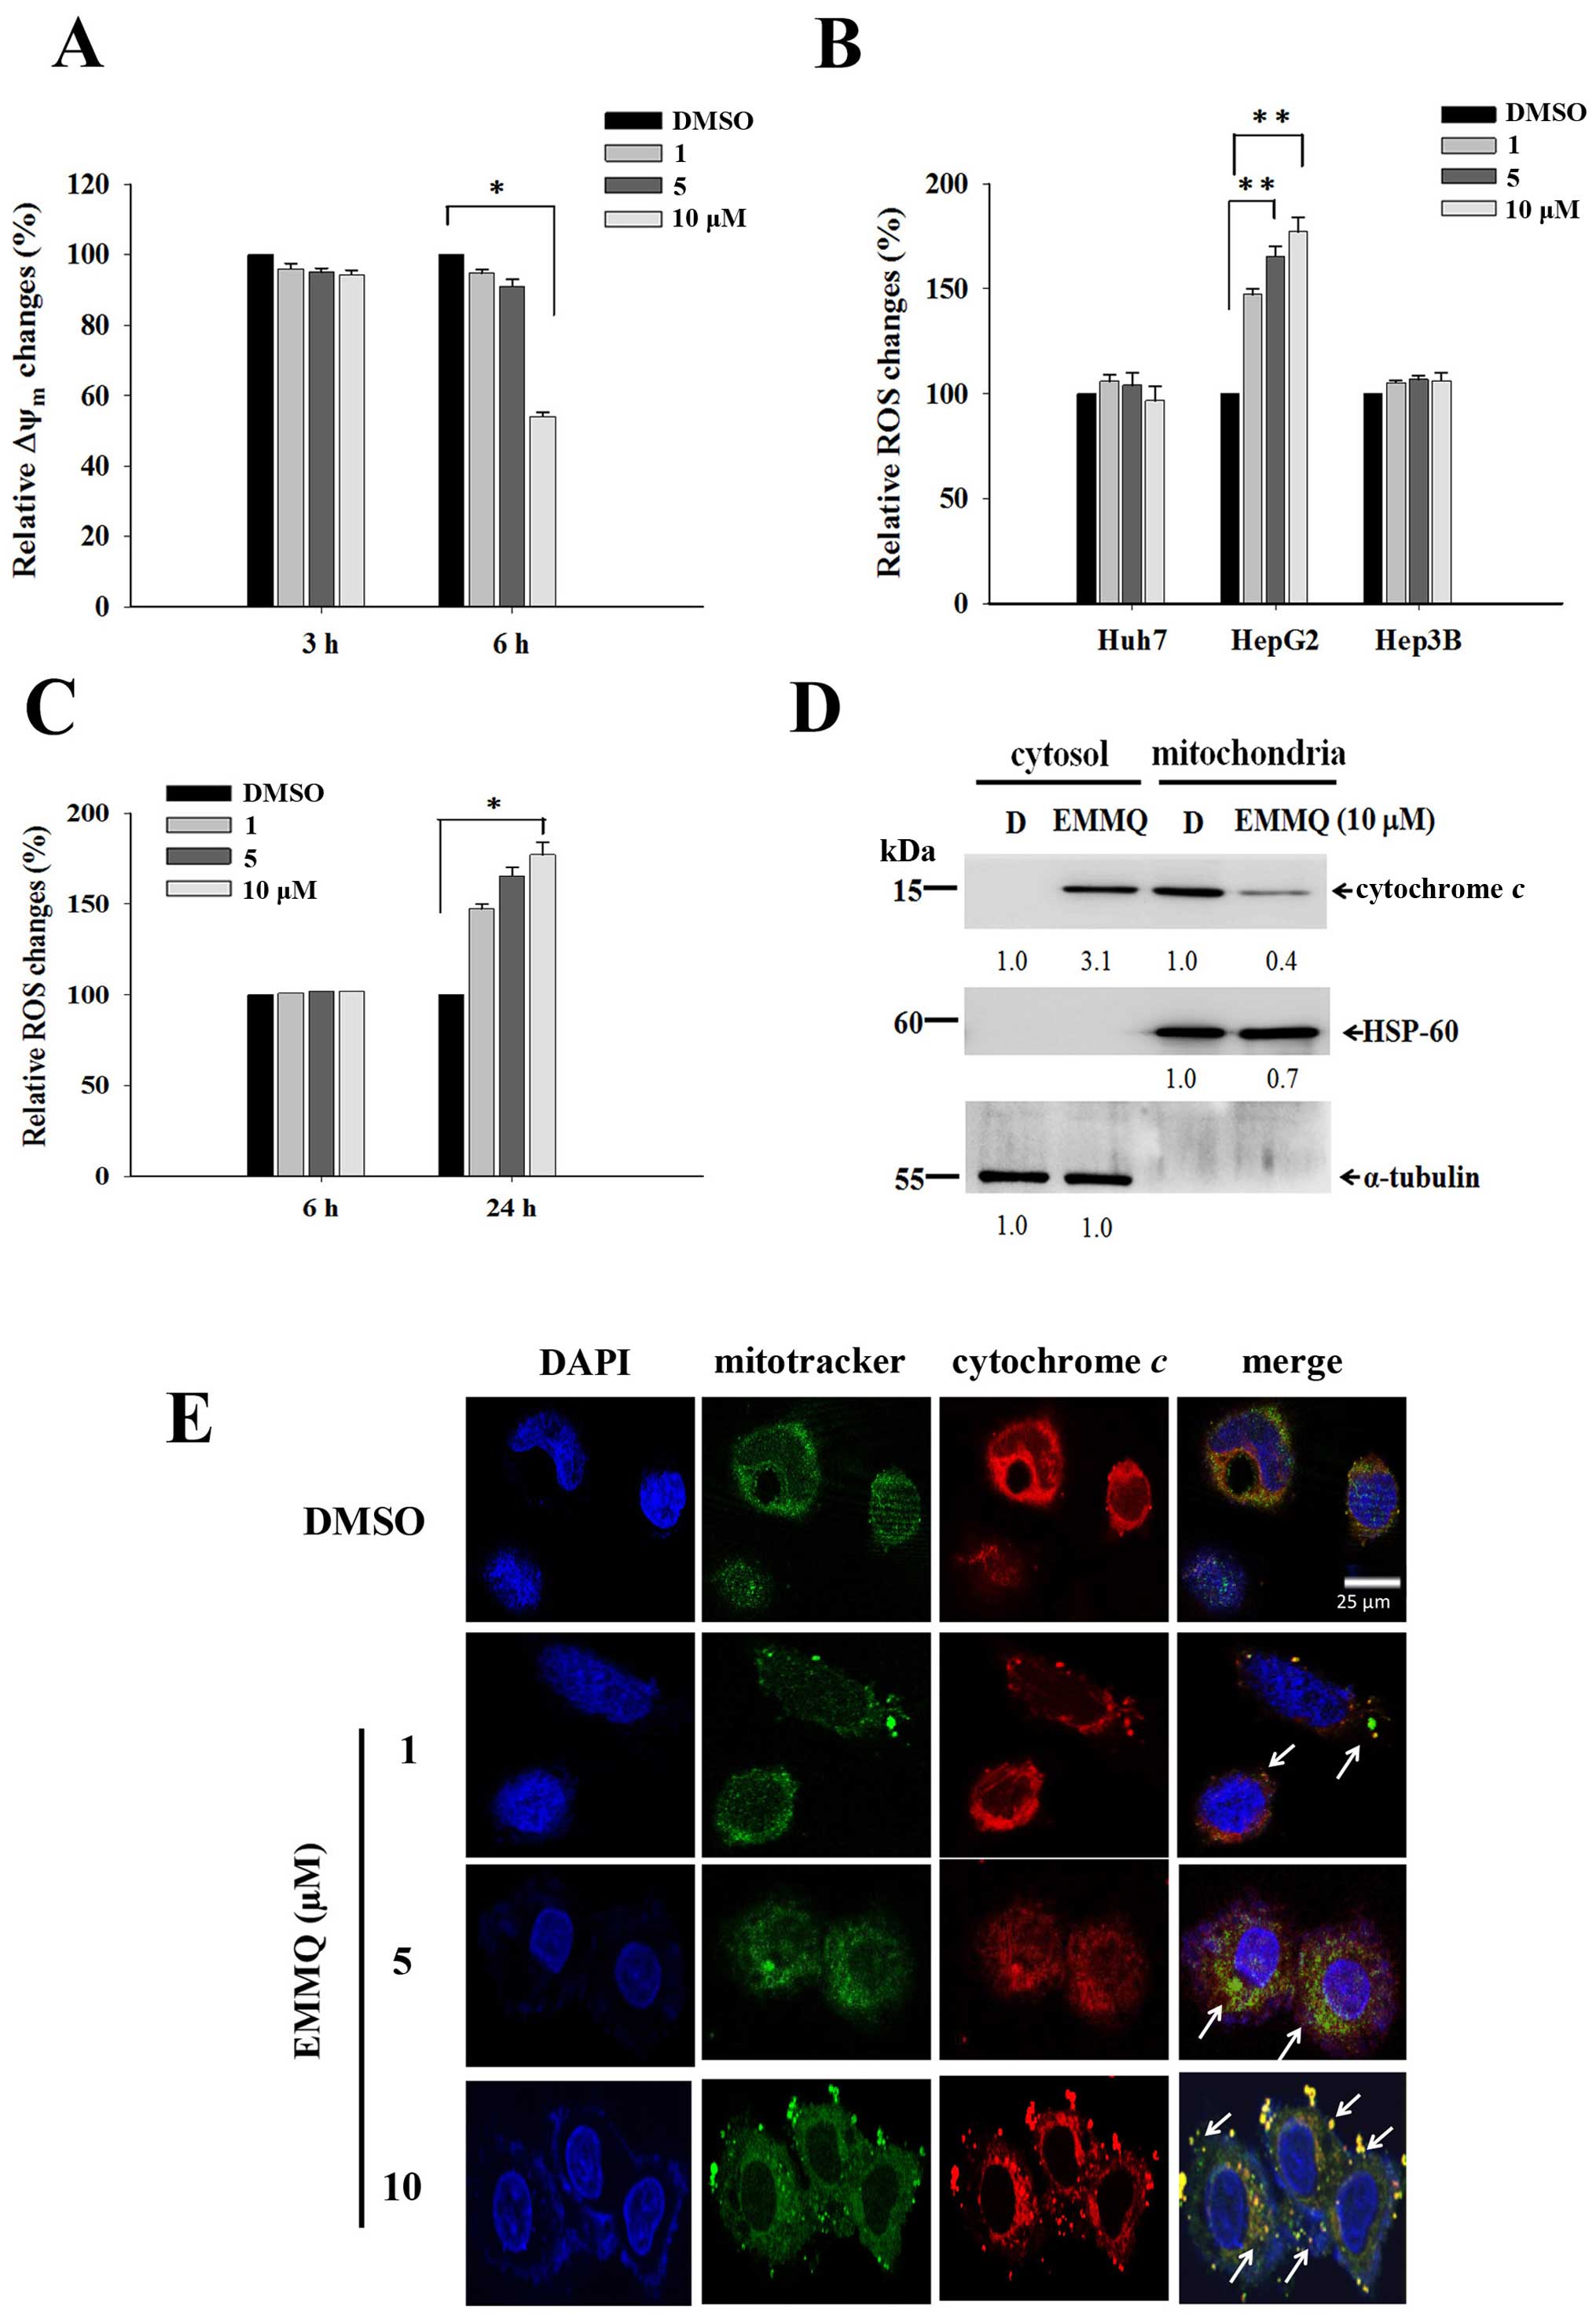 | Figure 4EMMQ reduces mitochondrial membrane
potential (ΔΨm) and enhances cytochrome c release in HepG2
cells. (A) ΔΨm changes after EMMQ treatment. Cells treated with
various concentrations of EMMQ in HepG2 cells for 3 and 6 h were
evaluated for relative ΔΨm changes. Data are presented as the mean
values ± SD. *P<0.05 indicated a significant
difference with vehicle control DMSO in HepG2 cells from three
independent experiments. (B) Relative ROS changes. The Huh7, HepG2
and Hep3B cells were treated with various concentrations of EMMQ
for 24 h. For each cell line, the detected ROS levels were compared
with that of cells treated with DMSO that served as 100% control.
**P<0.01 indicated a significant difference against
the vehicle control cells from three independent experiments. (C)
Temporal ROS changes in HepG2 cells. Cells treated with different
concentrations of EMMQ in HepG2 cells after 6 and 24 h were
evaluated for relative ROS changes. Data are presented as the mean
values ± SD. *P<0.05 indicates a significant
difference against vehicle control in HepG2 cells from three
independent experiments. (D) Western blot analysis. The lysates of
the respective mitochondrial and cytosolic fractions from HepG2
cells after 24-h treatment of EMMQ were collected as described in
Materials and methods. The protein was subjected to western blot
analysis. The blots were incubated with antibodies against cytosol
marker, α-tubulin, mitochondria markers, HSP-60, and cytochrome
c, respectively, followed by incubation with a 1:3,000
dilution of horseradish peroxidase-conjugated secondary antibody
and then developed by ECL detection system. The numbers underneath
signify relative intensities compared with the results of DMSO, D,
treatment. (E) The released mitochondrial cytochrome c in
HepG2 cells treated with 1, 5 or 10 μM of EMMQ or vehicle control
DMSO for 24 h were fixed and incubated with antibody against
cytochrome c followed by incubating with secondary antibody
conjugated with TRITC (red). The slides were counterstained with
mitotracker (green) and DAPI (blue) before being analyzed by
confocal microscopy. The pointed arrows signify co-localization of
red color cytochrome c and green color mitochondria, while
blue indicates the nucleus (scale, 25 μm). |
EMMQ induces mitochondrial cytochrome c
release in HepG2 cells
The impaired mitochondrial functions were further
established by cytochrome c release in HepG2 cells after
24-h treatment with increasing drug concentrations. Western blot
analysis of the protein lysates in the collected cells showed that
the increased intensity of cytochrome c in cytosol by EMMQ
relative to vehicle control were at the expense of that in
mitochondria (Fig. 4D). More
experiments with confocal microscopy showed that the puncta
composing of coalesced cytochrome c signal and mitochondria
marker were more apparent in HepG2 cells with increasing EMMQ
concentrations (Fig. 4E). The
results altogether proved that EMMQ induced release of cytochrome
c into cytosol following DNA damage in HepG2 cells.
Apoptosis by activating the intrinsic
pathway
To prove that DNA damage contributed to apoptosis,
protein lysates of the cells were subjected to western blot
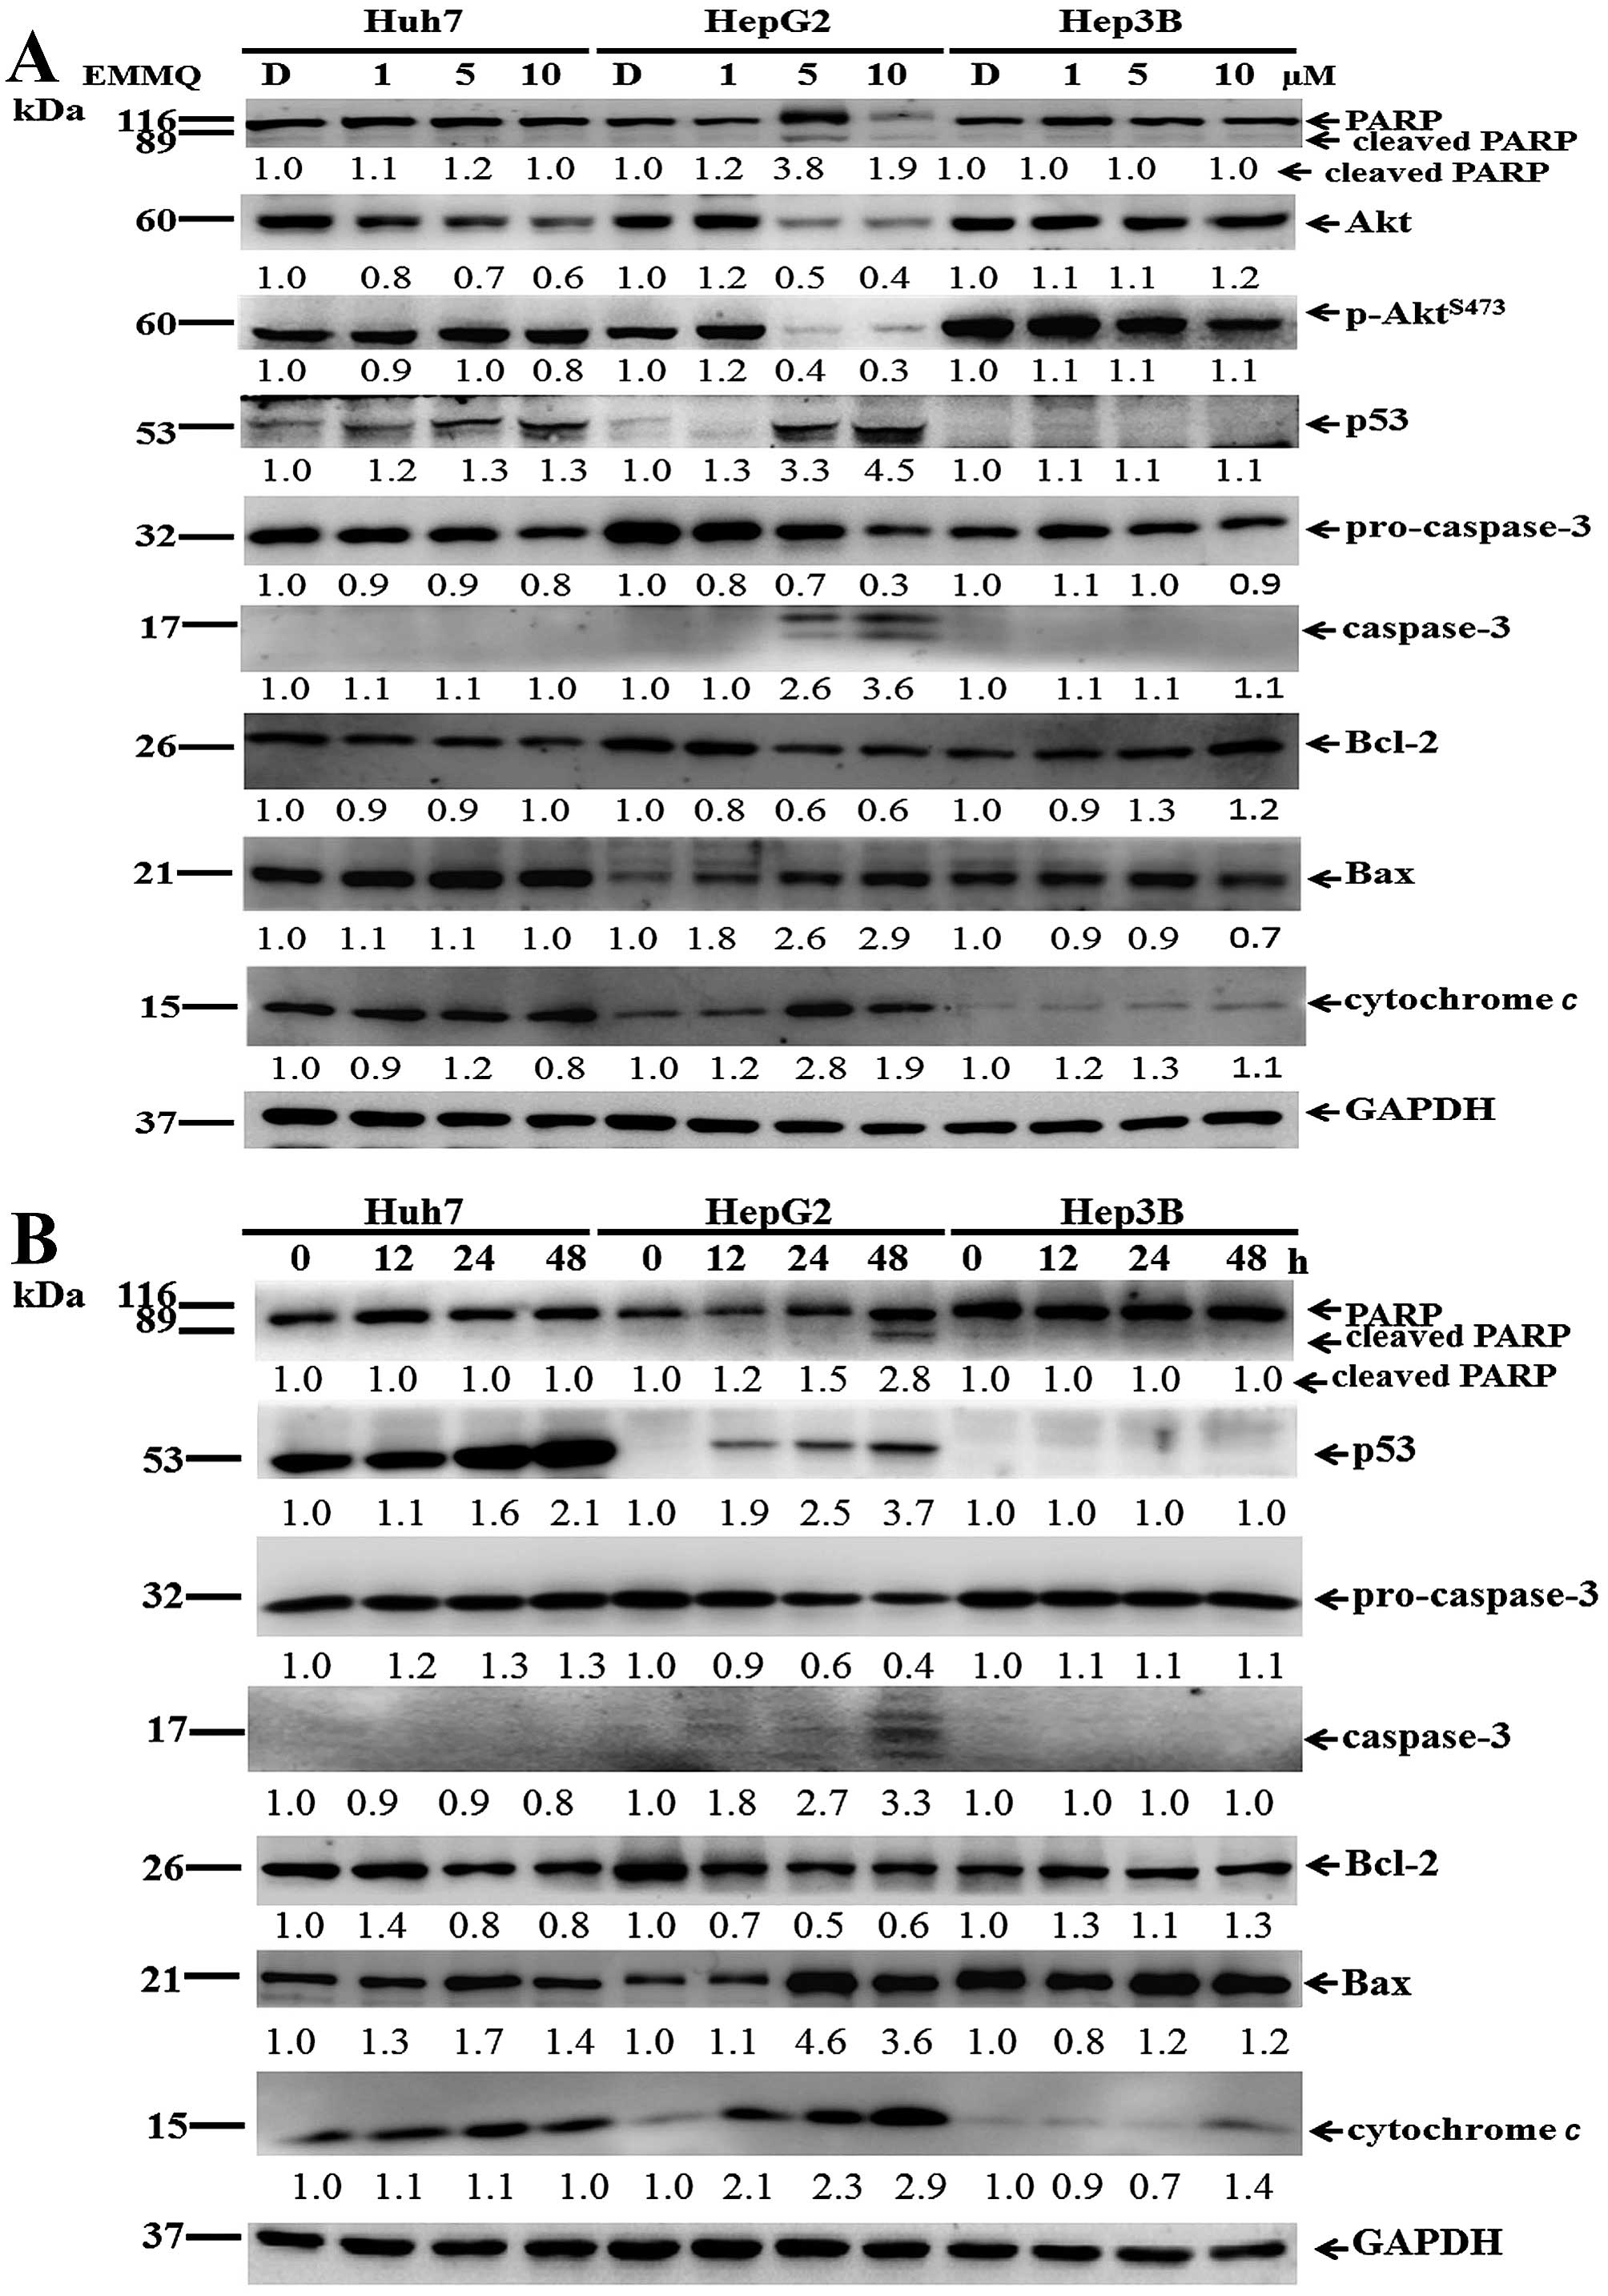
analysis. The increased concentrations of EMMQ activated p53 after
48 h. In addition, levels of Akt, p-AktS473, Bcl-2 and
procaspase-3 were reduced; while those of Bax, cytochrome c,
cleaved caspase-3 and fragmented poly(ADP ribose) polymerase (PARP)
became apparent in HepG2 cells (Fig.
5A). On the other hand, when incubated with 5 μM of EMMQ,
time-dependent p53 activation, procaspase-3 dissipation, caspase-3
development plus PARP cleavage in HepG2 cells indicated temporal
progression of apoptotic cell death. Furthermore, the increased Bax
and cytochrome c plus the reduced Bcl-2 suggested that the
developed apoptosis is related to mitochondria dysfunction; whereas
both Hep3B and Huh7 cells were unaffected (Fig. 5B). The results implied that
EMMQ-induced apoptosis was attributed to p53 activation following
DNA damage and the subsequent mitochondria impairment.
Downregulated p53 abolishes EMMQ-induced
cell death
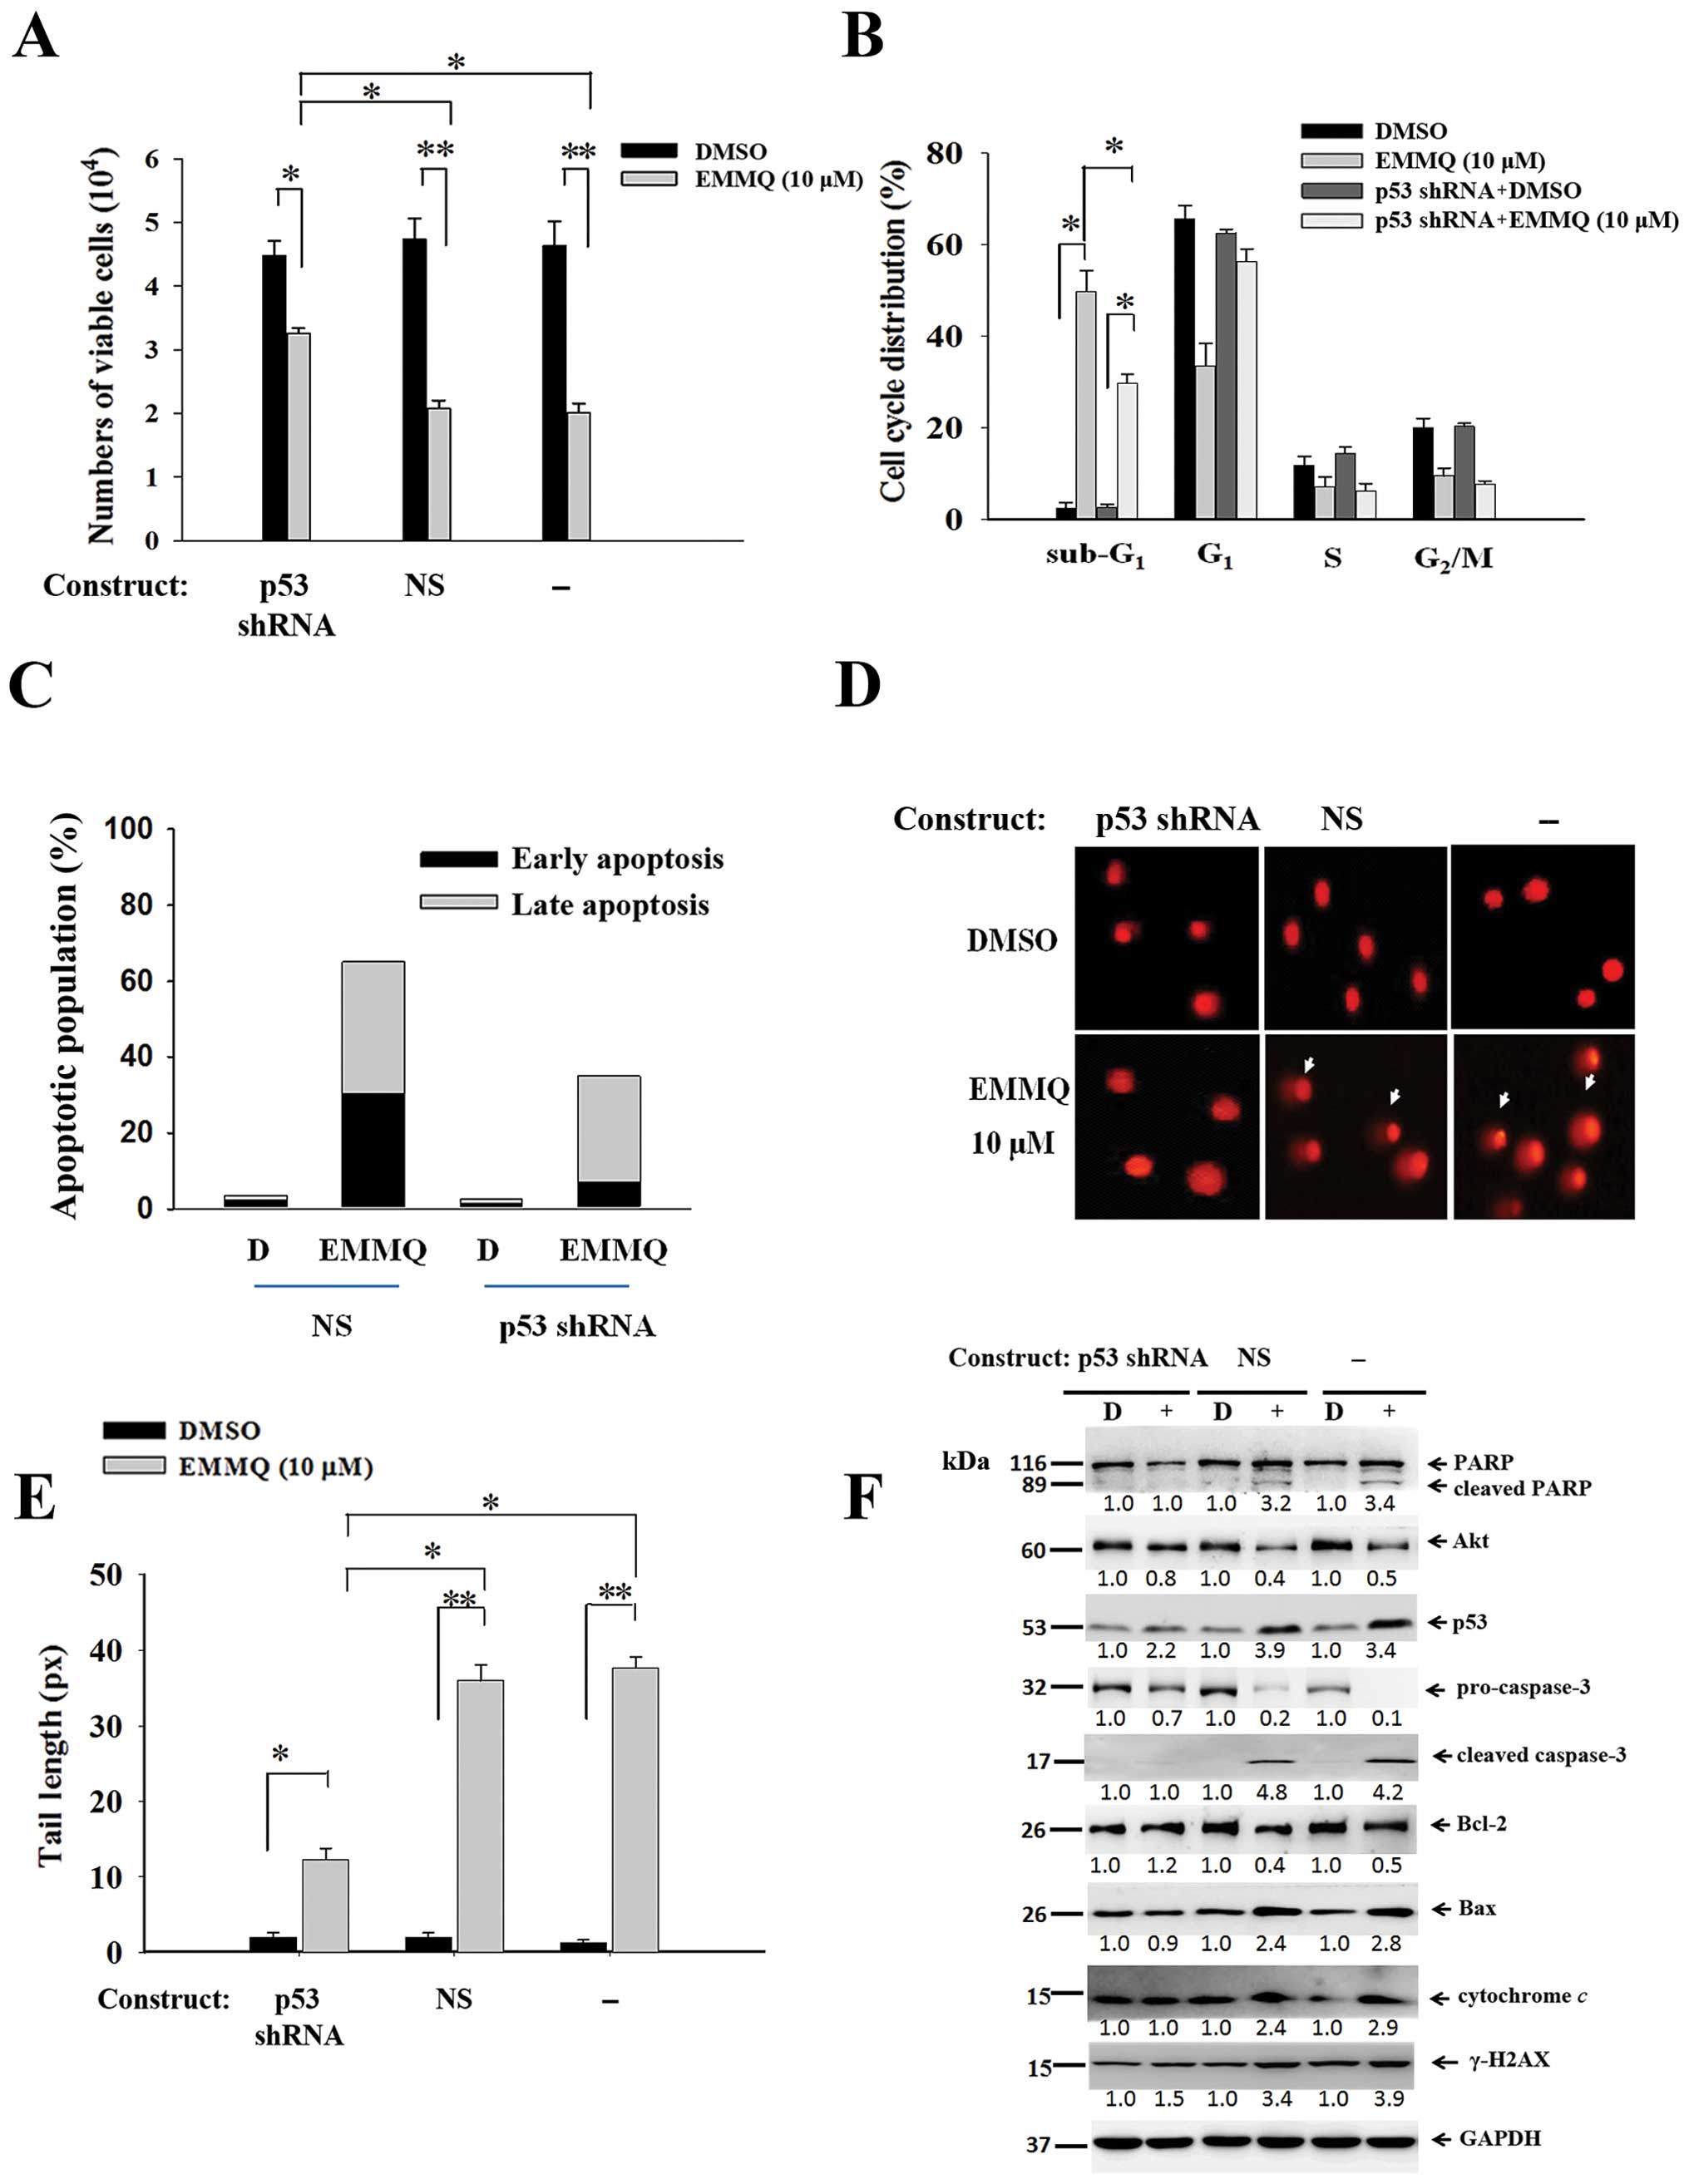
To assure that p53 was crucial in modulating cell
death, experiments by transfecting shRNA targeting exon 7 of p53 to
cells before drug treatment were performed along with those of
non-specific shRNA (NS) control. The resultant cell viabilities
were unaffected by EMMQ in HepG2 cells, indicating that p53 shRNA
eliminated drug sensitivity relative to cells introduced with NS
control (Fig. 6A). The suppressed
sub-G1 cells (Fig. 6B)
and the restrained early and late phase populations as measured by
PI and Annexin V double staining flow cytometry (Fig. 6C) suggested drug sensitivity was
reduced as a result. The diminished DNA lesions in HepG2 cells
transfected with p53 shRNA indicated that knocking down p53 impeded
EMMQ-mediated DNA damage (Fig. 6D and
E). Western blot analysis showed that cells transfected with
p53 shRNA not only blocked p53 activation, but attenuated cleavage
of PARP and procaspase-3, inhibited caspase-3 fragmentation,
reduced expression of Bax, deterred mitochondrial cytochrome
c release and γ-H2AX enhancement, while pro-survival genes
Bcl-2 and Akt were unchanged (Fig.
6F). Taken altogether, the results proved that p53 shRNA
stalled the apoptotic cell death in HCC cells through mitigating
DNA damage and restoring mitochondrial integrity and the status of
p53 determines the effectiveness of EMMQ.
Discussion
HCC is among the most common malignances and the
second most frequent cause of cancer death (1). The highly aggressive tumor responds
poorly to common therapies (9).
Several early trials were evaluated by targeting therapy. Among
them, the approved drug sorafenib for advanced HCC suppressed tumor
growth by inhibiting kinases in the MAPK pathway, inducing
autophagy, suppressing tumor cell proliferation and promoting
apoptosis (10). Another approved
drug sunitinib for treatment is a multi-targeted receptor tyrosine
kinase inhibitor. The drug blocks the tyrosine kinase activities of
KIT, PDGFR, VEGFR2 and other tyrosine kinases during tumor
development (11). Most
traditional chemotherapy exhibited low response rate in curing HCC
(12). Thus, more new effective
and well-tolerated therapy strategies are needed. This study showed
that EMMQ suppressed the growth of HCC cells, while normal hepatic
cells remained unaffected. The cell death as activated began with
DNA damage. The reduced growth can be attributed to apoptotic cell
death (Fig. 2A–C).
The cell death as activated by EMMQ began with DNA
damage. Response to the damaged DNA included accumulated cellular
processes, such as recognition, damage signal amplification, cell
cycle control, DNA repair and apoptosis. Many anticancer drugs
induced cell apoptosis by activating p53 when encountering DNA
damage (13). As DNA integrity was
severed, γ-H2AX facilitates phosphorylation of histone by
interacting with p53. Thus, the double-strained DNA damage marker
γ-H2AX is crucial in the repair process (14) and final apoptosis (15). The increased DNA lesion by EMMQ
began as early as 3 h in HepG2 cells. The increased drug
concentrations augmented temporal development of detrimental
effects (Fig. 3A–D) and activated
p53 (Fig. 5B). As an index of DNA
damage, γ-H2AX motivation that emerged at 3 h (Fig. 3E) acts together with p53 in
response to DNA damage (16) and
arrests cells at G1 phase by inhibiting synthesis of
cyclin-dependent kinases (17). In
response to DNA damage, p53 acts as a sequence-specific
transcription factor that orchestrates the appropriate cellular
response by inducing cell cycle arrest and apoptosis (18,19).
The study showed that, as EMMQ damaged DNA in HepG2 cells, p53
intensities and PARP cleavage were augmented by the increased EMMQ
concentrations, while both cyclin D1 and CDK2 levels were
decreased. The data were consistent with the result that EMMQ
arrested cell growth by holding the cell cycle at the
G0/G1 checkpoint when encountering DNA damage
after 24 h (Fig. 2E).
The results further suggested that the accumulated
DNA lesion attenuated ΔΨm and produced ROS. The observation
asserted that damaged DNA in HepG2 cells further injured
mitochondria integrities. Cytochrome c as appeared in
cytosol (Fig. 4D) and released
from mitochondria (Fig. 4E)
implied progressive impairment of mitochondrial functions. By
forming complexes with members of Bcl-2 family, p53 interrupted
mitochondrial outer membrane entirety (20). The previous report
(8) showed that EMMQ directly induced dysfunction of
mitochondrial by releasing cytochrome c into cytosol before
apoptotic cell death in NSCLC cells. In the case of HepG2 cells,
the released cytosolic cytochrome c from mitochondria
occurred following DNA damage after 24 h-treatment. The present
study demonstrated that EMMQ-induced apoptosis in liver cancer
began with DNA damage prior to ΔΨm attenuation, ROS production and
release of mitochondrial cytochrome c.
Similar small quinoline molecules were reported
effective in restraining the growth of cancer cells. A previous
study showed that the IC50 value of
6-methoxy-8-[(2-furanylmethyl)
amino]-4-methyl-5-(3-trifluoromethylphenyloxy)quinoline is 16±3 nM
in inhibiting breast cancer cells (21). Another similar compound, PQ1,
6-methoxy-8-[(3-aminopropyl)amino]-4-methyl-5-(3-trifluoromethylphenyloxy)quinoline
induced apoptosis in T47D breast cancer cells (22). PQ15,
6-methoxy-4-methyl-8-[(4-quinolinylmethyl)amino]-5-(3-trifluoromethyl
phenyloxy)-quinoline affected viability of T47D breast cancer cells
(23). Treatment with combined
indole-3-carbinol and genistein induced apoptosis in human colon
cancer HT-29 cells (24).
Indolylquinoline derivatives are mostly used to treat leishmaniasis
(25,26). The present study provided a
different aspect of indolylquinoline EMMQ for human HCC treatment,
in which the damaging nucleus directly activated p53 and produced
ROS that mediated final apoptotic cell death. As a DNA-binding
transcriptional regulator, p53 contributes to cell cycle arrest and
apoptosis (27) by activating
downstream elements to stall growth or promote cell death during
genotoxic stress (28–30). More reports showed that ROS induces
apoptosis by inducing mitogen-activated protein kinases (MAPKs)
(31) and the increased ROS is
associated with p53 activation (32,33).
The attenuated ΔΨm, diminished outer membrane regulator Bcl-2 and
release of downstream modulator mitochondrial cytochrome c
were attributed to outer mitochondrial membrane permeabilization
(34,35). There were reports that Akt, Bcl-2
and Bax modulation were associated with activated p53 (36–38).
The present study showed that EMMQ induced apoptosis in liver
cancer cells through p53 activation, Akt downregulation, Bcl-2
reduction and caspase-3 fragmentation. Knocking down p53 suppressed
the drug effects by mitigating DNA damage and preserving
mitochondria integrity. Whether EMMQ is effective to treat other
types of cancer or those that metastasize to distant sites remains
to be seen.
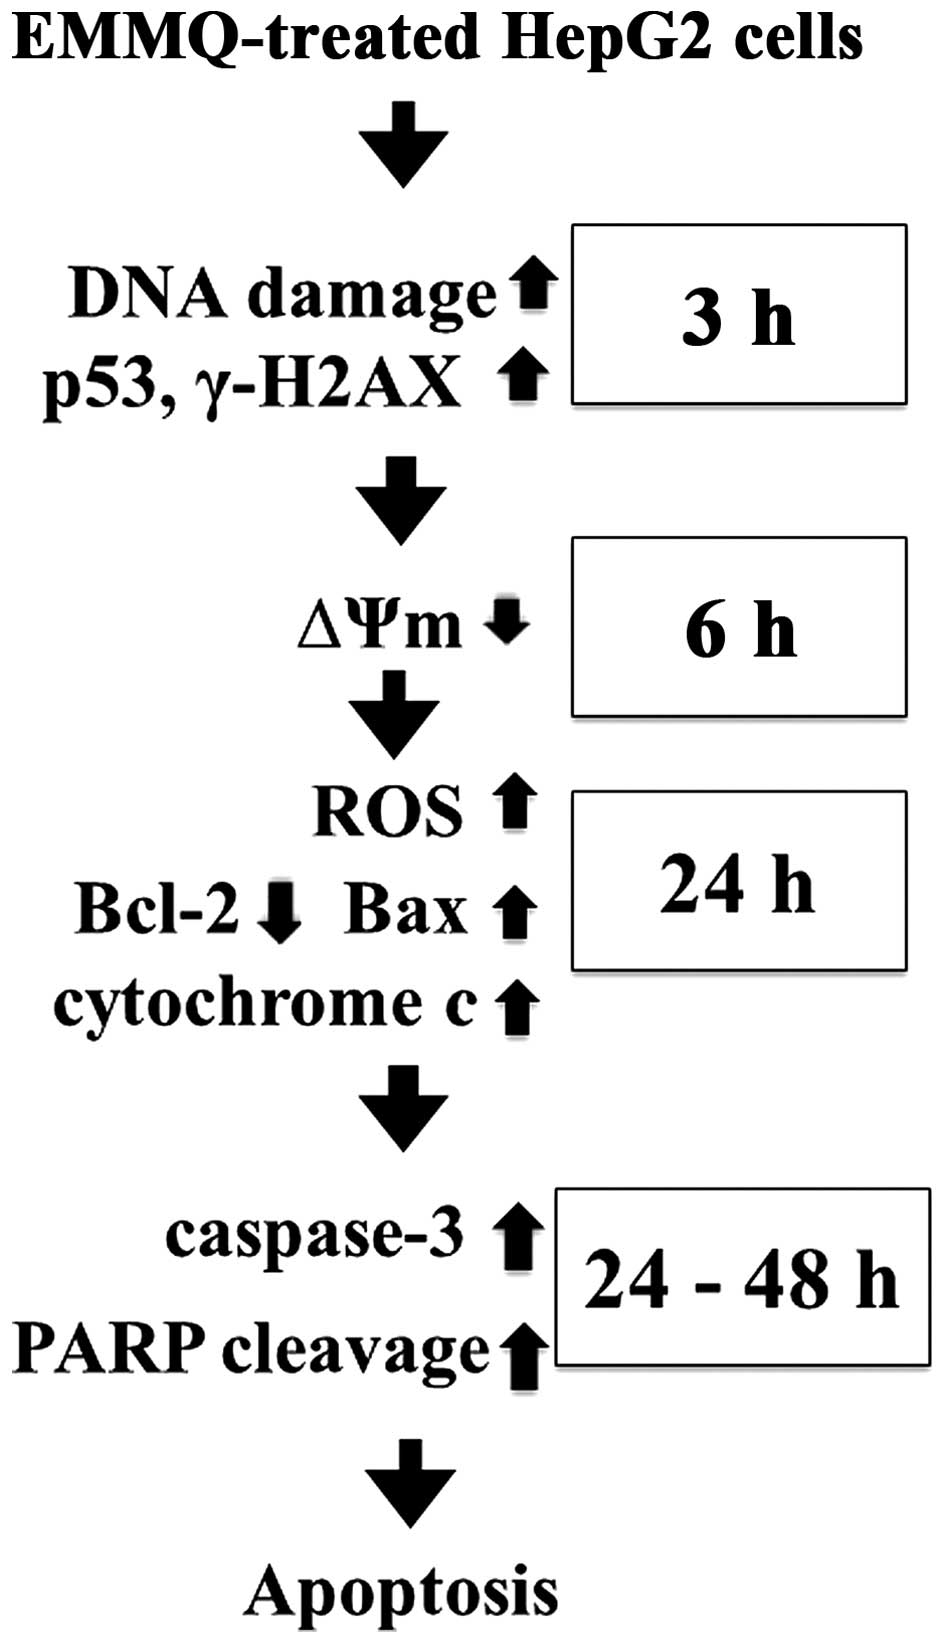
In conclusion, the indolylquinoline derivative EMMQ
injured DNA first in liver cancer cells that differed from previous
findings in NSCLC cells. The damaged DNA suppressed ΔΨm before
apoptosis in human HCC cells carrying p53. The injured DNA
activated p53 and increased expression of γ-H2AX, while the
decreased cyclin D1 and CDK2 arrested cells at
G0/G1 phase. The subsequent attenuated
pro-survival signal Akt, decreased Bcl-2/Bax ratio, released
mitochondrial cytochrome c, cleavage of both procaspase-3
and PARP accelerated apoptotic cell death in HepG2 cells (Fig. 7). Attenuation of p53 inhibited drug
sensitivity. The study asserted the role of EMMQ as a potential
candidate to treat a subset of liver cancer.
Acknowledgements
The present study was supported by grants from the
Ministry of Science and Technology, Executive Yuan, ROC (MOST
103-2311-B-003-001) and the National Taiwan Normal University
(102T3040B2, 103T3040D2 and 104T3040C2). We would like to thank the
College of Life Science and Instrumentation Center, National Taiwan
University for their technical assistance of the confocal laser
microscopy.
References
|
1
|
Jemal A, Bray F, Center MM, Ferlay J, Ward
E and Forman D: Global cancer statistics. CA Cancer J Clin.
61:69–90. 2011. View Article : Google Scholar : PubMed/NCBI
|
|
2
|
Ferlay J, Soerjomataram I, Dikshit R, Eser
S, Mathers C, Rebelo M, Parkin DM, Forman D and Bray F: Cancer
incidence and mortality worldwide: Sources, methods and major
patterns in GLOBOCAN 2012. Int J Cancer. 136:E359–E386. 2015.
View Article : Google Scholar
|
|
3
|
Kumar M, Zhao X and Wang XW: Molecular
carcinogenesis of hepatocellular carcinoma and intrahepatic
cholangiocarcinoma: One step closer to personalized medicine? Cell
Biosci. 1:52011. View Article : Google Scholar : PubMed/NCBI
|
|
4
|
Brown KS: Chemotherapy and other systemic
therapies for hepatocellular carcinoma and liver metastases. Semin
Intervent Radiol. 23:99–108. 2006. View Article : Google Scholar : PubMed/NCBI
|
|
5
|
Cao H, Phan H and Yang LX: Improved
chemotherapy for hepatocellular carcinoma. Anticancer Res.
32:1379–1386. 2012.PubMed/NCBI
|
|
6
|
Terazawa T, Kondo S, Hosoi H, Morizane C,
Shimizu S, Mitsunaga S, Ikeda M, Ueno H and Okusaka T:
Transarterial infusion chemotherapy with cisplatin plus S-1 for
hepatocellular carcinoma treatment: A phase I trial. BMC Cancer.
14:3012014. View Article : Google Scholar : PubMed/NCBI
|
|
7
|
Jiang L, Zhang Q, Ren H, Ma S, Lu C, Liu
B, Liu J, Liang J, Li M and Zhu R: Dihydromyricetin enhances the
chemo-sensitivity of nedaplatin via regulation of the p53/Bcl-2
pathway in hepatocellular carcinoma cells. PLoS One.
10:e01249942015. View Article : Google Scholar : PubMed/NCBI
|
|
8
|
Liu CY, Wu PT, Wang JP, Fan PW, Hsieh CH,
Su CL, Chiu CC, Yao CF and Fang K: An indolylquinoline derivative
promotes apoptosis in human lung cancer cells by impairing
mitochondrial functions. Apoptosis. 20:1471–1482. 2015. View Article : Google Scholar : PubMed/NCBI
|
|
9
|
Lee WY, Cheung CC, Liu KW, Fung KP, Wong
J, Lai PB and Yeung JH: Cytotoxic effects of tanshinones from
Salvia miltior-rhiza on doxorubicin-resistant human liver cancer
cells. J Nat Prod. 73:854–859. 2010. View Article : Google Scholar : PubMed/NCBI
|
|
10
|
Gauthier A and Ho M: Role of sorafenib in
the treatment of advanced hepatocellular carcinoma: An update.
Hepatol Res. 43:147–154. 2013. View Article : Google Scholar
|
|
11
|
Hartmann JT and Kanz L: Sunitinib and
periodic hair depigmentation due to temporary c-KIT inhibition.
Arch Dermatol. 144:1525–1526. 2008. View Article : Google Scholar : PubMed/NCBI
|
|
12
|
Sukowati CH, Rosso N, Crocè LS and
Tiribelli C: Hepatic cancer stem cells and drug resistance:
Relevance in targeted therapies for hepatocellular carcinoma. World
J Hepatol. 2:114–126. 2010.PubMed/NCBI
|
|
13
|
Banin S, Moyal L, Shieh S, Taya Y,
Anderson CW, Chessa L, Smorodinsky NI, Prives C, Reiss Y, Shiloh Y,
et al: Enhanced phosphorylation of p53 by ATM in response to DNA
damage. Science. 281:1674–1677. 1998. View Article : Google Scholar : PubMed/NCBI
|
|
14
|
Hamer G, Roepers-Gajadien HL, van
Duyn-Goedhart A, Gademan IS, Kal HB, van Buul PP and de Rooij DG:
DNA double-strand breaks and gamma-H2AX signaling in the testis.
Biol Reprod. 68:628–634. 2003. View Article : Google Scholar : PubMed/NCBI
|
|
15
|
Yuan J and Chen J: MRE11-RAD50-NBS1
complex dictates DNA repair independent of H2AX. J Biol Chem.
285:1097–1104. 2010. View Article : Google Scholar :
|
|
16
|
Di Leonardo A, Linke SP, Clarkin K and
Wahl GM: DNA damage triggers a prolonged p53-dependent G1 arrest
and long-term induction of Cip1 in normal human fibroblasts. Genes
Dev. 8:2540–2551. 1994. View Article : Google Scholar : PubMed/NCBI
|
|
17
|
Agarwal ML, Agarwal A, Taylor WR and Stark
GR: p53 controls both the G2/M and the G1 cell cycle checkpoints
and mediates reversible growth arrest in human fibroblasts. Proc
Natl Acad Sci USA. 92:8493–8497. 1995. View Article : Google Scholar : PubMed/NCBI
|
|
18
|
Innocente SA, Abrahamson JL, Cogswell JP
and Lee JM: p53 regulates a G2 checkpoint through cyclin B1. Proc
Natl Acad Sci USA. 96:2147–2152. 1999. View Article : Google Scholar : PubMed/NCBI
|
|
19
|
Lakin ND and Jackson SP: Regulation of p53
in response to DNA damage. Oncogene. 18:7644–7655. 1999. View Article : Google Scholar
|
|
20
|
Assunção Guimarães C and Linden R:
Programmed cell deaths. Apoptosis and alternative death styles. Eur
J Biochem. 271:1638–1650. 2004. View Article : Google Scholar
|
|
21
|
Shi A, Nguyen TA, Battina SK, Rana S,
Takemoto DJ, Chiang PK and Hua DH: Synthesis and anti-breast cancer
activities of substituted quinolines. Bioorg Med Chem Lett.
18:3364–3368. 2008. View Article : Google Scholar : PubMed/NCBI
|
|
22
|
Ding Y and Nguyen TA: PQ1, a quinoline
derivative, induces apoptosis in T47D breast cancer cells through
activation of caspase-8 and caspase-9. Apoptosis. 18:1071–1082.
2013. View Article : Google Scholar : PubMed/NCBI
|
|
23
|
Bernzweig J, Heiniger B, Prasain K, Lu J,
Hua DH and Nguyen TA: Anti-breast cancer agents, quinolines,
targeting gap junction. Med Chem. 7:448–453. 2011. View Article : Google Scholar : PubMed/NCBI
|
|
24
|
Nakamura Y, Yogosawa S, Izutani Y,
Watanabe H, Otsuji E and Sakai T: A combination of indol-3-carbinol
and genistein synergistically induces apoptosis in human colon
cancer HT-29 cells by inhibiting Akt phosphorylation and
progression of autophagy. Mol Cancer. 8:1002009. View Article : Google Scholar : PubMed/NCBI
|
|
25
|
Chakrabarti G, Basu A, Manna PP, Mahato
SB, Mandal NB and Bandyopadhyay S: Indolylquinoline derivatives are
cytotoxic to Leishmania donovani promastigotes and amastigotes in
vitro and are effective in treating murine visceral leishmaniasis.
J Antimicrob Chemother. 43:359–366. 1999. View Article : Google Scholar : PubMed/NCBI
|
|
26
|
Pal C, Raha M, Basu A, Roy KC, Gupta A,
Ghosh M, Sahu NP, Banerjee S, Mandal NB and Bandyopadhyay S:
Combination therapy with indolylquinoline derivative and sodium
antimony gluconate cures established visceral leishmaniasis in
hamsters. Antimicrob Agents Chemother. 46:259–261. 2002. View Article : Google Scholar
|
|
27
|
Brambilla E and Negoescu A: Analysis of
Bax and Bcl-2 expression in p53-immunopositive breast cancers. Clin
Cancer Res. 3:2181–2183. 1997.
|
|
28
|
Vaseva AV and Moll UM: The mitochondrial
p53 pathway. Biochimica et Biophysica Acta. 1787:414–420. 2009.
View Article : Google Scholar
|
|
29
|
Baker SJ, Fearon ER, Nigro JM, Hamilton
SR, Preisinger AC, Jessup JM, vanTuinen P, Ledbetter DH, Barker DF,
Nakamura Y, et al: Chromosome 17 deletions and p53 gene mutations
in colorectal carcinomas. Science. 244:217–221. 1989. View Article : Google Scholar : PubMed/NCBI
|
|
30
|
Linke SP, Clarkin KC, Di Leonardo A, Tsou
A and Wahl GM: A reversible, p53-dependent
G0/G1 cell cycle arrest induced by
ribo-nucleotide depletion in the absence of detectable DNA damage.
Genes Dev. 10:934–947. 1996. View Article : Google Scholar : PubMed/NCBI
|
|
31
|
Saha S, Bhattacharjee P, Mukherjee S,
Mazumdar M, Chakraborty S, Khurana A, Nayak D, Manchanda R,
Chakrabarty R, Das T, et al: Contribution of the ROS-p53 feedback
loop in thuja-induced apoptosis of mammary epithelial carcinoma
cells. Oncol Rep. 31:1589–1598. 2014.PubMed/NCBI
|
|
32
|
Macip S, Igarashi M, Berggren P, Yu J, Lee
SW and Aaronson SA: Influence of induced reactive oxygen species in
p53-mediated cell fate decisions. Mol Cell Biol. 23:8576–8585.
2003. View Article : Google Scholar : PubMed/NCBI
|
|
33
|
Raha S and Robinson BH: Mitochondria,
oxygen free radicals, disease and ageing. Trends Biochem Sci.
25:502–508. 2000. View Article : Google Scholar : PubMed/NCBI
|
|
34
|
Holley AK and St Clair DK: Watching the
watcher: Regulation of p53 by mitochondria. Future Oncol.
5:117–130. 2009. View Article : Google Scholar : PubMed/NCBI
|
|
35
|
Mihara M, Erster S, Zaika A, Petrenko O,
Chittenden T, Pancoska P and Moll UM: p53 has a direct apoptogenic
role at the mitochondria. Mol Cell. 11:577–590. 2003. View Article : Google Scholar : PubMed/NCBI
|
|
36
|
Ji H, Ding Z, Hawke D, Xing D, Jiang BH,
Mills GB and Lu Z: AKT-dependent phosphorylation of Niban regulates
nucleo-phosmin- and MDM2-mediated p53 stability and cell apoptosis.
EMBO Rep. 13:554–560. 2012. View Article : Google Scholar : PubMed/NCBI
|
|
37
|
Qian J, Zou Y, Rahman JS, Lu B and Massion
PP: Synergy between phosphatidylinositol 3-kinase/Akt pathway and
Bcl-xL in the control of apoptosis in adenocarcinoma cells of the
lung. Mol Cancer Ther. 8:101–109. 2009. View Article : Google Scholar : PubMed/NCBI
|
|
38
|
Malki A and El Ashry S: In vitro and in
vivo efficacy of a novel quinuclidinone derivative against breast
cancer. Anticancer Res. 34:1367–1376. 2014.PubMed/NCBI
|