Introduction
The Wilms tumor 1 (WT1) gene was initially
identified in 1990 as a tumor-suppressor gene of Wilms tumor
(1,2). WT1, which contains four C-terminal
zinc-finger motifs and an N-terminal DNA-binding domain, functions
as a transcription factor in regulation of differentiation and
development of mesodermally derived tissues such as kidney,
mesothelium and gonad (3–5). WT1 has been reported to be strongly
expressed in benign mesodermal tissues, as well as in malignancies
of mesodermal origin such as leukemia (44–93%) (6,7),
mesothelioma (72–100%) (8–14) and ovarian serous carcinomas
(45–100%) (11,13,15,16).
Therefore, WT1 mRNA is used as a clinical standard marker to
diagnose minimal residual disease of leukemia (6) and immunohistochemical study for WT1
is helpful to distinguish mesodermally derived solid cancers such
as mesothelioma and ovarian cancer from other solid cancers
(8,10–13,15,16).
On the other hand, WT1 attracts many researchers as
an ideal target for cancer treatment. WT1 was prioritized as a
promising target of immunotherapy against various malignancies
(17) because dozens of studies
have confirmed WT1 overexpression not only in mesodermally derived
malignancies but also in a variety of non-mesodermal origin solid
cancers such as esophageal (45–95%) (18,19),
gastric (42%) (19), colon
(69–89%) (19,20), hepatocellular (95%) (21), bile duct (68%) (19), pancreatic (65–75%) (19,22),
thyroid (95%) (23), prostate
(25%) (9), lung (30–83%) (19,24),
breast (26–87%) (19,25–27),
and brain cancers (88–96%) (19,28).
These solid tumors do not carry mutations in the WT1 gene (20,23,24,28).
Based on these results, clinical trials of WT1-specific
immunotherapy for patients with various tumors have been conducted
(29–36).
In solid cancers, WT1 expression is generally
confirmed by immunohistochemistry but methods of the
immunohistochemistry and interpretations of the results are diverse
among studies although they are essential to appropriate clinical
trials of WT1-specific treatment. In the present study, we aimed to
establish reasonable interpretations of results of
immunohis-tochemistry for WT1 and to re-evaluate WT1 expression in
primary esophageal, bile duct, pancreatic and lung cancers.
Materials and methods
Cell lines
Thirty-five human cell lines were used, derived from
the following tissue or tumor sources: 293FT, embryonal kidney;
K562, chronic myelogenous leukemia; HMMME, ACC-MESO-1 and
ACC-MESO-4, mesothelioma; JHOS-2 and JHOS-3, ovarian serous
adenocarcinoma; HeLa, uterine cervical cancer; TE-2, TE-4, TE-5,
TE-8, TE-9, TE-14, SGF7 and HEC46, esophageal cancer; TFK-1,
HuCCT1, TKKK, RBE and HuH-28, bile duct cancer; PANC-1, PCI-6,
KP-1N, SUIT-2, AsPC-1 and BxPC-3, pancreatic cancer; A549,
RERF-LC-MS, RERF-LC-OK, ABC-1 and VMRC-LCD, lung adenocarcinoma;
H226, LK-2 and PC10, lung squamous cell carcinoma.
293FT was purchased from Invitrogen (Carlsbad, CA,
USA). K562, HMMME, ACC-MESO-1 (37), ACC-MESO-4 (37), JHOS-2, JHOS-3, HeLa, TFK-1, HcCCT1,
TKKK, RBE, HuH-28 and PANC-1 were purchased from the RIKEN
BioResource Center Cell Bank (Tsukuba, Japan). The TE series was
provided by Dr T. Nishihira (Tohoku University, Sendai, Japan)
(38). SGF7 was provided by Dr T.
Saito (Toyama Medical and Pharmaceutical University, Toyama, Japan)
(39). HEC46 was provided by Dr T.
Toge (Hiroshima University, Hiroshima, Japan) (40). PCI-6 was provided by the First
Department of Pathology, Hokkaido University (Sapporo, Japan)
(41). KP-1N, SUIT-2, A549,
RERF-LC-MS, RERF-LC-OK, ABC-1, VMRC-LCD, H226, LK-2 and PC10 were
purchased from the Japanese Cancer Research Resource Bank (Tokyo,
Japan). AsPC-1 and BxPC-3 were provided by the American Type
Culture Collection (ATCC; Manassas, VA, USA).
293FT was cultured in Dulbecco's modified Eagle's
medium (Sigma-Aldrich, St. Louis, MO, USA). The other cell lines
were cultured in RPMI-1640 (Sigma-Aldrich). Each medium was
supplemented with 10% fetal bovine serum (FBS) and 1%
penicillin/streptomycin. All cell lines were cultured at 37°C in a
humidified atmosphere containing 5% CO2. Trypsin (0.25%)
was used for subculture.
Tissue samples
Cancer tissues and corresponding normal epithelial
tissues were obtained from 552 patients with esophageal (101
patients), bile duct (96 patients), pancreatic (99 patients), and
lung cancer (256 patients) who underwent resection in the
Department of Gastroenterological Surgery II, Hokkaido University,
Japan between 1994 and 2005. These tissue samples were fixed in 10%
formalin and embedded in paraffin blocks. Three or four spots of
each tissue, of uniform 0.6-mm diameter, were punched out and
consolidated into 25 paraffin blocks using a Manual Tissue Arrayer
(Beecher Instruments, Inc., Sun Prairie, WI, USA); the resultant 25
blocks were used for immunohistochemistry. As possible positive
controls for WT1 expression in tissue samples, kidney, pleura,
testis, pleural mesothelioma and ovarian serous adenocarcinoma were
also examined under the same conditions.
Gene cloning and transfection
Negative and positive controls for WT1 protein
expression were generated as follows. First, internal ribosome
entry site and complementary DNA (cDNA) encoding green fluorescent
protein (GFP) were cloned into the multiple cloning site of plasmid
vector pcDNA3.1(+) (Invitrogen); the resultant plasmid is termed
empty vector. WT1 cDNA was amplified by polymerase chain reaction
(PCR), using human kidney QUICK-Clone cDNA (Takara, Otsu, Japan) as
a template and cloned into empty vector. The resultant plasmid
vector is termed vector WT1. The base sequence of vector WT1 was
confirmed by the single-nucleotide primer extension method. Empty
vector and vector WT1 were transfected into 293FT and HeLa cells
using Lipofectamine 2000 (Invitrogen). Successful transfection was
verified by observing GFP expression. Cells transfected with empty
vector and vector WT1 were, respectively, used as negative and
positive controls for WT1 protein expression. The WT1 mRNA contains
two splice sites that can be skipped during RNA splicing;
consequently, the WT1 gene encodes four variant isoforms of WT1
protein (Fig. 1). We constructed
the corresponding four types of positive controls for WT1 protein
expression.
Transfected cells producing fusion
protein GFP-WT1 were generated as follows
GFP cDNA was cloned into the multiple cloning site
of pcDNA3.1(+); the resultant plasmid is termed vector GFP. WT1
cDNA was cloned into vector GFP such that the WT1 cDNA sequence was
fused to the C-terminus of the GFP cDNA, which lacked a stop codon;
the resultant plasmid is termed vector GFP-WT1. The base sequence
of vector GFP-WT1 was confirmed by the single-nucleotide primer
extension method. Vector GFP and vector GFP-WT1 were transfected
into 293FT and HeLa cells using Lipofectamine LTX (Invitrogen).
Cells transfected with vector GFP and vector GFP-WT1 were predicted
to produce GFP and fusion protein GFP-WT1, respectively. As noted
above, the WT1 mRNA has four splicing variants (Fig. 1); therefore, we constructed the
corresponding four types of vector GFP-WT1 plasmids.
Immunohistochemistry
Cultured cells which were detached using 0.25%
trypsin and sedimented by centrifugation or excised tissue samples
were fixed in 10% formalin and embedded in paraffin blocks. Thin
sections (2 μm thick) were de-waxed and rehydrated, and
antigens were retrieved in pressure vessels under the following
conditions: citrate buffer (pH 7.0), 2 atm, 100°C, 2 min. For
additional antigen retrieval, sections for WT1 antibody 6F-H2 were
incubated for 5 min at room temperature with 10% proteinase K
ready-to-use enzyme (Dako, Kyoto, Japan) before treatment in the
pressure vessels. The sections were immersed for 15 min at room
temperature in 0.3% H2O2 diluted with
methanol, in order to block endogenous peroxidase activity, and
then incubated in 10% normal goat serum (Nichirei Corp., Tokyo,
Japan) at room temperature for 30 min to reduce non-specific
binding. WT1 antibodies 6F-H2 (mouse monoclonal; Dako), ab89901
(rabbit monoclonal; Abcam, Cambridge, UK) and C-19 (rabbit
polyclonal; Santa Cruz Biotechnology, Dallas, TX, USA), used as
primary antibodies (Fig. 1), were
diluted 1:100, 1:200 and 1:100, respectively, with antibody diluent
(Dako). The sections were incubated with the diluted primary
antibodies at 4°C overnight. Mouse IgG1 (Dako) and rabbit
polyclonal IgG (Abcam) were used for negative controls against
samples with primary antibodies. Next, sections were incubated for
30 min at room temperature with biotinylated goat antibody to mouse
and rabbit immunoglobulin (Histofine Simple Stain MAX PO MULTI;
Nichirei Corp.). Finally, sections were stained with
3-3′-diaminobenzidine tetrahydrochloride (Histofine Simple Stain
DAB Solution; Nichirei Corp.) and then lightly counter-stained by
hematoxylin.
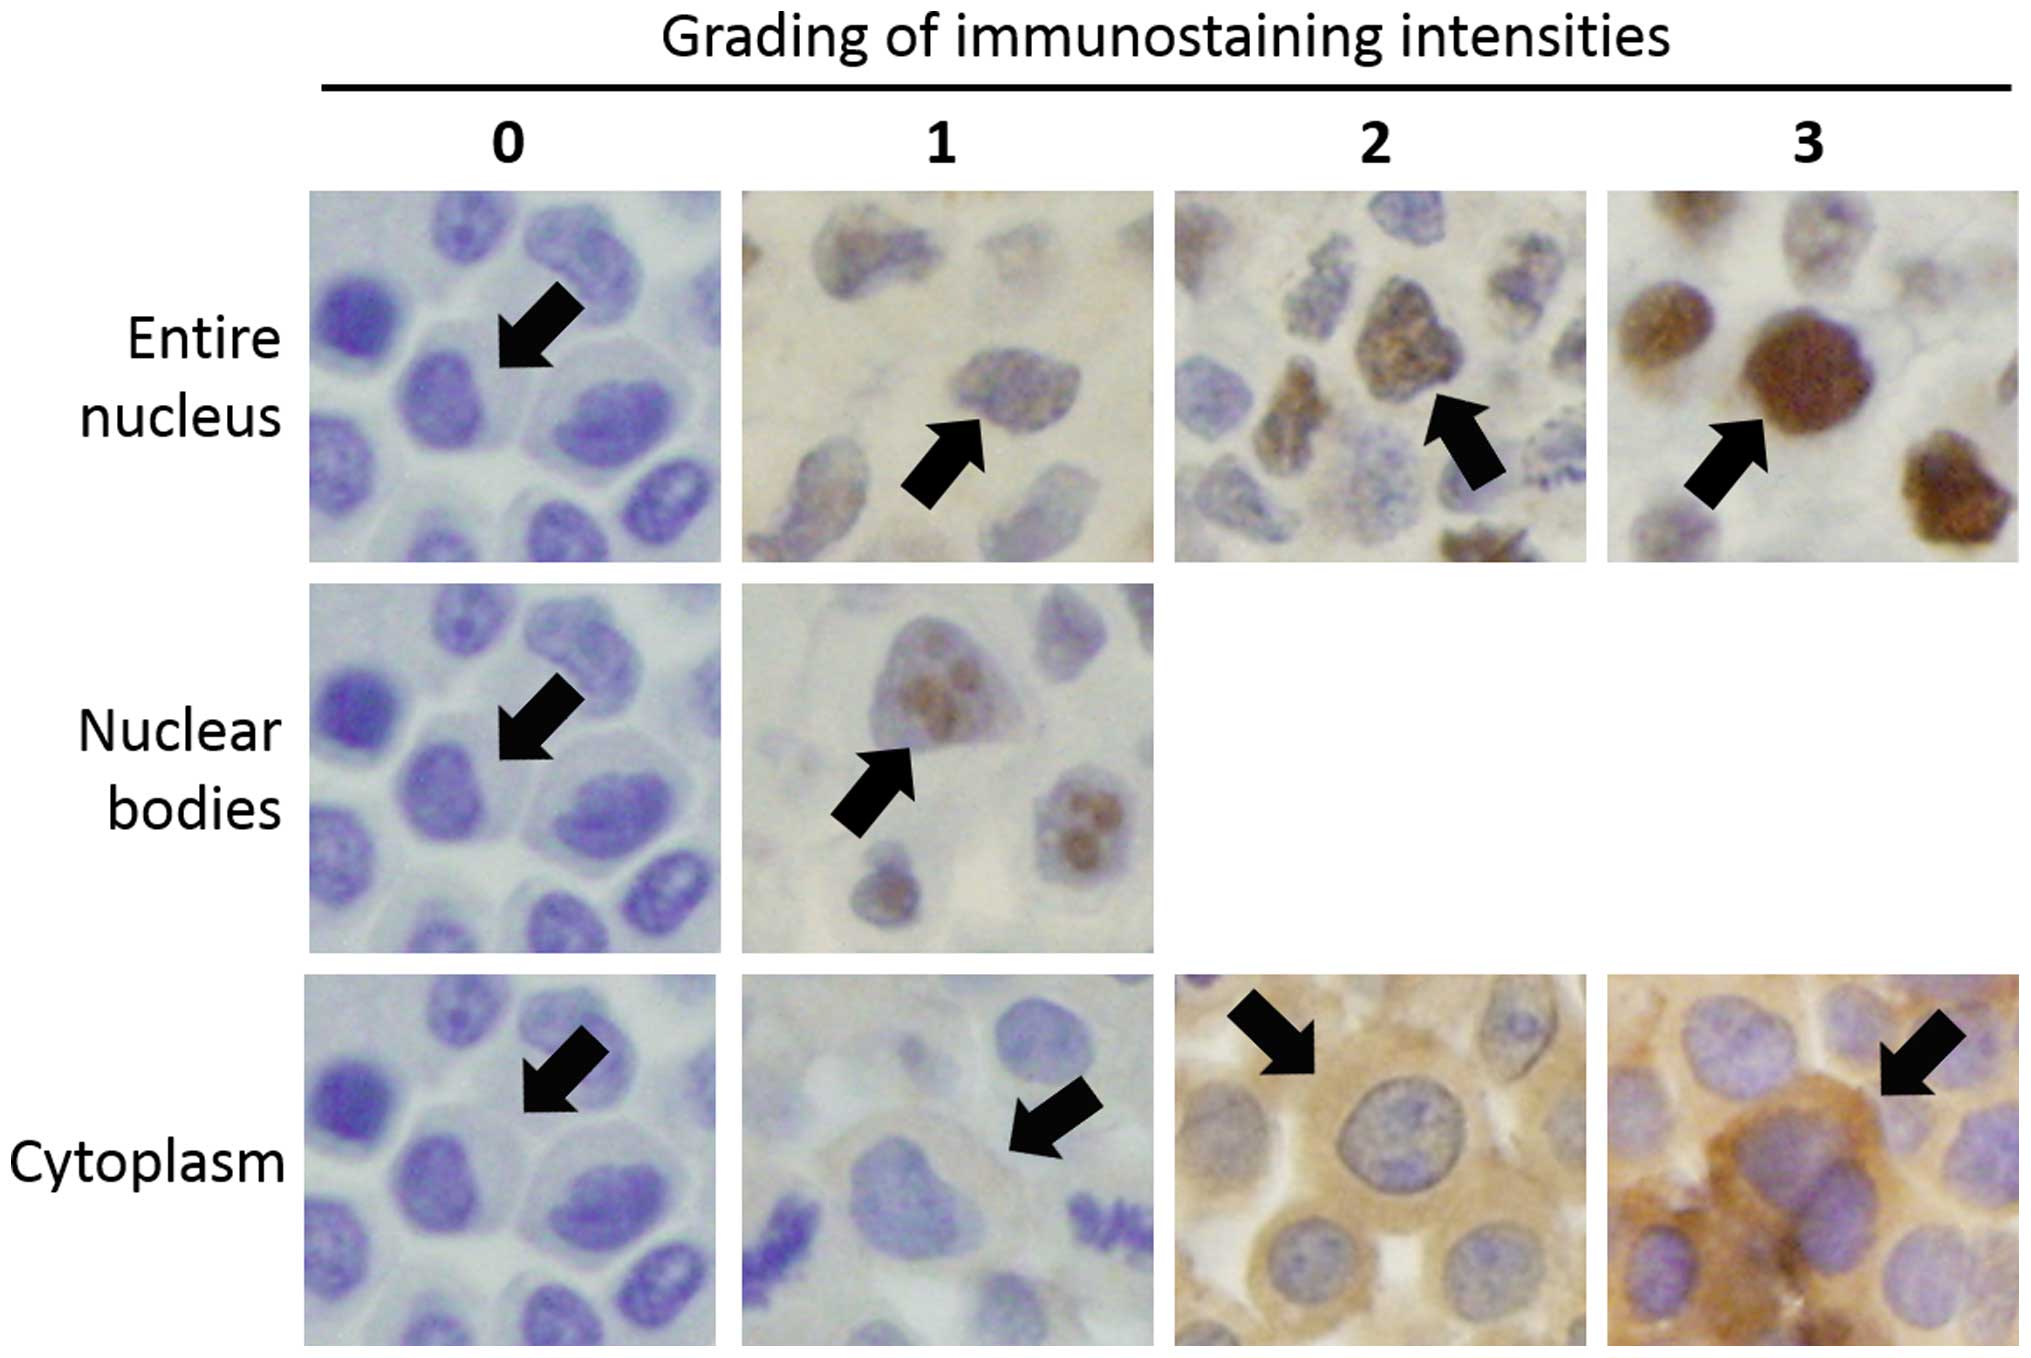
In cell lines, immunostaining scores for the entire
nucleus, the nuclear bodies, and the cytoplasm were calculated
independently. Immunostaining intensities of entire nucleus and
cytoplasm in individual cells were classified into four grades and
intensity of nuclear bodies was classified into two grades as shown
in Fig. 2. Immunostaining scores
for samples were calculated as the sum of the immunostaining
intensities of individual cells, divided by the total number of the
cells; thus, the score represents the average immunostaining
intensity of all cells in the sample. Immunostaining scores were
independently calculated by two surgeons under the guidance of a
pathologist and the average value was regarded as the final
immunostaining score.
Western blotting
Total protein was extracted from cultured cells
using triple-detergent lysis buffer. Protein concentration was
measured by the Bradford method using a commercial protein assay
kit (Bio-Rad Laboratories, Hercules, CA, USA). Protein was boiled
for 2 min for antigen retrieval, subjected to SDS-PAGE, and blotted
onto a Hybond-ECL nitrocellulose membrane (GE Healthcare Life
Sciences, Piscataway, NJ, USA). The membrane was blocked at 4°C
overnight with 5% skim milk, incubated with diluted primary
antibodies at room temperature for 1 h, and then incubated with
diluted secondary antibodies at room temperature for 1 h. WT1
antibodies 6F-H2, ab89901 and C-19 (Fig. 1), mouse monoclonal GFP antibody
(Clontech Laboratories, Inc., Otsu, Japan) and actin C4 antibody
(Millipore, Billerica, MA, USA) were used as primary antibodies.
Peroxidase-conjugated AffiniPure Goat Anti-Mouse IgG H+L antibodies
(Jackson ImmunoResearch, West Grove, PA, USA) or
peroxidase-conjugated AffiniPure Goat Anti-Rabbit IgG H+L
antibodies (Jackson ImmunoResearch) were used as secondary
antibodies. Protein bands were visualized using the ECL-Plus
Western blotting detection system (GE Healthcare Life Sciences) and
Detector Lumino Imaging Analyzer model FAS-1000 (Toyobo, Co., Ltd.,
Osaka, Japan). Intensities of protein bands were quantitated using
ImageJ (http://rsbweb.nih.gov/ij/), corrected
for the intensities of the corresponding actin bands, and
normalized to the intensity of the protein band obtained from
vector WT1[−−] transfectants (defined as 1). Two patterns of
experimental conditions, which differed in the amount of protein
applied to each gel lane and the dilution factors of the antibodies
(Table I), were used. However, the
intensities of protein bands were compared under the same
conditions.
 | Table ITwo patterns of experimental
conditions used in western blotting. |
Table I
Two patterns of experimental
conditions used in western blotting.
| Primary
antibody | Amount of protein
per lane
(μg)
| Dilution factor
|
|---|
Primary antibody
| Secondary antibody
|
|---|
| A | B | A | B | A | B |
|---|
| WT1 antibodies | | | | | | |
| 6F-H2 | 10 | 20 | 40 | 15 | 4000 | 1500 |
| ab89901 | 10 | 20 | 4000 | 500 | 10000 | 7000 |
| C-19 | 10 | 20 | 2000 | 150 | 10000 | 10000 |
| GFP antibody | 10 | 40 | 300 | 50 | 10000 | 3000 |
| Actin antibody | 5 | 800 | 10000 |
Quantitative reverse
transcriptase-polymerase chain reaction (qRT-PCR)
Total RNA was extracted from cultured cells using
the TRI reagent (Sigma-Aldrich). Possible DNA contamination was
eliminated using RQ1 RNase-Free DNase (Promega, Tokyo, Japan).
After the DNase treatment, the absence of DNA contamination was
confirmed by PCR using the primers for β-actin (described below).
cDNA was synthesized from mRNA by reverse transcription reaction
using the SuperScript VILO cDNA Synthesis kit (Invitrogen). cDNA
diluted 20-fold with double-distilled water was used as a template
for quantitative PCR. Quantitative PCR was performed by two
methods: the intercalator-based method using Power SYBR-Green PCR
Master Mix (Applied Biosystems, Tokyo, Japan) and the fluorescent
probe-based method using TaqMan Universal Master Mix II (Applied
Biosystems). Reaction conditions consisted of 40 cycles of 94°C for
30 sec, 60.4°C for 30 sec and 72°C for 30 sec. All reactions were
performed in triplicate. The results of quantitative PCR were
analyzed on an ABI PRISM 7000 Sequence detection system (Applied
Biosystems). Expression levels of WT1 mRNA were normalized to the
corresponding β-actin mRNA and relativized considering those of WT1
mRNA of K562 as 1.
The base sequences of primers and internal probes
were as follows: WT1 sense primer, 5′-TGCGGAGCCCAATACAGAATACAC-3′
and WT1 reverse primer, 5′-TCAGATGCCGACCGTACAAGAG-3′; WT1 internal
probe, 5′-FAM-AGAGGCATTCAGGATGTGCGACG-TAMRA-3′; β-actin sense
primer, 5′-CAACCGCGAGAAGATGACCC-3′ and β-actin reverse primer,
5′-ACCGGAGTCCATCACGATGC-3′; β-actin internal probe,
5′-FAM-CCAGGCTGTGCTATCCCTGTACGC-TAMRA-3′. The primers for WT1 were
designed to bind to WT1 cDNA between exons 6 and 7, so that the
four spliced variants of WT1 cDNA were all recognized (Fig. 1). The primers for β-actin were
designed to bind to β-actin cDNA between exons 3 and 4.
Statistical analysis
Correlation of paired quantitative variables was
evaluated by the Spearman rank method using StatView version 5.0
software (SAS Institute, Inc., Cary, NC, USA). Differences were
considered significant when r >0.4 and P<0.05.
Results
WT1 expression in transfected cells
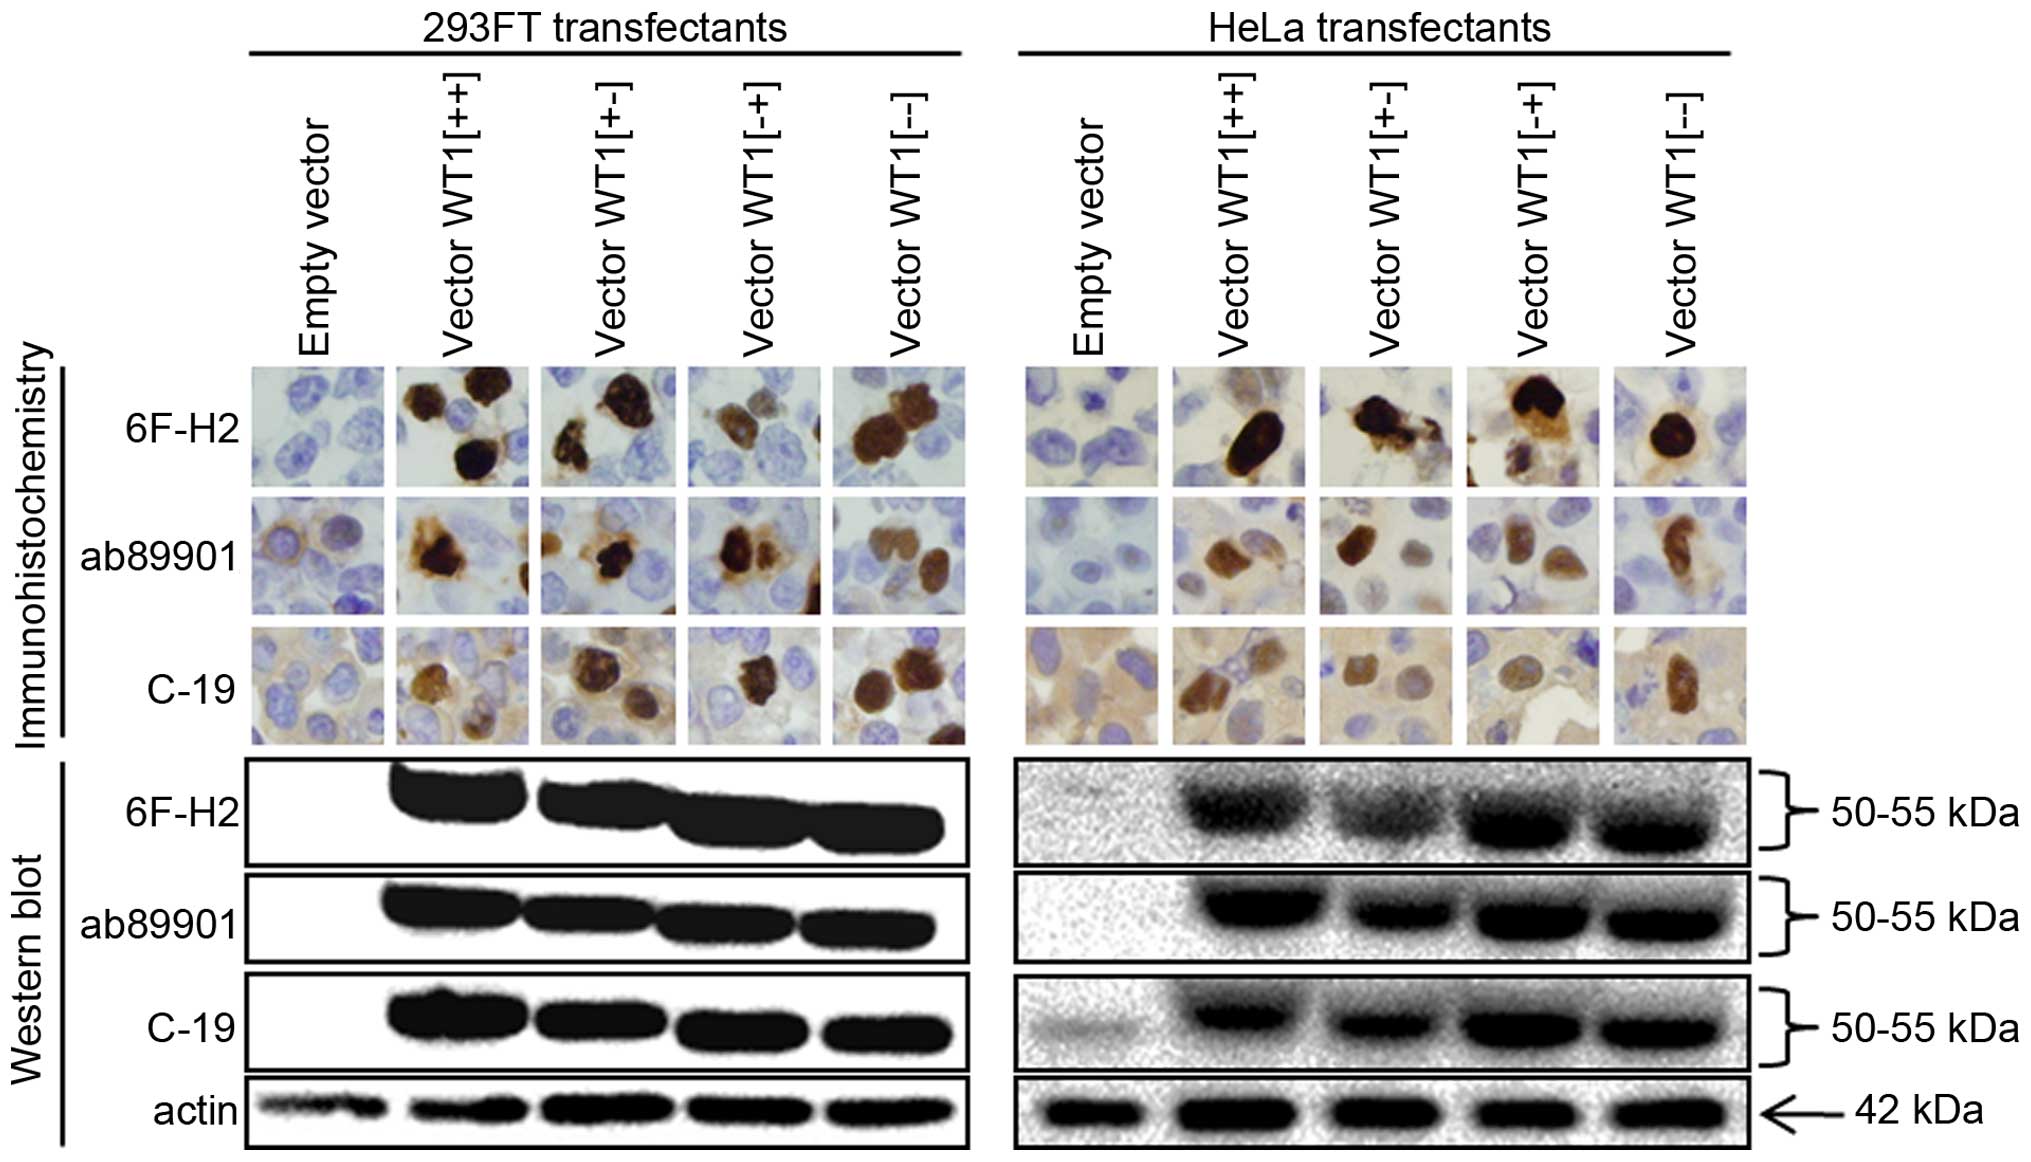
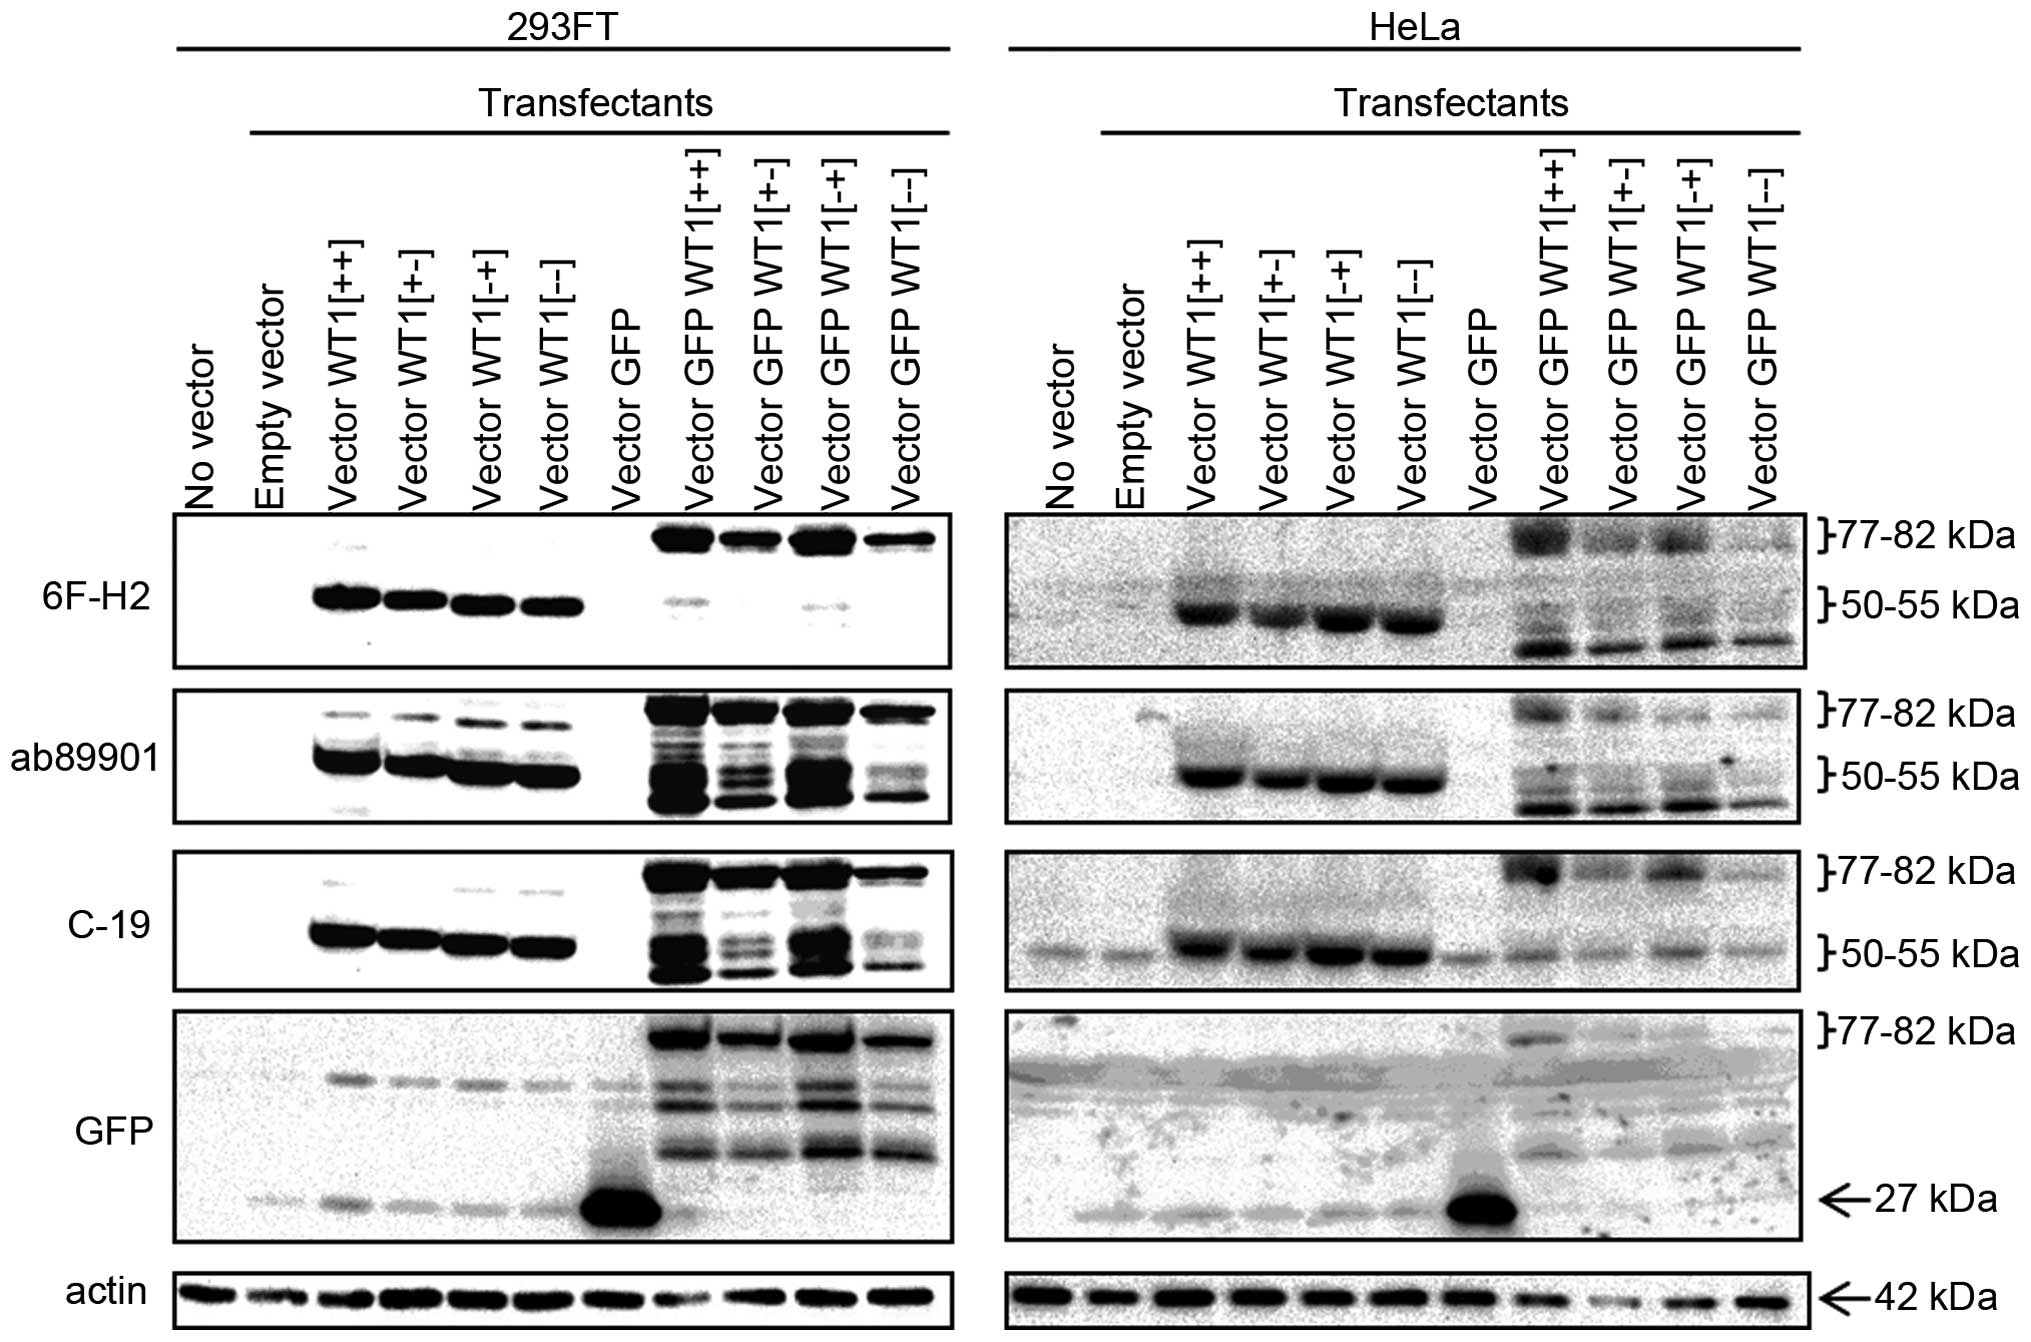
We transfected 293FT and HeLa with vectors encoding
the four splice variants of WT1 (Fig.
1). WT1-transfected cells were expected to produce excessive
exogenous WT1 protein. As shown in Fig. 3, western blotting with two
WT1-specific monoclonal antibodies (6F-H2 and ab89901) and one
WT1-reactive polyclonal antibody (C-19) yielded clear 50–55-kDa
bands in cells expressing any of the four WT1 variants, even though
the antibodies recognize different sites (Fig. 1). Immunohistochemistry with these
three antibodies resulted in strong staining in the nucleus of all
WT1 transfectants, corresponding to the appearance of the 50–55-kDa
bands in western blotting. In addition to the nuclear staining,
these antibodies yielded modest cytoplasmic staining in various
cells including empty-vector transfectants. Especially, C-19
yielded significant cytoplasmic immunostaining in all tested cells,
regardless of their transfection status. In conclusion, enforced
WT1 expression was detected in the nucleus of the two different
cell lines by the three different antibodies. Polyclonal C-19
antibody may exhibit non-specific as well as specific reactivity.
We used these transfectants as positive and negative controls for
further analyses.
Comparison of the results of
WT1-immunohistochemistry with those of other detection methods
using cell lines
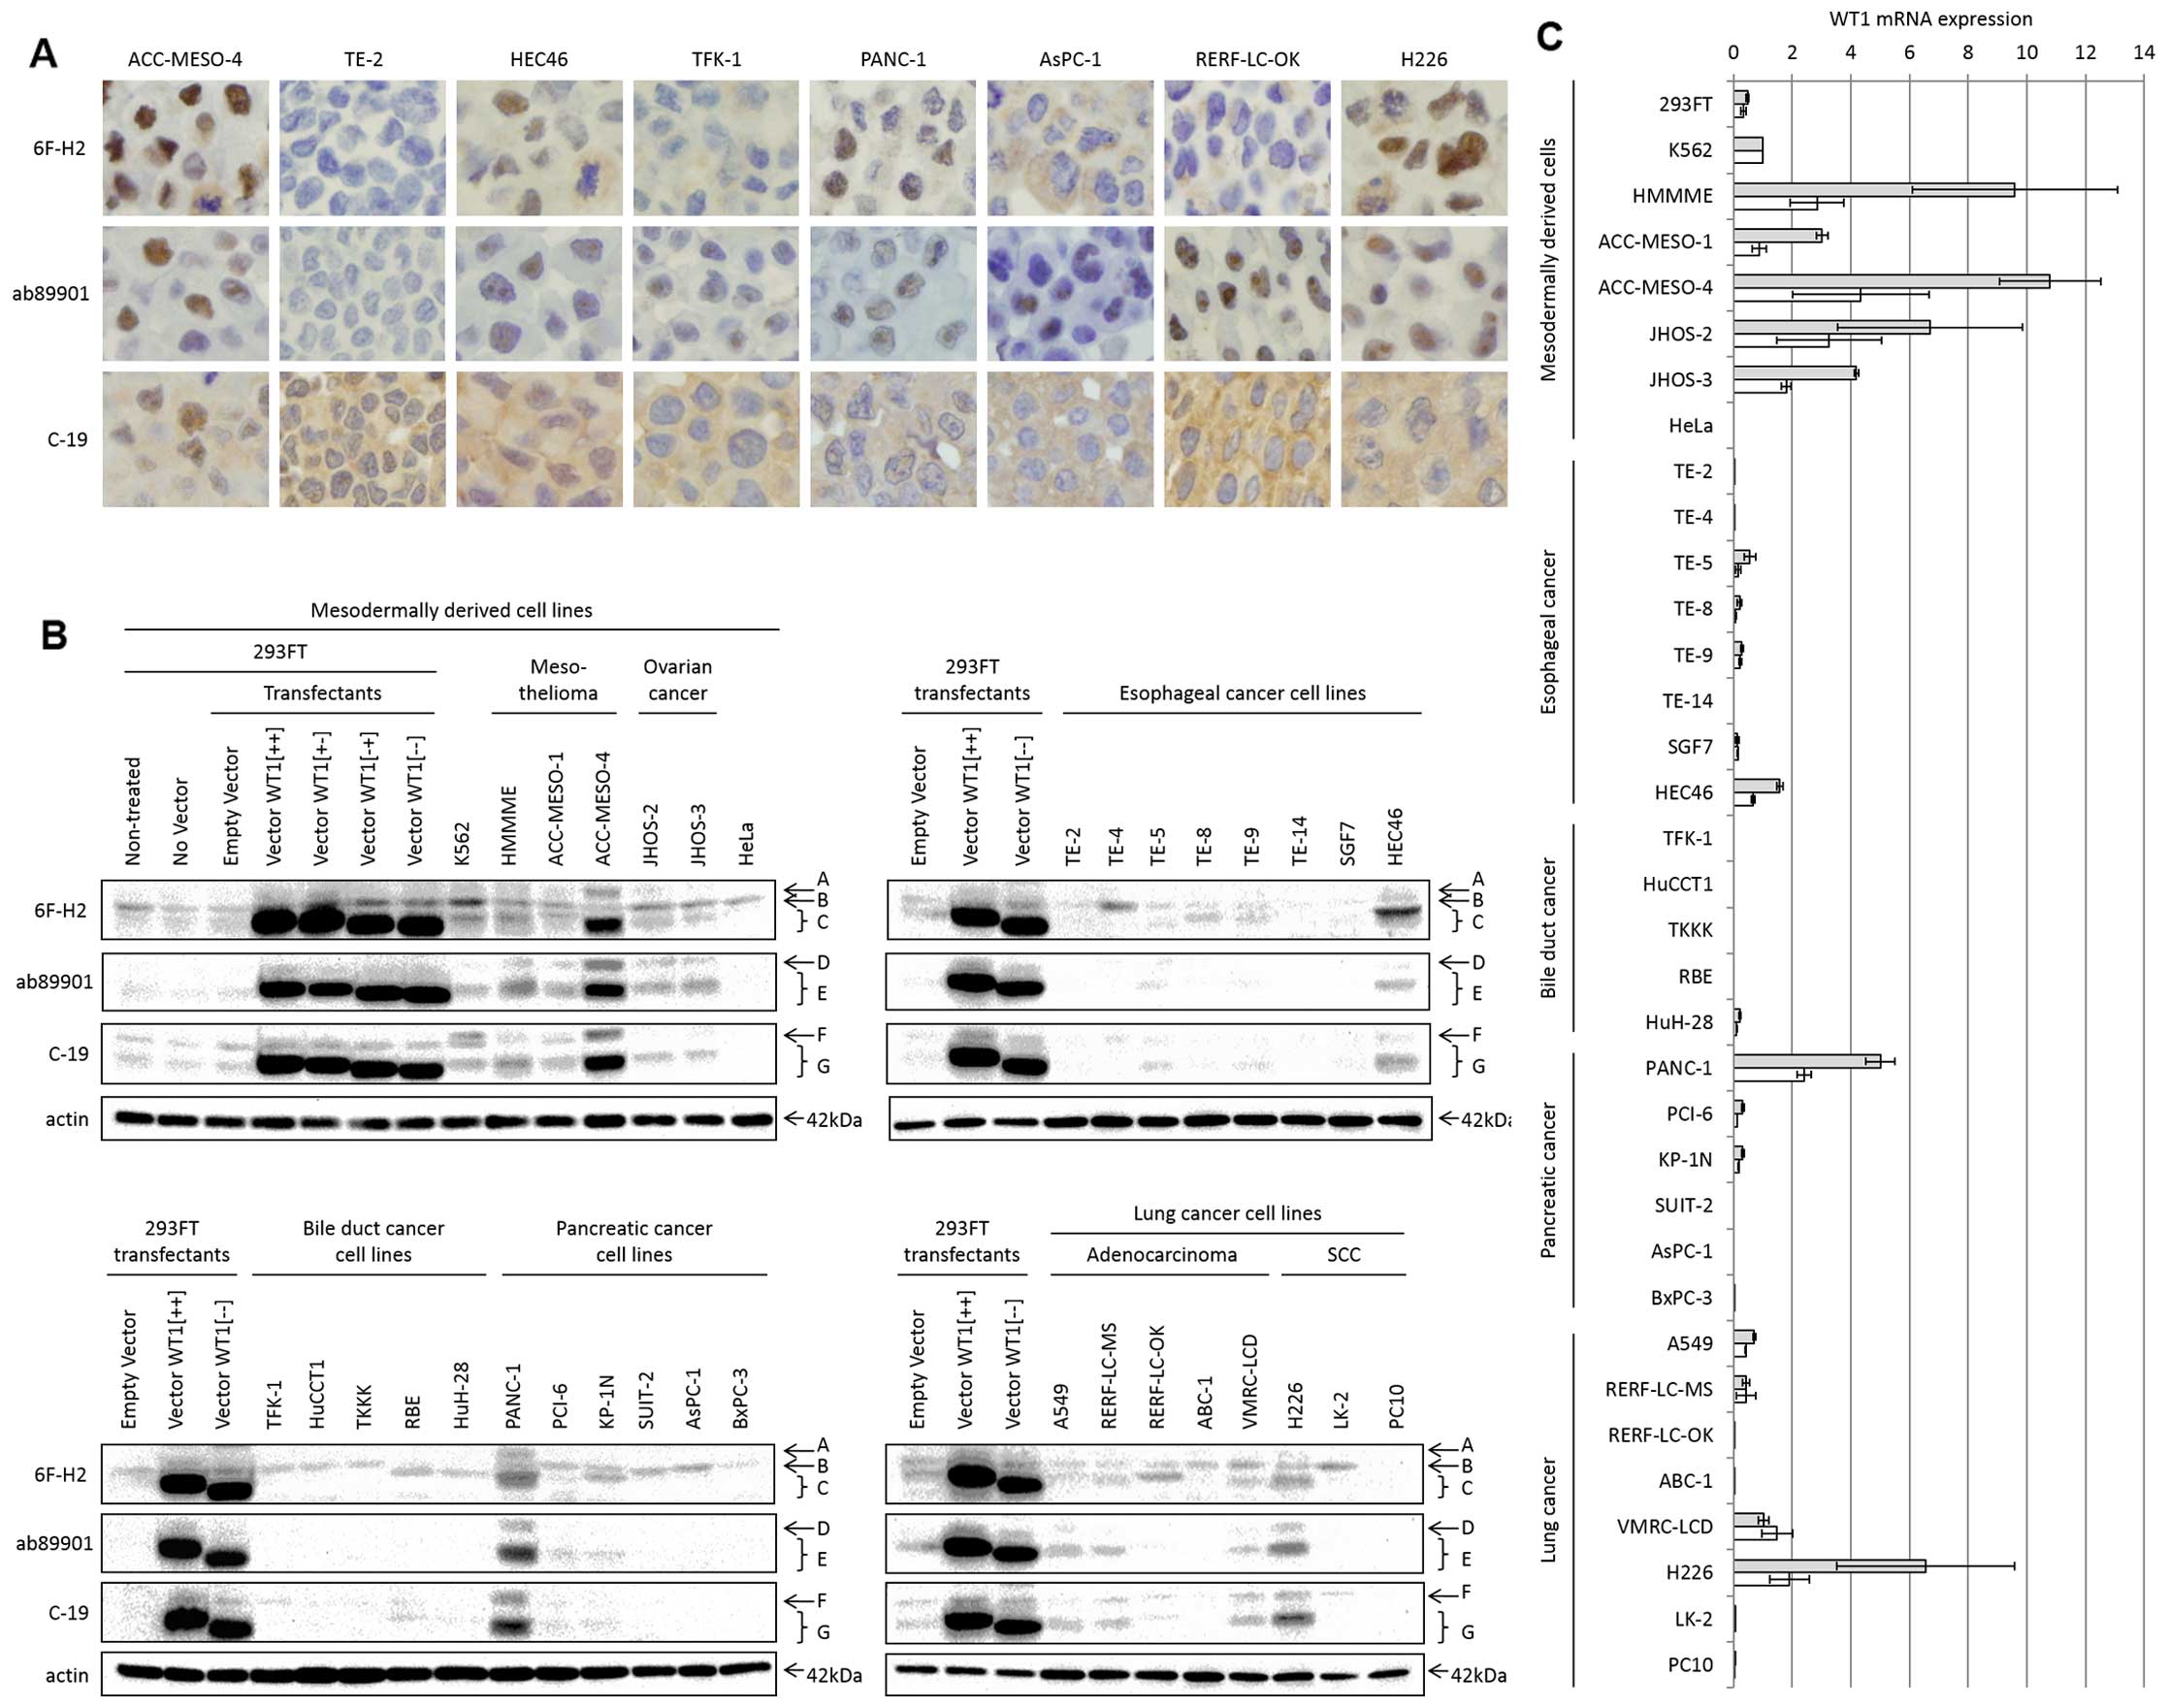
By itself, immunohistochemistry does not distinguish
specific from non-specific staining, because it does not provide
the information such as the molecular weights or sequences of the
detected proteins. To verify the specificity for endogenous WT1 in
immunohistochemistry, we compared results of
WT1-immunohistochemistry with those of western blotting and qRT-PCR
in 35 human cell lines. Fig. 4
shows the results of immunohistochemistry, western blotting and
qRT-PCR. For immunohistochemistry, immunostaining scores were
calculated independently in the entire nucleus, the nuclear bodies
and the cytoplasm (Fig. 2). In
western blotting, multiple protein bands with different molecular
weights were observed; these bands were classified into A-G
(Fig. 4B) and their intensities
were, respectively, quantified. In qRT-PCR, we used both
intercalator-based and fluorescent probe-based methods. Table II shows all quantified results:
the immunostaining scores, the intensities of western blotting
bands and WT1 mRNA levels.
| Table IIQuantitative results of
immunohistochemistry, western blotting and qRT-PCR in 35 human cell
lines. |
Table II
Quantitative results of
immunohistochemistry, western blotting and qRT-PCR in 35 human cell
lines.
| Cell lines | Immunostaining
scores
| Intensities of
western blotting bands
| WT1 mRNA expression
|
|---|
6F-H2
| ab89901
| C-19
| 6F-H2
| ab89901
| C-19
|
|---|
| EN | NB | CP | EN | NB | CP | EN | NB | CP | A | B | C | D | E | F | G | IC | FP |
|---|
| 293FT | 0.000 | 0.000 | 0.000 | 0.282 | 0.204 | 0.082 | 0.000 | 0.000 | 0.938 | 0.022 | 0.193 | 0.104 | 0.004 | 0.050 | 0.077 | 0.093 | 0.475 | 0.335 |
| K562 | 0.600 | 0.000 | 0.596 | 0.055 | 0.555 | 0.100 | 0.000 | 0.000 | 1.880 | 0.168 | 0.397 | 0.287 | 0.014 | 0.119 | 0.244 | 0.162 | 1.000 | 1.000 |
| HMMME | 1.830 | 0.000 | 0.389 | 0.958 | 0.108 | 0.004 | 0.241 | 0.026 | 1.585 | 0.118 | 0.180 | 0.241 | 0.077 | 0.256 | 0.064 | 0.262 | 9.595 | 2.852 |
| ACC-MESO-1 | 0.539 | 0.000 | 0.189 | 0.118 | 0.527 | 0.036 | 0.030 | 0.000 | 0.753 | 0.063 | 0.133 | 0.174 | 0.045 | 0.154 | 0.074 | 0.155 | 3.015 | 0.876 |
| ACC-MESO-4 | 1.705 | 0.000 | 0.188 | 0.839 | 0.195 | 0.020 | 0.639 | 0.136 | 2.055 | 0.128 | 0.099 | 0.488 | 0.224 | 0.552 | 0.248 | 0.664 | 10.795 | 4.335 |
| JHOS-2 | 0.508 | 0.000 | 0.220 | 0.255 | 0.176 | 0.056 | 0.000 | 0.000 | 1.465 | 0.051 | 0.253 | 0.169 | 0.097 | 0.159 | 0.023 | 0.109 | 6.694 | 3.256 |
| JHOS-3 | 0.417 | 0.000 | 0.000 | 1.180 | 0.060 | 0.049 | 0.273 | 0.000 | 2.020 | 0.021 | 0.171 | 0.080 | 0.069 | 0.201 | 0.037 | 0.086 | 4.183 | 1.797 |
| HeLa | 0.019 | 0.000 | 0.902 | 0.228 | 0.142 | 0.056 | 0.000 | 0.000 | 1.909 | 0.006 | 0.111 | 0.003 | 0.005 | 0.002 | 0.005 | 0.001 | 0.000 | 0.000 |
| TE-2 | 0.000 | 0.000 | 0.000 | 0.000 | 0.000 | 0.000 | 0.093 | 0.060 | 1.805 | 0.024 | 0.055 | 0.044 | 0.003 | 0.007 | 0.012 | 0.013 | 0.008 | 0.011 |
| TE-4 | 0.000 | 0.000 | 0.039 | 0.130 | 0.094 | 0.016 | 0.025 | 0.000 | 1.955 | 0.019 | 0.180 | 0.045 | 0.007 | 0.003 | 0.021 | 0.006 | 0.002 | 0.003 |
| TE-5 | 0.006 | 0.000 | 0.838 | 0.356 | 0.284 | 0.062 | 0.000 | 0.000 | 1.665 | 0.006 | 0.039 | 0.033 | 0.014 | 0.024 | 0.017 | 0.036 | 0.551 | 0.166 |
| TE-8 | 0.000 | 0.000 | 0.000 | 0.106 | 0.635 | 0.005 | 0.030 | 0.109 | 1.500 | 0.007 | 0.030 | 0.056 | 0.006 | 0.005 | 0.007 | 0.010 | 0.200 | 0.064 |
| TE-9 | 0.008 | 0.000 | 0.230 | 0.068 | 0.274 | 0.025 | 0.080 | 0.000 | 1.850 | 0.012 | 0.046 | 0.056 | 0.005 | 0.011 | 0.010 | 0.029 | 0.287 | 0.216 |
| TE-14 | 0.000 | 0.000 | 0.000 | 0.061 | 0.037 | 0.000 | 0.048 | 0.000 | 1.985 | 0.004 | 0.015 | 0.009 | 0.001 | 0.000 | 0.009 | 0.002 | 0.000 | 0.000 |
| SGF7 | 0.016 | 0.000 | 0.158 | 0.070 | 0.079 | 0.125 | 0.238 | 0.073 | 2.025 | 0.002 | 0.013 | 0.019 | 0.001 | 0.001 | 0.012 | 0.014 | 0.122 | 0.141 |
| HEC46 | 0.729 | 0.000 | 0.188 | 0.107 | 0.246 | 0.056 | 0.231 | 0.067 | 1.725 | 0.041 | 0.120 | 0.327 | 0.012 | 0.086 | 0.032 | 0.160 | 1.576 | 0.653 |
| TFK-1 | 0.000 | 0.000 | 0.477 | 0.068 | 0.320 | 0.017 | 0.028 | 0.009 | 1.405 | 0.016 | 0.131 | 0.011 | 0.008 | 0.003 | 0.032 | 0.004 | 0.000 | 0.000 |
| HuCCT1 | 0.000 | 0.000 | 0.000 | 0.000 | 0.269 | 0.055 | 0.012 | 0.000 | 1.580 | 0.014 | 0.077 | 0.002 | 0.002 | 0.002 | 0.015 | 0.012 | 0.000 | 0.000 |
| TKKK | 0.026 | 0.000 | 0.387 | 0.580 | 0.165 | 0.000 | 0.023 | 0.000 | 1.455 | 0.009 | 0.077 | 0.001 | 0.003 | 0.003 | 0.017 | 0.015 | 0.000 | 0.000 |
| RBE | 0.013 | 0.000 | 0.501 | 0.072 | 0.422 | 0.041 | 0.010 | 0.020 | 1.690 | 0.008 | 0.062 | 0.092 | 0.001 | 0.002 | 0.039 | 0.059 | 0.000 | 0.000 |
| HuH-28 | 0.063 | 0.000 | 0.000 | 0.011 | 0.019 | 0.000 | 0.000 | 0.000 | 1.029 | 0.008 | 0.010 | 0.069 | 0.001 | 0.002 | 0.007 | 0.005 | 0.218 | 0.103 |
| PANC-1 | 0.775 | 0.000 | 0.396 | 0.453 | 0.103 | 0.010 | 0.128 | 0.016 | 1.405 | 0.171 | 0.204 | 0.459 | 0.138 | 0.517 | 0.217 | 0.539 | 5.003 | 2.398 |
| PCI-6 | 0.000 | 0.000 | 0.624 | 0.198 | 0.140 | 0.062 | 0.016 | 0.000 | 1.550 | 0.023 | 0.148 | 0.061 | 0.010 | 0.072 | 0.030 | 0.056 | 0.310 | 0.120 |
| KP-1N | 0.038 | 0.019 | 0.467 | 0.410 | 0.087 | 0.000 | 0.007 | 0.000 | 2.055 | 0.016 | 0.099 | 0.182 | 0.006 | 0.070 | 0.021 | 0.054 | 0.315 | 0.173 |
| SUIT-2 | 0.000 | 0.000 | 0.675 | 0.000 | 0.000 | 0.000 | 0.008 | 0.000 | 1.600 | 0.015 | 0.139 | 0.042 | 0.005 | 0.003 | 0.001 | 0.012 | 0.000 | 0.000 |
| AsPC-1 | 0.000 | 0.000 | 0.934 | 0.105 | 0.331 | 0.027 | 0.010 | 0.000 | 1.519 | 0.003 | 0.199 | 0.007 | 0.003 | 0.027 | 0.001 | 0.001 | 0.000 | 0.000 |
| BxPC-3 | 0.000 | 0.000 | 0.194 | 0.097 | 0.168 | 0.041 | 0.007 | 0.000 | 1.578 | 0.002 | 0.050 | 0.001 | 0.002 | 0.004 | 0.000 | 0.001 | 0.000 | 0.001 |
| A549 | 0.146 | 0.000 | 0.414 | 0.118 | 0.323 | 0.045 | 0.008 | 0.000 | 1.811 | 0.012 | 0.067 | 0.062 | 0.019 | 0.084 | 0.015 | 0.063 | 0.707 | 0.416 |
| RERF-LC-MS | 0.092 | 0.000 | 0.591 | 0.322 | 0.385 | 0.134 | 0.023 | 0.000 | 1.695 | 0.012 | 0.056 | 0.069 | 0.008 | 0.069 | 0.038 | 0.063 | 0.412 | 0.432 |
| RERF-LC-OK | 0.015 | 0.000 | 0.594 | 0.153 | 0.516 | 0.063 | 0.019 | 0.000 | 1.785 | 0.011 | 0.070 | 0.122 | 0.001 | 0.007 | 0.024 | 0.016 | 0.021 | 0.013 |
| ABC-1 | 0.000 | 0.000 | 0.109 | 0.170 | 0.154 | 0.007 | 0.015 | 0.000 | 1.539 | 0.012 | 0.072 | 0.021 | 0.001 | 0.001 | 0.008 | 0.003 | 0.002 | 0.001 |
| VMRC-LCD | 0.298 | 0.000 | 0.489 | 0.329 | 0.013 | 0.026 | 0.108 | 0.000 | 1.940 | 0.015 | 0.146 | 0.088 | 0.017 | 0.055 | 0.070 | 0.088 | 1.027 | 1.483 |
| H226 | 1.490 | 0.000 | 0.261 | 0.660 | 0.314 | 0.106 | 0.044 | 0.015 | 1.941 | 0.017 | 0.099 | 0.181 | 0.066 | 0.219 | 0.115 | 0.272 | 6.547 | 1.911 |
| LK-2 | 0.032 | 0.000 | 0.595 | 0.060 | 0.346 | 0.051 | 0.038 | 0.000 | 1.600 | 0.015 | 0.253 | 0.049 | 0.009 | 0.005 | 0.040 | 0.006 | 0.051 | 0.068 |
| PC10 | 0.029 | 0.000 | 0.185 | 0.363 | 0.446 | 0.099 | 0.023 | 0.008 | 1.500 | 0.006 | 0.012 | 0.008 | 0.001 | 0.002 | 0.008 | 0.001 | 0.052 | 0.025 |
Table III shows
the relationships among quantified results from
immunohistochemistry, western blotting and qRT-PCR of the 35 cell
lines; positive correlations in significance (both r>0.4 and
P<0.05) are indicated in bold. Any relationship among the
intensities of western blot bands and WT1 mRNA expression levels
yielded strongly positive correlations with statistical
significance, with the exception of relationships including western
blot band B. The immunostaining scores of the entire nucleus
generated by monoclonal 6F-H2 positively correlated with any
intensity of western blotting bands other than band B, as well as
any WT1 mRNA expression levels. The immunostaining scores of the
entire nucleus by monoclonal ab89901 positively correlated with the
nuclear immunostaining scores by 6F-H2, intensities of multiple
western blot bands, and WT1 mRNA expression levels. By contrast,
the immunostaining scores of the entire nucleus by polyclonal C-19
did not correlate with intensities of western blot bands or WT1
mRNA expression levels. No significant correlations were observed
between any immunostaining score of the nuclear bodies or cytoplasm
generated by three WT1 antibodies and any result of western
blotting or qRT-PCR.
| Table IIIStatistical relationships among
quantified results from immunohistochemistry, western blotting and
qRT-PCR for the 35 cell lines. |
Table III
Statistical relationships among
quantified results from immunohistochemistry, western blotting and
qRT-PCR for the 35 cell lines.
| Immunostaining
scores
| Intensities of
western blot bands
| WT1 mRNA expression
|
|---|
6F-H2
| ab89901
| C-19
| 6F-H2
| ab89901
| C-19
|
|---|
| EN | NB | CP | EN | NB | CP | EN | NB | CP | A | B | C | D | E | F | G | IC | FP |
|---|
| Immunostaining
scores |
| 6F-H2 | | | | | | | | | | | | | | | | | | |
| EN | – | 0.069 (0.686) | 0.102 (0.553) | 0.515
(0.003) | 0.091 (0.594) | 0.197 (0.252) | 0.316 (0.065) | 0.238 (0.165) | 0.187 (0.275) | 0.500
(0.004) | 0.269 (0.117) | 0.722
(<0.001) | 0.658
(<0.001) | 0.686
(<0.001) | 0.625
(<0.001) | 0.733
(<0.001) | 0.794
(<0.001) | 0.800
(<0.001) |
| NB | 0.069 (0.686) | – | 0.085 (0.619) | 0.187 (0.276) | 0.017 (0.322) | −0.247 (0.150) | −0.179 (0.297) | −0.113 (0.508) | 0.280 (0.102) | 0.060 (0.729) | 0.000
(>0.999) | 0.204 (0.235) | −0.009 (0.960) | 0.102 (0.552) | −0.008 (0.961) | 0.034 (0.843) | 0.051 (0.765) | 0.051 (0.765) |
| CP | 0.102 (0.553) | 0.085 (0.619) | – | 0.071 (0.679) | 0.251 (0.143) | 0.231 (0.177) | −0.314 (0.067) | −0.256 (0.136) | 0.041 (0.810) | −0.059 (0.732) | 0.334 (0.052) | 0.028 (0.871) | 0.207 (0.227) | 0.175 (0.308) | 0.102 (0.554) | 0.049 (0.776) | −0.073 (0.672) | −0.069 (0.686) |
| ab 89901 | | | | | | | | | | | | | | | | | | |
| EN | 0.515
(0.003) | 0.187 (0.276) | 0.071 (0.679) | – | −0.036 (0.836) | 0.151 (0.378) | 0.215 (0.209) | 0.096 (0.574) | 0.098 (0.567) | 0.244 (0.154) | 0.198 (0.249) | 0.363 (0.034) | 0.496
(0.004) | 0.536
(0.002) | 0.420
(0.014) | 0.469
(0.006) | 0.566
(0.001) | 0.536
(0.002) |
| NB | 0.091 (0.594) | 0.017 (0.322) | 0.251 (0.143) | −0.036 (0.836) | – | 0.490
(0.004) | −0.182 (0.290) | 0.058 (0.737) | −0.267 (0.120) | −0.085 (0.619) | −0.015 (0.930) | 0.098 (0.567) | 0.042 (0.805) | 0.122 (0.476) | 0.203 (0.236) | 0.073 (0.670) | 0.042 (0.809) | 0.024 (0.891) |
| CP | 0.197 (0.252) | −0.247 (0.150) | 0.231 (0.177) | 0.151 (0.378) | 0.490
(0.004) | – | −0.155 (0.367) | −0.048 (0.780) | 0.100 (0.559) | −0.043 (0.803) | 0.075 (0.662) | 0.105 (0.539) | 0.101 (0.556) | 0.169 (0.323) | 0.289 (0.092) | 0.225 (0.190) | 0.248 (0.148) | 0.273 (0.112) |
| C−19 | | | | | | | | | | | | | | | | | | |
| EN | 0.316 (0.065) | −0.179 (0.297) | −0.314 (0.067) | 0.215 (0.209) | −0.182 (0.290) | −0.155 (0.367) | – | 0.576
(<0.001) | 0.313 (0.068) | 0.282 (0.100) | −0.002 (0.989) | 0.234 (0.173) | 0.287 (0.094) | 0.255 (0.137) | 0.336 (0.050) | 0.298 (0.082) | 0.314 (0.067) | 0.331 (0.053) |
| NB | 0.238 (0.165) | −0.113 (0.508) | −0.256 (0.136) | 0.096 (0.574) | 0.058 (0.737) | −0.048 (0.780) | 0.576
(<0.001) | – | 0.081 (0.636) | 0.178 (0.300) | −0.189 (0.270) | 0.277 (0.106) | 0.125 (0.464) | 0.137 (0.425) | 0.211 (0.219) | 0.260 (0.129) | 0.227 (0.186) | 0.204 (0.234) |
| CP | 0.187 (0.275) | 0.280 (0.102) | 0.041 (0.81) | 0.098 (0.567) | −0.267 (0.120) | 0.100 (0.559) | 0.313 (0.068) | 0.081 (0.636) | – | −0.021 (0.900) | −0.107 (0.534) | 0.148 (0.389) | 0.102 (0.552) | 0.077 (0.654) | 0.096 (0.576) | 0.144 (0.402) | 0.700 (0.484) | 0.162 (0.346) |
| Intensities of
western blot bands |
| 6F-H2 | | | | | | | | | | | | | | | | | | |
| A | 0.500
(0.004) | 0.060 (0.729) | −0.059 (0.732) | 0.244 (0.154) | −0.085 (0.619) | −0.043 (0.803) | 0.282 (0.100) | 0.178 (0.300) | −0.021 (0.900) | – | 0.673
(<0.001) | 0.734
(<0.001) | 0.717
(<0.001) | 0.732
(<0.001) | 0.734
(<0.001) | 0.744
(<0.001) | 0.653
(<0.001) | 0.640
(<0.001) |
| B | 0.269 (0.117) | 0.000
(>0.999) | 0.334 (0.052) | 0.198 (0.249) | −0.015 (0.930) | 0.075 (0.662) | −0.002 (0.989) | −0.189 (0.270) | −0.107 (0.534) | 0.673
(<0.001) | – | 0.392 (0.022) | 0.589
(<0.001) | 0.542
(0.002) | 0.531
(0.002) | 0.404
(0.019) | 0.310 (0.071) | 0.321 (0.062) |
| C | 0.722
(<0.001) | 0.204 (0.235) | 0.028 (0.871) | 0.363 (0.034) | 0.098 (0.567) | 0.105 (0.539) | 0.234 (0.173) | 0.277 (0.106) | 0.148 (0.389) | 0.734
(<0.001) | 0.392 (0.022) | – | 0.623
(<0.001) | 0.772
(<0.001) | 0.757
(<0.001) | 0.866
(<0.001) | 0.819
(<0.001) | 0.809
(<0.001) |
| Intensities of
western blot bands |
| ab 89901 | | | | | | | | | | | | | | | | | | |
| D | 0.658
(<0.001) | −0.009 (0.960) | 0.207 (0.227) | 0.496
(0.004) | 0.042 (0.805) | 0.101 (0.556) | 0.287 (0.094) | 0.125 (0.464) | 0.102 (0.552) | 0.717
(<0.001) | 0.589
(<0.001) | 0.623
(<0.001) | − | 0.875
(<0.001) | 0.647
(<0.001) | 0.739
(<0.001) | 0.795
(<0.001) | 0.778
(<0.001) |
| E | 0.686
(<0.001) | 0.102 (0.552) | 0.175 (0.308) | 0.536
(0.002) | 0.122 (0.476) | 0.169 (0.323) | 0.255 (0.137) | 0.137 (0.425) | 0.077 (0.654) | 0.732
(<0.001) | 0.542
(0.002) | 0.772
(<0.001) | 0.875
(<0.001) | – | 0.672
(<0.001) | 0.836
(<0.001) | 0.855
(<0.001) | 0.847
(<0.001) |
| C-19 | | | | | | | | | | | | | | | | | | |
| F | 0.625
(<0.001) | −0.008 (0.961) | 0.102 (0.554) | 0.420
(0.014) | 0.203 (0.236) | 0.289 (0.092) | 0.336 (0.050) | 0.211 (0.219) | 0.096 (0.576) | 0.734
(<0.001) | 0.531
(0.002) | 0.757
(<0.001) | 0.647
(<0.001) | 0.672
(<0.001) | – | 0.830
(<0.001) | 0.667
(<0.001) | 0.671
(<0.001) |
| G | 0.733
(<0.001) | 0.034 (0.843) | 0.049 (0.776) | 0.469
(0.006) | 0.073 (0.670) | 0.225 (0.190) | 0.298 (0.082) | 0.260 (0.129) | 0.144 (0.402) | 0.744
(<0.001) | 0.404
(0.019) | 0.866
(<0.001) | 0.739
(<0.001) | 0.836
(<0.001) | 0.830
(<0.001) | – | 0.853
(<0.001) | 0.844
(<0.001) |
| WT1 mRNA
expression | | | | | | | | | | | | | | | | | | |
| IC | 0.794
(<0.001) | 0.051 (0.765) | −0.073 (0.672) | 0.566
(0.001) | 0.042 (0.809) | 0.248 (0.148) | 0.314 (0.067) | 0.227 (0.186) | 0.700 (0.484) | 0.653
(<0.001) | 0.310 (0.071) | 0.819
(<0.001) | 0.795
(<0.001) | 0.855
(<0.001) | 0.667
(<0.001) | 0.853
(<0.001) | | 0.986
(<0.001) |
| FP | 0.800
(<0.001) | 0.051 (0.765) | −0.069 (0.686) | 0.536
(0.002) | 0.024 (0.891) | 0.273 (0.112) | 0.331 (0.053) | 0.204 (0.234) | 0.162 (0.346) | 0.640
(<0.001) | 0.321 (0.062) | 0.809
(<0.001) | 0.778
(<0.001) | 0.847
(<0.001) | 0.671
(<0.001) | 0.844
(<0.001) | 0.986
(<0.001) | |
These results suggest that western blot bands except
for band B and WT1 mRNA expression levels are credible indicators
of endogenous WT1 expression. In attunement with them, nuclear
immunostaining using 6F-H2 and ab89901 seems to quantitatively
reflect endogenous WT1 expression. By contrast, cytoplasmic
immunostaining using WT1 antibodies does not specifically reflect
WT1 expression because it did not have any significant association
with results from other detection methods.
Intracellular localization of GFP-WT1
fusion protein
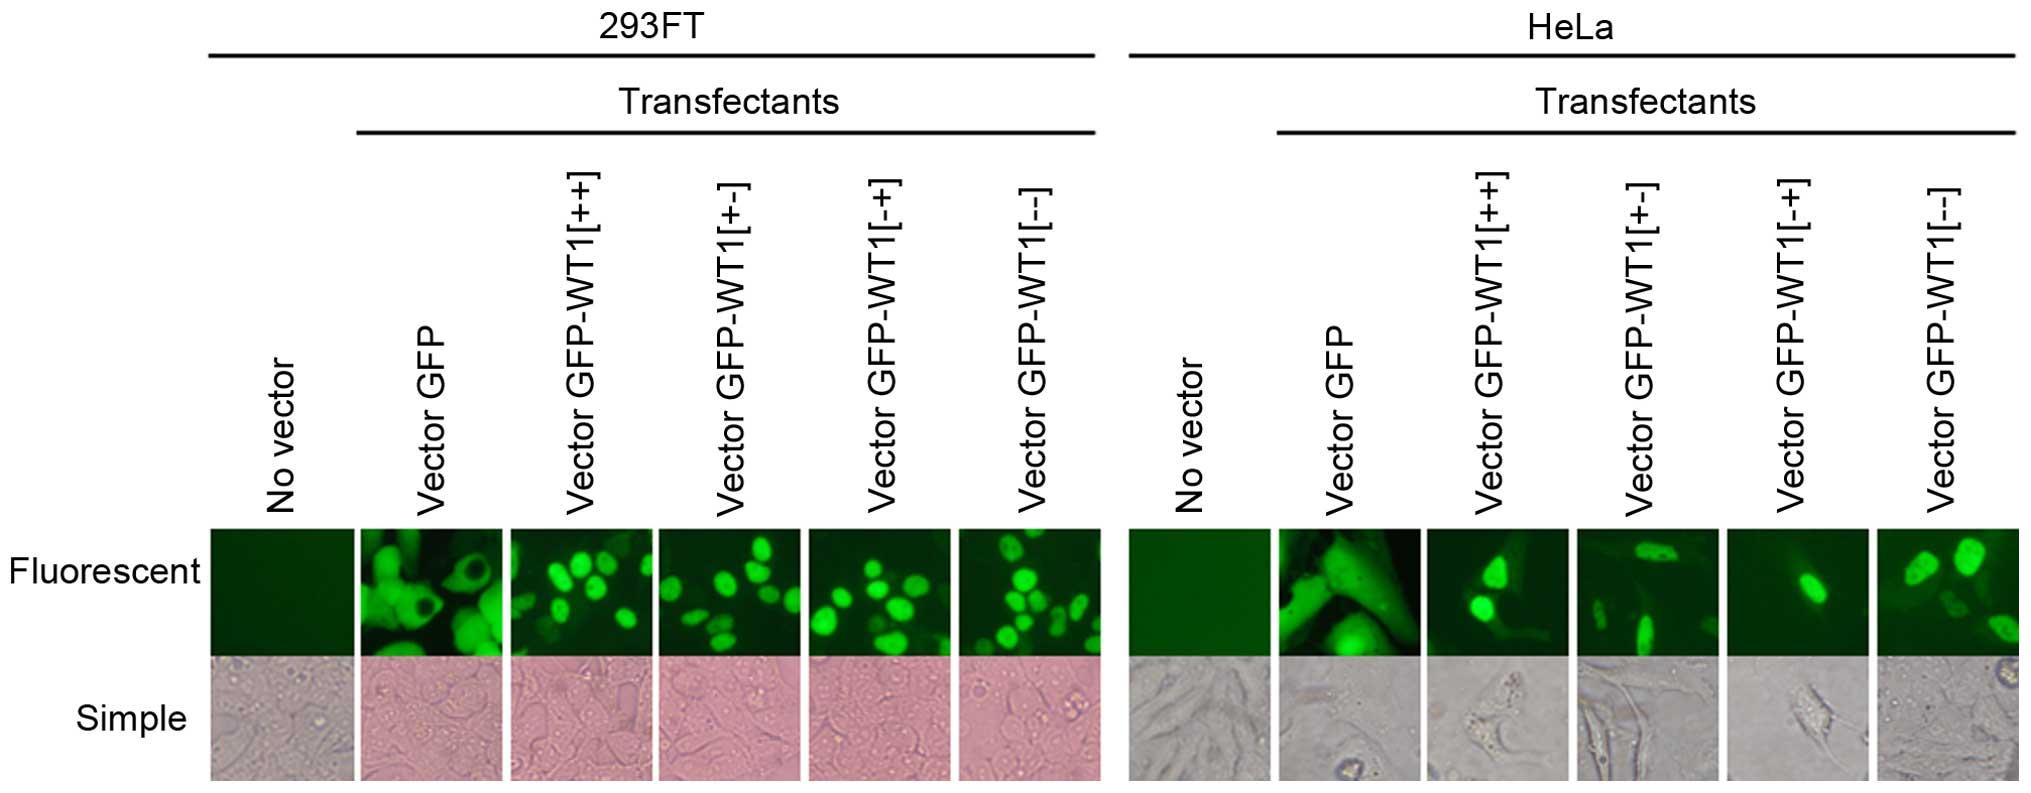
To verify the intracellular localization of WT1
protein by another method, we examined the localization of GFP-WT1
fusion protein. Fig. 5 shows
microscopic images of cells transfected with vector GFP-WT1. While
green fluorescence was observed in both the nucleus and the
cytoplasm of cells transduced with GFP alone, it was observed only
in the nucleus of cells transfected with vector GFP-WT1. Expression
of GFP-WT1 fusion protein in the transfectants was confirmed by
western blotting (Fig. 6). These
results indicate that WT1 protein strongly prefers to be
concentrated in the nucleus supporting the idea that nuclear
immunostaining quantitatively reflects WT1 expression.
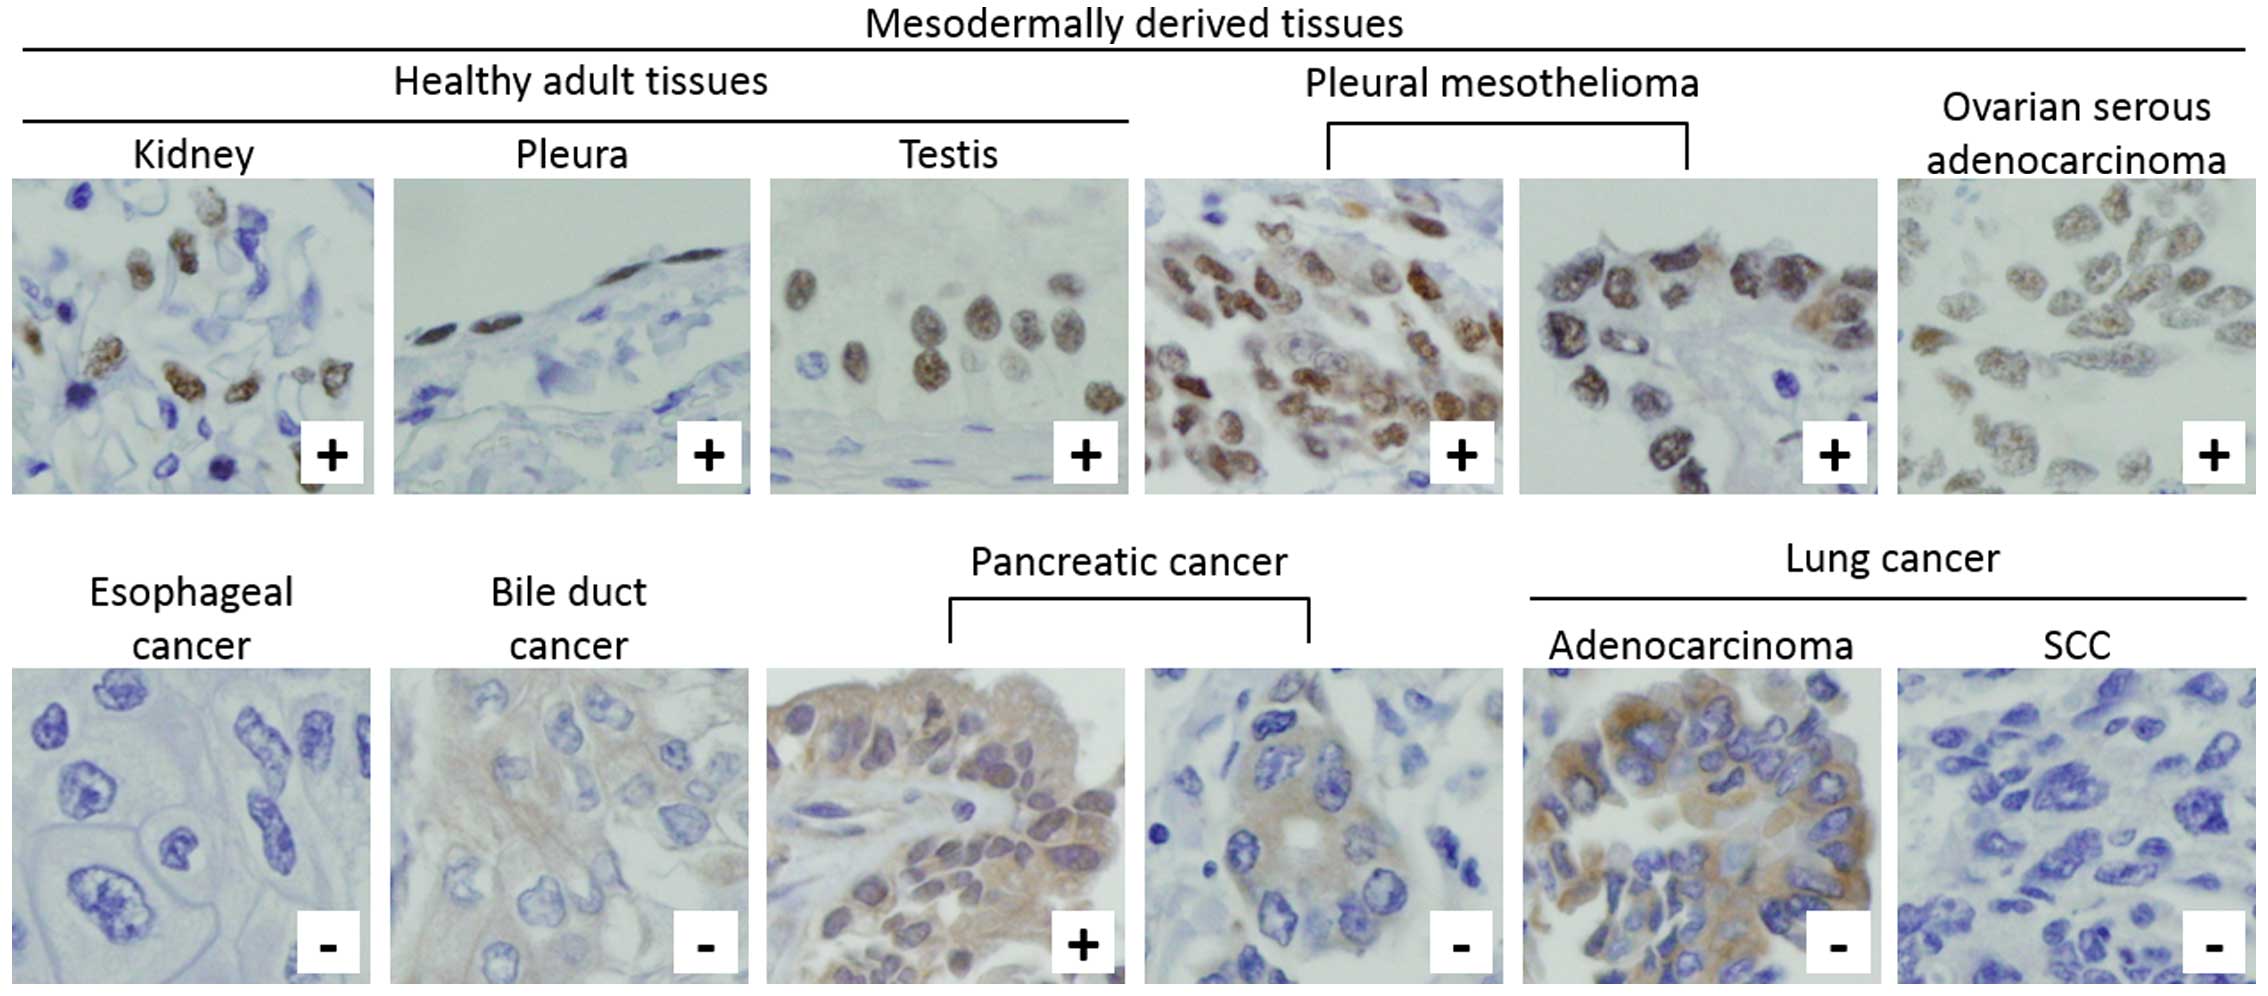
WT1 expression in human tissue
samples
We examined WT1 expression in primary cancer tissue
samples of esophagus, bile duct, pancreas and lung with the
corresponding normal epithelial tissues by immunohistochemistry
using 6F-H2, an antibody shown above to be appropriate for
WT1-immunohistochemistry. As shown in Fig. 7 and Table IV, nuclear immunostaining was
almost never detected in cancer cells or normal epithelium of
esophagus, bile duct, pancreas, and lung, whereas it was firmly
observed in mesothelioma, ovarian cancer and healthy tissues such
as kidney and pleura.
| Table IVImmunohistochemical results from
human tissue samples. |
Table IV
Immunohistochemical results from
human tissue samples.
| Human tissue
samples | Immunostaining
(6F-H2)
|
|---|
Cancer cells
| Normal epithelium
|
|---|
Entire
nucleus
n/total, (%) | Cytoplasm
n/total, (%) | Entire
nucleus
n/total, (%) | Cytoplasm
n/total, (%) |
|---|
| Esophagus | 0/99 (0) | 79/99 (80) | 0/89 (0) | 38/89 (43) |
| Bile duct | 0/95 (0) | 59/95 (62) | 0/54 (0) | 33/54 (61) |
| Pancreas | 3/98 (3.1) | 58/98 (59) | 1/53
(1.9) | 5/53
(9.4) |
| Lung | | | | |
|
(Adenocarcinoma) | 0/164 (0) | 83/164 (51) | 0/158 (0) | 0/158 (0) |
| (Squamous cell
carcinoma) | 0/71 (0) | 33/71 (46) | 0/61 (0) | 0/61 (0) |
| (Cancers of other
histological types) | 0/14 (0) | 5/14 (36) | 0/11 (0) | 0/11 (0) |
Discussion
In the present study, we attempted to validate
WT1-immunohistochemistry for solid tumors quantifying WT1 gene
products. Utilizing multiple different detection methods and WT1
antibodies, along with defined positive and negative controls, we
revealed that only nuclear staining by immunohistochemistry using
appropriate WT1-specific antibodies positively correlates, in a
statistically significant manner, with the intensities of western
blot bands of defined molecular weights and with mRNA levels
determined by qRT-PCR. In contrast, the cytoplasmic immunostaining
is considered to be non-specific because it did not correlate with
any results from other specific examinations. The nuclear
immunostaining was hardly observed in primary esophageal, bile
duct, pancreatic, or lung cancer although it was firmly observed in
mesodermally derived tissues. These results indicate that WT1
expression in those non-mesodermal solid cancers is imperceptible
compared to mesodermal tissues. On the other hand, cytoplasmic
immunostaining was frequently observed in those solid cancers and
WT1 would be estimated to be overexpressed in those solid cancers
if researchers consider the cytoplasmic staining as WT1
expression.
Researchers involved in WT1-targeted treatment of
cancer presume that WT1 is overexpressed in various malignancies
including non-mesodermal solid cancers (17–28).
There is little controversy regarding the observation that solid
cancers of non-mesodermal origin rarely show nuclear immunostaining
but frequently exhibit cytoplasmic immunostaining, while mesodermal
tissues provide the nuclear immunostaining (8–16,18–24,28).
Differences of the conclusions about WT1 expression in
non-mesodermal solid cancers stem largely from a discrepancy in
interpretations of the cytoplasmic immunostaining. Our conclusion
is supported by many pathological studies. Pathologists generally
consider the cytoplasmic immunostaining for WT1 as non-specific
reaction; they have described that WT1 is hardly expressed in
non-mesodermal solid cancers such as colon cancer (0%) (11,15),
pancreatic cancer (0%) (16),
thyroid cancer (0%) (11),
prostate cancer (0%) (11), lung
cancer (0–20%) (8–15) and breast cancer (0–7%) (11,13,15).
The pathologists thus use WT1 to distinguish mesothelioma from lung
cancers (8,10–13),
or ovarian cancer cells from pancreatic cancer cells in malignant
ascites (16). The present study
scientifically supports the pathologists to judge the cytoplasmic
immunostaining for WT1 as non-specific.
We validated WT1-immunohistochemistry in human cell
lines using multiple detection methods but examined WT1 expression
in human primary tissues only by immunohistochemistry. It is
desirable to present results of western blotting and qRT-PCR in
tissue samples because subcellular localization of WT1 protein can
differ between cell lines and tissues. However, it should be noted
that tissue samples inevitably contain some fraction of stroma and
blood; these tissues should not be ignored because they can include
cell types that express WT1. Contamination of tumor samples by
non-tumor tissues is particularly important in qRT-PCR.
Furthermore, because of intra-tumor heterogeneity, samples from
different sites of the same cancer do not always exhibit consistent
protein expression (42). On
another front, the evaluation of WT1 in the fractionated organelle
may be performed when one intends to approach the question
regarding to the cytoplasmic WT1. However, the quantitative
evaluation of WT1 protein in the cytoplasmic fraction seems to be
hard because of the technical difficulty of avoiding the undesired
contamination from other fractions. WT1 has multiple isoforms other
than the four types of isoforms focused on in the present study;
the present study cannot deny the possibility that alternative WT1
transcripts mainly localize in the cytoplasm.
Although the results were obtained from the limited
study as described above, they suggest that cytoplasmic staining in
immunohistochemistry for WT1 does not reflect actual WT1
expression, WT1 is not overexpressed in non-mesodermal solid
cancers, and researchers need to reconsider whether WT1 is an
appropriate target of treatment for patients with non-mesodermal
solid cancers or not. It is definite that qRT-PCR cannot detect
several kinds of WT1 splice variants due to restrictions by the
primers. However, western blotting using multiple WT1-specific
antibodies is expected to detect more kinds of WT1 splice variants
than qRT-PCR and it is not negligible that the cytoplasmic
immunostaining did not correlate with western blotting although the
nuclear immunostaining did. Because only nuclear immunostaining by
WT1-specific monoclonal antibodies correlated with western blotting
using the same antibodies, non-coordinate cytoplasmic
immunostaining cannot be a reliable indicator of WT1 expression
regardless of other putative WT1 splice variants. We do not exclude
the possibility that a small amount of WT1 protein may exist in the
cytoplasm and the small quantity of WT1 protein can be enough for
WT1-targeted immunotherapy to work. Investigating whether
WT1-targeted treatment of cancer specifically works for human cells
with no nuclear immunostaining but considerable cytoplasmic
immunostaining would provide critical information to the
problem.
Abbreviations:
|
WT1
|
Wilms tumor 1
|
|
cDNA
|
complementary DNA
|
|
GFP
|
green fluorescent protein
|
|
PCR
|
polymerase chain reaction
|
|
qRT-PCR
|
quantitative reverse
transcriptase-polymerase chain reaction
|
|
EN
|
entire nucleus
|
|
NB
|
nuclear bodies
|
|
CP
|
cytoplasm
|
|
IC
|
intercalator-base method
|
|
FP
|
fluorescent probe-based method
|
|
SCC
|
squamous cell carcinoma
|
References
|
1
|
Call KM, Glaser T, Ito CY, Buckler AJ,
Pelletier J, Haber DA, Rose EA, Kral A, Yeger H, Lewis WH, et al:
Isolation and characterization of a zinc finger polypeptide gene at
the human chromosome 11 Wilms' tumor locus. Cell. 60:509–520. 1990.
View Article : Google Scholar : PubMed/NCBI
|
|
2
|
Gessler M, Poustka A, Cavenee W, Neve RL,
Orkin SH and Bruns GA: Homozygous deletion in Wilms tumours of a
zinc-finger gene identified by chromosome jumping. Nature.
343:774–778. 1990. View
Article : Google Scholar : PubMed/NCBI
|
|
3
|
Pritchard-Jones K, Fleming S, Davidson D,
Bickmore W, Porteous D, Gosden C, Bard J, Buckler A, Pelletier J,
Housman D, et al: The candidate Wilms' tumour gene is involved in
genitourinary development. Nature. 346:194–197. 1990. View Article : Google Scholar : PubMed/NCBI
|
|
4
|
Mundlos S, Pelletier J, Darveau A,
Bachmann M, Winterpacht A and Zabel B: Nuclear localization of the
protein encoded by the Wilms' tumor gene WT1 in embryonic and adult
tissues. Development. 119:1329–1341. 1993.PubMed/NCBI
|
|
5
|
Larsson SH, Charlieu JP, Miyagawa K,
Engelkamp D, Rassoulzadegan M, Ross A, Cuzin F, van Heyningen V and
Hastie ND: Subnuclear localization of WT1 in splicing or
transcription factor domains is regulated by alternative splicing.
Cell. 81:391–401. 1995. View Article : Google Scholar : PubMed/NCBI
|
|
6
|
Menssen HD, Renkl HJ, Rodeck U, Maurer J,
Notter M, Schwartz S, Reinhardt R and Thiel E: Presence of Wilms'
tumor gene (wt1) transcripts and the WT1 nuclear protein in the
majority of human acute leukemias. Leukemia. 9:1060–1067.
1995.PubMed/NCBI
|
|
7
|
Miwa H, Beran M and Saunders GF:
Expression of the Wilms' tumor gene (WT1) in human leukemias.
Leukemia. 6:405–409. 1992.PubMed/NCBI
|
|
8
|
Amin KM, Litzky LA, Smythe WR, Mooney AM,
Morris JM, Mews DJ, Pass HI, Kari C, Rodeck U, Rauscher FJ III, et
al: Wilms' tumor 1 susceptibility (WT1) gene products are
selectively expressed in malignant mesothelioma. Am J Pathol.
146:344–356. 1995.PubMed/NCBI
|
|
9
|
Kumar-Singh S, Segers K, Rodeck U,
Backhovens H, Bogers J, Weyler J, Van Broeckhoven C and Van Marck
E: WT1 mutation in malignant mesothelioma and WT1 immunoreactivity
in relation to p53 and growth factor receptor expression, cell-type
transition, and prognosis. J Pathol. 181:67–74. 1997. View Article : Google Scholar : PubMed/NCBI
|
|
10
|
Oates J and Edwards C: HBME-1, MOC-31, WT1
and calretinin: An assessment of recently described markers for
mesothelioma and adenocarcinoma. Histopathology. 36:341–347. 2000.
View Article : Google Scholar : PubMed/NCBI
|
|
11
|
Ordóñez NG: Value of thyroid transcription
factor-1, E-cadherin, BG8, WT1, and CD44S immunostaining in
distinguishing epithelial pleural mesothelioma from pulmonary and
nonpulmonary adenocarcinoma. Am J Surg Pathol. 24:598–606. 2000.
View Article : Google Scholar : PubMed/NCBI
|
|
12
|
Foster MR, Johnson JE, Olson SJ and Allred
DC: Immunohistochemical analysis of nuclear versus cytoplasmic
staining of WT1 in malignant mesotheliomas and primary pulmonary
adenocarcinomas. Arch Pathol Lab Med. 125:1316–1320.
2001.PubMed/NCBI
|
|
13
|
Hecht JL, Lee BH, Pinkus JL and Pinkus GS:
The value of Wilms tumor susceptibility gene 1 in cytologic
preparations as a marker for malignant mesothelioma. Cancer.
96:105–109. 2002. View Article : Google Scholar : PubMed/NCBI
|
|
14
|
Tsuta K, Kato Y, Tochigi N, Hoshino T,
Takeda Y, Hosako M, Maeshima AM, Asamura H, Kondo T and Matsuno Y:
Comparison of different clones (WT49 versus 6F-H2) of WT-1
antibodies for immunohistochemical diagnosis of malignant pleural
mesothelioma. Appl Immunohistochem Mol Morphol. 17:126–130. 2009.
View Article : Google Scholar : PubMed/NCBI
|
|
15
|
Hwang H, Quenneville L, Yaziji H and Gown
AM: Wilms tumor gene product: Sensitive and contextually specific
marker of serous carcinomas of ovarian surface epithelial origin.
Appl Immunohistochem Mol Morphol. 12:122–126. 2004. View Article : Google Scholar : PubMed/NCBI
|
|
16
|
Han L, Pansare V, Al-Abbadi M, Husain M
and Feng J: Combination of MUC5ac and WT-1 immunohistochemistry is
useful in distinguishing pancreatic ductal carcinoma from ovarian
serous carcinoma in effusion cytology. Diagn Cytopathol.
38:333–336. 2010.
|
|
17
|
Cheever MA, Allison JP, Ferris AS, Finn
OJ, Hastings BM, Hecht TT, Mellman I, Prindiville SA, Viner JL,
Weiner LM, et al: The prioritization of cancer antigens: A National
Cancer Institute pilot project for the acceleration of
translational research. Clin Cancer Res. 15:5323–5337. 2009.
View Article : Google Scholar : PubMed/NCBI
|
|
18
|
Oji Y, Yano M, Nakano Y, Abeno S,
Nakatsuka S, Ikeba A, Yasuda T, Fujiwara Y, Takiguchi S, Yamamoto
H, et al: Overexpression of the Wilms' tumor gene WT1 in esophageal
cancer. Anticancer Res. 24(5B): 3103–3108. 2004.PubMed/NCBI
|
|
19
|
Nakatsuka S, Oji Y, Horiuchi T, Kanda T,
Kitagawa M, Takeuchi T, Kawano K, Kuwae Y, Yamauchi A, Okumura M,
et al: Immunohistochemical detection of WT1 protein in a variety of
cancer cells. Mod Pathol. 19:804–814. 2006.PubMed/NCBI
|
|
20
|
Oji Y, Yamamoto H, Nomura M, Nakano Y,
Ikeba A, Nakatsuka S, Abeno S, Kiyotoh E, Jomgeow T, Sekimoto M, et
al: Overexpression of the Wilms' tumor gene WT1 in colorectal
adenocarcinoma. Cancer Sci. 94:712–717. 2003. View Article : Google Scholar : PubMed/NCBI
|
|
21
|
Sera T, Hiasa Y, Mashiba T, Tokumoto Y,
Hirooka M, Konishi I, Matsuura B, Michitaka K, Udaka K and Onji M:
Wilms' tumour 1 gene expression is increased in hepatocellular
carcinoma and associated with poor prognosis. Eur J Cancer.
44:600–608. 2008. View Article : Google Scholar : PubMed/NCBI
|
|
22
|
Oji Y, Nakamori S, Fujikawa M, Nakatsuka
S, Yokota A, Tatsumi N, Abeno S, Ikeba A, Takashima S, Tsujie M, et
al: Overexpression of the Wilms' tumor gene WT1 in pancreatic
ductal adenocarcinoma. Cancer Sci. 95:583–587. 2004. View Article : Google Scholar : PubMed/NCBI
|
|
23
|
Oji Y, Miyoshi Y, Koga S, Nakano Y, Ando
A, Nakatsuka S, Ikeba A, Takahashi E, Sakaguchi N, Yokota A, et al:
Overexpression of the Wilms' tumor gene WT1 in primary thyroid
cancer. Cancer Sci. 94:606–611. 2003. View Article : Google Scholar : PubMed/NCBI
|
|
24
|
Oji Y, Miyoshi S, Maeda H, Hayashi S,
Tamaki H, Nakatsuka S, Yao M, Takahashi E, Nakano Y, Hirabayashi H,
et al: Overexpression of the Wilms' tumor gene WT1 in de novo lung
cancers. Int J Cancer. 100:297–303. 2002. View Article : Google Scholar : PubMed/NCBI
|
|
25
|
Loeb DM, Evron E, Patel CB, Sharma PM,
Niranjan B, Buluwela L, Weitzman SA, Korz D and Sukumar S: Wilms'
tumor suppressor gene (WT1) is expressed in primary breast tumors
despite tumor-specific promoter methylation. Cancer Res.
61:921–925. 2001.PubMed/NCBI
|
|
26
|
Miyoshi Y, Ando A, Egawa C, Taguchi T,
Tamaki Y, Tamaki H, Sugiyama H and Noguchi S: High expression of
Wilms' tumor suppressor gene predicts poor prognosis in breast
cancer patients. Clin Cancer Res. 8:1167–1171. 2002.PubMed/NCBI
|
|
27
|
Lee AH, Paish EC, Marchio C, Sapino A,
Schmitt FC, Ellis IO and Reis-Filho JS: The expression of Wilms'
tumour-1 and Ca125 in invasive micropapillary carcinoma of the
breast. Histopathology. 51:824–828. 2007. View Article : Google Scholar : PubMed/NCBI
|
|
28
|
Oji Y, Suzuki T, Nakano Y, Maruno M,
Nakatsuka S, Jomgeow T, Abeno S, Tatsumi N, Yokota A, Aoyagi S, et
al: Overexpression of the Wilms' tumor gene W T1 in primary
astrocytic tumors. Cancer Sci. 95:822–827. 2004. View Article : Google Scholar : PubMed/NCBI
|
|
29
|
Oka Y, Tsuboi A, Taguchi T, Osaki T, Kyo
T, Nakajima H, Elisseeva OA, Oji Y, Kawakami M, Ikegame K, et al:
Induction of WT1 (Wilms' tumor gene)-specific cytotoxic T
lymphocytes by WT1 peptide vaccine and the resultant cancer
regression. Proc Natl Acad Sci USA. 101:13885–13890. 2004.
View Article : Google Scholar : PubMed/NCBI
|
|
30
|
Morita S, Oka Y, Tsuboi A, Kawakami M,
Maruno M, Izumoto S, Osaki T, Taguchi T, Ueda T, Myoui A, et al: A
phase I/II trial of a WT1 (Wilms' tumor gene) peptide vaccine in
patients with solid malignancy: Safety assessment based on the
phase I data. Jpn J Clin Oncol. 36:231–236. 2006. View Article : Google Scholar : PubMed/NCBI
|
|
31
|
Izumoto S, Tsuboi A, Oka Y, Suzuki T,
Hashiba T, Kagawa N, Hashimoto N, Maruno M, Elisseeva OA, Shirakata
T, et al: Phase II clinical trial of Wilms tumor 1 peptide
vaccination for patients with recurrent glioblastoma multiforme. J
Neurosurg. 108:963–971. 2008. View Article : Google Scholar : PubMed/NCBI
|
|
32
|
Keilholz U, Letsch A, Busse A, Asemissen
AM, Bauer S, Blau IW, Hofmann WK, Uharek L, Thiel E and
Scheibenbogen C: A clinical and immunologic phase 2 trial of Wilms
tumor gene product 1 (WT1) peptide vaccination in patients with AML
and MDS. Blood. 113:6541–6548. 2009. View Article : Google Scholar : PubMed/NCBI
|
|
33
|
Ohno S, Kyo S, Myojo S, Dohi S, Ishizaki
J, Miyamoto K, Morita S, Sakamoto J, Enomoto T, Kimura T, et al:
Wilms' tumor 1 (WT1) peptide immunotherapy for gynecological
malignancy. Anticancer Res. 29:4779–4784. 2009.PubMed/NCBI
|
|
34
|
Van Tendeloo VF, Van de Velde A, Van
Driessche A, Cools N, Anguille S, Ladell K, Gostick E, Vermeulen K,
Pieters K, Nijs G, et al: Induction of complete and molecular
remissions in acute myeloid leukemia by Wilms' tumor 1
antigen-targeted dendritic cell vaccination. Proc Natl Acad Sci
USA. 107:13824–13829. 2010. View Article : Google Scholar : PubMed/NCBI
|
|
35
|
Krug LM, Dao T, Brown AB, Maslak P, Travis
W, Bekele S, Korontsvit T, Zakhaleva V, Wolchok J, Yuan J, et al:
WT1 peptide vaccinations induce CD4 and CD8 T cell immune responses
in patients with mesothelioma and non-small cell lung cancer.
Cancer Immunol Immunother. 59:1467–1479. 2010. View Article : Google Scholar : PubMed/NCBI
|
|
36
|
Kaida M, Morita-Hoshi Y, Soeda A, Wakeda
T, Yamaki Y, Kojima Y, Ueno H, Kondo S, Morizane C, Ikeda M, et al:
Phase 1 trial of Wilms tumor 1 (WT1) peptide vaccine and
gemcitabine combination therapy in patients with advanced
pancreatic or biliary tract cancer. J Immunother. 34:92–99. 2011.
View Article : Google Scholar
|
|
37
|
Usami N, Fukui T, Kondo M, Taniguchi T,
Yokoyama T, Mori S, Yokoi K, Horio Y, Shimokata K, Sekido Y, et al:
Establishment and characterization of four malignant pleural
mesothelioma cell lines from Japanese patients. Cancer Sci.
97:387–394. 2006. View Article : Google Scholar : PubMed/NCBI
|
|
38
|
Nishihira T, Hashimoto Y, Katayama M, Mori
S and Kuroki T: Molecular and cellular features of esophageal
cancer cells. J Cancer Res Clin Oncol. 119:441–449. 1993.
View Article : Google Scholar : PubMed/NCBI
|
|
39
|
Saito T, Kato H, Saito M, Karaki Y, Tazawa
K and Fujimaki M: TNF receptor number-dependent cytotoxicity to
TNF-resistant human esophageal cancer cell lines by combination
with recombinant human necrosis factor and hyperthermia. Hum Cell.
7:55–61. 1994.PubMed/NCBI
|
|
40
|
Yanagihara K, Ito A, Toge T and Numoto M:
Antiproliferative effects of isoflavones on human cancer cell lines
established from the gastrointestinal tract. Cancer Res.
53:5815–5821. 1993.PubMed/NCBI
|
|
41
|
Sugiura H, Ishikura H, Omi M, Kaji M, Iwai
K, Kishimoto T, Takahashi T, Kimura C, Kato H and Yoshiki T:
Lymphokine-activated killer cytotoxicity against pancreas
adenocarcinoma cell lines and vascular endothelial cells. Pathol
Int. 44:688–696. 1994. View Article : Google Scholar : PubMed/NCBI
|
|
42
|
Gerlinger M, Rowan AJ, Horswell S, Larkin
J, Endesfelder D, Gronroos E, Martinez P, Matthews N, Stewart A,
Tarpey P, et al: Intratumor heterogeneity and branched evolution
revealed by multiregion sequencing. N Engl J Med. 366:883–892.
2012. View Article : Google Scholar : PubMed/NCBI
|