Introduction
Acute myeloid leukemia (AML), the most common and
severe form of acute leukemia in adults, is responsible for the
highest mortality from leukemia in general (1). The origin of AML is multifactorial
and has not yet been entirely elucidated. The disease begins in a
bone marrow stem cell exposed to a complex interplay of hereditary
and environmental factors. Disturbances in myeloid progenitor cell
growth, differentiation and proliferation lead to the clonal
expansion of bone marrow myeloblasts and their infiltration into
the peripheral blood (1,2). Therefore, the number of immature,
non-functional leukocytes is increased, and normal blood cell
production is impaired.
AML is a heterogeneous type of cancer in which
subsets of molecularly different types can be distinguished.
According to the first classification of hematological disorders,
the French-American-British (FAB) system (3), there are 8 types of AML (M0-M7), with
specific morphological characteristics and differentiation stages.
The more recent World Health Organization (WHO) classification
(4) is based on a combination of
clinical symptoms, cell morphology, immunophenotype and genetic
abnormalities. In ~55% of patients with AML, clonal chromosome
rearrangements are present (5);
e.g., translocations t(8;21), t(15;17) and t(16;16), which result
in the fusion genes, RUNX1/RUNX1T1,
PML-RARα and CBFB-MYH11, respectively.
In a large group of patients with AML (40–49%) with normal
karyotypes (NK-AML or CN-AML, from cytogenetically normal AML)
(5,6), recurrent small mutations have been
identified. They usually occur in genes encoding signaling
proteins, transcription factors and chromatin modifiers, which
affect cell signaling or general gene expression. The most frequent
are mutations in NPM1 (7),
FLT3 (8), CEBPA
(9), KIT (10), NRAS/KRAS (11), TET2 (12), DNMT3A (13) and IDH1/2 (14). Some of these mutations are
clinically relevant as diagnostic or prognostic markers and
potential therapeutic targets (15).
The development of high-throughput technologies,
such as microarrays and next generation sequencing has contributed
to progress in leukemia research (16–18).
Since 1999, when the first applications of DNA microarrays in
leukemia classification and outcome prediction were demonstrated
(19,20), many publications based on gene
expression profiling in hematological malignancies have appeared.
Among these, several hundred have focused on AML [such as for
example (21–23)]. Some have shown that certain
genetic alterations correspond with specific gene expression
signatures (24,25). Gene expression profiles have also
been correlated with prognosis and treatment outcomes (26,27).
However, in clinical practice, age, white blood cell (WBC) counts
in the blood and karyotype abnormalities are still the key outcome
determinants (6). Diagnostic tests
based on single gene mutations [including one recently published by
our group (28)], are being
increasingly applied; however, the number of mutations and their
detection methods are not standardized among laboratories. A
reasonable compromise between a single gene test and a genome-wide
tool, irrespective of the purpose (mutation detection or gene
expression measurements), is a small dedicated microarray, also
known as a boutique array (29,30).
Based on our experience in boutique microarray design, production
and data normalization (30–32),
we decided to create a small microarray dedicated to gene
expression profiling in AML (AML-array). The main aims of this
study were to test the utility of this array, verify the selected
results with 2 quantitative polymerase chain reaction (PCR)
approaches, standard real-time PCR and droplet-digital PCR (ddPCR),
and to examine gene expression in a new group of patients with AML.
Into the analysis, we included Polish adult patients with de
novo AML, prior to therapy, classified as M1 and M2, 2 FAB
subtypes in which myeloid differentiation is arrested in the first
stages of granulopoiesis. In the same group of patients, we have
previously performed a comparative proteomics analysis of AML with
and without maturation (33,34).
The additional aim of the study was to compare presented here
transcriptomic results with our earlier proteomic results and with
other AML transcriptomic data. We hoped to find the novel factors,
such as gene groups, gene expression patterns or gene associations
with molecular or clinical characteristics, which can be correlated
with AML pathogenesis. Such analyses are valuable as it was shown
that AML pathogenesis can differ among individual patients
(35) and our understanding of AML
genomics is still incomplete.
Materials and methods
Samples
Peripheral blood (PB) and bone marrow (BM) samples
were collected from 41 adult patients with AML-M1/M2 and from 20
adult healthy volunteers (HV). Each individual provided signed
informed consent for treatment and for their participation in this
study. Appropriate approval was also obtained from the Bioethical
Commission of the Karol Marcinkowski Poznan University of Medical
Sciences, Poznan, Poland. The patients were diagnosed and treated
at the Department of Hematology and Bone Marrow Transplantation at
the Poznan University Hospital of the Lord’s Transfiguration of the
University of Medical Sciences in Poznan, Poland. Standard AML
therapy using cytosine arabinoside plus daunorubicin (3′+7′) was
administered to all patients to induce complete remission (CR),
which was defined according to the European Leukemia Net guidelines
(2). When available, the samples
were collected at the 3 following time-points: when AML was
diagnosed, prior to first therapy (T0), when CR was established
[between day +21 and +28 after the start of induction therapy
(T1)], and when the disease relapsed (T2). However, from the T1
samples, the number of cells was much lower than that of cells from
the T0 and T2 samples, and often, there was not sufficient material
to perform replicate experiments. Moreover, not all micro-array
images met the required quality criteria and had to be filtered
out. The material from the T1 time-point was the most
heterogeneous, and preliminary microarray analysis revealed that
the T1 samples did not cluster together and did not exhibit clear
common characteristics. The T2 samples were generally similar to
the T0 samples and we were not able to distinguish them by
unsupervised hierarchical clustering. Therefore, we decided to
limit our analyses to the samples collected at the T0 time-point,
with the use of available information about the history of
treatment. The advantage of this selection was that the T0 samples
were the most homogenous (the fractions of blood and bone
marrow-derived mononuclear cells isolated from patients with AML-M1
contained ~90% leukemic cells, whereas from those from the patients
with AML-M2 contained ~70% myeloblasts). Table I presents the summarized
information on the patient and HV samples.
 | Table ISample summary. |
Table I
Sample summary.
A, General
information
|
|---|
| Total no. of
samples | Age range
(median) | Sex,
F/M/unknown | WBC count
[×109/l] range (median) | No. of microarray
hybridizations (individual samples) | No. of samples in
real-time PCR experiment | No. of samples in
ddPCR experiment |
|---|
| HV | 20 | 23–60 (36.4) | 10/07/03 | 5.1–25.3 (6.2) | 15 (15) | 14 | 16 |
| AML | 41 | 19–78 (48.8) | 17/24 | 0.5–345 (13.7) | 103 (33) | 21 | 37 |
B, FAB
classification and mutation status of AML samples
|
|---|
| FAB M1 | FAB M2 |
RUNX1/RUNX1T1 [t(8;21)] |
NPM1−/FLT3+ |
NPM1+/FLT3− |
NPM1+/FLT3+ |
|---|
| Patients
(micr.a) | 15 (11/31) | 26 (22/72) | 5 (5/15) | 3 (2/11) | 8 (6/23) | 2 (2/8) |
C, Classification
of AML samples in respect to treatment response
|
|---|
| RES | CR | CR-short | CR-long | X |
|---|
| Patients
(micr.a) | 10 (9/26) | 20 (15/49) | 14 (12/40) | 6 (3/9) | 11 (9/28) |
Cell separation
Mononuclear cells form the peripheral blood (termed
PBMCs) and bone marrow (termed BMMCs) were separated through
density gradient centrifugation (Gradisol L; Aqua-Medica, Bogucin,
Poland) and washed 3 times with 1X phosphate-buffered saline (PBS;
Ca and Mg-free; IBSS Biomed S.A., Warsaw, Poland). The cell pellet
was suspended in lysis buffer from a mirVana miRNA Isolation kit
(Ambion/Thermo Fisher Scientific, Waltham, MA, USA) and immediately
frozen at −80°C.
RNA isolation
Total RNA was extracted from the PBMCs and BMMCs
using a mirVana miRNA Isolation kit and the DNase-treated (TURBO
DNA-free kit) (both from Ambion/Thermo Fisher Scientific). RNA
integrity was evaluated with the use of a Bioanalyzer 2100 and
Total RNA Nano assay (Agilent Technologies, Santa Clara, CA, USA).
Only RNAs with an RNA integrity number (RIN) ≥7.5 were used for the
gene expression analyses.
Microarray construction
Screening of the literature enabled us to identify
the following groups of genes: i) Proven and postulated acute
leukemia biomarkers; ii) general oncogenes; and iii) predicted to
be specifically involved in leukemic transformation. In addition,
we selected a set of control genes. Human housekeeping genes, not
associated with oncogenesis, were used as the positive controls,
whereas plant- and bacterial-specific genes served as the negative
controls. We ordered 903 chemically synthesized, amino-modified
microarray probes from 2 companies: Ocimum Biosolutions Ltd.
(Hyderabad, India; 783 probes 50-nt-long) and Operon
Biotechnologies GmbH (Cologne, Germany; 120 probes 70-nt-long). As
an additional control, we used 4 short DNA probes (24-28-nt-long;
Institute of Biochemistry and Biophysics, Warsaw, Poland), 8 probes
complementary to external spike RNAs (AM1781; Ambion/Thermo Fisher
Scientific) and one random oligo probe (Operon Biotechnologies
GmbH). In total, the microarray contained 916 unique probes: 896
probes complementary to 838 human genes, 8 probes specific for 5
bacterial genes, 3 probes specific for 3 plant genes and 9
artificial control probes. The probes were diluted in Pronto
Epoxide Spotting Solution to a 20 µM concentration and
spotted in triplicates onto Epoxide-Coated Slides (both from
Corning Inc., New York, NY, USA) with a SpotArray 24 instrument
(Perkin-Elmer, Waltham, MA, USA). The design of our AML-array has
been deposited in the ArrayExpress database (http://www.ebi.ac.uk/arrayexpress) under the accession
no. A-MEXP-2220.
Labeling and microarray
hybridization
A quantity of 10 µg of each total RNA sample
was reverse transcribed using anchoredoligo(dT)20,
aminoallyl-modified dNTPs and SuperScript III reverse transcriptase
from a SuperScript Plus Indirect cDNA Labeling System (Invitrogen,
Carlsbad, CA, USA). Amino-modified cDNAs from the patients with AML
and HV were labeled with Alexa Fluor 647 and the reference cDNA
from the HL60 cell line sample (obtained from Dr Marcin Schmidt
from Poznan University of Life Sciences) with AlexaFluor 555. The
labeled cDNA was purified (MinElute Reaction Cleanup kit; Qiagen,
Hilden, Germany), dissolved in hybridization buffer (5X SSC, 0.1%
SDS and 0.1 mg BSA/ml) and kept up to 30 min at 50°C prior to
hybridization in Corning microarray hybridization chambers in a
HybArray12 (Perkin-Elmer) or a water bath by using a step-down
hybridization protocol (5 h/50°C, 5 h/45°C and 5 h/40°C). Three
subsequent wash steps were applied: i) 2X SSC and 0.1% SDS at 40°C
for 5 min; ii) 2X SSC at room temperature for 5 min; and iii) 0.2X
SSC at room temperature for 5 min. The slides were dried through
centrifugation with the Microarray High-Speed Centrifuge (Arrayit
Corp., Sunnyvale, CA, USA; 5 sec, 2,000 × g, room temperature) and
scanned with a ScanArrayExpress system (Perkin-Elmer) at
5-µm resolution.
Microarray data analysis
The microarray images were processed using GenePix
Pro version 6.0 software (Molecular Devices, LLC, Sunnyvale, CA,
USA). Spots that did not meet a set of criteria (SNR >5; Dia.,
110–250 nm; F CV ≤100; SD ≥1000; satur. ≤1%) were filtered out. The
raw data files (deposited in the ArrayExpress database under the
accession no. E-MTAB-5434) were loaded into R Bioconductor version
3.2.0 (R Development Core Team 2009) and processed and analyzed
with the limma package (36).
Briefly, the foreground and background median signal values
(excluding those with weights of 0) were background-corrected with
the subtraction method and normalized with the global loess method.
Probed replicates were averaged, and the replicate arrays from the
same patient were merged. Differential gene expression was tested
using a linear model suitable for experiments with common reference
design. The final p-values were adjusted with FDR correction
(37). Data clustering was
conducted and visualized with the Heatplus R package.
Real-time PCR analysis
DNA-free RNA (3 µg per sample) was reverse
transcribed using SuperScript III RT and oligo(dT) (Invitrogen).
The reaction mixtures (20 µl vol) were incubated for 2 h at
50°C, and additional enzyme (1 µl) was added after the first
hour. Following reverse transcription, the samples were incubated
for 20 min at 70°C with 10 µl of 1 M NaOH. Subsequently, 10
µl of HCl 1 M were added for neutralization, and the cDNA
was precipitated overnight at −20°C with 100 µl (2.5 vol) of
96% ethanol and 4 µl (1/10 vol) of 3 M sodium acetate, pH
5.2. The centrifuged pellet was washed twice with 70% ethanol and
dissolved in with 60 µl of DEPC-H2O. A total of 1
µl of each cDNA, diluted 3-fold, served as a template for
real-time PCR in reactions, including MESA Green qRT-PCR MasterMix
Plus (Eurogentec, Seraing, Belgium) and primers specific for the
STMN1, NPM1, S100A8 and S100A9
transcripts. From 4 reference genes [ACTB, glyceraldehyde
3-phosphate dehydrogenase (GAPDH), PGK1 and
PPIA], the last 2 were selected as the most stable using
geNorm (https://genorm.cmgg.be). The sequences
of all the primers are presented in Table II. Each gene analysis was
performed in duplicate. The standards were generated by PCR
amplification of the HeLa cDNA template, obtained as a result of
reverse transcription of control HeLa RNA with a SuperScript Plus
Indirect cDNA Labeling system (Invitrogen). Real-time analysis was
performed in a Rotor-Gene Q thermocycler (Qiagen), using the
following program: initial denaturation (94°C, 2 min), 40 cycles of
denaturation (94°C, 1 min), annealing (60°C, 1 min) and elongation
(72°C, 30 sec), final elongation (72°C, 10 min) and a final hold
(4°C). The melting curve was generated in the range of 60–95°C. The
reaction volume was 20 µl. Each reaction was performed in
triplicate. The real-time PCR products were verified by melting
curve analysis. The product quantities were estimated using the two
standard curves’ method. The values obtained for the triplicates
were averaged. Subsequently, the results obtained for the 2
biological replicates (separate reverse transcription reactions and
separate real-time analyses) were averaged and divided by the
average of the replicates of the 2 reference genes.
| Table IIPCR primers. |
Table II
PCR primers.
| Gene | Gene ID | Description | NCBI nucleotide
reference | Primer sequences
(forward and reverse) | Tm | PCR product length
name (bp) |
|---|
| ABL1 | 25 | ABL proto-oncogene
1 | NM_005157.5 |
5′-TCATATCAACCCGAGTGTCT-3′
5′-AACTTGTTCCTCATTTGCTG-3′ | 56°C
54°C | 229 |
| ANXA3 | 306 | Annexin A3 | NM_005139.2 |
5′-CGCAATCAGGTGGAGTCGAG-3′
5′-TCACTAGGGCCACCATGAGA-3′ | 61°C
60°C | 467 |
| ACTB | 60 | Actin beta | NM_001101.4 |
5′-TCCCTGGAGAAGAGCTACGA-3′
5′-AGGAAGGAAGGCTGGAAGAG-3′ | 59°C
59°C | 98 |
| CAT | 847 | Catalase | NM_001752.3 |
5′-CTCCGGAACAACAGCCTTCT-3′
5′-GATGAGCGGGTTACACGGAT -3′ | 60°C
60°C | 412 |
| GAPDH | 2597 |
Glyceraldehyde-3-phosphate
dehydrogenase | NM_002046.5 |
5′-CCGTCTAGAAAAACCTGCC-3′
5′-AGCCAAATTCGTTGTCATACC-3′ | 56°C
57°C | 218 |
| NPM1 | 4869 | Nucleophosmin
1 | NM_001037738.2 |
5′-GCGCATTGAACAGTCCTGGG -3′
5′-CCAGCCTGAAGAGGCATGGGT -3′ | 62°C
64°C | 172 |
| PGK1 | 5230 | Phosphoglycerate
kinase 1 | NM_000291.3 |
5′-GGGAAAAGATGCTTCTGGGAA-3′
5′-TTGGAAAGTGAAGCTCGGAAA-3′ | 58°C
58°C | 72 |
| PPIA | 5478 | Peptidylprolyl
isomerase A | NM_021130.4 |
5′-CTGGACCCAACACAAATGGT-3′
5′-GCCTTCTTTCACTTTGCCAAAC-3′ | 58°C
59°C | 98 |
| S100A8 | 6279 | S100 calcium
binding protein A8 | NM_001319196.1 |
5′-TGAAGAAATTGCTAGAGAC-3′
5′-CTTTATCACCAGAATGAGGA-3′ | 50°C
52°C | 131 |
| S100A9 | 6280 | S100 calcium
binding protein A9 | NM_002965.3 |
5′-CCTGGACACAAATGCAGACAA-3′
5′-CGTCACCCTCGTGCATCTT-3′ | 59°C
60°C | 101 |
| STMN1 | 3925 | Stathmin 1 | NM_203401.1 |
5′-GCCCTCGGTCAAAAGAATCTG-3′
5′-TGCTTCAAGACCTCAGCTTCA-3′ | 59°C
60°C | 139 |
| WT1 | 7490 | Wilms tumor 1 | NM_000378.4 |
5′-ACAGGGTACGAGAGCGATAACCA-3′
5′-CACACGTCGCACATCCTGAAT-3′ | 63°C
61°C | 105 |
Droplet digital PCR analysis
DNA-free RNA (2.5 µg per sample) was reverse
transcribed and purified, as described above for real-time PCR,
with the exception that the RT reaction lasted 1.5 h and only 1
µl of enzyme was used. The precipitated cDNA, dissolved in
50 µl of DEPC-H2O, served as a template for
quantitative PCR with the use of a QX200 ddPCR system, QX200
EvaGreen ddPCR Supermix (Bio-Rad, Hercules, CA, USA), and primers
specific for 4 candidate genes (ABL1, ANXA3,
CAT and WT1) and one reference gene (PGK1).
The reaction volume was 20 µl, with a primer concentration
of 250 nM, and the volume of cDNA (1–3 µl) was optimized for
each candidate gene and sample. The PCR conditions were as follows:
initial denaturation (95°C, 5 min), 40 cycles of denaturation
(95°C, 30 sec), annealing (60°C, 30 sec) and elongation (72°C, 45
sec), cooling (4°C, 5 min), final denaturation (90°C, 5 min) and
final hold (12°C). The temperature ramping rate was 2°C/sec.
Following PCR, the plates were directly analyzed with a QX200
Droplet Reader. The data were processed using Quanta Soft version
1.5.38.1118 software (Bio-Rad). The number of droplets for each
candidate gene was divided by the number of droplets obtained for
the reference gene analyzed in the same run (for ABL1,
ANXA3 and WT1) or in the same multiplex reaction
(CAT). Each reaction was performed in duplicate. The
sequences of all the primers are presented in Table II.
Statistical analysis of RT-qPCR data
Statistical analyses and bar plots were made in R
version 3.2.0 R and R Studio version 0.98.1102. Welch two sample
t-tests (unpaired) were applied for pairwise comparisons and ANOVA
was applied for comparisons across 2 or more groups. For two- or
more-way ANOVA, Tukey honestly significant difference (HSD) tests
based on multiple comparisons of means were applied to determine
which pairwise comparisons were statistically significant. To test
the correlations between the expression values of 2 genes or
between a particular gene’s expression and clinical data (WBC,
age), Pearson’s correlations were calculated. The threshold p-value
was always set as 0.05.
Database screening
The following open-source software tools and
databases were explored: NCBI databases (www.ncbi.nlm.nih.gov/), including PubMed, Gene and
Gene Expression Omnibus (GEO) and GDSbrowser, Expression Atlas
(www.ebi-ac-uk/gxa/) and DAVID
(david.abcc.ncifcrf.gov/).
Results
Microarray analysis
To study gene expression in AML, we designed a small
boutique AML-array, as deposited in the ArrayExpress database
(A-MEXP-2220). The array contained >900 long oligonucleotide
probes that are complementary to human genes implicated, inter
alia, in hematopoietic cell differentiation and maturation,
proliferation, apoptosis and leukemic transformation. Gene
functional analysis with DAVID (38) revealed that our microarray was
significantly enriched in genes linked with immune, infection and
cancer classes of disease. Out of OMIM diseases, only AML was found
to be statistically significant. The genes covered by the AML-array
encode proteins from the following KEGG pathways: Cancer (111
genes), cytokine-cytokine receptor interaction (102 genes),
Jak-STAT signaling (64 genes), chemokine signaling (59 genes), MAPK
signaling (54 genes), focal adhesion (49 genes), hematopoietic cell
lineage (42 genes) and regulation of actin cytoskeleton (41
genes).
The AML-array was used to estimate relative gene
expression in PBMCs and/or BMMCs obtained from 33 de novo
AML patients, prior to therapy, and 15 HV (Table I). The AML samples were classified
as M1 or M2 FAB subtypes, which were characterized on the basis of
the early blast cell differentiation arrest and either no myeloid
cell maturation (M1) or partial maturation (M2). The microarray
experiment was based on two-color hybridization, wherein each
studied sample was matched with a common reference (HL60 cell
line). Data from 118 hybridizations, as deposited in the
ArrayExpress database under the accession no. E-MTAB-5434, were
background-corrected and normalized, and technical replicates (of
probes and arrays) were then merged and analyzed using the R
Bioconductor limma package.
First, we assessed whether there were any
differences between the transcriptomes of the BMMCs and PBMCs.
Similar to the proteomics analysis results of our previous study
(33), there were no statistically
significant differences between the AML-PBMCs and AML-BMMCs
(differential expression analysis with a limma linear model,
adjusted p-value >0.11) (Table
III). Therefore, in the following transcriptome analyses, we
did not divide the samples into BMMC- and PBMC-derived groups.
| Table IIIThe summary of microarray data
analysis results. |
Table III
The summary of microarray data
analysis results.
| Comparison | The smallest
adjusted p-value (top gene) | The no. of DEGs
(over-/underexpressed) | Overexpressed
genes | Underexpressed
genes |
|---|
| AML-PBMC vs.
AML-BMMC | 0.11
(FAS) | 0 | FAS,
DUSP2 | PRG1, THY1, STAT4,
CTSG, CCL7, PRG2, SRGN, SRP9 |
| AML vs. HV |
1.67×10⁻¹⁰ (STMN1) | 163 (85/78) | Genes from Table IV, and ABL1, BCR,
CBL, CCL24, CCND1, CCND2,
CCNDBP1, CCR10, CD34, CD38,
CDKN1A, CFL1, CLU, CTSG, DNAJB4,
DNMT3B, GAB1, GSTP1, HOXB5,
HOXC8, HPH, HSPA4L, IFNGR2,
INPP5D, IRS2, JUNB, METTL3, MME,
MT1H, NUP98, PHB2, PPIF, PRG2,
RAF1, RHOH, SLC25A1, SLC7A5,
SLITRK6, SMAD3, TLE1, TRAF4,
ZEB2 | Genes from Table IV, and AIF1, CBFB,
CRIP2, CSF3, CYBB, DRAP1, E2F1,
FAS, FOSB, GDI1, HIF1A,
HLA-DPA1, HLA-DRB1, IGHM, IL12B,
KDR, LGALS3, MLLT10, MTMR11,
MYLPF, NFKB2, PAK1, PHB2, PROCR,
RHAG, S100A8, SHC1, SLC29A1,
SULT1E1, TNFRSF10A, XCL1, XCR1,
ZFP36 |
| AML-M1 vs.
AML-M2 | 0.35
(IL5B) | 0 | IL5B,
CASP2, LCP1, FLT3, BIRC2 | PRG1,
CST7, MAPK6, SRGN, CTSG |
| AML-M1 vs.
AML-M2a | 0.11
(CASP2) | 0 | CASP2,
IL5B, BIRC2, FLT3, TPM1 | PRG1,
CST7, MAPK6, CTSG, SRGN |
| AML-M1 vs. HV |
2.84×10−08 (STMN1) | 53 (28/25) | Set 1, and
ARHGEF12, ERCC2, HSP90AB1, HSPA8,
HSPA9, IGFBP7, ANGTP1, INPP5D,
ITGB4, KIT, KITLG, MN1, MYB,
RHOH | Set 3,
and BIRC3, BTG1, CCL5, FCER1G,
HCK, IFNA1, LYZ, NFKBIA, PGK1,
S100A9, ACTB, CST7, LBD1 |
| AML-M2 vs. HV |
2.09×10−09 (STMN1) | 146 (74/72) | Set 2, and
ABCF1, ABL1, ANGTP1, ARF1,
ATP6V0C, BCR, CBL, CCL24, CCND2,
CCR10, CD34, CDKN1A, CFL1, CTSD,
CTSG, DNAJB4, DNMT3B, ETV6,
GAB1, GAL, GAPDH, HIGD1A, HPH,
HSPA4L, HSPD1, IFNGR2, ITGB4,
KIT, KITLG, MAP7, METTL3, MME,
MN1, MPO, MYB, MYH9, NPM1,
PHB2, PPIF, PRG1, PRG2, RAF1,
SLC7A5, SMAD3, TUBB, ZEB2 | Set 4, and
BTG1, FCER1G, HCK, HLA-DPB1,
PGK1, PLBD1, CBFB, CD44, CD52,
CD74, CRIP2, CX3CR1, CYP2E1,
DRAP1, FAS, HIF1A, HLA-DRB1,
IGHM, JUN, KDR, LCP1, LGALS3,
MLLT10, MYLPF, NFKB2, PAK1,
PROCR, PTPRE, PXN, RARA, RHAG,
RHOB, SLC29A1, SPTBN1, STAT5B,
STAU2, SULT1E1, TNFRSF10B, TNFSF10,
XCR1, ZFP36 |
|
RUNX1/RUNX1T1+ |
1.75×10−06 (STMN1) | 13 (7/6) | STMN1,
CDK6, MYC, RPLP0, MPO, HSPA8,
ATP6V0C | TMSB4X,
LTB, IFITM1, PF4, FCN1,
CD44 |
AML vs. HV
FLT3+
AML vs. HV |
3.32×10−07 (CDK6) | 17 (10/7) | CDK6,
STMN1, RPLP0, ANGTP1, SET, MCM5,
ENO1, RASSF5, DNTT, MYL9 | TRADD,
TMSB4X, CAPN10, LTB, PDGFRB,
XBP1, SPTBN1 |
|
NPM1+ AML vs. HV |
7.35×10−07 (STMN1) | 97 (50/47) | Set 2, and
ABCF1, AK2, ANGTP1, ARHGAP4,
BCR, DAD1, GAB1, GAL, GAPDH,
HSPA1A, HSPD1, IFNGR2, ITGB4,
MAP7, MN1, NPM1, NUP98, PRG1,
RHOH, SLC25A1, TRAF2, TUBB | Set 4, and
HCK, HLA-DPB1, PGK1, PLBD1,
CD52, CEBPB, CYBB, FOSB, GJB1,
IL12B, IL9, PAK1, PRODH, PTPRE,
SPTBN1, SWAP70 |
| CR AML vs. HV |
4.44×10−09 (STMN1) | 74 (31/43) | Set 1, and
ADRA2C, HSP90AB1, HSPA8, HSPA9,
IGFBP7, ANGTP1, ATP6V0C, GAL,
GAPDH, HOXB5, HPH, ITGB4, KIT,
MT1H, MYB, PRTN3, TUBB | Set 3, and
ADD3, BTG1, CCL3, CCL5, CSF3R,
FCER1G, HCK, HLA-DPB1, IFNA1,
LYZ, NFKBIA, PLBD1, S100A9,
XBP1, AGPAT1, AIF1, BIRC3, CBFB,
CD74, CX3CR1, CYP2E1, HIF1A,
PTPRE, RARA, RHOB, S100A8,
SPTBN1, STAT5B, SULT1E1, TNFSF10 |
| RES AML vs. HV |
7.98×10−07 (STMN1) | 84 (41/43) | Set 2, and
ABL1, ARF1, CBL, CD38, CDKN1A,
DNAJB4, KIT, MYH9, PRG1, SMAD3,
TBL1X, TLE1, TRAP1 | Set 3, and
ADD3, BIRC3, CSF3, DUSP2,
FCER1G, HLA-DPB1, IGF1, PGK1,
PIM1, PLBD1, STK4, XBP1, CRIP2,
CYP2E1, DRAP1, GDI1, HLA-DRB1,
HOXA3, IGHM, IL8, KDR, MLLT10,
NFKB2, PAK1, PXN, RARA, SLC29A1,
STAU2, SWAP70, TNFSF10, XCR1 |
| X AML vs. HV |
5.57×10−07 (STMN1) | 79 (37/42) | Set 1, and
ARHGEF12, ERCC2, HOXA10, HSPA8,
IGFBP7, MYH11, PDE3B, PRKAR1B,
ZNF22, ANGTP1, CD81, FUS, GAB1,
HSPD1, IFNGR2, KIT, KITLG, MAP7,
MN1, MYB, NPM1, RHOH, TUBB | Set 4, and
BTG1, FCER1G, CD74, FOSB, IGHM,
IL12B, PRAME, PXN, TIPARP,
TNFRSF10A, ZFP36 |
|
RUNX1/RUNX1T1+ AML vs.
remaining AML | 0.99
(TERT) | 0 | TERT,
MPO, OGFR, STK32B, CST7, IL5RA,
SPI1, PLXNC1 | HPRT1,
PML |
|
RUNX1/RUNX1T1+ AML vs.
remaining AMLa | 0.96
(HPRT1) | 0 | MPO,
CXCL2, IL5RA, OGFR, STK32B,
CST7, TERT, PLXNC1, SWAP70 | HPRT1 |
|
FLT3+ AML vs. remaining
AML | 0.48
(VIM) | 0 | VIM,
DNTT, CDK6, CEACAM6 | IL4,
G6PD, PSMA6, PMAIP1, TRADD,
TUBB4 |
|
FLT3+ AML vs. remaining
AMLa | 0.088
(CDK6) | 0 | CDK6,
VIM, CEACAM6, DNTT, CASP3 | PMAIP1,
IL4, G6PD, MKI67, CDKN2A |
|
NPM1+ AML vs. remaining
AML | 0.99
(FOSB) | 0 | ANXA8,
TRAF2, NAP1L1 | FOSB,
HLA-DPA1, STOM, KLF4, MLLT1,
PRODH, EBF1 |
|
NPM1+ AML vs. remaining
AMLa | 0.9
(FOSB) | 0 | TRAF2,
ANXA8, RHOH, PGK2, HSPA1A | FOSB,
KLF4, HLA-DPA1, EBF1, MLLT1 |
|
NPM1+/FLT3+
AML vs. remaining AML | 0.26
(CPA3) | 0 | CPA3,
CCL17, HOXA5, PLCG1, ANXA1,
CLEC2B, TUBA1A, CCNG2, VIM | RTN2 |
|
NPM1+/FLT3+
AML vs. remaining AMLa | 0.043
(CPA3) | 1 | CPA3,
(CASP3, PKN2, CCL17, CLEC2B,
PBX3, RB1) | PMAIP1,
RTN2, LTA |
|
NPM1+/FLT3−
AML vs. remaining AML | 0.79
(TRAF2) | 0 | TRAF2,
ANXA8, ITGB4, HSPA9, BCR, MYL9,
RHOH | PRODH,
GTF2E2, STOM |
|
NPM1+/FLT3−
AML vs. remaining AMLa | 0.28
(TRAF2) | 0 | TRAF2,
RHOH, SLC25A1, ANXA8, NONO,
ITGB4, ABCF1, BCR, MYL9 | PRODH |
|
NPM1−/FLT3+
AML vs. remaining AML | 0.63
(PSMA6) | 0 | PTK7,
SRP9, DNAJB5, CD247 | PSMA6,
NUP88, CANX, NUBPL, BUD31,
CASP2 |
|
NPM1−/FLT3+
AML vs. remaining AMLa | 0.36
(CASP2) | 0 | PTK7,
CDK6, CEACAM6, FGF13 | CASP2,
APOC1, PSMA6, NUP88, NUBPL,
CANX |
|
NPM1+/FLT3−
AML vs. NPM1−/FLT3+ AML | 0.77
(CANX) | 0 | CANX,
PSMA6, NUP88, ITGB4, G6PD,
TRAF2 | DNAJB5,
CEACAM6, PTK7, CEBPB |
|
NPM1+/FLT3−
AML vs. NPM1−/FLT3+ AMLa | 0.42
(CDK6) | 0 | CASP2,
CANX, APOC1, TRAF2, HSPA8, PSMA6 | CDK6,
CEACAM6, PTK7, DNAJB5 |
|
NPM1+/FLT3−
AML vs. NPM1+/FLT3+ AML | 0.56
(RTN2) | 0 | RTN2,
IL4, PKLR | CPA3,
CCL17, PLCG1, GTF2E2, ITGA4,
CCL1, RNH1 |
|
NPM1+/FLT3−
AML vs. NPM1+/FLT3+ AMLa | 0.17
(PMAIP1) | 0 | PMAIP1,
RTN2, IL4 | CPA3,
PRKCQ, CCL17, CCL1, PKN2, CASP3,
PLCG1 |
|
NPM1−/FLT3+
AML vs. NPM1+/FLT3+ AML | 0.83
(DNAJB5) | 0 | DNAJB5,
FGF13, CD247 | APOC1,
NUBPL, PKN2, NAP1L1 FOXP1, CCL17,
BUD31 |
|
NPM1−/FLT3+
AML vs. NPM1+/FLT3+ AMLa | 0.09
(PKN2) | 0 | DNAJB5,
FGF13, ABR | PKN2,
APOC1, CPA3, CASP2, NUBPL, JUN,
CCL1 |
| CR AML vs. RES
AML | 0.52
(TRAP1) | 0 | GAPDH,
HOP, TERT, PXN, MT1H | TRAP1,
NFKBIA, ABL1, AGPAT1, NUBPL |
| CR AML vs. RES | 0.46
(GAPDH) | 0 | GAPDH,
MT1H, TERT, TUBA1 | NFKBIA,
NUBPL, TRAP1, TBL1X, CFLAR,
PRDX2 |
| CR AML vs. X
AML | 0.72
(ARHGEF12) | 0 | PRAME,
ROBO1, RBPMS, TERT | ARHGEF12,
MEIS1, PTPN6, EPHB2, ANXA8,
AVEN |
| CR AML vs. X
AMLa | 0.71
(MEIS1) | 0 | PRAME,
ROBO1, IGHM, IL6 | MEIS1,
ARHGEF12, ERCC2, PTPN6, CFLAR,
HIF1A |
| RES AML vs. X
AML | 0.98
(AZU1) | 0 | AZU1,
LYZ, SIRPA, STOM, GP1BB, TOP2B,
HPH | MAFB,
MLLT10, CACNA2D2 |
| RES AML vs. X
AMLa | 0.95
(AZU1) | 0 | AZU1,
HPH, TOP2B, SIRPA, CD7 | CD81,
CACNA2D2, MLLT10, MAFB, BIRC2 |
| CR_long AML vs.
CR_short AML | 0.98
(CAST) | 0 | CAST,
BIRC5, MAF, FBXL10, PTPRC, SHQ1,
MYH11, NPM1 | CRIP2,
CREBBP |
| CR_long AML vs.
CR_short AMLa | 0.98
(CRIP2) | 0 | CAST,
BIRC5, MAF, HMGA2, MCM3, SHQ1,
PTPRC | CRIP2,
ID1, SQSTM1 |
Our next aim was to identify the differences between
the AML and HV samples. Assuming a significance level α 0.05 as the
threshold, we selected 163 differentially expressed genes (DEGs),
of which 78 were underexpressed and 85 were overexpressed in AML
(Table III). However, after
sample clustering with these DEGs, 2 samples were still
misclassified (one AML sample was included in the HV cluster, and
one HV was in the AML cluster). The application of a more
restrictive threshold (α 0.01) limited the list of DEGs to 83 (42
underexpressed and 41 overexpressed) (Table IV). In total, 36 genes from the
list (43%, up- and downregulated in equal proportions) encoded
proteins involved in signal transduction and transcriptional
regulation, affecting processes, such as cell growth,
proliferation, adhesion and apoptosis. Of note, 10 genes (12%, 4
up- and 6 downregulated) were associated with cytoskeletal
organization and functioning, and 12 genes (14,5%, exclusively
underexpressed in AML) were engaged in immune and inflammatory
response. With the use of these 83 DEGs, we were able to perfectly
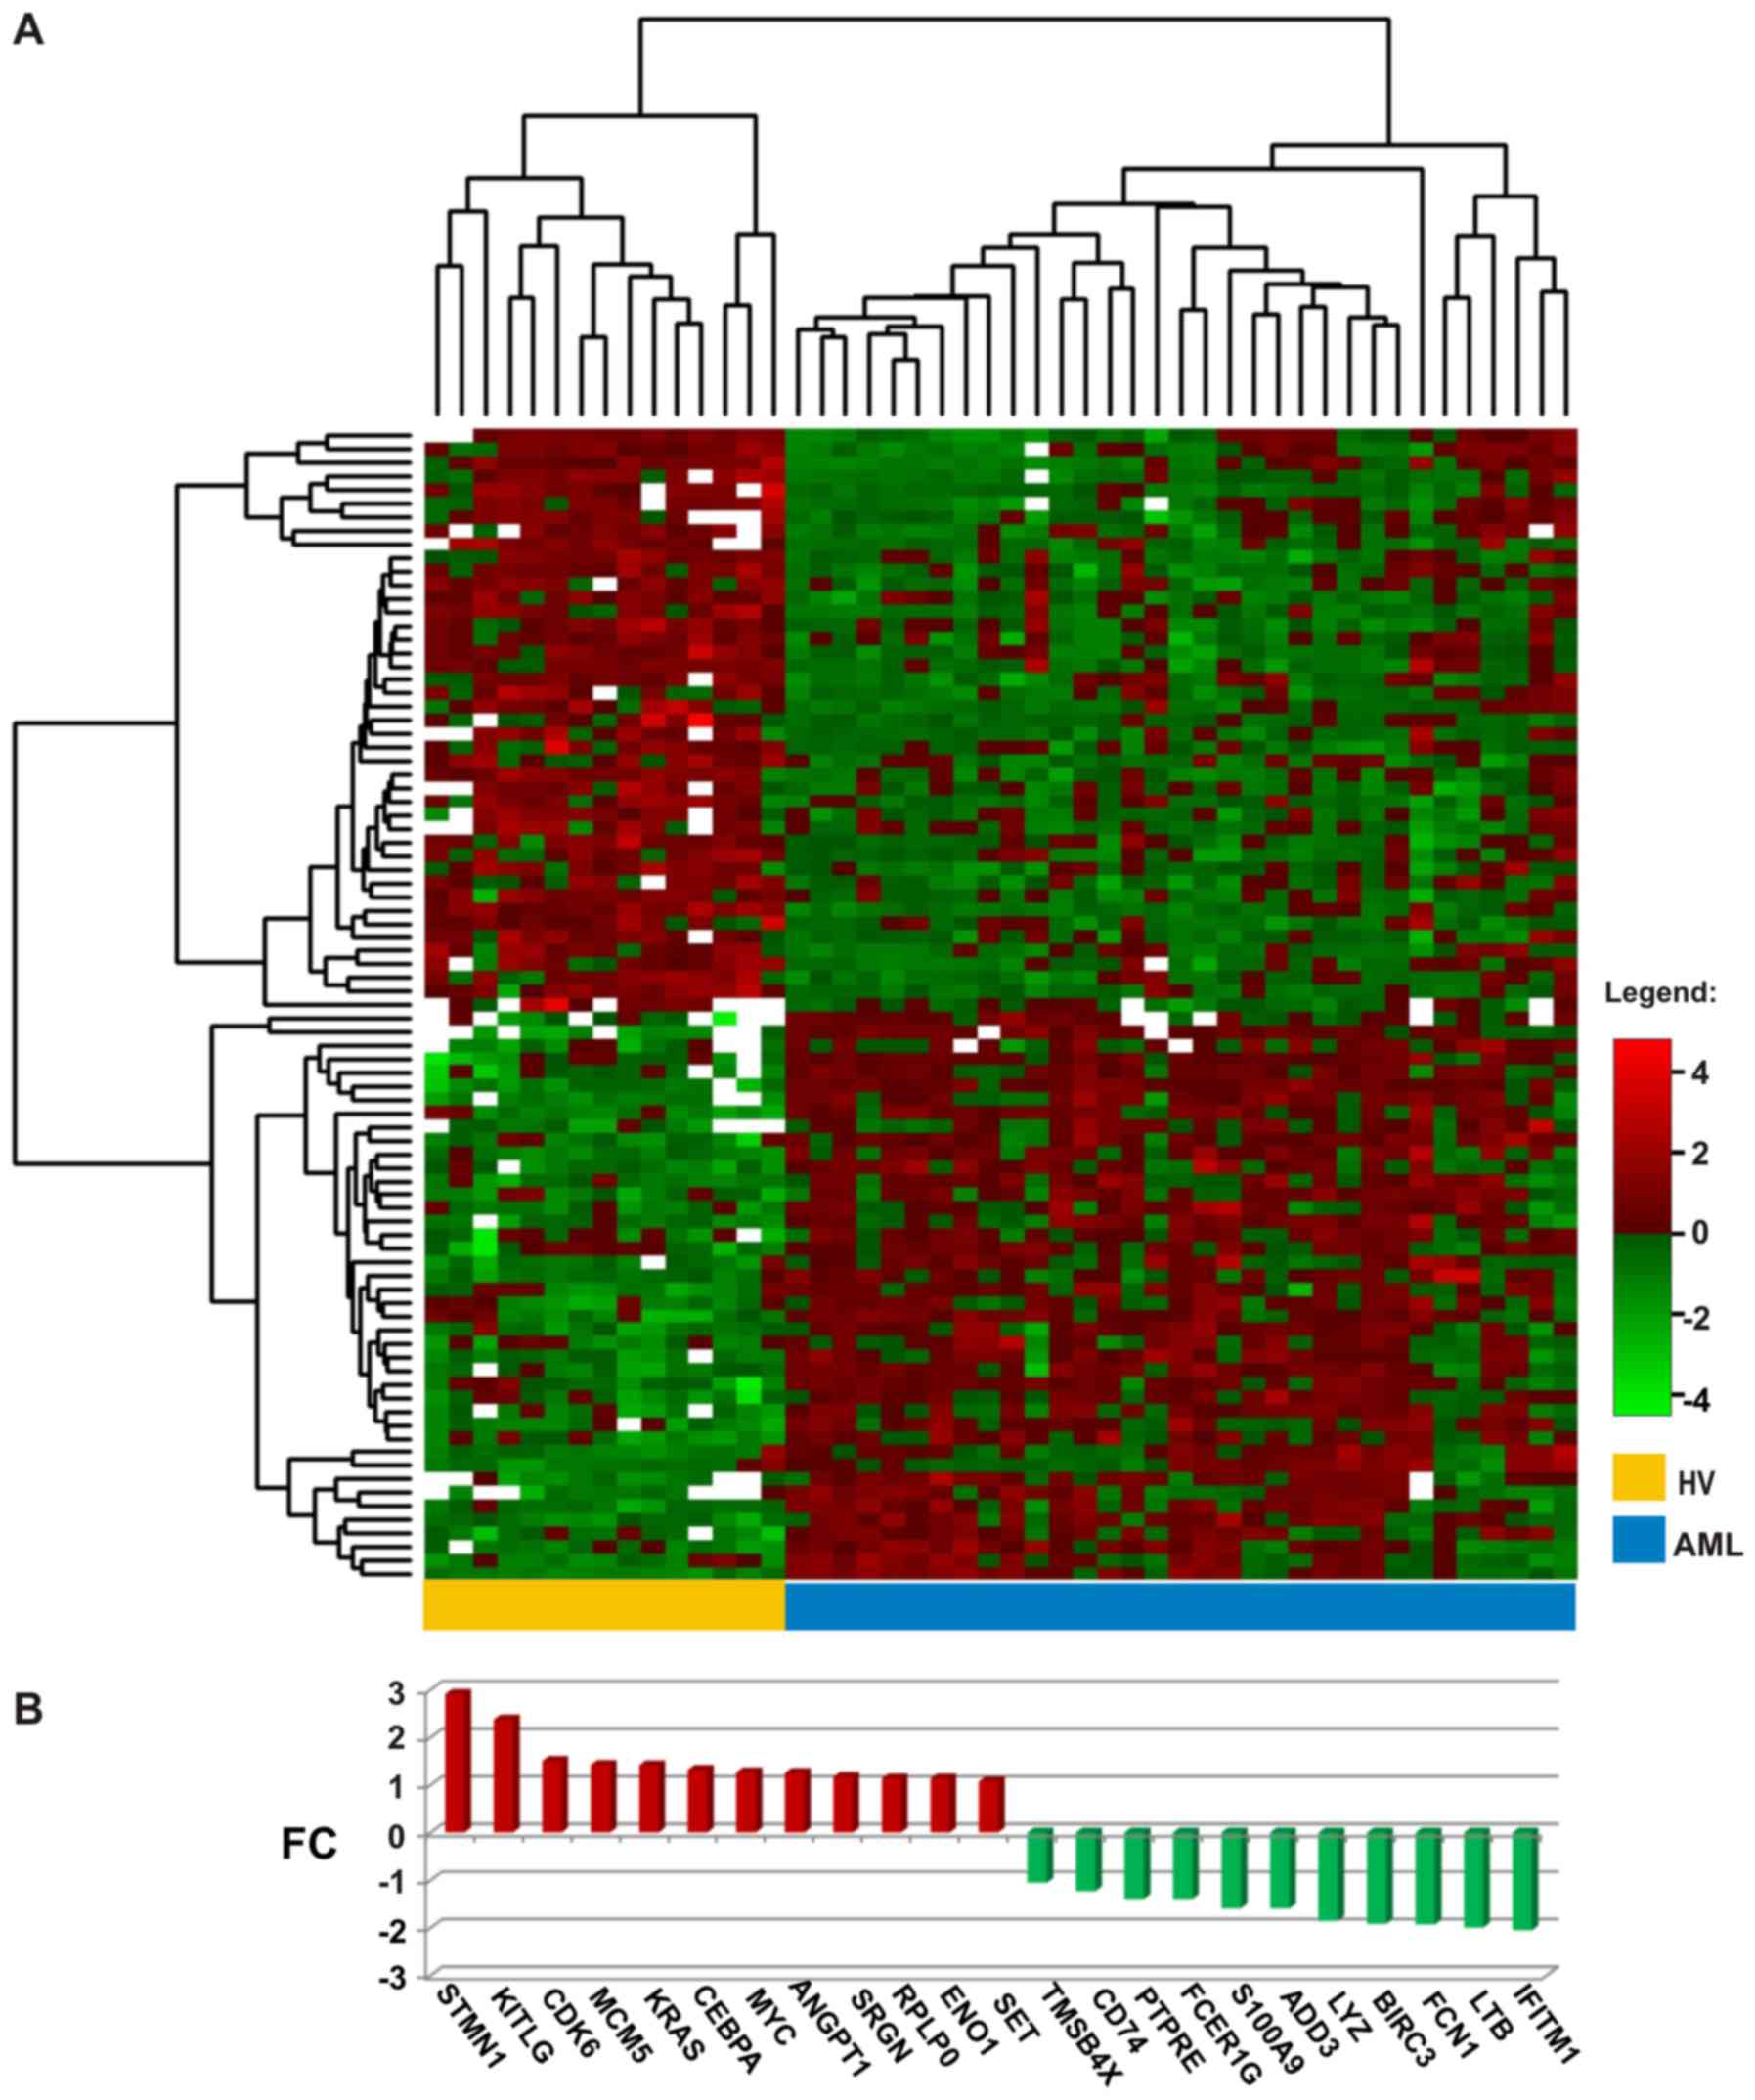
distinguish the AML from the HV samples (Fig. 1A); the entire set of arrays was
clearly divided into 2 clusters: 15 control HV samples constituted
a separate cluster, whereas all 33 AML samples belonged to a second
cluster.
| Table IVThe list of 83 differentially
expressed genes between AML and HV samples. |
Table IV
The list of 83 differentially
expressed genes between AML and HV samples.
| Gene name (ID) | Gene
description | Gene function |
Log2FC | Adjusted
p-value |
|---|
A, Genes overexpressed in AML |
|---|
| STMN1
(3925) | Stathmin 1 | Regulation of the
microtubule filament system by destabilizing microtubules | 2.91 |
1.67×10⁻¹⁰ |
| KITLG
(4254) | KIT ligand | The ligand of the
tyrosine-kinase receptor, required in hematopoiesis | 2.38 | 0.0088481 |
| CDK6
(1021) | Cyclin-dependent
kinase 6 | Cell cycle
regulation, G1 phase progression and G1/S transition; altered
expression in multiple human cancers | 1.51 |
1.88×10⁻⁹ |
| MCM5
(4174) | Minichromosome
maintenance complex component 5 | DNA replication,
cell cycle regulation; upregulated in the transition from the G0 to
G1/S phase | 1.42 | 0.0001986 |
| KRAS
(3845) | KRAS
proto-oncogene, GTPase | Oncogene, member of
the small GTPase superfamily; mutated in various malignancies | 1.42 | 0.0005584 |
| CEBPA
(1050) | CCAAT/enhancer
binding protein α | Transcription
factor, modulator of the expression of genes involved in cell cycle
regulation and body weight homeostasis; mutated in AML | 1.32 | 0.0006135 |
| MYC
(4609) | MYC proto-oncogene,
bHLH transcription factor | Regulation of cell
cycle progression, apoptosis and cellular transformation; amplified
in numerous human cancers, translocated in Burkitt’s lymphoma and
multiple myeloma | 1.26 |
4.32×10⁻⁷ |
| ANGPT1
(284) | Angiopoietin 1 | Role in vascular
development and angiogenesis, interactions between the endothelium
and surrounding matrix, blood vessel maturation and stability | 1.25 | 0.0022923 |
| SRGN
(5552) | Serglycin | Hematopoietic cell
granule proteoglycan, associated with complex of granzymes and
perforin, and granule-mediated apoptosis | 1.17 | 0.0064793 |
| RPLP0
(6175) | Ribosomal protein
lateral stalk subunit P0 | Ribosomal protein,
component of the 60S subunit, protein synthesis | 1.14 | 0.0000199 |
| ENO1
(2023) | Enolase 1 | Glycolytic enzyme,
structural lens protein (tau-crystallin) | 1.14 | 0.0000584 |
| SET
(6418) | SET nuclear
proto-oncogene | Inhibitor of
histone acetylases (HAT), nucleosome acetylation and
transcription | 1.07 | 0.0000584 |
| MYB
(4602) | MYB proto-oncogene,
transcription factor | Transcription
regulator, regulation of hematopoiesis, aberrently expressed,
rearranged or translocated in leukemias and lymphomas | 0.88 | 0.0058191 |
| GAL
(51083) | Galanin and GMAP
prepropeptide | Nociception,
feeding and energy homeostasis, osmotic regulation and water
balance | 0.87 | 0.0015198 |
| HSPA8
(3312) | Heat shock protein
family A (Hsp70) member 8 | Chaperone, correct
folding of nascent polypeptides, disassembly of clathrin-coated
vesicles in transport of cell membrane components (ATPase) | 0.72 | 0.0014811 |
| ADRA2C
(152) | Adrenoceptor α
2C | G protein-coupled
receptor, regulation of neurotransmitter release at lower levels of
nerve activity | 0.70 | 0.0017407 |
| HSPD1
(3329) | Heat shock protein
family D (Hsp60) member 1 | Chaperone, folding
and assembly of newly imported proteins in the mitochondria,
signalling molecule in the innate immune system | 0.61 | 0.0058191 |
| IGFBP7
(3490) | Insulin like growth
factor (IGF) binding protein 7 | Regulation of IGF
availability in body fluids and tissues and modulation of IGF
binding to its receptors, stimulation of prostacyclin production
and cell adhesion | 0.59 | 0.0014913 |
| RASSF5
(83593) | Ras association
domain family member 5 | Tumor suppressor,
inactivated in a variety of cancers, regulation of lymphocyte
adhesion, cell growth suppression | 0.58 | 0.0016728 |
| EEF1G
(1937) | Eukaryotic
translation elongation factor 1 g | Asubunit of the
elongation factor-1 complex, enzymatic delivery of aminoacyl tRNAs
to the ribosome | 0.56 | 0.0002401 |
| GSN
(2934) | Gelsolin | Calcium-regulated
protein, assembly and disassembly of actin filaments | 0.55 | 0.0005526 |
| ZNF22
(7570) | Zinc finger protein
22 | DNA binding,
transcription regulation | 0.51 | 0.0054429 |
| GAPDH
(2597) |
Glyceraldehyde-3-phosphate
dehydrogenase | Carbohydrate
metabolism, phosphorylation of glyceraldehyde-3-phosphate in the
presence of inorganic phosphate and nicotinamide adenine
dinucleotide (NAD) | 0.49 | 0.0015715 |
| KIT
(3815) | KIT proto-oncogene
receptor tyrosine kinase | Transmembrane
receptor for MGF (mast cell growth factor, stem cell factor),
mutated in gastrointestinal tumors, mast cell disease, AML and
piebaldism | 0.46 | 0.0017591 |
| HOXA10
(3206) | Homeobox A10 | Transcription
factor, regulation of gene expression, morphogenesis,
differentiation, fertility, embryo viability, and hematopoietic
lineage commitment | 0.43 | 0.0047731 |
| ERCC2
(2068) | ERCC excision
repair 2, TFIIH core complex helicase subunit | DNA damage repair,
transcription-coupled nucleotide excision repair, member of the
basal transcription factor BTF2/TFIIH complex | 0.43 | 0.0005584 |
| ATP6V0C
(527) | ATPase
H+ transporting V0 subunit c | Component of
vacuolar multisubunit enzyme ATPase (V-ATPase), acidification of
eukaryotic intracellular organelles, necessary for protein sorting,
zymogen activation, receptor-mediated endocytosis, synaptic vesicle
proton gradient generation | 0.43 | 0.0080978 |
| HSPA9
(3313) | Heat shock protein
family A (Hsp70) member 9 | Role in cell
proliferation, stress response and maintenance of the
mitochondria | 0.42 | 0.0026984 |
| ARHGEF12
(23365) | Rho guanine
nucleotide exchange factor 12 | Numerous cellular
processes initiated by extracellular stimuli through G
protein-coupled receptors, fusion partner in AML | 0.42 | 0.0014811 |
| PDE3B
(5140) | Phosphodiesterase
3B | Regulation of
energy metabolism, energy homeostasis and energy intake | 0.42 | 0.0046975 |
| HOXB6
(3216) | Homeobox B6 | DNA binding,
sequence-specific transcription factor, regulation of e.g. lung and
skin development | 0.40 | 0.0000475 |
| HSP90AB1
(3326) | Heat shock protein
90α family class B member 1 | Signal
transduction, protein folding and degradation, morphological
evolution, role in gastric apoptosis and inflammation | 0.39 | 0.0006700 |
| ARF1
(375) | ADP ribosylation
factor 1 | Phospholipase D
activator, a role in vesicular trafficking, intra-Golgi
transport | 0.38 | 0.0080978 |
| CTSD
(1509) | Cathepsin D | Pepsin-like
activity, role in protein turnover and proteolytic activation of
hormones and growth factors | 0.37 | 0.0086744 |
| MAP7
(9053) | Microtubule
associated protein 7 | Microtubule
stabilization, essential for cell polarization, differentiation and
spermatogenesis | 0.37 | 0.0058191 |
| ITGB4
(3691) | Integrin subunit
β4 | Mediation in
cell-matrix or cell-cell adhesion, gene expression and cell growth,
receptor for the laminins, pivotal role in the biology of invasive
carcinoma | 0.36 | 0.0058191 |
| MYH11
(4629) | Myosin heavy chain
11 | Major contractile
protein, rearranged in AML of the M4Eo subtype | 0.35 | 0.0020442 |
| PRKAR1B
(5575) | Protein kinase
cAMP-dependent type I regulatory subunit β | Signaling pathway
of the second messenger cAMP, regulation of ion transport,
metabolism, and transcription | 0.32 | 0.0080978 |
| PKM
(5315) | Pyruvate kinase
M1/2 | Glycolysis,
mediation of cellular metabolic effects induced by thyroid
hormones, role in bacterial pathogenesis | 0.31 | 0.0006463 |
| TUBB
(203068) | Tubulin β class
I | Structural
component of microtubules | 0.29 | 0.0081504 |
| MN1
(4330) | MN1 proto-oncogene,
transcriptional regulator | Translocated in
meningioma, myeloproliferation stimulation, leukemogenesis | 0.25 | 0.0070082 |
B, Genes underexpressed in AML
|
| IFITM1
(8519) | Interferon induced
transmembrane protein 1 | Regulation of
angiogenesis, tumorigenesis | −2.05 | 0.0000584 |
| LTB
(4050) | Lymphotoxin β | Induction of the
inflammatory response system, role in normal development of
lymphoid tissue | −2.00 |
1.29×10⁻⁷ |
| FCN1
(2219) | Ficolin 1 | Plasma protein with
elastin-binding activity, expressed in the peripheral blood
leukocytes | −1.93 | 0.0000173 |
| BIRC3
(330) | BIculoviral IAP
repeat containing 3 | Inhibition of
apoptosis by binding to tumor TRAF1 and TRAF2 necrosis factor
receptor-associated factors | −1.90 | 0.0014913 |
| LYZ
(4069) | Lysozyme | Antimicrobial
agent, cleavage of bacterial cell wall peptidoglycan | −1.85 | 0.0005526 |
| ADD3
(120) | Adducin 3 | Membrane skeletal
protein, assembly of spectrin-actin network; expression restricted
to brain and hematopoietic tissues | −1.60 | 0.0014913 |
| S100A9
(6280) | S100 calcium
binding protein A9 | Regulation of cell
cycle progression and differentiation, inhibition of casein kinase,
antifungal and antibacterial activity | −1.59 | 0.0014811 |
| FCER1G
(2207) | Fc fragment of IgE
receptor Ig | Key molecule
involved in allergic reactions | −1.39 | 0.0006135 |
| PTPRE
(5791) | Protein tyrosine
phosphatase, receptor type E | Signaling molecule,
regulation of cell growth, differentiation, mitotic cycle and
oncogenic transformation | −1.39 | 0.0024662 |
| CD74
(972) | CD74 molecule | Associates with
class II major histocompatibility complex (MHC), chaperone
regulating antigen presentation for immune response, mediation in
survival pathways and cell proliferation | −1.23 | 0.0058191 |
| TMSB4X
(7114) | Thymosin β4,
X-linked | Actin sequestering
protein, regulation of actin polymerization, cell proliferation,
migration, and differentiation | −1.05 |
1.32×10⁻⁸ |
| PF4
(5196) | Platelet factor
4 | Member of the CXC
chemokine family, involved in platelet aggregation, inhibitor of
hematopoiesis, angiogenesis and T-cell function | −0.97 | 0.0002201 |
| B2M
(567) |
β-2-microglobulin | Serum protein
associating with the MHC class I heavy chain on the surface of
nucleated cells, antibacterial activity | −0.95 | 0.0006700 |
| HLA-DPB1
(3115) | Major
histocompatibility complex, class II, DP β1 | Central role in the
immune system by presenting peptides derived from extracellular
proteins, expressed in B lymphocytes, dendritic cells and
macrophages | −0.77 | 0.0025915 |
| CSF3R
(1441) | Colony stimulating
factor 3 receptor | Cytokine
controlling production, differentiation, and function of
granulocytes, involvement in cell surface adhesion and recognition
processes | −0.71 | 0.0025443 |
| HOXA9
(3205) | Homeobox A9 | DNA-binding
transcription factor, regulation of gene expression, morphogenesis,
and differentiation, translocated in myeloid leukemias | −0.70 | 0.0006135 |
| CCL5
(6352) | C-C motif chemokine
ligand 5 | Chemokine involved
in immunoregulatory and inflammatory processes, chemoattractant for
blood monocytes, memory T helper cells and eosinophils | −0.53 | 0.0033854 |
| CCL3
(6348) | C-C motif chemokine
ligand 3 | Small inducible
cytokine, macrophage inflammatory protein 1 α, role in inflammatory
responses | −0.51 | 0.0034134 |
| RARA
(5914) | Retinoic acid
receptor α | Nuclear retinoic
acid receptor, transcription regulation in a ligand-dependent
manner, regulation of development, differentiation, apoptosis,
granulopoeisis, and clock genes, translocated in acute
promyelocytic leukemia | −0.49 | 0.0053657 |
| CCL19
(6363) | C-C motif Chemokine
ligand 19 | Cytokine involved
in immunoregulatory and inflammatory processes, antimicrobial, role
in normal lymphocyte recirculation and homing | −0.46 | 0.0000612 |
| NFKBIA
(4792) | NFKB inhibitor
α | Interactions with
REL dimers to inhibit NF-κB/REL complexes involved in inflammatory
responses | −0.46 | 0.0054429 |
| TNFSF10
(8743) | TNF superfamily
member 10 | Cytokine from the
tumor necrosis factor (TNF) ligand family, preferential induction
of apoptosis in transformed and tumor cells | −0.46 | 0.0033432 |
| CD52
(1043) | CD52 molecule | Lymphocyte surface
antigene, involved in fertilisation and response to therapy in
large granular lymphocytic leukemia, AML and MDS | −0.45 | 0.0095319 |
| PLBD1
(79887) | Phospholipase B
domain containing 1 | Role in the defence
against microorganisms, generation of lipid mediators of
inflammation | −0.43 | 0.0058191 |
| CAPN10
(11132) | Calpain 10 | Calcium-dependent
cysteine protease, associated with type 2 or non-insulin-dependent
diabetes | −0.38 | 0.0005178 |
| STAT5B
(6777) | Signal transducer
and activator of transcription 5B | Transcription
factor, signal transduction triggered by IL2, IL4, CSF1, and growth
hormones, involved in apoptosis, adult mammary gland development,
and sexual dimorphism of liver gene expression | −0.36 | 0.0026984 |
| PGK1
(5230) | Phosphoglycerate
kinase 1 | Glycolytic enzyme,
conversion of 1,3-diphosphoglycerate to 3-phosphoglycerate,
involved in angiogenesis of tumor cells | −0.35 | 0.0064868 |
| RALGDS
(5900) | Ral guanine
nucleotide dissociation stimulator | Effector of
Ras-related GTPase, signaling for a variety of cellular
processes | −0.35 | 0.0070755 |
| SPTBN1
(6711) | Spectrin β,
non-erythrocytic 1 | Actin crosslinking
and molecular scaffold protein, cytoskeleton functioning,
determination of cell shape, arrangement of transmembrane proteins,
and organization of organelles | −0.35 | 0.0056936 |
| BTG1
(694) | BTG
anti-proliferation factor 1 | Anti-proliferative
activity, co-activator of cell differentiation, regulation of cell
growth | −0.34 | 0.0079167 |
| TRADD
(8717) | TNFRSF1A associated
via death domain | Programmed cell
death signaling and NF-κB activation, suppression of TRAF2-mediated
apoptosis | −0.34 | 0.0005526 |
| CYP2E1
(1571) | Cytochrome P450
family 2 subfamily E member 1 | Involved in drug
metabolism, synthesis of cholesterol, steroids and other lipids,
induced by ethanol, the diabetic state, and starvation | −0.33 | 0.0052990 |
| MAP4K2
(5871) | Mitogen-activated
protein kinase kinase kinase kinase 2 | Involved in B-cell
differentiation, activated by TNF-α, interacting with TNF
receptor-associated factor 2 (TRAF2) | −0.32 | 0.0001674 |
| IGF1
(3479) | Insulin like growth
factor 1 | Involved in
mediating growth and development | −0.32 | 0.0032632 |
| STK4
(6789) | Serine/threonine
kinase 4 | Acting upstream of
the stress-induced mitogen-activated protein kinase cascade,
involved in apoptosis and chromatin condensation induction | −0.31 | 0.0022923 |
| HCK
(3055) | HCK proto-oncogene,
Src family tyrosine kinase | Hemopoietic
protein, present myeloid and B-lymphoid cell lineages, role in
activation of the respiratory burst, neutrophil migration and
degranulation of neutrophils | −0.29 | 0.0059276 |
| PDGFRB
(5159) | Platelet-derived
growth factor receptor β | Cell surface
tyrosine kinase receptor for growth factors, development of the
cardiovascular system, rearrangement of the actin cytoskeleton | −0.28 | 0.0001623 |
| RHOB
(388) | Ras homolog family
member B | Tumor suppressor,
regulation of cytoskeletal dynamics and vesicle trafficking,
control of endothelial barrier function | −0.28 | 0.0048010 |
| XBP1
(7494) | X-box binding
protein 1 | Transcription
factor regulating MHC class II genes, increase of viral protein
expression | −0.27 | 0.0014913 |
| IFNA1
(3439) | Interferon α1 | Antiviral activity,
pathogen clearance and tissue inflammation | −0.26 | 0.0024163 |
| PIM1
(5292) | Pim-1
proto-oncogene, serine/threonine kinase | Signal transduction
in blood cells, propagation of cell proliferation and survival,
tumorigenesis, overexpressed in hematopoietic malignancies and
prostate cancer | −0.24 | 0.0013396 |
| PXN
(5829) | Paxillin | Cytoskeletal
protein involved in actin-membrane attachment at sites of cell
adhesion to the extracellular matrix (focal adhesion) | −0.24 | 0.0086744 |
Considering another criterion, the level of
expression, we selected from the list of 83 DEGs, 23 genes with the
greatest change in expression (log2FC values >1.0 or
<−1.0, equivalent to a >2-fold change in expression in both
directions): 12 up- and 11 downregulated (Fig. 1B). The most significantly
overexpressed gene in AML (log2FC close to 3, equal to
an 8-fold enrichment) was STMN1, which encodes a protein
involved in the regulation of the microtubule filament system,
stathmin 1. STMN1 was also the top statistically significant
gene in the comparison between the AML and HV samples (adjusted
p-value 1.67×10⁻¹⁰) (Tables III and IV). Other upregulated genes encoded
proteins associated with myeloid leukemia and cancer development:
Oncogenes, cell cycle and apoptosis regulators [CCAAT/enhancer
binding protein α (CEBPA), Kirsten rat sarcoma viral
oncogene homolog (KRAS), v-myc myelocytomatosis viral
oncogene homolog, avian (MYC), cyclin-dependent kinase 6
(CDK6), minichromosome maintenance complex component 5
(MCM5), SET nuclear proto-oncogene (SET),
proto-oncogene c-Kit ligand (KITLG) and serglycin
(SRGN)], proteins involved in angiogenesis [angiopoietin 1
(ANGPT1)], cell growth, glucose metabolism and the
transcriptional regulator, enolase 1 (ENO1) and ribosomal
protein RPLP0.
Among the downregulated genes, predominantly those
encoding defense/immunity proteins, were the following: Cell
surface receptors CD74 and Fc fragment of IgE
(FCER1G), ficolin 1 (FCN1) typically expressed in the
peripheral blood leukocytes, antimicrobial agent lysozyme
(LYZ), tumor necrosis factor (TNF) family member
lymphotoxin β (LTB), interferon induced transmembrane
protein 1 (IFITM1) and calcium binding protein
S100A9. Moreover, decreased gene expression in AML was
observed for the cell cycle regulator protein tyrosine phosphatase
(PTPRE), apoptosis suppressor baculoviral IAP
repeat-containing 3 (BIRC3), regulator of actin
polymerization, cell proliferation, migration and differentiation
thymosin β4 (TMSB4X) and membrane skeletal protein adducin 3
(ADD3).
To determine whether AML FAB subtypes could be
distinguished by using our boutique array, we compared the gene
expression profiles obtained for 11 patients diagnosed as AML-M1
and for 22 patients classified as AML-M2. However, we did not
detect any statistically significant differences (adjusted p-value
>0.35) (Table III). A
separate analysis of AML-M1 vs. HV and AML-M2 vs. HV revealed 54
and 149 DEGs, respectively (α=0.05). Among the 54 DEGs from the
comparison between AML-M1 and HV, 50 were shared with the list of
149 DEGs obtained from the comparison between AML-M2 and HV, thus
suggesting that the AML-M1 subtype is a subset of AML-M2 and the
latter shows some unique features. The list of genes shared between
the M1 and M2 FAB subtypes included all the genes shown in Fig. 1B apart from SRGN,
CD74, PTPRE and ADD3, which were unique for
the comparison between AML-M2 and HV. Other genes shared between M1
and M2 were ERCC2, ITGB4, HSPA8, EEF1G,
HOXB6, IGFBP7, KIT, PKM2,
RASSF5, MN1, ARHGEF12, HSP90AB1,
MYB, HSPA9 and GSN (overexpressed), and
CCL19, MAP4K2, PF4, CCL5, B2M,
HCK, CAPN10, HOXA9, TRADD, PGK1,
PLBD1, IFNA1, BTG1, NFKBIA and
PDGFRB (underexpressed). To 4 genes unique for AML-M1
belonged 2 underexpressed (ACTB and CST7) and 2
overexpressed (INPP5D and RHOH) genes. The list of
overexpressed genes unique for AML-M2 included inter alia
CTSG, CTSD, GAL, MYH11, GAPDH,
ADRA2C, ATP6V0C, MAP7, ARF1,
METTL3, BCR, TUBB, ABL1, NPM1,
CD34, JUNB and MPO, encoding myeloperoxidase,
marker protein of AML with maturation.
As regards the effects of mutations, we analyzed
the gene expression profiles from the following AML subgroups:
RUNX1/RUNX1T1+ [5 patients with
translocation t(8;21), typical of the AML-M2 FAB subtype],
NPM1+ (8 patients with an NPM1 mutation)
and FLT3+ (4 patients with FLT3-ITD).
Owing to the co-existence of the FLT3-ITD and NPM1
mutation in some patients, we were also able to distinguish 3
additional subgroups:
NPM1+/FLT3+ (2 patients),
NPM1+/FLT3− (6 patients) and
NPM1−/FLT3+ (2 patients).
However, we were not able to identify any distinct clusters or
detect significant differences in any of the comparisons (Table III).
The last result worth mentioning regarding the AML
analysis using the AML-array is the classification of the patients
according to their response to therapy. The association of gene
expression with the prognosis and treatment outcome is a clinically
important aspect of leukemia studies. Although all the studied
samples were collected at the time of diagnosis, further monitoring
of patients enabled to divide them into 3 general subgroups
corresponding to their responses to therapy: Patients who reached
complete remission (CR, 15 patients), patients resistant to therapy
(RES, 9 patients) and patients who succumbed to the disease during
therapy (X, 9 patients). The CR subgroup was further divided into 2
smaller subgroups: Patients with complete remission lasting up to 1
year (CR-short, 12 patients) and patients with complete remission
lasting >1 year (CR-long, 3 patients). We did not detect any
statistically significant differences in gene expression between
any of the above subgroups (Table
III).
In all analyses performed with the AML-array,
significant differences were detected only when an AML subgroup was
compared with HV. Notably, the obtained lists of DEGs, despite
being of variable length, consisted a high number of shared genes,
and STMN1 was always at the top of the ranking (Table III). To eliminate the HV impact,
we repeated all the analyses, focusing solely on the AML samples.
The result was the same: No statistically significant differences
were detected between AML subgroups apart from one: The
overexpression of the CPA3 gene, encoding a
carboxypeptidase, in NPM1+/FLT3+ AML vs.
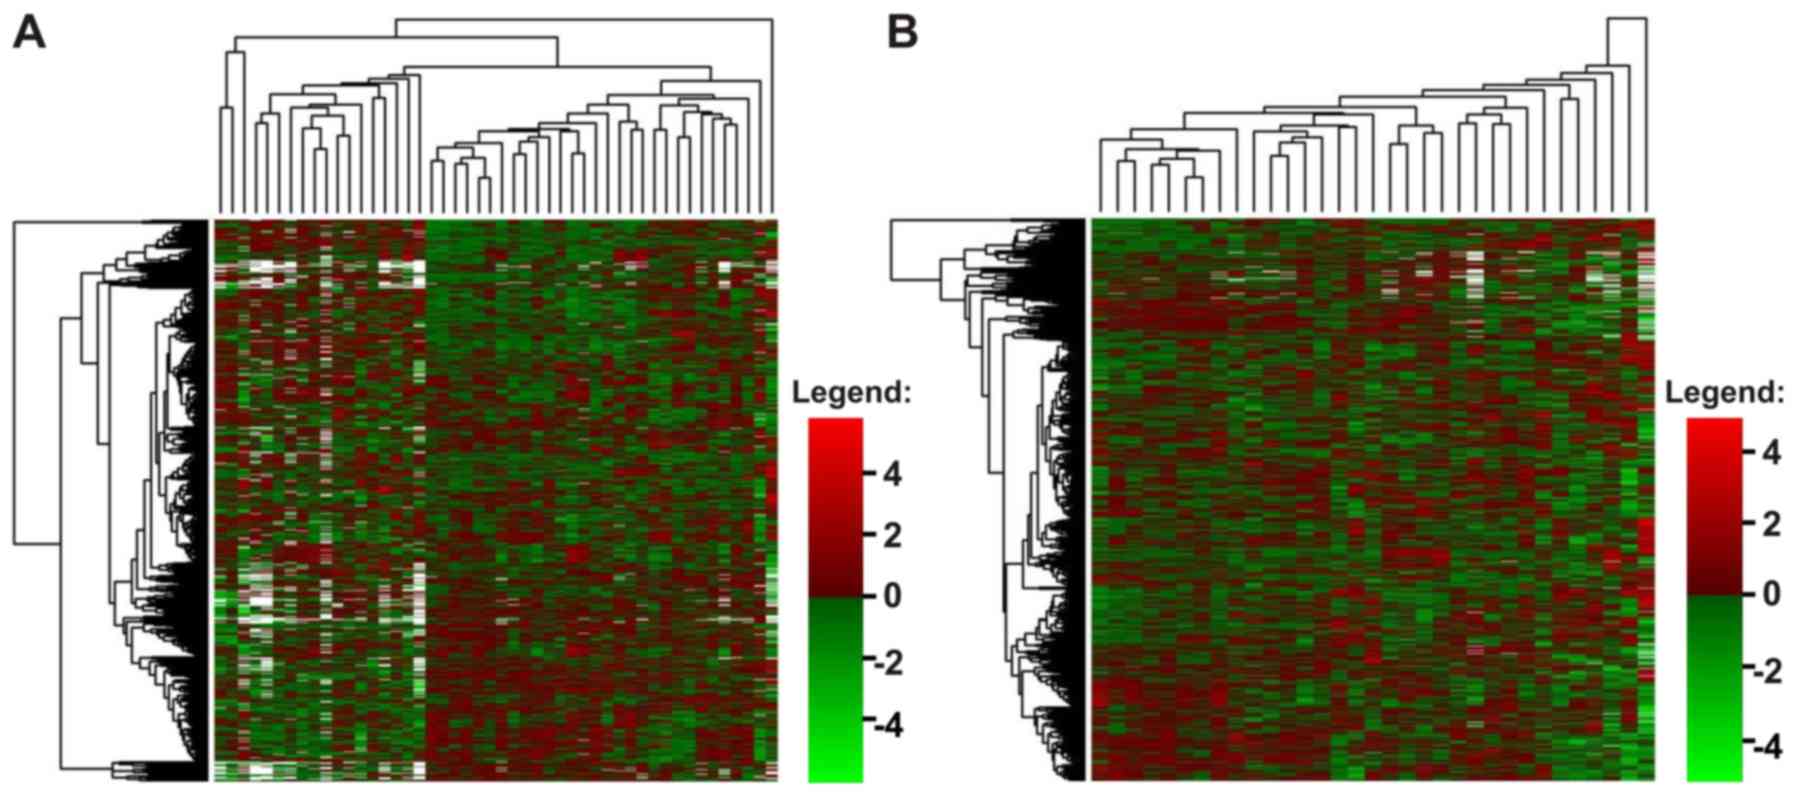
remaining AML samples (p=0.043) (Table III). Unsupervised hierarchical
clustering of the data also indicated that the patients with AML
were generally a homogenous group, despite individual variations
(Fig. 2).
Real-time PCR analysis
To verify the results of the microarray analysis,
we selected 4 genes, STMN1, NPM1, S100A9 and
S100A8, and quantified their expression with the use of
real-time PCR and a Rotor-Gene Q instrument. In this case, our
sample set contained 14 HV and 21 AML samples. The STMN1
gene was selected as the most upregulated gene in AML compared with
HV and NPM1 was selected as upregulated only in some AML
subgroups (AML-M2, AML-NPM1+ and AML X), whereas
S100A9 was selected as one of the most downregulated genes
in AML and different AML subgroups compared with HV (Table III). S100A8 was
underexpressed with statistical significance only in AML and in the
AML-CR subgroup (Table III);
however, we were interested whether 2 genes belonging to the same
gene family present similar expression patterns.
First, owing to the variable expression of many
so-called ‘housekeeping genes’, we tested 4 commonly used reference
genes: ACTB, GAPDH, PGK1 and PPIA. The
expression stability of each gene across the samples was estimated
with geNorm. PGK1 and PPIA were indicated as the most
stable, whereas GAPDH was the most variable, showing a trend
toward upregulation in the AML samples (data not shown). This
finding was consistent with the results of microarray analysis, in
which GAPDH was in the list of DEGs between the AML and HV
samples. Finally, 2 reference genes, PGK1 and PPIA,
were used as normalization factors. Gene expression was analyzed in
the context of AML subtypes, mutation status and response to
therapy (Figs. 3 and 4).
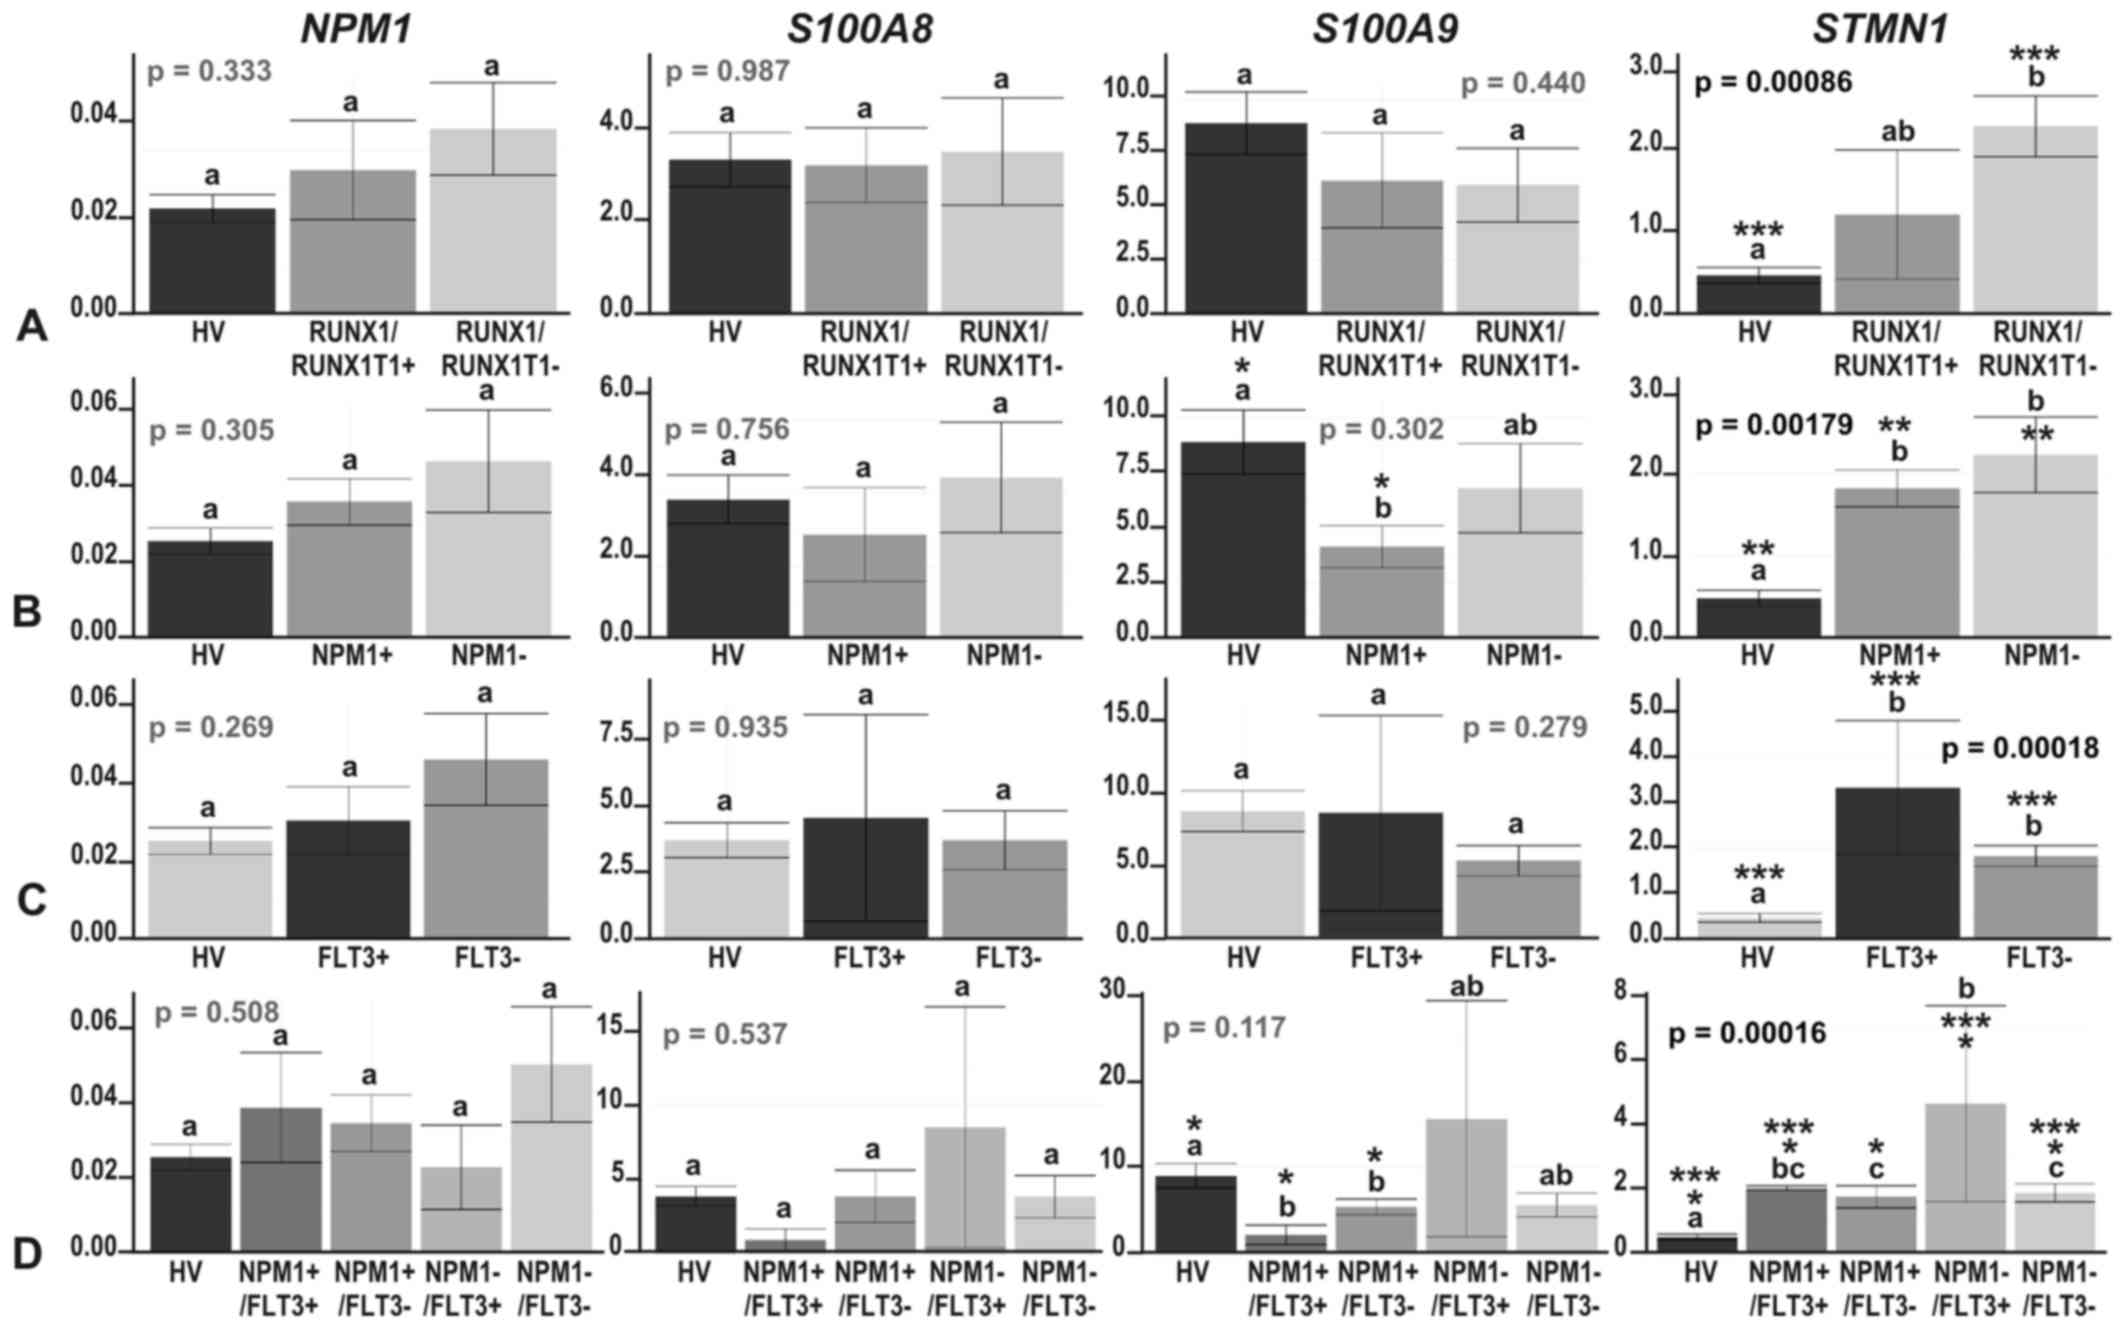
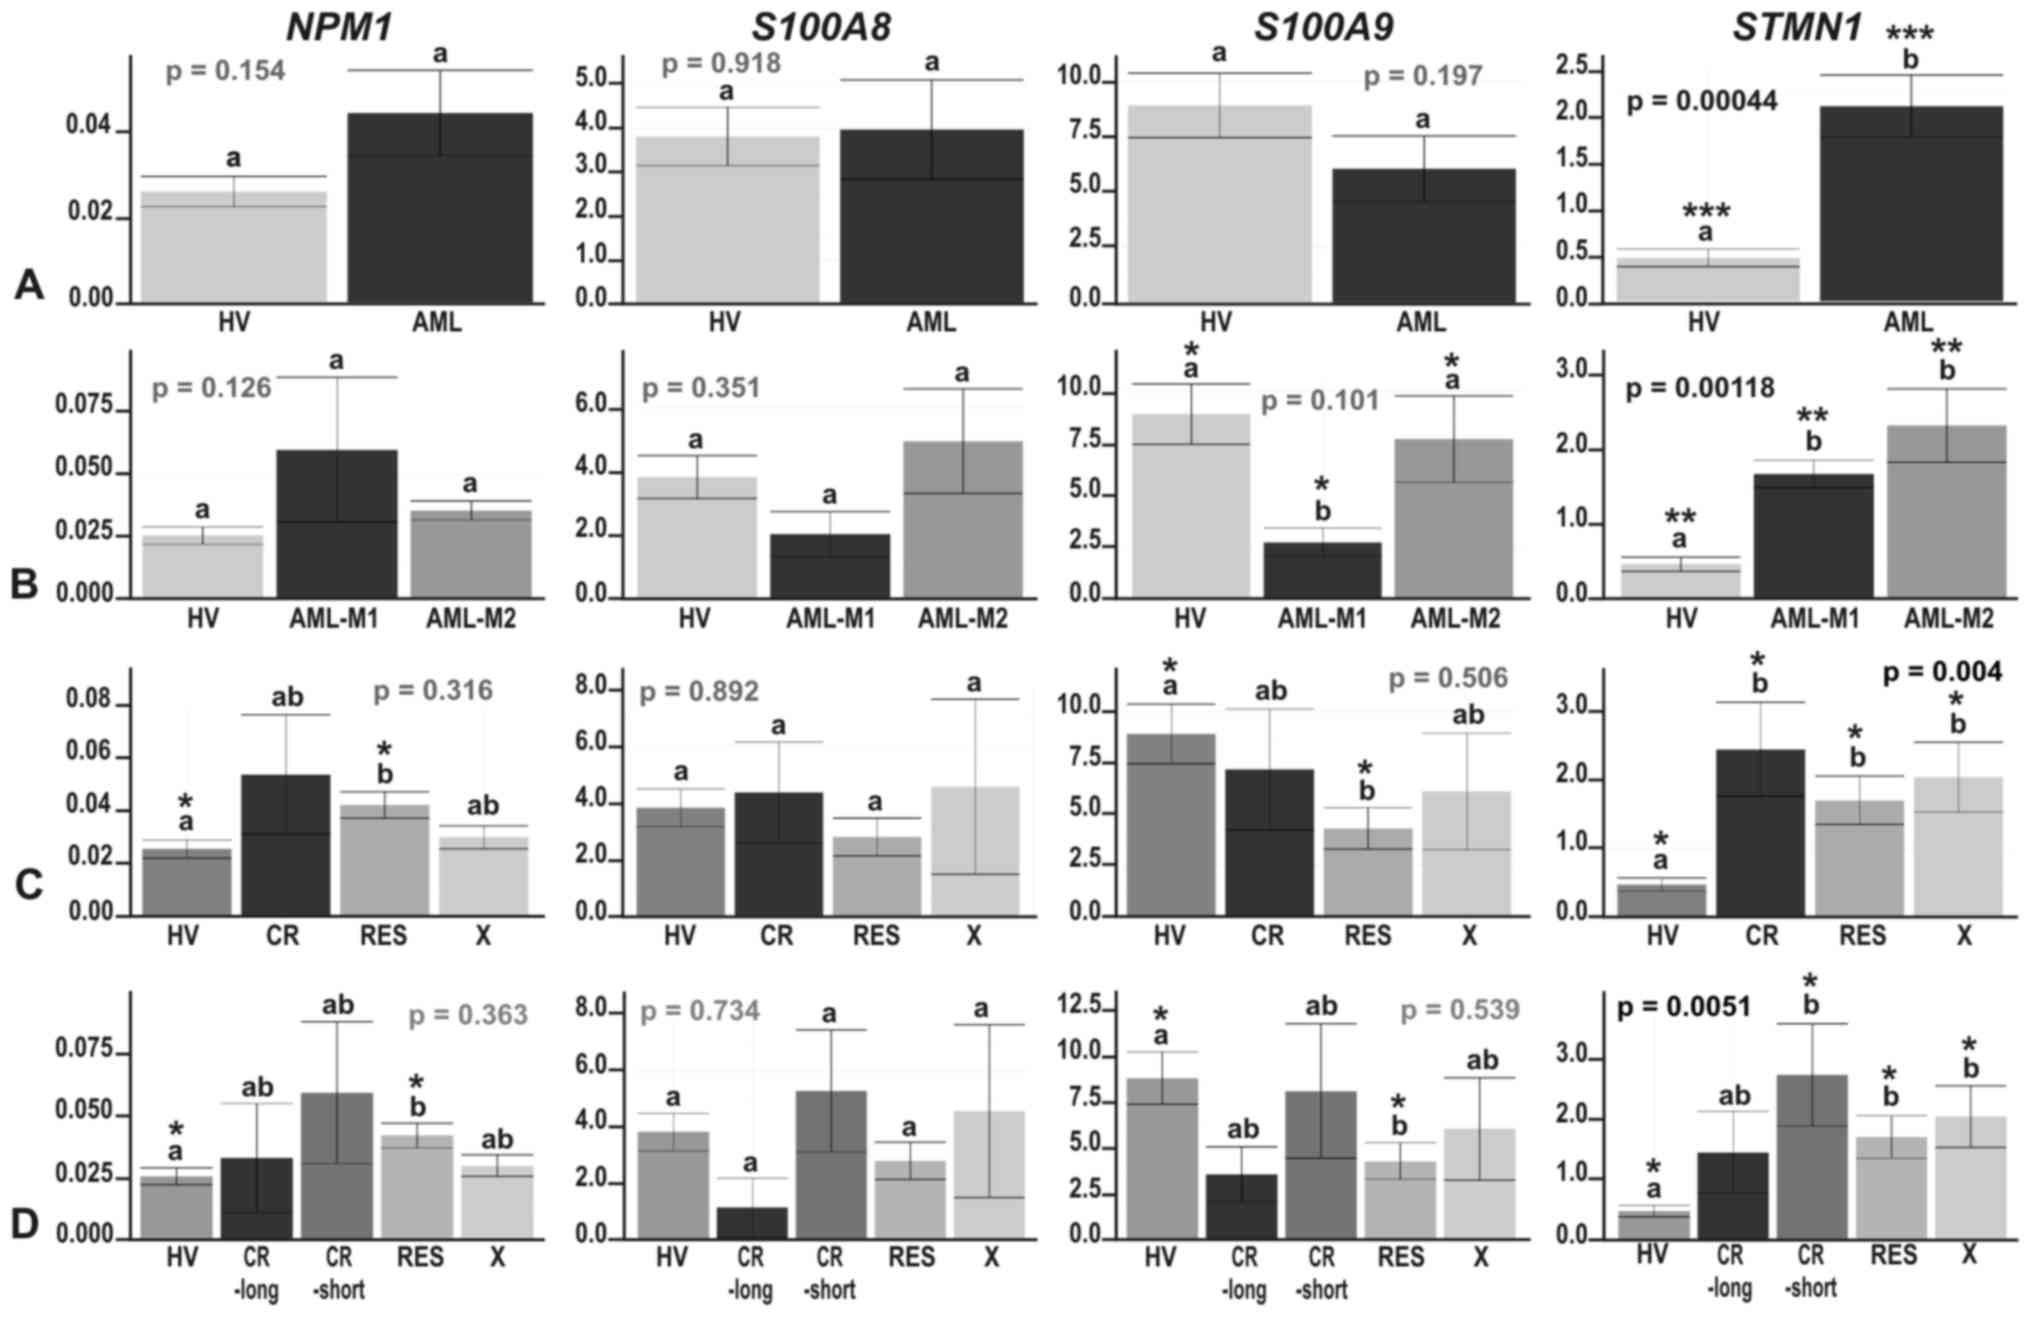 | Figure 3The results of real-time PCR-based
expression analysis of 4 genes (NPM1, S100A8,
S100A9 and STMN1) in (A) acute myeloid leukemia (AML)
compared with healthy volunteers (HV) samples; (B) in the context
of the AML French-American-British (FAB) subtypes, M1 and M2; and
in the context of the response to therapy, with the AML divided
into (C) 3 (CR, RES, X) subgroups or (D) 4 subgroups (CR_long,
CR_short, RES, X). The y-axes show relative expression values of a
studied gene compared to the reference genes. Each plot contains
the ANOVA p-value obtained for a whole test. Pair-wise comparisons
with statistically significant differences, verified with a t-test
and HSD Tukey test, are indicated by letters and asterisk symbols
above each bar. Bars showing the same letter indicate no
significant difference (p>0.05). The numbers of asterisks denote
the level of statistical significance: *p≤0.05,
**p≤0.01 and ***p≤0.001. |
The most consistent results between the microarray
and real-time PCR experiments were obtained for the STMN1
gene, which was significantly induced in AML compared with HV
(p=0.00044), although the fold change was somewhat lower (~4.5-fold
compared with an almost 8-fold change in the microarray data
analysis) (Fig. 3A). Similar to
the microarray data analysis results, STMN1 upregulation was
visible in each AML subgroup compared with HV (t-test
p=0.038–0.000019) (Figs. 3 and
4). There were no significant
differences in STMN1 expression between particular AML
subgroups with the following two exceptions:
NPM1−/FLT3− vs.
NPM1−/FLT3+ (p=0.015) and
NPM1−/FLT3+ vs.
NPM1+/FLT3− (p=0.029). The
highest STMN1 expression was observed in the
NPM1−/FLT3+ subgroup (Fig. 4D).
As regards NPM1 gene expression, we observed
a trend toward an upregulation in AML (Fig. 3A); however, the increase in
NPM1 expression was statistically significant in only one
comparison (RES vs. HV; t-test p=0.021) (Fig. 3C and D).
Real-time PCR-based analysis of S100A8 and
S100A9 genes confirmed their general suppression trend in
AML or at least some AML subgroups compared to HV. The expression
levels of these 2 relative genes, coding for calcium-binding
proteins, highly correlated (Pearson’s correlation, 1; p-value
<2.2e−16); however, a statistically significant
decrease was observed only for S100A9: In the AML-M1 subtype
compared with HV (t-test p=0.0012), as well as with AML-M2 (t-test
p=0.038) (Fig. 3B), in
NPM1-mutated AML vs. HV (t-test p=0.013) (Fig. 4B), irrespective of the FLT3
mutation status (t-test p=0.048 for HV vs.
NPM1+/FLT3− and t-test p=0.01
for HV vs. NPM1+/FLT3+)
(Fig. 4D), and in the RES subgroup
vs. HV (t-test p=0.018) (Fig. 3C and
D).
Comparisons of the results from the
transcriptomic and proteomic studies
As the same group of AML samples was also
previously analyzed in a proteomic analysis in our laboratory
(33,34), in this study, we attempted to
compare the results of the AML transcriptome and proteome analyses.
However, owing to the limitations of both approaches, the
comparison could be made for only a small subset of genes/proteins.
The AML-array consisted of probes that were complementary for
>900 genes, representing ~4% of all human genes. However, the
2-DE-MS analysis of AML proteomes enabled the detection of <200
proteins (33), representing much
<1% of all the human proteins. In detail, from the 184 unique
proteins detected in the proteomic study, only 52 (28%) had
corresponding gene-specific probes on the AML-array. From the 184
identified proteins, 40 were determined to be differentially
accumulated in the studied samples, of which 20 were represented on
the AML-array: 13 by gene-specific probes and 7 by the probes
complementary to the related genes (from the same gene family).
Half of the results of the proteomics and transcriptomic analyses
were concordant or partially concordant, but the other half was
discordant (Table V).
| Table VComparisons of the results from the
transcriptomic and proteomic studies. |
Table V
Comparisons of the results from the
transcriptomic and proteomic studies.
| Protein identified
in the proteomic study (33) | Corresponding
gene | Microarray
probe | Protein
accumulation | Gene
expression | Concordant |
|---|
| Actin γ1 | ACTG1 |
Target-specific | In HV present only
in BM, in AML higher in CR-short | In HV higher in PB,
in AML higher in CR-short | Partially |
| α-actinin | ACTN4 | For
ACTN1 | Higher in AML | Slightly lower in
AML | No |
|
Fructose-bisphosphate aldolase A | ALDOA | For
ALDOC | In HV present only
in BM | In HV higher in
PB | No |
| Annexin I | ANXA1 |
Target-specific | In HV higher in BM,
higher in AML vs. HV and in CR vs. RES AML | In HV higher in BM,
no difference between AML and HV, lower in CR vs. RES AML | No |
| Annexin III | ANXA3 |
Target-specific | In HV higher in PB,
in AML present only in M2 | In HV higher in BM,
higher in AML vs. HV, higher in AML M1 vs. M2 | No |
| Rho
GDP-dissociation inhibitor 2 | ARHGDIB | For ARHGAP4,
ARHGEF1, ARHGEF12 | In HV higher in BM,
higher in AML vs. HV | In HV higher in PB,
ARHGEF12 and ARHGAP4 - higher in AML, ARHGEF1 - slightly lower in
AML | Partially |
| Catalase | CAT |
Target-specific | In HV higher in PB,
higher in AML and in AML M2 vs. M1 | In HV higher in PB,
slightly higher in AML vs. HV, higher in AML M2 vs. M1 | Yes |
| Cofilin-1 | CFL1 |
Target-specific | In HV higher in
PB | In HV slightly
higher in PB | Yes |
| α-enolase (ENO1
protein) | ENO1 |
Target-specific | In HV higher in
BM | In HV higher in PB,
significantly higher in AML vs. HV | No |
| Glutathione
transferase ω | GSTO
(1,2) | For
GSTP1 | Present only in AML
CR | Significantly
higher in AML, slightly lower in CR | No |
| Tumor rejection
antigen (Gp96) | HSP90B1 |
Target-specific | In HV higher in PB,
lower in AML vs. HV | In HV higher in PB,
higher in AML vs. HV | Partially |
| L-Plastin
(lymphocyte cytosolic protein 1) | LCP1 |
Target-specific | Present only in AML
M2 | Significantly lower
in AML vs. HV, higher in AML M1 | No |
| Pyruvate
kinase | PKM |
Target-specific | Much higher in AML
vs. HV | Significantly
higher in AML vs. HV | Yes |
| Purine nucleoside
phosphorylase | PNP |
Target-specific | In HV higher in BM,
lower in AML | In HV higher in PB,
higher in AML | No |
|
Acetyl-cypa:cyclosporine complex
[peptidylprolyl isomerase A (cyclophilin A)] | PPIA | For
PPIF | In HV higher in
PB | In HV no difference
between PB and BM, higher in AML vs. HV | No |
|
Peroxiredoxin-2 | PRDX2 |
Target-specific | In HV higher in BM,
higher in AML vs. HV PB, lower in AML vs. HV BM | In HV higher in BM,
slightly lower in AML vs. HV | Partially |
| Histone-binding
protein RBBP4 (retinoblastoma binding protein) | RBBP4 |
Target-specific | Higher in AML, in
HV merely detectable | Slightly lower in
AML vs. HV | No |
| Tropomyosin α | TPM1 |
Target-specific | In HV present only
in PB, much lower in AML vs. HV | In HV higher in BM,
lower in AML vs. HV | Partially |
| Tubulin β | TUBB |
Target-specific | In HV higher in BM,
lower in AML vs. HV | In HV higher in BM,
higher in AML vs. HV | Partially |
| 14-3-3 protein
ζ/δ | YWHAZ | For
YWHAQ | In HV higher in PB,
lower in AML vs. HV | In HV higher in PB,
slightly lower in AML vs. HV | Yes |
Droplet digital PCR analysis
To verify some of the discrepancies between the
transcriptomic and proteomic results, we applied another
quantitative PCR method, ddPCR, which is one of the most precise,
sensitive and accurate PCR types. We expanded our research group to
20 HV samples and 41 AML samples. For the analysis, performed with
a QX200 Droplet Digital PCR system (Bio-Rad), we selected 4 genes.
Two of these, ANXA3, encoding Annexin 3, and CAT,
encoding catalase, were determined as being differentially
accumulated in the proteomics analyses. None of these genes were
identified with the AML-array as being differentially expressed,
and the expression trend was concordant for CAT, but was
discordant for ANXA3. As a type of positive control, we used
the ABL1 oncogene, which was slightly, but significantly,
increased in AML-M2 and AML-RES compared with HV in the microarray
experiment. Additionally, we analyzed Wilms tumor 1 gene
(WT1), which has recently been described as overexpressed
and prognostically relevant in most acute leukemias (39,40),
but was not included in our AML-array probe set. As a reference
gene, we selected PGK1, on the basis of our previous
real-time PCR analysis. As regards the CAT gene, we were
able to multiplex reactions with a reference gene, due to the
differences in PCR product sizes (Table II). For the ABL1,
ANXA3 and WT1 genes, a reference gene was analyzed in
a separate reaction, but always within the same run. The data from
duplicate experiments were separately processed in Quanta Soft
version 1.5.38.1118 software (Bio-Rad). The relative expression
value of each gene was calculated as the ratio of droplet numbers
for the studied gene vs. the reference gene. The results of the
statistical analysis, performed in R Bioconductor, are presented in
Figs. 5 and 6.
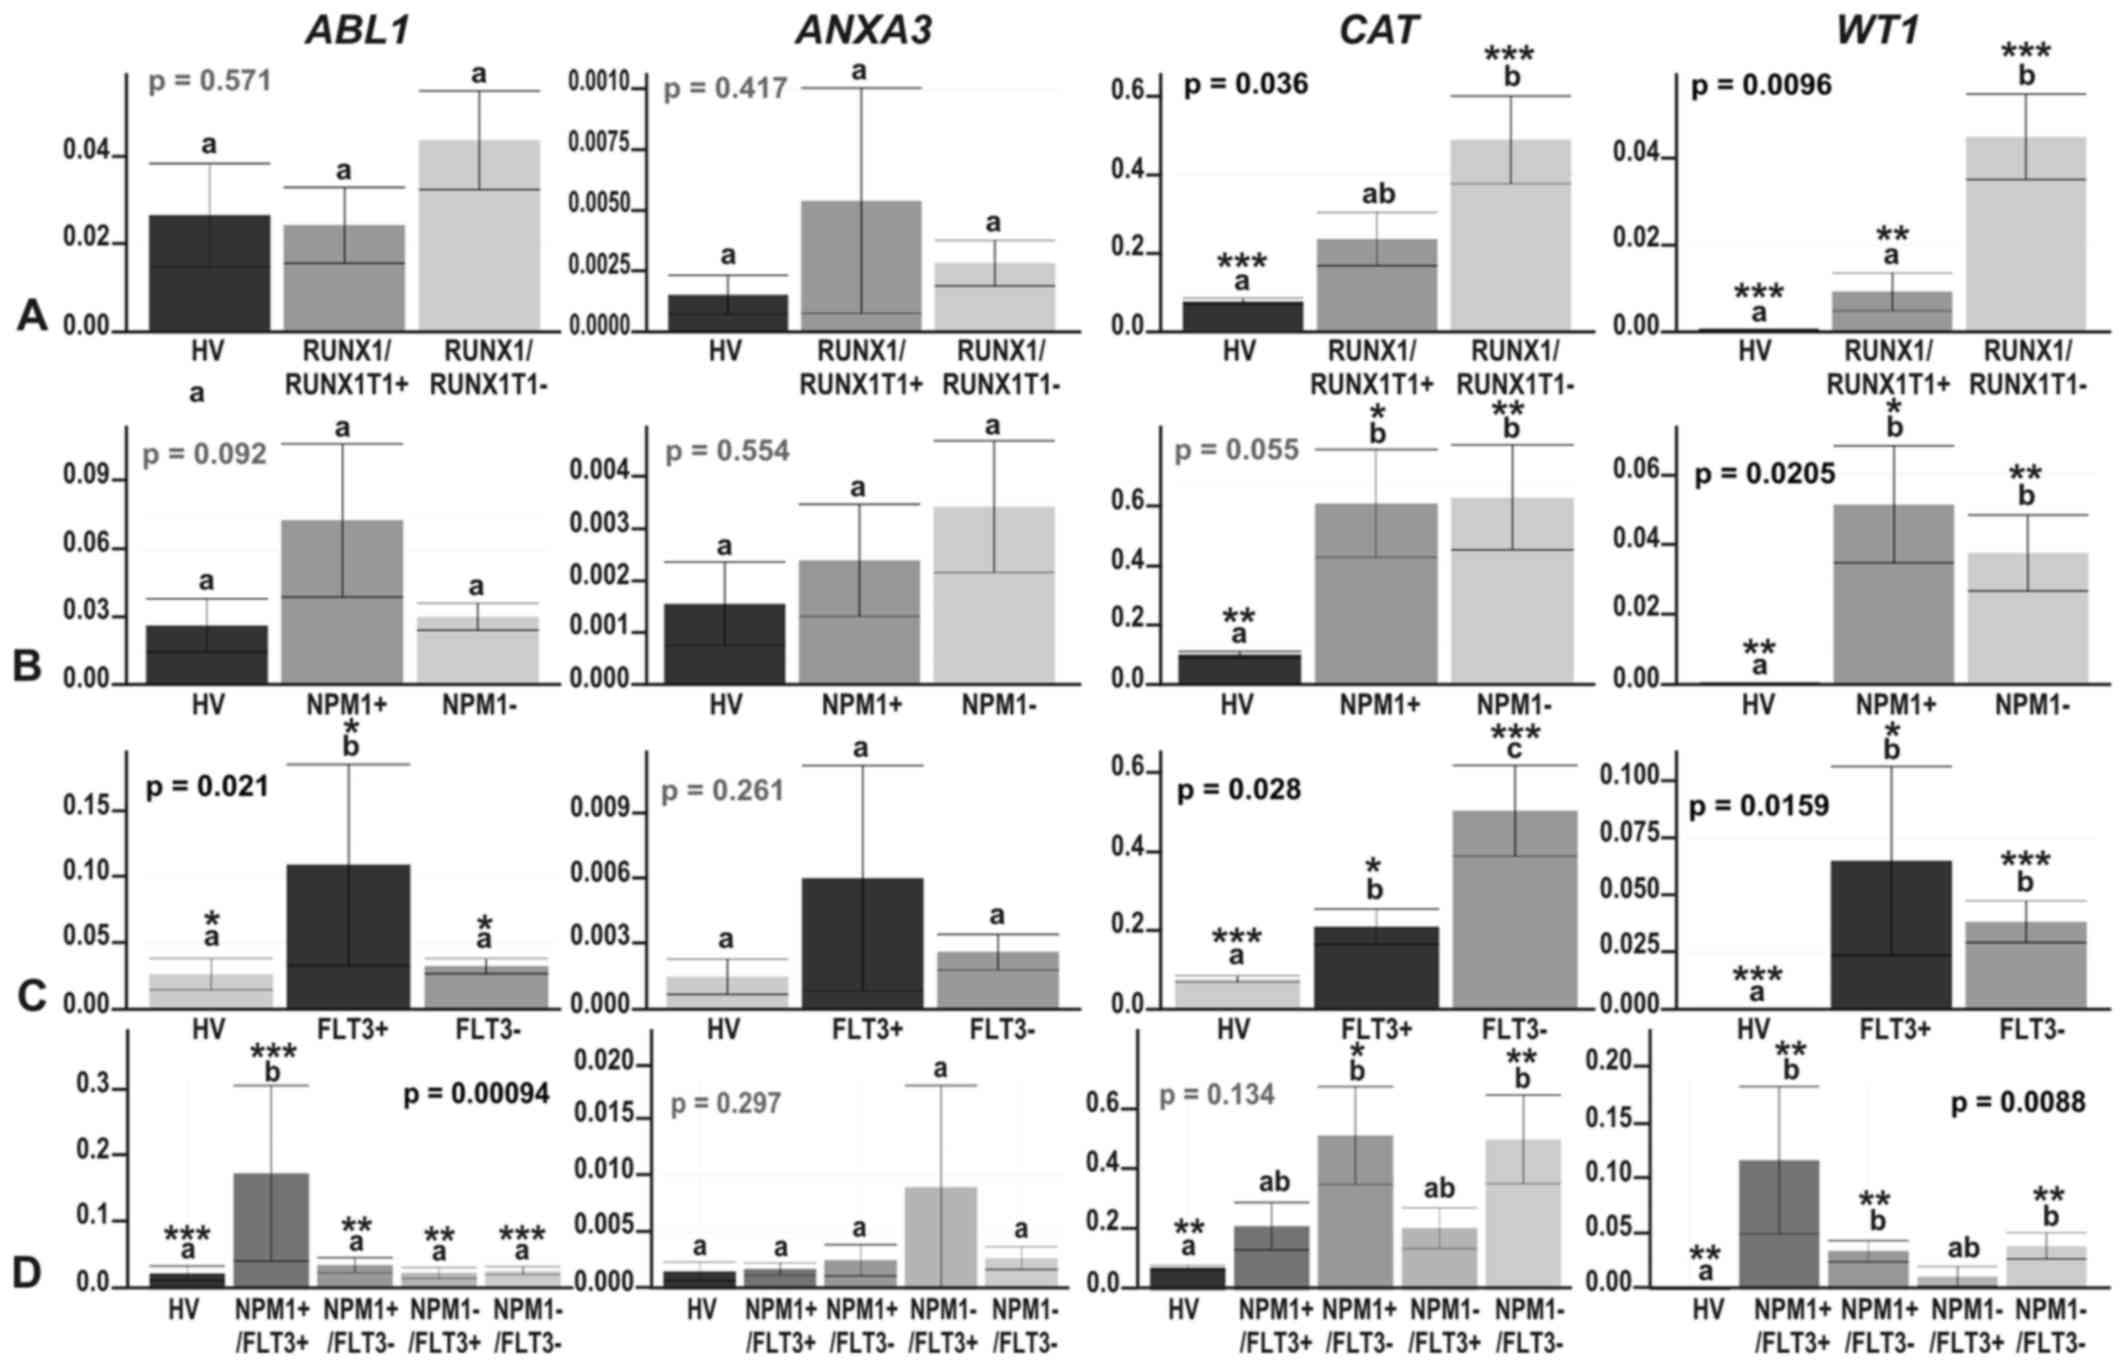
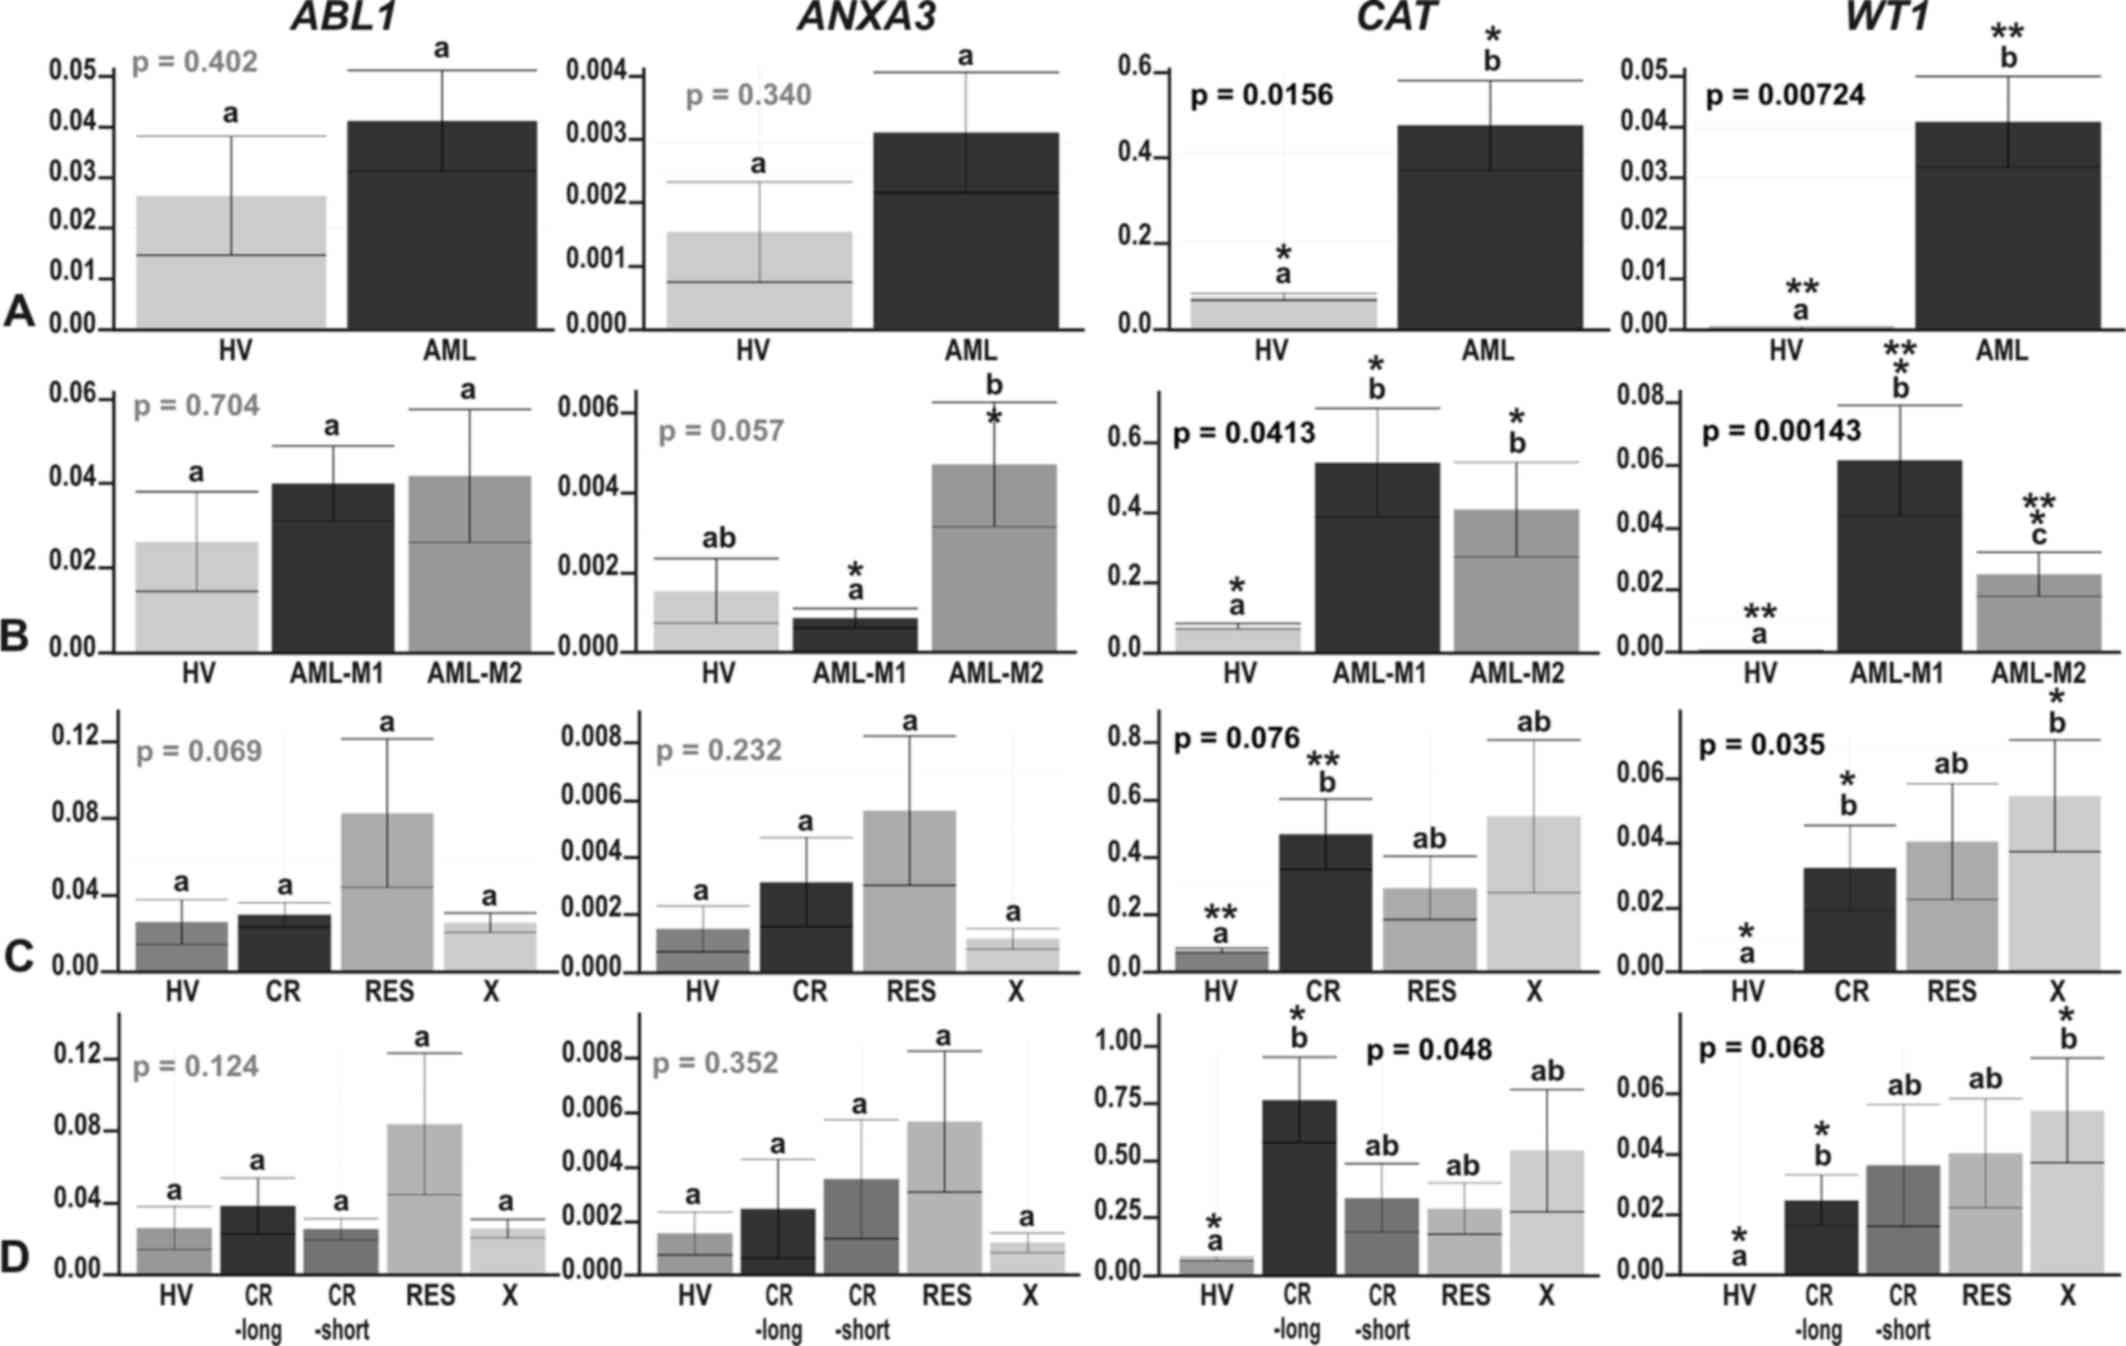 | Figure 5The results of ddPCR-based expression
analysis of 4 genes (ABL1, ANXA3, CAT and
WT1) in (A) acute myeloid leukemia (AML) compared with
healthy volunteers (HV) samples; (B) in the context of the AML
French-American-British (FAB) subtypes, M1 and M2; and in the
context of the response to therapy, with the AML divided into (C) 3
(CR, RES, X) subgroups or (D) 4 subgroups (CR_long, CR_short, RES,
X). The y-axes show relative expression values of a studied gene
compared to a reference gene. Each plot contains the ANOVA p-value
obtained for a whole test. Pair-wise comparisons with statistically
significant differences, verified with a t-test and HSD Tukey test,
are indicated by letters and asterisk symbols above each bar. Bars
showing the same letter indicate no significant difference
(p>0.05). The numbers of asterisks denote the level of
statistical significance: *p≤0.05 and
**p≤0.01. |
Our positive control gene, ABL1, revealed a
trend towards an upregulation in AML, statistically significant in
FLT3- and NPM1-mutated AML vs. HV (HSD Tukey test
p=0.02 for HV vs. FLT3+; HSD Tukey test p=0.0003
for HV vs. NPM1+/FLT3+)
(Fig. 6C and D). ABL1 gene
expression was also significantly upregulated in the
FLT3+ samples when compared with the
FLT3− samples (HSD Tukey test p=0.02) (Fig. 6C) and significantly different in
the following comparisons:
NPM1−/FLT3− vs.
NPM1+/FLT3+ (HSD Tukey test
p=0.0003), NPM1+/FLT3+ vs.
NPM1+/FLT3− (HSD Tukey test
p=0.002) and NPM1+/FLT3+ vs.
NPM1−/FLT3+ (HSD Tukey test
p=0.0097). The ANXA3 gene was generally expressed at a very
low level, with a trend towards overexpression in the AML vs. HV;
however, the greatest increase in ANXA3 expression was
observed in AML-M2 (Fig. 5B). The
only statistically significant difference in the expression of this
gene was observed between AML-M1 and AML-M2 (t-test p=0.023)
(Fig. 5B), what definitively
confirmed the proteomics results. Partially concordant results were
obtained for the CAT gene. In agreement with the proteomics
results, we observed a significant increase in CAT
expression in AML and some AML subgroups compared with HV (Figs. 5 and 6, t-test p=0.0096 for HV vs. AML-M1;
t-test p=0.022 for HV vs. AML-M2; t-test p=0.00085 for HV vs.
RUNX1/RUNX1T1−; p=0.006 for HV vs.
NPM1−; p=0.02 for HV vs. NPM1+;
p=0.00085 for HV vs. FLT3−; t-test p=0.04 for HV
vs. FLT3+; t-test p=0.008 for HV vs.
NPM1−/FLT3−; t-test p=0.03 for
HV vs. NPM1+/FLT3−). We also detected
a significant increase in CAT expression in the
FLT3− compared to the FLT3+
samples (t-test p=0.023). However, the differences in the
CAT gene expression levels between the M1 and M2 AML
subtypes were subtle and not significant (t-test p=0.52), in
contrast to the proteomics findings (Fig. 5B). As regards the response to
therapy, the only statistically significant difference, and the
most elevated CAT expression was observed in the CR and
CR-long AML subgroups (t-test p=0.0044 for HV vs. CR and t-test
p=0.013 for HV vs. CR-long) (Fig. 5C
and D). As regards the WT1 gene, the ddPCR experiment
revealed an evident and statistically significant upregulation of
this gene in all AML subgroups, whereas in the HV samples, its
expression was scarcely detectable (t-test p=0.046–0.000066)
(Figs. 5 and 6). An interesting observation was the
increasing trend in WT1 expression in the therapy-related AML
subgroups: The higher the WT1 level, the less responsive was
AML to therapy (Fig. 5C and D).
High levels of WT1 were also detected in the AML-M1
(Fig. 5B) and AML samples without
the RUNX1/RUNX1T1 mutation (Fig. 6A), but harboring NPM1,
FLT3 or both of these mutations (Fig. 6B–D). The differences across the
particular AML subgroups were not significant, apart from 2
comparisons: AML-M1 vs. AML-M2, where WT1 was upregulated in
AML-M1 (HSD Tukey’s test p= 0.039) (Fig. 5B) and
RUNX1/RUNX1T1+ vs.
RUNX1/RUNX1T1−, where WT1 was upregulated
in AML without translocation t(8;21) (t-test p=0.0023) (Fig. 6A).
Correlations among the molecular and
clinical features of AML
In order to identify links between gene expression
measured by RT-qPCR, the mutation status and the clinical
characteristics of the patients with AML (WBC, age and sex), we
performed a series of statistical tests (t-test, one- and two-way
ANOVA, Tukey multiple comparison of means and Pearson’s
correlation). The strongest correlations were observed between the
WBC counts and the AML FAB subtypes (one-way ANOVA, p=0.0101, WBC
counts were higher in AML-M1), WBC counts and NPM1 mutation
status (one-way ANOVA, p=0.0229), WBC counts and FLT3
mutation status (one-way ANOVA, p=0.0308), and WBC counts and both
FLT3 and NPM1 mutation status (two-way ANOVA,
p=0.0160), and the highest WBC count was observed in mutated AML
samples.
As regards the effects of age, we observed a
moderately positive correlation between patient age and NPM1
gene expression (Pearson’s correlation, 0.348; p=0.1222), a
moderately negative correlation between age and the expression of
the 2 genes, S100A9 (Pearson’s correlation, −0.380;
p=0.0899) and ANXA3 (Pearson’s correlation, −0.33; p=0.046)
and a correlation between age and the mutation status of
NPM1 (one-way ANOVA, p=0.0411) or NPM1 and
FLT3 together (two-way ANOVA, p=0.0446). There were no
correlations between the RT-qPCR-determined expression of any other
gene and age (Pearson’s correlations equal to −0.23, 0.019, 0.15,
0.07 and 0.2 for S100A8, STMN1, ABL1,
CAT and WT1, respectively). We also did not find any
correlations between the gene expression levels and sex (one-way
ANOVA, p-values equal to 0.45, 0.659, 0.286, 0.555, 0.633, 0.302,
0.628 and 0.263 for NPM1, S100A8, S100A9,
STMN1, ABL1, ANXA3, CAT and WT1,
respectively) or WBC count (Pearson’s correlations equal to −0.02,
−0.25, −0.27, −0.02, 0.07, −0.19, −0.18 and 0.28 for NPM1,
S100A8, S100A9, STMN1, ABL1,
ANXA3, CAT and WT1, respectively).
Of note, there was no correlation between
NPM1 gene expression and the NPM1 mutation status
(one-way ANOVA; p=0.634). The presence of the translocation t(8;21)
and fusion gene RUNX1/RUNX1T1 did not correlate with any
molecular or clinical characteristic.
Gene expression database exploration
To compare our results with other AML gene
expression profiling results, we explored the Gene Expression
Omnibus (GEO) database (www.ncbi.nlm.nih.gov/sites/GDSbrowser) to identify
the most relevant datasets. We selected 7 datasets, including 6
derived from Affymetrix Gene Chips, the most commonly used
microarray platform, and one from Agilent microarrays. Among these
datasets, only 3 (GDS3057, GDS1059 and GDS2251) contained healthy
control samples. These 3 datasets were screened with 238 names of
genes, which we had identified as differentially expressed between
AML (or particular AML subgroups) and HV by using the AML-array,
RT-qPCR and proteomics. Table VI
shows the results of comparative analysis. The percentage of genes
with an expression trend concordant in our data and any GEO
dataset, was in the range 47.8–51.9% (mean, 49.2%) or in the range
51.8–78.3% (mean, 65.3%), when including partially concordant
genes, for which expression trends were concordant for some (but
not all) conditions/cell lines/microarray probes. Interestingly,
the level of coincidence between GEO datasets was much lower: The
percentage of concordant genes remained in the range 35.3–43.4%
(mean, 39.3%) or in the range 47.4–64.2% (mean, 56.6%), when
including partially concordant genes. In reference to discordant
genes, an opposite effect could be observed, although the
difference was smaller: The percentage of discordant genes in
comparative analysis between our data and any GEO data set was in
the range 15.5–31.3% (mean, 22.8%) while within GEO datasets in the
range 10.0–27.1% (mean, 19.3%). Analyzing 238 gene expression
trends, we were able to select 45 strong candidate genes with
expression trends concordant in our dataset and all 3 GEO datasets.
In total, 26 genes (ABCF1, ABL1, AK2,
ANGPT1, BCR, CD34, CDK6, CEBPA,
HOXA10, HSP90AB1, HSPA8, HSPA9,
IGFBP7, MAP7, MCM5, MT1H, MYB,
NPM1, RBBP4, RPLP0, SET,
SLC25A1, SMAD3, STMN1, TRAF4 and
WT1) were consequently increased in AML when compared to the
normal control, whereas 19 were decreased in AML (BTG1,
CEBPB, CSF3R, CX3CR1, CYBB,
FCER1G, FCN1, HCK, IGHM, LCP1,
LGALS3, LYZ, PF4, S100A8,
S100A9, STAT5B, STK4, TMSB4X and
TRADD). The above-mentioned list contained 14 (10 increased
and 4 decreased) from the 23 genes presented in Fig. 1B, identified as the genes with the
highest expression fold change in AML-array-based analysis, and one
gene (RBBP4) identified in our data only by proteomic
approach. Not all of these genes were up-to-date described as AML
biomarkers. It is also worth mentioning that 2 members of the
CCAAT/enhancer binding protein family of transcription factors,
CEBPA and CEBPB, exhibited opposite expression trends
in all studied datasets.
| Table VIThe results of comparative analysis
of our data and 3 GEO datasets. |
Table VI
The results of comparative analysis
of our data and 3 GEO datasets.
| Dataset | Our data | GDS3057 | GDS1059 | GDS2251 |
|---|
| Our data | | 47.8 (51.8) | 51.9 (59.8) | 47.8 (78.3) |
| GDS3057 | 15.5 | | 43.3 (47.4) | 39.3 (58.1) |
| GDS1059 | 31.3 | 20.9 | | 35.3 (64.2) |
| GDS2251 | 21.7 | 10.0 | 27.1 | |
As regards FAB subtypes, we analyzed the expression
trends of 6 genes, including 5 genes encoding proteins determined
as differentially accumulated between AML-M1 and AML-M2 by
proteomic approach (ANXA3, CAT, LCP1,
PGD and PRDX6) (33)
and one gene identified with ddPCR (WT1). In comparison to
the GDS1064 dataset, referring to AML in different stages of
maturation, we observed concordant results for only 2 genes (33%),
WT1 and ANXA3, the only 1 gene out of 5 selected by
proteomic approach.
Discussion
Taking advantage of genomic tools, tremendous
progress in the molecular studies of AML has been achieved
(16,41). Although many studies have already
been published in this area, to the best of our knowledge, our
research is the first transcriptomics analysis of the Polish adult
AML population. Moreover, for the same group of patients, a
proteomics analysis has also been performed (33). The number of samples was not high;
however, the advantage was the preselection of the M1 and M2 FAB
subtypes and a significant enrichment in CN-AML samples. Previous
microarray-based AML analyses have often included more subtypes,
but fewer patients. The present study is also one of the few
reports of custom-made array applications in AML studies.
The majority of AML research has been conducted
with the use of Affymetrix Gene Chips (19,22,42–44),
and some studies have been conducted with large cDNA microarrays
(21,45,46).
Both platforms utilize arrays constructed from probes corresponding
to at least several thousand genes. The advantages of boutique
arrays are their lower price, higher flexibility and smaller
laboratory infrastructure requirements. Comparative analysis of our
results with the results of 3 other gene expression studies based
on Affymetrix Gene Chips, proved the utility and reliability of the
AML-array. The level of concordance was even higher for our results
and any GEO dataset than between GEO datasets. However, we still
observed discordant results for ~20% of genes, irrespectively of
the datasets compared. There are 3 main reasons for this
discrepancy: Different patients, different laboratories, and
varying numbers of samples, all of which contribute to technical
and biological bias.
The application of the boutique array presented
herein enabled us to identify a set of genes differentiating AML
and HV. However, we were not able to detect statistically
significant differences between AML subgroups. The lack of success
can be explained by a few factors: The method was not effective
enough, the studied samples were not an accurate representation of
the population, or the sample size was not sufficient. The
limitation of the method is a pre-selected set of genes, which
could be not adequate to distinguish between particular AML
subgroups. Home-made microarray production could also contribute to
more technical bias comparing to commercial gene chips. Based on
our experience with microarray design, production, hybridization
and data normalization, we performed many technical replicates,
carefully inspected microarray images and filtered out all slides
which did not respect quality criteria. As regards patients with
AML, we did not apply additional selection criteria; we included
all AML patients classified as M1 or M2 FAB subtypes at the time of
our project. Unsupervised clustering revealed that the AML
subpopulation was generally homogenous. In addition, some of the
studied AML subgroups were represented by only a few samples, and
thus statistical significance was more difficult to achieve.
Probably, a substantial increase in the sample size could overcome
this problem. Taking into account the above-mentioned limitations,
we consider that microarray-based analysis should be always treated
as a first-line screening tool. When precise gene expression
measurements are needed, RT-qPCR, in particular its more
sophisticated version, ddPCR, is more reliable.
Among the genes overexpressed in AML in the
presented AML-array-based study, there were already-established AML
markers, e.g., KIT, MYH11, MN1, MPO,
SET and HOXA10 (44,47,48),
genes associated with AML or potential biomarkers, such as
STMN1, CDK6 and ANGPT1, or genes not yet
discussed in the context of AML, such as RPLP0 or
ENO1, reported in neoplasms other than leukemia (49,50).
As these genes often play fundamental roles in cell metabolism and
function, their upregulation may be explained by the needs of the
highly proliferating cancer cells. The STMN1 gene, which
encodes stathmin 1, formerly known as oncoprotein 18 (Op18), was
the most significantly overexpressed gene that we observed in AML.
The upregulation of this gene, confirmed by real-time PCR, is
consistent with the results of other gene expression studies.
STMN1, highly expressed in acute leukemias, lymphomas and
intensively proliferating cells (51,52)
and decreased after the induction of cell differentiation (53), is a good AML biomarker candidate
and potential therapeutic target. Other possible candidates are
CDK6, which encodes one of the cyclin dependent kinase and
cell cycle regulators and prevents differentiation and apoptosis
(54), and ANGPT1, which
encodes a proangiogenic protein abundant in AML (55) and early myeloblast cell lines
(56).
Similarly, the suppression of numerous genes in the
AML samples detected with the AML-microarray was consistent with
data in the literature. The examples are PF4, which is among
the 10 hematopoietic-specific genes found to be significantly
downregulated in CD34+ cells obtained from
patients with therapy-related AML (57), or TMSB4X, which encodes
thymosin β4 and is a regulator of actin polymerization, cell
proliferation, migration and differentiation. As TMSB4X
expression was higher in the lymphoid than the granulocytic
lineage, and its transcript levels increased during granulocyte
maturation, it has been proposed to be a marker of differentiation
in hematopoietic cells (58). For
some genes, such as FCN1, which encodes ficolin 1 and was
the second most downregulated gene in AML in our microarray
experiment, we did not find any reports associating its gene
function with AML. The role of this gene may therefore be the
subject of further studies.
From a diagnostic point of view, it is important to
correlate gene expression with the classes and types of a disease.
For example, the distinction between M1 and M2, the two most
frequent and closely related AML FAB subtypes, is challenging.
Microarray analyses of AML usually result in the clear separation
of AML M3 (APL) and AML with the most frequent cytogenetic
aberrations (42,21,22).
The M4 subtype has additionally been distinguished by (43) and (21), whereas the M0-M2 subtypes are
usually indistinguishable (43).
By analyzing the AML-M1 and M2 proteomes, we succeeded in
determining five proteins with higher accumulation levels in AML M2
(33). For three of those proteins
(catalase, Annexin 3 and L-plastin) we had gene-specific probes on
the AML-array, but none of the genes were differentially expressed
between the M1 and M2 FAB subtypes. However, with the use of ddPCR,
one of the most sensitive types of quantitative PCR, we
demonstrated that ANXA3 expression, despite being generally
low and not detectable in all samples, was definitely higher in M2
compared with M1 as well as HV. These results prove the usefulness
of Annexin 3 as a potential biomarker at both the protein and
transcript levels. In the case of 4 other proteins, inconsistent
results were found both in our data and GEO data, what implicates
utility of these markers only at the protein level. This
inconsistency may be explained by the following: Gene expression is
not exclusively regulated by transcription; instead, the abundance
of proteins is predominantly controlled at the translational level
(59). The lifetimes of the
proteins and corresponding transcripts vary due to different
synthesis and degradation rates, moreover, from one transcript more
than one protein isoform can be synthesized through alternative
splicing and posttranslational modifications. Vogel and Marcotte
(60) claimed that only ~40% of
the protein concentration variation is determined by mRNA
abundance. Weak correlation or a lack of correlation between gene
expression in the same cells or tissues has also been demonstrated
by (61,62).
The presented RT-qPCR-based analyses enabled the
identification of 2 other genes with statistically significant
differential expression between the M1 and M2 FAB subtypes:
S100A9 and WT1, which were decreased and increased in
AML-M1, respectively. WT1 overexpression in AML-M1 compared
with -M2 is consistent with the observation that the expression of
Wilms’ tumor gene is limited to immature leukemias and inversely
correlates with cell differentiation (63). As regards the S100A genes,
which encode calcium binding proteins implicated in cell cycle
regulation, cell differentiation, growth, inflammation and
progression of cancer, the data in the literature are
contradictory. The upregulation of S100A8 and S100A9
has been reported in many solid tumor types (64,65)
and in the late myeloblast and monoblast leukemic cell lines
(56); their downregulation has
been reported in childhood AML (E-GEOD-2191). Our data indicated a
high variance of S100A gene expression within the AML
samples. Similar conclusions can be drawn from the results obtained
by (21), in which NK-AML samples
clustered into 2 major subgroups; one associated with very high
expression of the S100A9 gene and the second associated with
very low expression. In agreement with our results, the majority of
the AML-M1 samples had low expression levels of S100A9.
Whole-genome analyses of AML have enabled the
determination of gene expression signatures specific for AML
subgroups harboring the most frequent mutations (24,21).
With the use of AML-array, we were able to identify only one gene
that exhibited a statistically significant difference in the
expression level between AML samples, which was CPA3,
encoding mast cell carboxypeptidase A3. This gene, whose expression
was 16-fold higher in the FLT3+/NPM1+
samples compared with the remaining AML, has also been identified
by (66) as the fourth most
upregulated gene in the comparison between FLT3-ITD and
FLT3-wt in older AML patients. Our RT-qPCR analyses of the
AML samples also revealed significantly increased levels of 4 other
genes: STMN1 in FLT3+/NPM1−
samples, ABL1 in FLT3+ and
FLT3+/NPM1+ AML samples, CAT in
FLT3− AML samples and the WT1 gene in
FLT3+/NPM1+ AML. The WT1
expression pattern is consistent with the results of the study by
Whitman et al (66), who
reported WT1 as one of the most upregulated genes in AML
with FLT3-ITD compared with wild-type AML. In contrast to
the upregulation of CAT in FLT3− AML
described herein, other authors have linked the elevated expression
of this gene to the presence of FLT3-ITD (22,66).
The association of the STMN1 and ABL1 genes with the
FLT3 and NPM1 mutations has not yet been
discussed.
While analyzing therapy-related AML subgroups, we
observed differential expression in only two genes by using ddPCR:
CAT and WT1. CAT exhibited the highest
expression in the CR-long group, whereas WT1 was gradually
increased with the resistance to AML treatment. The results
obtained for catalase remain consistent with the described catalase
downregulation in the doxorubicin-resistant AML subline (67). High expression of the WT1
gene, the postulated tumor suppressor, has been described in
lymphomas and leukemias (68). The
correlation of WT1 expression and AML prognosis has also
been reported (39,40).
In conclusion, the present study demonstrates that
a small AML-dedicated array, designed and generated in our
laboratory, despite some limitations, is suitable for preliminary
gene expression studies of AML. Although many of the genes
identified with the use of AML-array, are confirmed in the
literature, we show that some genes encoding basic metabolism
proteins (e.g., RPLP0, ENO1, GAPDH,
PDE3B, PKM and FCN1), may also contribute to
leukemogenesis, though were not yet discussed in this context. The
raw data were deposited in publically available repository and can
be downloaded and re-analyzed by any researcher. Despite the lack
of success in distinguishing between particular AML subgroups,
AML-array can be potentially applied at the stage of first
diagnosis of AML based on gene expression profile. It can also be
modified to elaborate an improved array version with better rate of
diagnostic and prognostic success. However, for more accurate
transcript measurement, quantitative PCR approaches, in particular
ddPCR, are more appropriate. Application of this strategy enabled
us to obtain results valuable form the diagnostic and prognostic
point of view. We identified three genes (S100A9,
ANXA3 and WT1), whose expression levels can be used
for discrimination between two AML FAB subtypes, M1 and M2, which
are usually difficult to distinguish. We showed for the first time
relationship of the STMN1 and ABL1 genes with the
FLT3 and NPM1 mutation status, and correlation of
high CAT expression with positive response to AML
treatment.
Abbreviations:
|
AML
|
acute myeloid leukemia
|
|
CN-AML
|
cytogenetically normal AML
|
|
ddPCR
|
droplet digital PCR
|
|
FAB
|
French-American-British
(classification of leukemia)
|
|
PCR
|
polymerase chain reaction
|
Acknowledgments
This study was financially supported by the Polish
Ministry of Science and Higher Education (grant no.
PBZ_MniI-2/1/2005). This study was also supported by the Polish
Ministry of Science and Higher Education under the SPUB (no.
5536/E-63/SPUB/2015) and KNOW programs. We are grateful to Dr
Marcin Schmidt from the Poznan University of Life Sciences for
providing the HL60 cells. We would also like to thank Dr Joanna
Zyprych-Walczak, Dr Alicja Szabelska-Beręsewicz and Professor Idzi
Siatkowski from Poznan University of Life Sciences for their
assistance with microarray data normalization.
Notes
[1] Competing
interests
The authors declare that they have no competing
interests.
References
|
1
|
Estey E and Döhner H: Acute myeloid
leukaemia. Lancet. 368:1894–1907. 2006. View Article : Google Scholar : PubMed/NCBI
|
|
2
|
Döhner H, Estey EH, Amadori S, Appelbaum
FR, Büchner T, Burnett AK, Dombret H, Fenaux P, Grimwade D, Larson
RA, et al European LeukemiaNet: Diagnosis and management of acute
myeloid leukemia in adults: Recommendations from an international
expert panel, on behalf of the European LeukemiaNet. Blood.
115:453–474. 2010. View Article : Google Scholar
|
|
3
|
Bennett JM, Catovsky D, Daniel MT,
Flandrin G, Galton DA, Gralnick HR and Sultan C: Proposed revised
criteria for the classification of acute myeloid leukemia. A report
of the French-American-British Cooperative Group. Ann Intern Med.
103:620–625. 1985. View Article : Google Scholar : PubMed/NCBI
|
|
4
|
Vardiman JW, Thiele J, Arber DA, Brunning
RD, Borowitz MJ, Porwit A, Harris NL, Le Beau MM,
Hellström-Lindberg E, Tefferi A, et al: The 2008 revision of the
World Health Organization (WHO) classification of myeloid neoplasms
and acute leukemia: Rationale and important changes. Blood.
114:937–951. 2009. View Article : Google Scholar : PubMed/NCBI
|
|
5
|
Döhner H: Implication of the molecular
characterization of acute myeloid leukemia. Hematology Am Soc
Hematol Educ Program Washington, DC: pp. 412–419. 2007
|
|
6
|
Grimwade D and Hills RK: Independent
prognostic factors for AML outcome. Hematology Am Soc Hematol Educ
Program Washington, DC: pp. 385–395. 2009
|
|
7
|
Falini B: Acute myeloid leukemia with
mutated nucleophosmin (NPM1): Molecular, pathological, and clinical
features. Cancer Treat Res. 145:149–168. 2010. View Article : Google Scholar
|
|
8
|
Nakao M, Yokota S, Iwai T, Kaneko H,
Horiike S, Kashima K, Sonoda Y, Fujimoto T and Misawa S: Internal
tandem duplication of the flt3 gene found in acute myeloid
leukemia. Leukemia. 10:1911–1918. 1996.PubMed/NCBI
|
|
9
|
Lin LI, Chen CY, Lin DT, Tsay W, Tang JL,
Yeh YC, Shen HL, Su FH, Yao M, Huang SY, et al: Characterization of
CEBPA mutations in acute myeloid leukemia: Most patients with CEBPA
mutations have biallelic mutations and show a distinct
immunophenotype of the leukemic cells. Clin Cancer Res.
11:1372–1379. 2005. View Article : Google Scholar : PubMed/NCBI
|
|
10
|
Care RS, Valk PJ, Goodeve AC, Abu-Duhier
FM, Geertsma-Kleinekoort WM, Wilson GA, Gari MA, Peake IR,
Löwenberg B and Reilly JT: Incidence and prognosis of c-KIT and
FLT3 mutations in core binding factor (CBF) acute myeloid
leukaemias. Br J Haematol. 121:775–777. 2003. View Article : Google Scholar : PubMed/NCBI
|
|
11
|
Tyner JW, Erickson H, Deininger MWN,
Willis SG, Eide CA, Levine RL, Heinrich MC, Gattermann N, Gilliland
DG, Druker BJ, et al: High-throughput sequencing screen reveals
novel, transforming RAS mutations in myeloid leukemia patients.
Blood. 113:1749–1755. 2009. View Article : Google Scholar :
|
|
12
|
Delhommeau F, Dupont S, Della Valle V,
James C, Trannoy S, Massé A, Kosmider O, Le Couedic JP, Robert F,
Alberdi A, et al: Mutation in TET2 in myeloid cancers. N Engl J
Med. 360:2289–2301. 2009. View Article : Google Scholar : PubMed/NCBI
|
|
13
|
Ley TJ, Ding L, Walter MJ, McLellan MD,
Lamprecht T, Larson DE, Kandoth C, Payton JE, Baty J, Welch J, et
al: DNMT3A mutations in acute myeloid leukemia. N Engl J Med.
363:2424–2433. 2010. View Article : Google Scholar : PubMed/NCBI
|
|
14
|
Aref S, Kamel Areida S, Abdel Aaal MF,
Adam OM, El-Ghonemy MS, El-Baiomy MA and Zeid TA: Prevalence and
clinical effect of IDH1 and IDH2 mutations among cytogenetically
normal acute myeloid leukemia patients. Clin Lymphoma Myeloma Leuk.
15:550–555. 2015. View Article : Google Scholar : PubMed/NCBI
|
|
15
|
Mrózek K, Marcucci G, Paschka P, Whitman
SP and Bloomfield CD: Clinical relevance of mutations and
gene-expression changes in adult acute myeloid leukemia with normal
cytogenetics: Are we ready for a prognostically prioritized
molecular classification? Blood. 109:431–448. 2007. View Article : Google Scholar
|
|
16
|
Bacher U, Kohlmann A and Haferlach T: Gene
expression profiling for diagnosis and therapy in acute leukaemia
and other haematologic malignancies. Cancer Treat Rev. 36:637–646.
2010. View Article : Google Scholar : PubMed/NCBI
|
|
17
|
Riva L, Luzi L and Pelicci PG: Genomics of
acute myeloid leukemia: The next generation. Front Oncol. 2:402012.
View Article : Google Scholar : PubMed/NCBI
|
|
18
|
Kohlmann A, Grossmann V, Nadarajah N and
Haferlach T: Next-generation sequencing - feasibility and
practicality in haematology. Br J Haematol. 160:736–753. 2013.
View Article : Google Scholar : PubMed/NCBI
|
|
19
|
Golub TR, Slonim DK, Tamayo P, Huard C,
Gaasenbeek M, Mesirov JP, Coller H, Loh ML, Downing JR, Caligiuri
MA, et al: Molecular classification of cancer: Class discovery and
class prediction by gene expression monitoring. Science.
286:531–537. 1999. View Article : Google Scholar : PubMed/NCBI
|
|
20
|
Alizadeh A, Eisen M, Davis RE, Ma C, Sabet
H, Tran T, Powell JI, Yang L, Marti GE, Moore DT, et al: The
lymphochip: A specialized cDNA microarray for the genomic-scale
analysis of gene expression in normal and malignant lymphocytes.
Cold Spring Harb Symp Quant Biol. 64:71–78. 1999. View Article : Google Scholar
|
|
21
|
Bullinger L, Döhner K, Bair E, Fröhling S,
Schlenk RF, Tibshirani R, Döhner H and Pollack JR: Use of
gene-expression profiling to identify prognostic subclasses in
adult acute myeloid leukemia. N Engl J Med. 350:1605–1616. 2004.
View Article : Google Scholar : PubMed/NCBI
|
|
22
|
Valk PJ, Verhaak RG, Beijen MA, Erpelinck
CAJ, Barjesteh van Waalwijk van Doorn-Khosrovani S, Boer JM,
Beverloo HB, Moorhouse MJ, van der Spek PJ, Löwenberg B, et al:
Prognostically useful gene-expression profiles in acute myeloid
leukemia. N Engl J Med. 350:1617–1628. 2004. View Article : Google Scholar : PubMed/NCBI
|
|
23
|
Bacher U, Kohlmann A, Haferlach C and
Haferlach T: Gene expression profiling in acute myeloid leukaemia
(AML). Best Pract Res Clin Haematol. 22:169–180. 2009. View Article : Google Scholar : PubMed/NCBI
|
|
24
|
Alcalay M, Tiacci E, Bergomas R, Bigerna
B, Venturini E, Minardi SP, Meani N, Diverio D, Bernard L, Tizzoni
L, et al: Acute myeloid leukemia bearing cytoplasmic nucleophosmin
(NPMc+ AML) shows a distinct gene expression profile
characterized by up-regulation of genes involved in stem-cell
maintenance. Blood. 106:899–902. 2005. View Article : Google Scholar : PubMed/NCBI
|
|
25
|
Huang L, Zhou K, Yang Y, Shang Z, Wang J,
Wang D, Wang N, Xu D and Zhou J: FLT3-ITD-associated
gene-expression signatures in NPM1-mutated cytogenetically normal
acute myeloid leukemia. Int J Hematol. 96:234–240. 2012. View Article : Google Scholar : PubMed/NCBI
|
|
26
|
Radmacher MD, Marcucci G, Ruppert AS,
Mrózek K, Whitman SP, Vardiman JW, Paschka P, Vukosavljevic T,
Baldus CD, Kolitz JE, et al Cancer and Leukemia Group B:
Independent confirmation of a prognostic gene-expression signature
in adult acute myeloid leukemia with a normal karyotype: A Cancer
and Leukemia Group B study. Blood. 108:1677–1683. 2006. View Article : Google Scholar : PubMed/NCBI
|
|
27
|
Wilson CS, Davidson GS, Martin SB, Andries
E, Potter J, Harvey R, Ar K, Xu Y, Kopecky KJ, Ankerst DP, et al:
Gene expression profiling of adult acute myeloid leukemia
identifies novel biologic clusters for risk classification and
outcome prediction. Blood. 108:685–696. 2006. View Article : Google Scholar : PubMed/NCBI
|
|
28
|
Marcinkowska-Swojak M, Handschuh L,
Wojciechowski P, Goralski M, Tomaszewski K, Kazmierczak M,
Lewandowski K, Komarnicki M, Blazewicz J, Figlerowicz M, et al:
Simultaneous detection of mutations and copy number variation of
NPM1 in the acute myeloid leukemia using multiplex
ligation-dependent probe amplification. Mutat Res. 786:14–26. 2016.
View Article : Google Scholar : PubMed/NCBI
|
|
29
|
Oshlack A, Emslie D, Corcoran LM and Smyth
GK: Normalization of boutique two-color microarrays with a high
proportion of differentially expressed probes. Genome Biol.
8:R22007. View Article : Google Scholar : PubMed/NCBI
|
|
30
|
Uszczyńska B, Zyprych-Walczak J, Handschuh
L, Szabelska A, Kaźmierczak M, Woronowicz W, Kozłowski P, Sikorski
MM, Komarnicki M, Siatkowski I, et al: Analysis of boutique arrays:
A universal method for the selection of the optimal data
normalization procedure. Int J Mol Med. 32:668–684. 2013.
View Article : Google Scholar
|
|
31
|
Wenne R, Handschuh L, Pocwierz-Kotus A,
Urbaniak R, Formanowicz P, Całkiewicz J, Brzozowska K, Figlerowicz
M, Węgrzyn G and Wróbel B: The application of microarray technology
to the identification of Tc1-like element sequences in fish
genomes. Mar Biol Res. 7:466–477. 2011. View Article : Google Scholar
|
|
32
|
Zmieńko A, Guzowska-Nowowiejska M,
Urbaniak R, Pląder W, Formanowicz P and Figlerowicz M: A tiling
microarray for global analysis of chloroplast genome expression in
cucumber and other plants. Plant Methods. 7:292011. View Article : Google Scholar
|
|
33
|
Luczak M, Kaźmierczak M, Handschuh L,
Lewandowski K, Komarnicki M and Figlerowicz M: Comparative proteome
analysis of acute myeloid leukemia with and without maturation. J
Proteomics. 75:5734–5748. 2012. View Article : Google Scholar : PubMed/NCBI
|
|
34
|
Kaźmierczak M, Luczak M, Lewandowski K,
Handschuh L, Czyż A, Jarmuż M, Gniot M, Michalak M, Figlerowicz M
and Komarnicki M: Esterase D and gamma 1 actin level might predict
results of induction therapy in patients with acute myeloid
leukemia without and with maturation. Med Oncol. 30:7252013.
View Article : Google Scholar
|
|
35
|
Ley TJ, Miller C, Ding L, Raphael BJ,
Mungall AJ, Robertson A, Hoadley K, Triche TJ Jr, Laird PW, Baty
JD, et al Cancer Genome Atlas Research Network: Genomic and
epigenomic landscapes of adult de novo acute myeloid leukemia. N
Engl J Med. 368:2059–2074. 2013. View Article : Google Scholar : PubMed/NCBI
|
|
36
|
Smyth GK: Limma: linear models for
microarray data. Bioinformatics and Computational Biology Solutions
using R and Bioconductor. Gentleman R, Carey V, Dudoit S, Irizarry
R and Huber W: Springer; New York, NY: pp. 397–420. 2005,
View Article : Google Scholar
|
|
37
|
Benjamini Y and Hochberg Y: Controlling
the False Discovery Rate: A Practical and Powerful Approach to
Multiple Testing. J R Stat Soc B. 57:289–300. 1995.
|
|
38
|
Huang W, Sherman BT and Lempicki RA:
Systematic and integrative analysis of large gene lists using DAVID
bioinformatics resources. Nat Protoc. 4:44–57. 2009. View Article : Google Scholar
|
|
39
|
Bergmann L, Miething C, Maurer U, Brieger
J, Karakas T, Weidmann E and Hoelzer D: High levels of Wilms’ tumor
gene (wt1) mRNA in acute myeloid leukemias are associated with a
worse long-term outcome. Blood. 90:1217–1225. 1997.PubMed/NCBI
|
|
40
|
Lyu X, Xin Y, Mi R, Ding J, Wang X, Hu J,
Fan R, Wei X, Song Y and Zhao RY: Overexpression of Wilms tumor 1
gene as a negative prognostic indicator in acute myeloid leukemia.
PLoS One. 9:e924702014. View Article : Google Scholar : PubMed/NCBI
|
|
41
|
Wouters BJ, Löwenberg B and Delwel R: A
decade of genome-wide gene expression profiling in acute myeloid
leukemia: Flashback and prospects. Blood. 113:291–298. 2009.
View Article : Google Scholar :
|
|
42
|
Haferlach T, Kohlmann A, Schnittger S,
Dugas M, Hiddemann W, Kern W and Schoch C: Global approach to the
diagnosis of leukemia using gene expression profiling. Blood.
106:1189–1198. 2005. View Article : Google Scholar : PubMed/NCBI
|
|
43
|
Payton JE, Grieselhuber NR, Chang L-W,
Murakami M, Geiss GK, Link DC, Nagarajan R, Watson MA and Ley TJ:
High throughput digital quantification of mRNA abundance in primary
human acute myeloid leukemia samples. J Clin Invest. 119:1714–1726.
2009. View Article : Google Scholar : PubMed/NCBI
|
|
44
|
Gutiérrez NC, López-Pérez R, Hernández JM,
Isidro I, González B, Delgado M, Fermiñán E, García JL, Vázquez L,
González M, et al: Gene expression profile reveals deregulation of
genes with relevant functions in the different subclasses of acute
myeloid leukemia. Leukemia. 19:402–409. 2005. View Article : Google Scholar : PubMed/NCBI
|
|
45
|
Andersson A, Edén P, Lindgren D, Nilsson
J, Lassen C, Heldrup J, Fontes M, Borg A, Mitelman F, Johansson B,
et al: Gene expression profiling of leukemic cell lines reveals
conserved molecular signatures among subtypes with specific genetic
aberrations. Leukemia. 19:1042–1050. 2005. View Article : Google Scholar : PubMed/NCBI
|
|
46
|
Park MH, Cho SA, Yoo KH, Yang MH, Ahn JY,
Lee HS, Lee KE, Mun YC, Cho DH, Seong CM, et al: Gene expression
profile related to prognosis of acute myeloid leukemia. Oncol Rep.
18:1395–1402. 2007.PubMed/NCBI
|
|
47
|
Tominaga-Sato S, Tsushima H, Ando K,
Itonaga H, Imaizumi Y, Imanishi D, Iwanaga M, Taguchi J, Fukushima
T, Yoshida S, et al: Expression of myeloperoxidase and gene
mutations in AML patients with normal karyotype: Double CEBPA
mutations are associated with high percentage of MPO positivity in
leukemic blasts. Int J Hematol. 94:81–89. 2011. View Article : Google Scholar : PubMed/NCBI
|
|
48
|
Cristóbal I, Garcia-Orti L, Cirauqui C,
Cortes-Lavaud X, García-Sánchez MA, Calasanz MJ and Odero MD:
Overexpression of SET is a recurrent event associated with poor
outcome and contributes to protein phosphatase 2A inhibition in
acute myeloid leukemia. Haematologica. 97:543–550. 2012. View Article : Google Scholar :
|
|
49
|
Artero-Castro A, Castellvi J, García A,
Hernández J, Ramón y Cajal S and Lleonart ME: Expression of the
ribosomal proteins Rplp0, Rplp1, and Rplp2 in gynecologic tumors.
Hum Pathol. 42:194–203. 2011. View Article : Google Scholar
|
|
50
|
Tsai ST, Chien IH, Shen WH, Kuo YZ, Jin
YT, Wong TY, Hsiao JR, Wang HP, Shih NY and Wu LW: ENO1, a
potential prognostic head and neck cancer marker, promotes
transformation partly via chemokine CCL20 induction. Eur J Cancer.
46:1712–1723. 2010. View Article : Google Scholar : PubMed/NCBI
|
|
51
|
Rowlands DC, Williams A, Jones NA, Guest
SS, Reynolds GM, Barber PC and Brown G: Stathmin expression is a
feature of proliferating cells of most, if not all, cell lineages.
Lab Invest. 72:100–113. 1995.PubMed/NCBI
|
|
52
|
Roos G, Brattsand G, Landberg G, Marklund
U and Gullberg M: Expression of oncoprotein 18 in human leukemias
and lymphomas. Leukemia. 7:1538–1546. 1993.PubMed/NCBI
|
|
53
|
Johnson WE, Jones NA, Rowlands DC,
Williams A, Guest SS and Brown G: Down-regulation but not
phosphorylation of stathmin is associated with induction of HL60
cell growth arrest and differentiation by physiological agents.
FEBS Lett. 364:309–313. 1995. View Article : Google Scholar : PubMed/NCBI
|
|
54
|
Matushansky I, Radparvar F and Skoultchi
AI: Reprogramming leukemic cells to terminal differentiation by
inhibiting specific cyclin-dependent kinases in G1. Proc Natl Acad
Sci USA. 97:14317–14322. 2000. View Article : Google Scholar : PubMed/NCBI
|
|
55
|
Müller A, Lange K, Gaiser T, Hofmann M,
Bartels H, Feller AC and Merz H: Expression of angiopoietin-1 and
its receptor TEK in hematopoietic cells from patients with myeloid
leukemia. Leuk Res. 26:163–168. 2002. View Article : Google Scholar : PubMed/NCBI
|
|
56
|
Tagliafico E, Tenedini E, Manfredini R,
Grande A, Ferrari F, Roncaglia E, Bicciato S, Zini R, Salati S,
Bianchi E, et al: Identification of a molecular signature
predictive of sensitivity to differentiation induction in acute
myeloid leukemia. Leukemia. 20:1751–1758. 2006. View Article : Google Scholar : PubMed/NCBI
|
|
57
|
Qian Z, Fernald AA, Godley LA, Larson RA
and Le Beau MM: Expression profiling of CD34+ hematopoietic
stem/progenitor cells reveals distinct subtypes of therapy-related
acute myeloid leukemia. Proc Natl Acad Sci USA. 99:14925–14930.
2002. View Article : Google Scholar
|
|
58
|
Shimamura R, Kudo J, Kondo H, Dohmen K,
Gondo H, Okamura S, Ishibashi H and Niho Y: Expression of the
thymosin beta 4 gene during differentiation of hematopoietic cells.
Blood. 76:977–984. 1990.PubMed/NCBI
|
|
59
|
Schwanhäusser B, Wolf J, Selbach M and
Busse D: Synthesis and degradation jointly determine the
responsiveness of the cellular proteome. BioEssays. 35:597–601.
2013. View Article : Google Scholar : PubMed/NCBI
|
|
60
|
Vogel C and Marcotte EM: Insights into the
regulation of protein abundance from proteomic and transcriptomic
analyses. Nat Rev Genet. 13:227–232. 2012. View Article : Google Scholar : PubMed/NCBI
|
|
61
|
Chen G, Gharib TG, Huang CC, Taylor JM,
Misek DE, Kardia SL, Giordano TJ, Iannettoni MD, Orringer MB,
Hanash SM, et al: Discordant protein and mRNA expression in lung
adenocarcinomas. Mol Cell Proteomics. 1:304–313. 2002. View Article : Google Scholar : PubMed/NCBI
|
|
62
|
Jansen R, Greenbaum D and Gerstein M:
Relating whole-genome expression data with protein-protein
interactions. Genome Res. 12:37–46. 2002. View Article : Google Scholar : PubMed/NCBI
|
|
63
|
Miwa H, Beran M and Saunders GF:
Expression of the Wilms’ tumor gene (WT1) in human leukemias.
Leukemia. 6:405–409. 1992.PubMed/NCBI
|
|
64
|
El-Rifai W, Moskaluk CA, Abdrabbo MK,
Harper J, Yoshida C, Riggins GJ, Frierson HF Jr and Powell SM:
Gastric cancers overexpress S100A calcium-binding proteins. Cancer
Res. 62:6823–6826. 2002.PubMed/NCBI
|
|
65
|
Su YJ, Xu F, Yu JP, Yue DS, Ren XB and
Wang CL: Up-regulation of the expression of S100A8 and S100A9 in
lung adenocarcinoma and its correlation with inflammation and other
clinical features. Chin Med J (Engl). 123:2215–2220. 2010.
|
|
66
|
Whitman SP, Maharry K, Radmacher MD,
Becker H, Mrózek K, Margeson D, Holland KB, Wu YZ, Schwind S,
Metzeler KH, et al: FLT3 internal tandem duplication associates
with adverse outcome and gene- and microRNA-expression signatures
in patients 60 years of age or older with primary cytogenetically
normal acute myeloid leukemia: A Cancer and Leukemia Group B study.
Blood. 116:3622–3626. 2010. View Article : Google Scholar : PubMed/NCBI
|
|
67
|
Kim HS, Lee TB and Choi CH:
Down-regulation of catalase gene expression in the
doxorubicin-resistant AML subline AML-2/DX100. Biochem Biophys Res
Commun. 281:109–114. 2001. View Article : Google Scholar : PubMed/NCBI
|
|
68
|
Bergmann L, Maurer U and Weidmann E: Wilms
tumor gene expression in acute myeloid leukemias. Leuk Lymphoma.
25:435–443. 1997. View Article : Google Scholar : PubMed/NCBI
|
|
69
|
Lossos IS, Czerwinski DK, Wechser MA and
Levy R: Optimization of quantitative real-time RT-PCR parameters
for the study of lymphoid malignancies. Leukemia. 17:789–795. 2003.
View Article : Google Scholar : PubMed/NCBI
|
|
70
|
Hussein S, Michael P, Brabant D, Omri A,
Narain R, Passi K, Ramana CV, Parrillo JE, Kumar A, Parissenti A,
et al: Characterization of human septic sera induced gene
expression modulation in human myocytes. Int J Clin Exp Med.
2:131–148. 2009.PubMed/NCBI
|
|
71
|
Kreuzer KA, Saborowski A, Lupberger J,
Appelt C, Na IK, le Coutre P and Schmidt CA: Fluorescent
5′-exonuclease assay for the absolute quantification of Wilms’
tumour gene (WT1) mRNA: Implications for monitoring human
leukaemias. Br J Haematol. 114:313–318. 2001. View Article : Google Scholar : PubMed/NCBI
|