Introduction
Glioma is the most common and aggressive malignant
adult brain tumour with an overall 5-year survival rate of 10%.
Current treatments for patients with glioma include surgical
resection, radiotherapy and chemotherapy. Despite recent advances
in cancer diagnosis and treatment, the survival of patients with
glioma is only ~14 months (1).
Therefore, developing novel treatments to increase the survival of
patients with glioma remains a great challenge.
Epigenetic regulators have recently emerged as a new
class of therapeutic targets in cancer treatment. Members of the
bromodomain and extra-terminal (BET) family are epigenetic
modulators that bind to acetylated histone H3 and H4 and influence
gene regulation (2). Andrieu et
al (3) firstly established a
link between the expression and function of a BET protein and human
cancer. These proteins have become promising drug targets for
numerous cancer pathways characterized by changes in the epigenetic
cell signature (4,5). Among the bromodomain proteins,
bromodomain containing 4 (BRD4) has been extensively studied.
Similar to other BET family members, BRD4 has two bromodomains by
which it recognizes acetylated histones, followed by recruitment of
Mediator, a transcription initiation cofactor, present on the
promoter regions (6–8). These events lead to the
phosphorylation of RNA polymerase II, which is necessary for
transcriptional activation.
In addition to its role in gene regulation, BRD4 has
an important role in human diseases. Several recent studies have
reported BRD4 upregulation in multiple types of cancer, including
melanoma, hepatocellular carcinoma, lung cancer, acute myeloid
leukaemia, and glioblastoma (2,9–12).
BET bromodomain inhibitors, such as JQ1 and I-BETs, effectively
inhibit cell proliferation and tumour growth, mainly through the
downregulation of MYC proto-oncogene bHLH transcription factor
(c-MYC), a factor that regulates transcriptional pause release and
is important for tumour cell viability (11,13).
However, c-MYC is not always the main transcriptional target for
BET proteins (14,15). This suggests the existence of
additional, unidentified downstream targets of BET proteins in
human cancers. Therefore, it is essential to elucidate the
transcriptome and the molecular pathways controlled by BRD4 in
glioma.
In the present study, BRD4 expression was silenced
by using a lentivirus-mediated short hairpin RNA (shRNA) approach
in the glioma cell line U251 and the impact of BRD4 knockdown on
cell proliferation and apoptosis was examined. Furthermore,
genome-wide screening was performed using an Affymetrix microarray
to identify the gene expression profiles mediated by BRD4. The data
were subjected to gene ontology (GO), pathway and global signal
transduction network analyses, and the important or core
differentially expressed genes regulated by BRD4 were validated by
reverse transcription-quantitative polymerase chain reaction
(RT-qPCR) and western blot assays.
Materials and methods
Patients and specimens
All specimens were obtained from patients with
primary glioma during surgical operation between October 2014 and
December 2016 at the Department of Neurosurgery, Qilu Hospital of
Shandong University (Jinan, China). Tumour specimens were verified
by pathological analysis, and pathological classification was based
on the WHO classification standard. A total of 77 patients with
glioma included 16 low-grade samples with a median age of 38 years
(WHO grade II; age range, 21–62 years old; 10 males and 6 females),
and 61 high-grade tumours with a median age of 52 years (WHO grade
III and IV; age range, 15–78 years old; 40 males and 21 females).
Ten samples of normal adult brain tissue were obtained from
surgical resections of trauma patients with a median age of 40
years (age range, 22–62 years old; 7 males and 3 females). The
study was approved by the Ethics Committee of Qilu Hospital (Jinan,
China), and informed written consent was obtained from each
patient.
Cell culture and transfection
The human glioma cell line U251 was obtained from
the Shanghai Institutes for Biological Sciences Cell Resource
Center (Shanghai, China) and maintained in Dulbecco's modified
Eagle's medium (Invitrogen; Thermo Fisher Scientific, Inc.,
Waltham, MA, USA) supplemented with 10% fetal bovine serum (Gibco;
Thermo Fisher Scientific, Inc.). Primary normal human astrocytes
(HA) were obtained from ScienCell Research Laboratories (Carlsbad,
CA, USA) and were cultured in astrocyte media (ScienCell Research
Laboratories).
To knockdown BRD4 in U251 cells, two different shRNA
sequences (BRD4-shRNA1 and BRD4-shRNA2) were designed, as described
previously (16). shRNA
lentiviruses co-expressing enhanced green fluorescent protein
(EGFP) and shRNA against human BRD4 were purchased from Shanghai
GeneChem Co., Ltd. (Shanghai, China). Scrambled shRNA (Scr-shRNA)
that targeted a non-specific sequence (5′-TTCTCCGAACGTGTCACGT-3′)
was used as the control.
siRNA targeting KRAS proto-oncogene GTPase (KRAS)
and the negative control siRNA (cat. nos. sc-35731 and sc-37007,
respectively) were purchased from Santa Cruz Biotechnology, Inc.
(Dallas, TX, USA). Cells were plated in 6-well plates at
1.5×10⁵ cells per well, grown for 24 h, then transfected
with 50 pmol siRNA for 6 h using RNAiMAX transfection reagent
(Thermo Fisher Scientific, Inc.), according to the manufacturer's
protocol. Cells were harvested for analysis three days
post-transfection.
Immunohistochemistry
Immunostaining was performed as previously described
(17). KRAS was assessed using a
rabbit polyclonal antibody (cat. no. 12063-1-AP; ProteinTech Group,
Inc., Chicago, IL, USA) at a 1:200 dilution.
The sections were deparaffinised with xylene and
dehydrated in a graded concentration of ethanol. Then, antigen
retrieval was performed using heat treatment in a microwave oven.
Tissue sections (5 µm thick) were treated with peroxidase
blocking solution and incubated with primary antibodies at 4°C
overnight, followed by staining with an ABC kit (Santa Cruz
Biotechnology, Inc.). Hematoxylin was used as a counterstain.
The staining score was assessed using the H-score
system, as described previously (18,19).
Briefly, a staining intensity score of 0 to 3 was assigned for the
intensity of tumour cells (0, negative; 1+, weak
positive; 2+, positive; and 3+, strong
positive). A proportional score is the % of positive cells over
total. The H-score was calculated using the formula: H-score = ∑ (I
× Pi), where I = intensity of staining and Pi = percentage of
stained tumour cells, producing a score ranging from 0 to 300. Five
vital tumour fields were evaluated (at ×400 magnification) and a
final mean score for each tumour was calculated.
Cell proliferation assay
Cell proliferation was assessed using the cell
counting kit-8 (CCK-8; Dojindo Molecular Technologies, Inc.,
Kumamoto, Japan) and the Cell-Light EdU assays (RiboBio Co., Ltd.,
Guangzhou, China) according to the manufacturer's instructions.
Each experiment was performed in triplicate.
Flow cytometry analysis for cell
apoptosis
Cells were cultured in 6-well plates and harvested
when they reached ~85% confluence. The Muse Annexin V and Dead Cell
kit (Millipore; Merck KGaA, Darmstadt, Germany) was used to detect
cell apoptosis, following the manufacturer's protocol. The analysis
of apoptosis was performed using a Millipore Muse Cell
Analyzer.
RT-qPCR
Total RNA was isolated from cells using TRIzol
reagent (Thermo Fisher Scientific, Inc.) and then transcribed to
cDNA using a PrimeScript II 1st Strand cDNA Synthesis kit (Takara
Biotechnology Co., Ltd., Dalian, China), according to
manufacturer's instructions. qPCR was performed in technical
triplicates using SYBR Green reagent (Bio-Rad Laboratories, Inc.,
Hercules, CA, USA). The thermocycling conditions were as follows:
95°C for 5 min, followed by 40 cycles of 95°C for 10 sec and 60°C
for 30 sec. This was followed by a dissociation stage of 95°C for
15 sec, 60°C for 30 sec, and 95°C for 15 sec. The primers used for
qPCR are listed in Table I.
Expression levels were calculated using the 2-ΔΔCq method (20), with the Cq values normalized using
GAPDH as an internal control.
 | Table IPrimers used in quantitative
polymerase chain reaction analysis. |
Table I
Primers used in quantitative
polymerase chain reaction analysis.
| Gene | Sequence
(5′–3′) |
|---|
| KRAS | F:
CAGTAGACACAAAACAGGCTCAG |
| R:
TGTCGGATCTCCCTCACCAATG |
| BRAF | F:
AACGAGACCGATCCTCATCAGC |
| R:
GGTAGCAGACAAACCTGTGGTTG |
| CALM2 | F:
AGTGCTGCAGAACTTCGCCATG |
| R:
CAAGGTCTTCACTTTGCTGTCATC |
| ARAF | F:
CCCACATTCCAAGTCACCAGCA |
| R:
CCTCCCAGTAATAGCCTGAGTC |
| RHOA | F:
TCTGTCCCAACGTGCCCATCAT |
| R:
CTGCCTTCTTCAGGTTTCACCG |
| MAPK8
(JNK1) | F:
GACGCCTTATGTAGTGACTCGC |
| R:
TCCTGGAAAGAGGATTTTGTGGC |
| PLCB3 | F:
GGTGAATGCCACTGAGGAGATG |
| R:
CTTGGTCTCCACAAAGGACGAC |
| MAPK10
(JNK3) | F:
GTGTGGAAGTGGGAGACTCAAC |
| R:
GTCAAGGACAGCATCATACGCG |
| GNAI1 | F:
AGCACTGAGTGACTACGACCTG |
| R:
GGATGTATCTGTAAACCACTTGTTG |
| ADCY6 | F:
CACATAGCACCGCAGTTGGCAT |
| R:
AGGCAGTGATGTCAGCAGGTGT |
| GAPDH | F:
CCGGGAAACTGTGGCGTGATGG |
| R:
AGGTGGAGGAGTGGGTGTCGCTGTT |
Western blotting
For western blot analysis, proteins were extracted
from cells using RIPA buffer containing protein inhibitors
(Beyotime Institute of Biotechnology, Haimen, China). Protein
concentrations were measured by the BCA protein assay (Beyotime
Institute of Biotechnology) using bovine serum albumin as standard.
Equal amounts (20 µg/lane) of protein samples were loaded on
12% SDS-PAGE gel for separation and then transferred to
polyvinylidene fluoride membrane (Millipore; Merck KGaA). Membranes
were blocked with 5% skim milk at room temperature for 2 h and then
incubated with primary antibodies at 4°C overnight. Primary
antibodies against the following proteins were used: BRD4 (1:1,000;
cat. no. ab128874), B-Raf proto-oncogene serine/threonine kinase
(BRAF; 1:1,000; cat. no. ab33899), ras homolog family member A
(RHOA; 1:1,000; cat. no. ab54835), mitogen-activated protein kinase
8 (MAPK8, also known as JNK1; 1:2,000; cat. no. ab54835), MAPK10
(also known as JNK3; 1:1,000; cat. no. ab87404) (all from Abcam,
Cambridge, UK), KRAS (1:1,000; cat. no. 12063-1-AP; ProteinTech)
and GAPDH (1;10,000; cat. no. SAB2100894; Sigma-Aldrich; Merck
KGaA). Following this, the membranes were washed and incubated with
the appropriate secondary antibody (horseradish
peroxidase-conjugated goat anti-mouse or goat anti-rabbit IgG; cat.
nos. SA00001-1 and SA00001-2, respectively; 1:10,000; ProteinTech)
for 2 h at room temperature. An enhanced chemiluminescence kit
(Millipore; Merck KGaA) was used to detect the signal on the
membrane. The ratios of target proteins to internal control were
calculated using Tanon GIS 1D analysis software version 4.2 (Tanon,
Shanghai, China).
Terminal deoxynucleotidyl transferase
dUTP nick end labeling (TUNEL) assay
TUNEL assay was performed to assess apoptosis using
the In Situ Death Detection kit (Roche Diagnostics GmbH,
Mannheim, Germany). Briefly, cells were fixed with
paraformaldehyde, permeabilized with Triton X-100, and labelled
with labelling solutions provided in the kit. Nuclei were stained
with DAPI. Apoptosis was assessed by the ratio of the number of
TUNEL-positive cells divided by the number of DAPI-positive
cells.
Microarray analysis
Total RNA was extracted from scrambled and
BRD4-shRNA U251 cells using TRIzol reagent (Thermo Fisher
Scientific, Inc.) and purified with an RNeasy mini kit (Qiagen
GmbH, Hilden, Germany). cDNA was synthesized with One-Cycle Target
Labeling and Control Reagents, and cRNA was created using a
GeneChip IVT Labeling kit (both from Affymetrix; Thermo Fisher
Scientific, Inc.). cRNA was fragmented, and then hybridized to an
Affymetrix Human Clariom D Array (Affymetrix; Thermo Fisher
Scientific, Inc). GeneChips were washed and stained in the
Affymetrix Fluidics Station 450. All arrays were scanned using the
Affymetrix GeneChip Command Console, which was installed in the
GeneChip Scanner 3000 7G. The data were analysed with the Robust
Multichip Analysis (RMA) algorithm using the Affymetrix default
analysis settings and global scaling as a normalization method.
Values presented are log2 RMA signal intensities.
The microarray data discussed in this article are
publicly available at the NCBI Gene Expression Omnibus (GEO) under
the accession number GSE 97791.
Data analysis
Differentially expressed genes were identified using
the Student's t-test for comparison of the two groups. Genes were
considered differentially regulated between the two groups when
there was >2-fold difference in expression with P<0.05.
Differentially expressed genes with at least a 2-fold change in
either the positive or negative direction were considered up- or
downregulated, respectively. Hierarchical clustering was performed
on the differentially expressed genes using Cluster_Treeview
software from Stanford University (Palo Alto, CA, USA) (21).
GO analysis was performed to assess the primary
function of the differential expression of mRNAs regulated by BRD4.
GO analysis organizes genes into hierarchical categories and
uncovers the gene regulatory network based on biological process
and molecular function. Fisher's exact test was performed to select
the significant GO categories, and the threshold of significance
was P<0.05.
Pathway analysis was used to determine the
significant pathways that the differentially expressed genes
participated in, according to the Kyoto Encyclopedia of Genes and
Genomes (KEGG) database. Fisher's exact test was used to select the
significant pathways, and the threshold of significance was defined
as P<0.05.
A gene-gene interaction network (global signal
transduction network) was constructed based on the KEGG database
regarding the interactions between differentially expressed genes
to examine the core genes that would be predicted to have an
important role in this network. Networks are displayed as graphs,
where the nodes represent genes, and the lines represent relation
types between the nodes, such as activation or dephosphorylation.
The nodes were connected when their corresponding encoded gene
products were connected directly or indirectly by a linker gene in
the interaction network. The link number of one node with upstream
genes, downstream genes or all binding genes is reported as the
in-degree, out-degree, or degree, respectively. A higher degree
indicates that the gene has a strong correlation with other genes,
implying a more important role in the signalling network.
Statistical analysis
Experimental data are presented as the mean ±
standard deviation of at least three experiments. Statistical
analyses were performed with SPSS software (version 22.0; IBM SPSS,
Armonk, NY, USA). Significant differences were assessed by
Student's t-test. P<0.05 was considered to indicate a
statistically significant difference.
Results
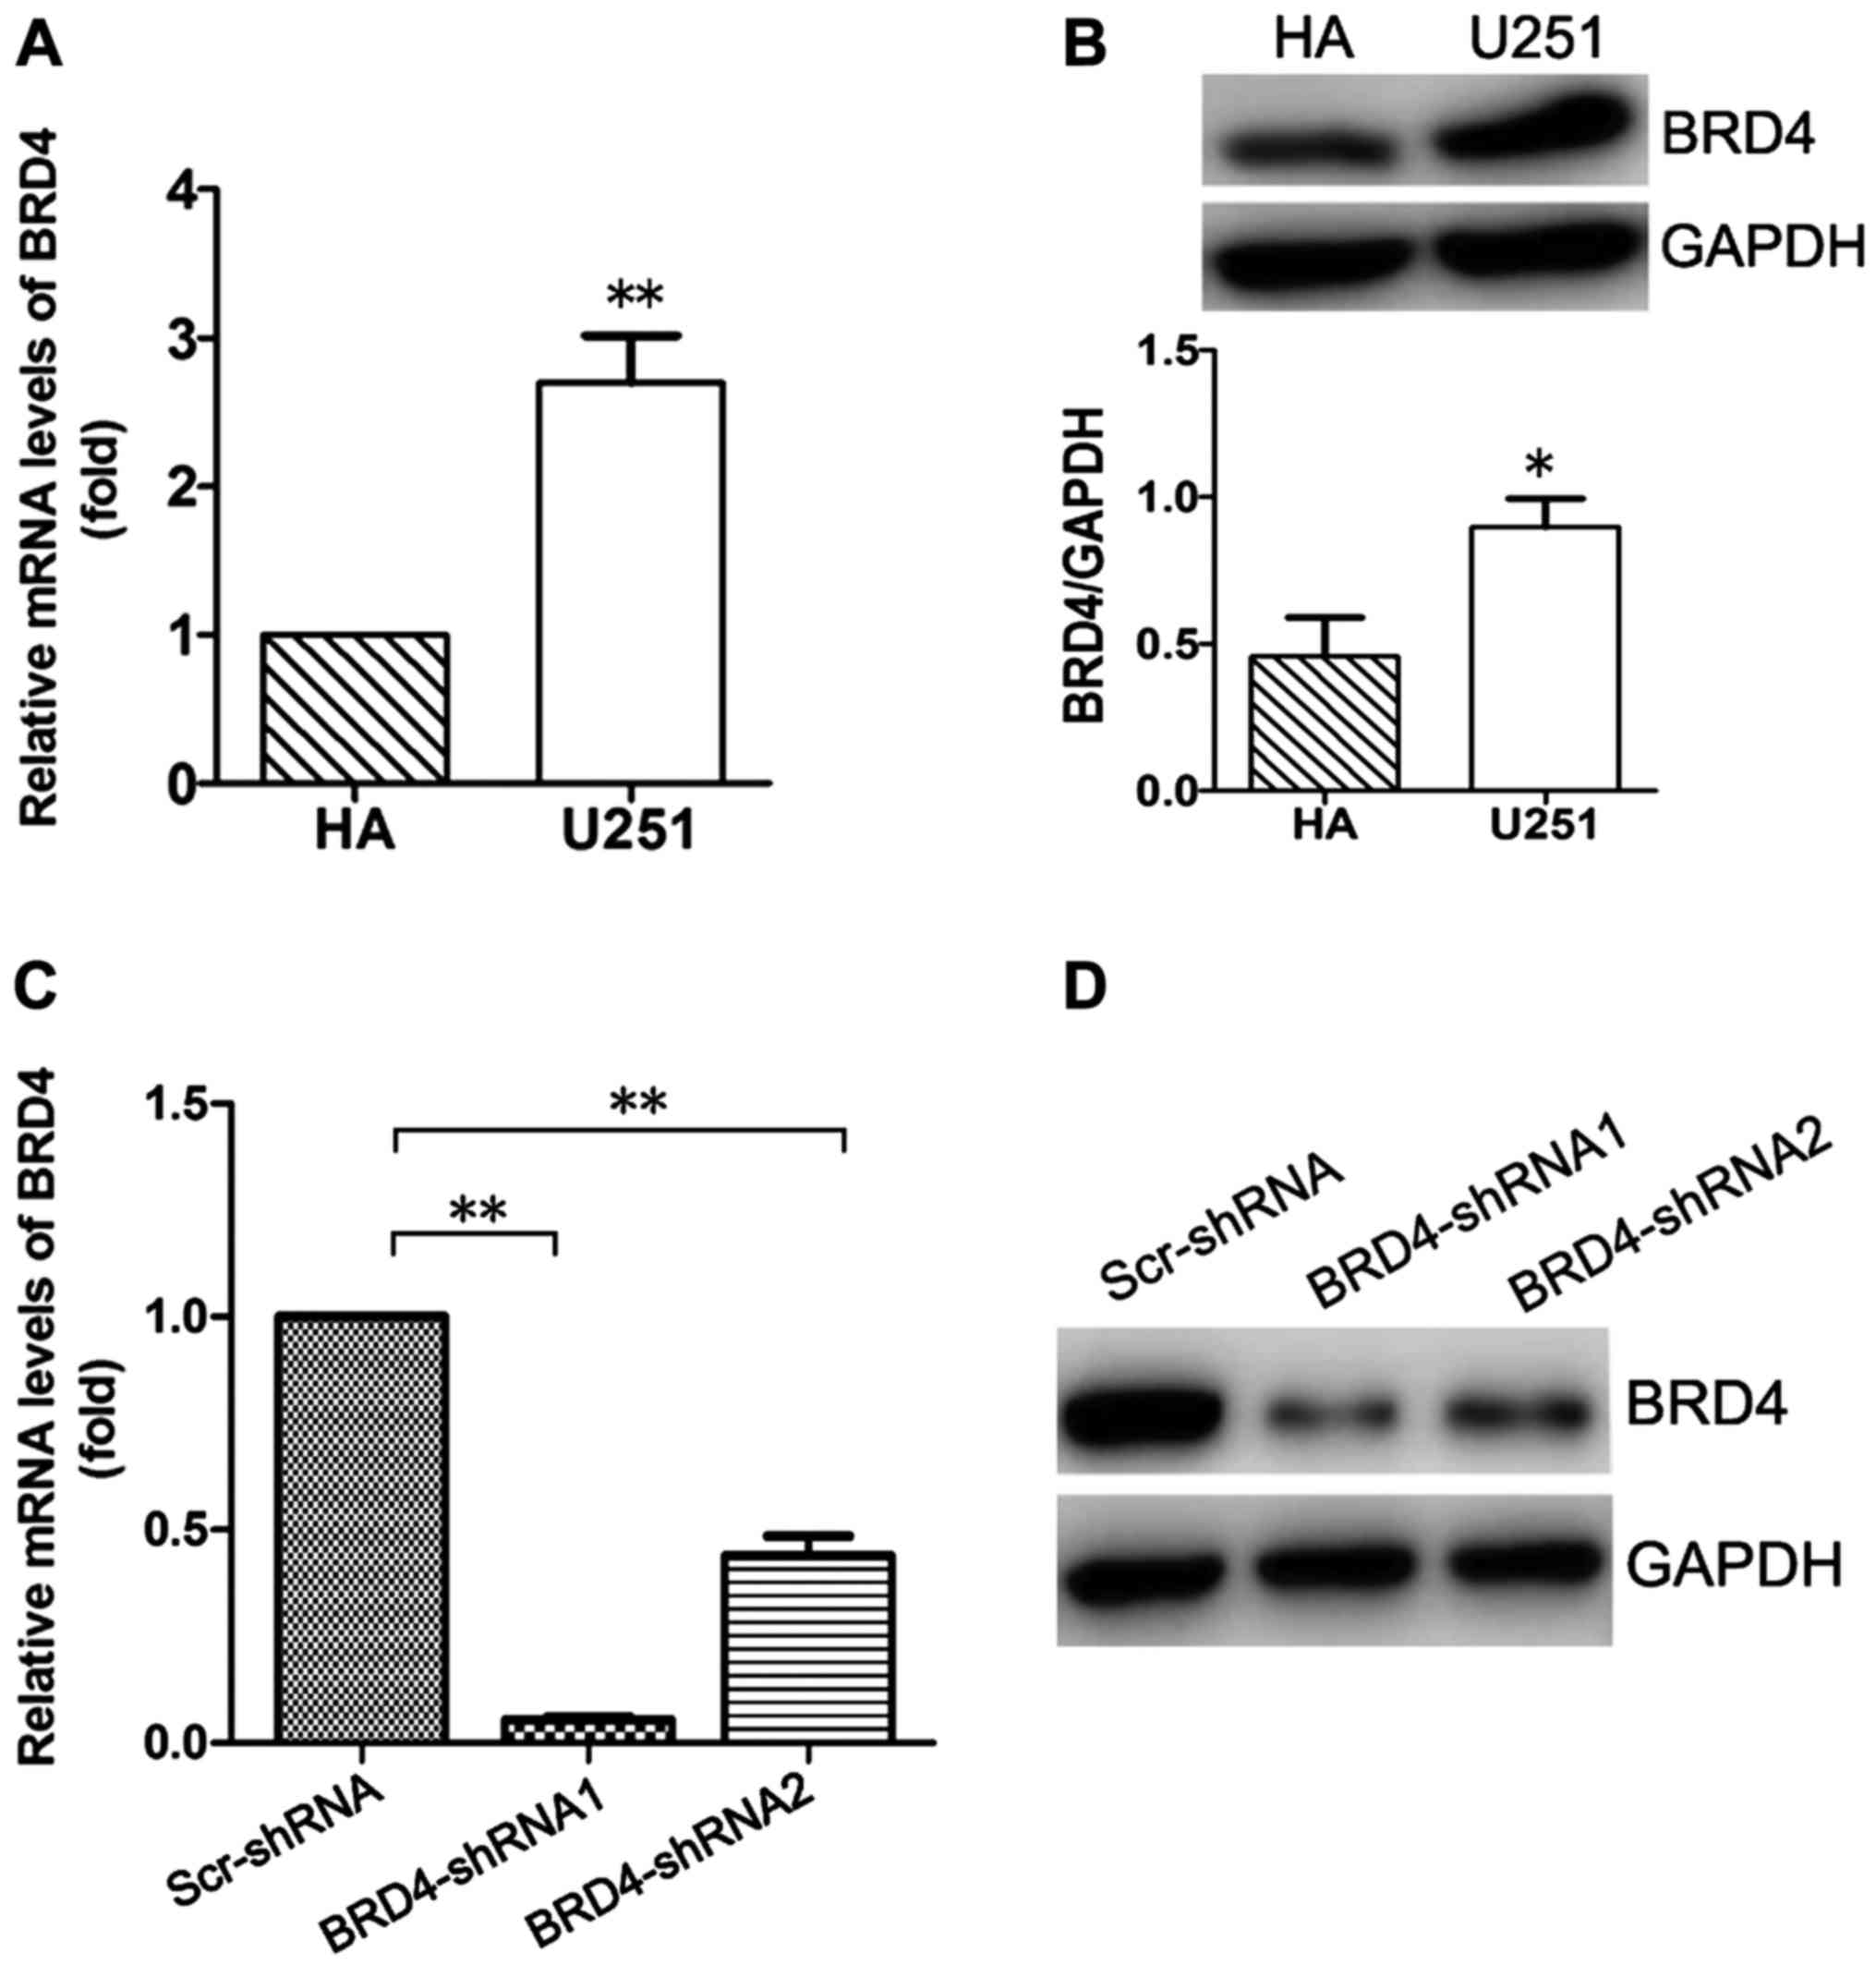
BRD4 is highly expressed in U251 glioma
cells
The expression of BRD4 was investigated in glioma
U251 and normal HA cells by qPCR and western blotting. As
illustrated in Fig. 1A, the mRNA
expression levels of BRD4 were significantly higher in U251 cells
compared with HA cells (P<0.01). The protein expression levels
of BRD4 were consistent with the mRNA levels, as evidenced by the
western blot analysis results (P<0.05; Fig. 1B).
BRD4-shRNAs effectively downregulated BRD4
expression at both the mRNA and protein levels (Fig. 1C and D). Compared with BRD4-shRNA2,
BRD4-shRNA1 was more effective at silencing BRD4 expression at the
mRNA and protein levels (Fig. 1C and
D). Therefore, the BRD4-shRNA1 was used in subsequent
experiments in order to knockdown BRD4 expression in U251
cells.
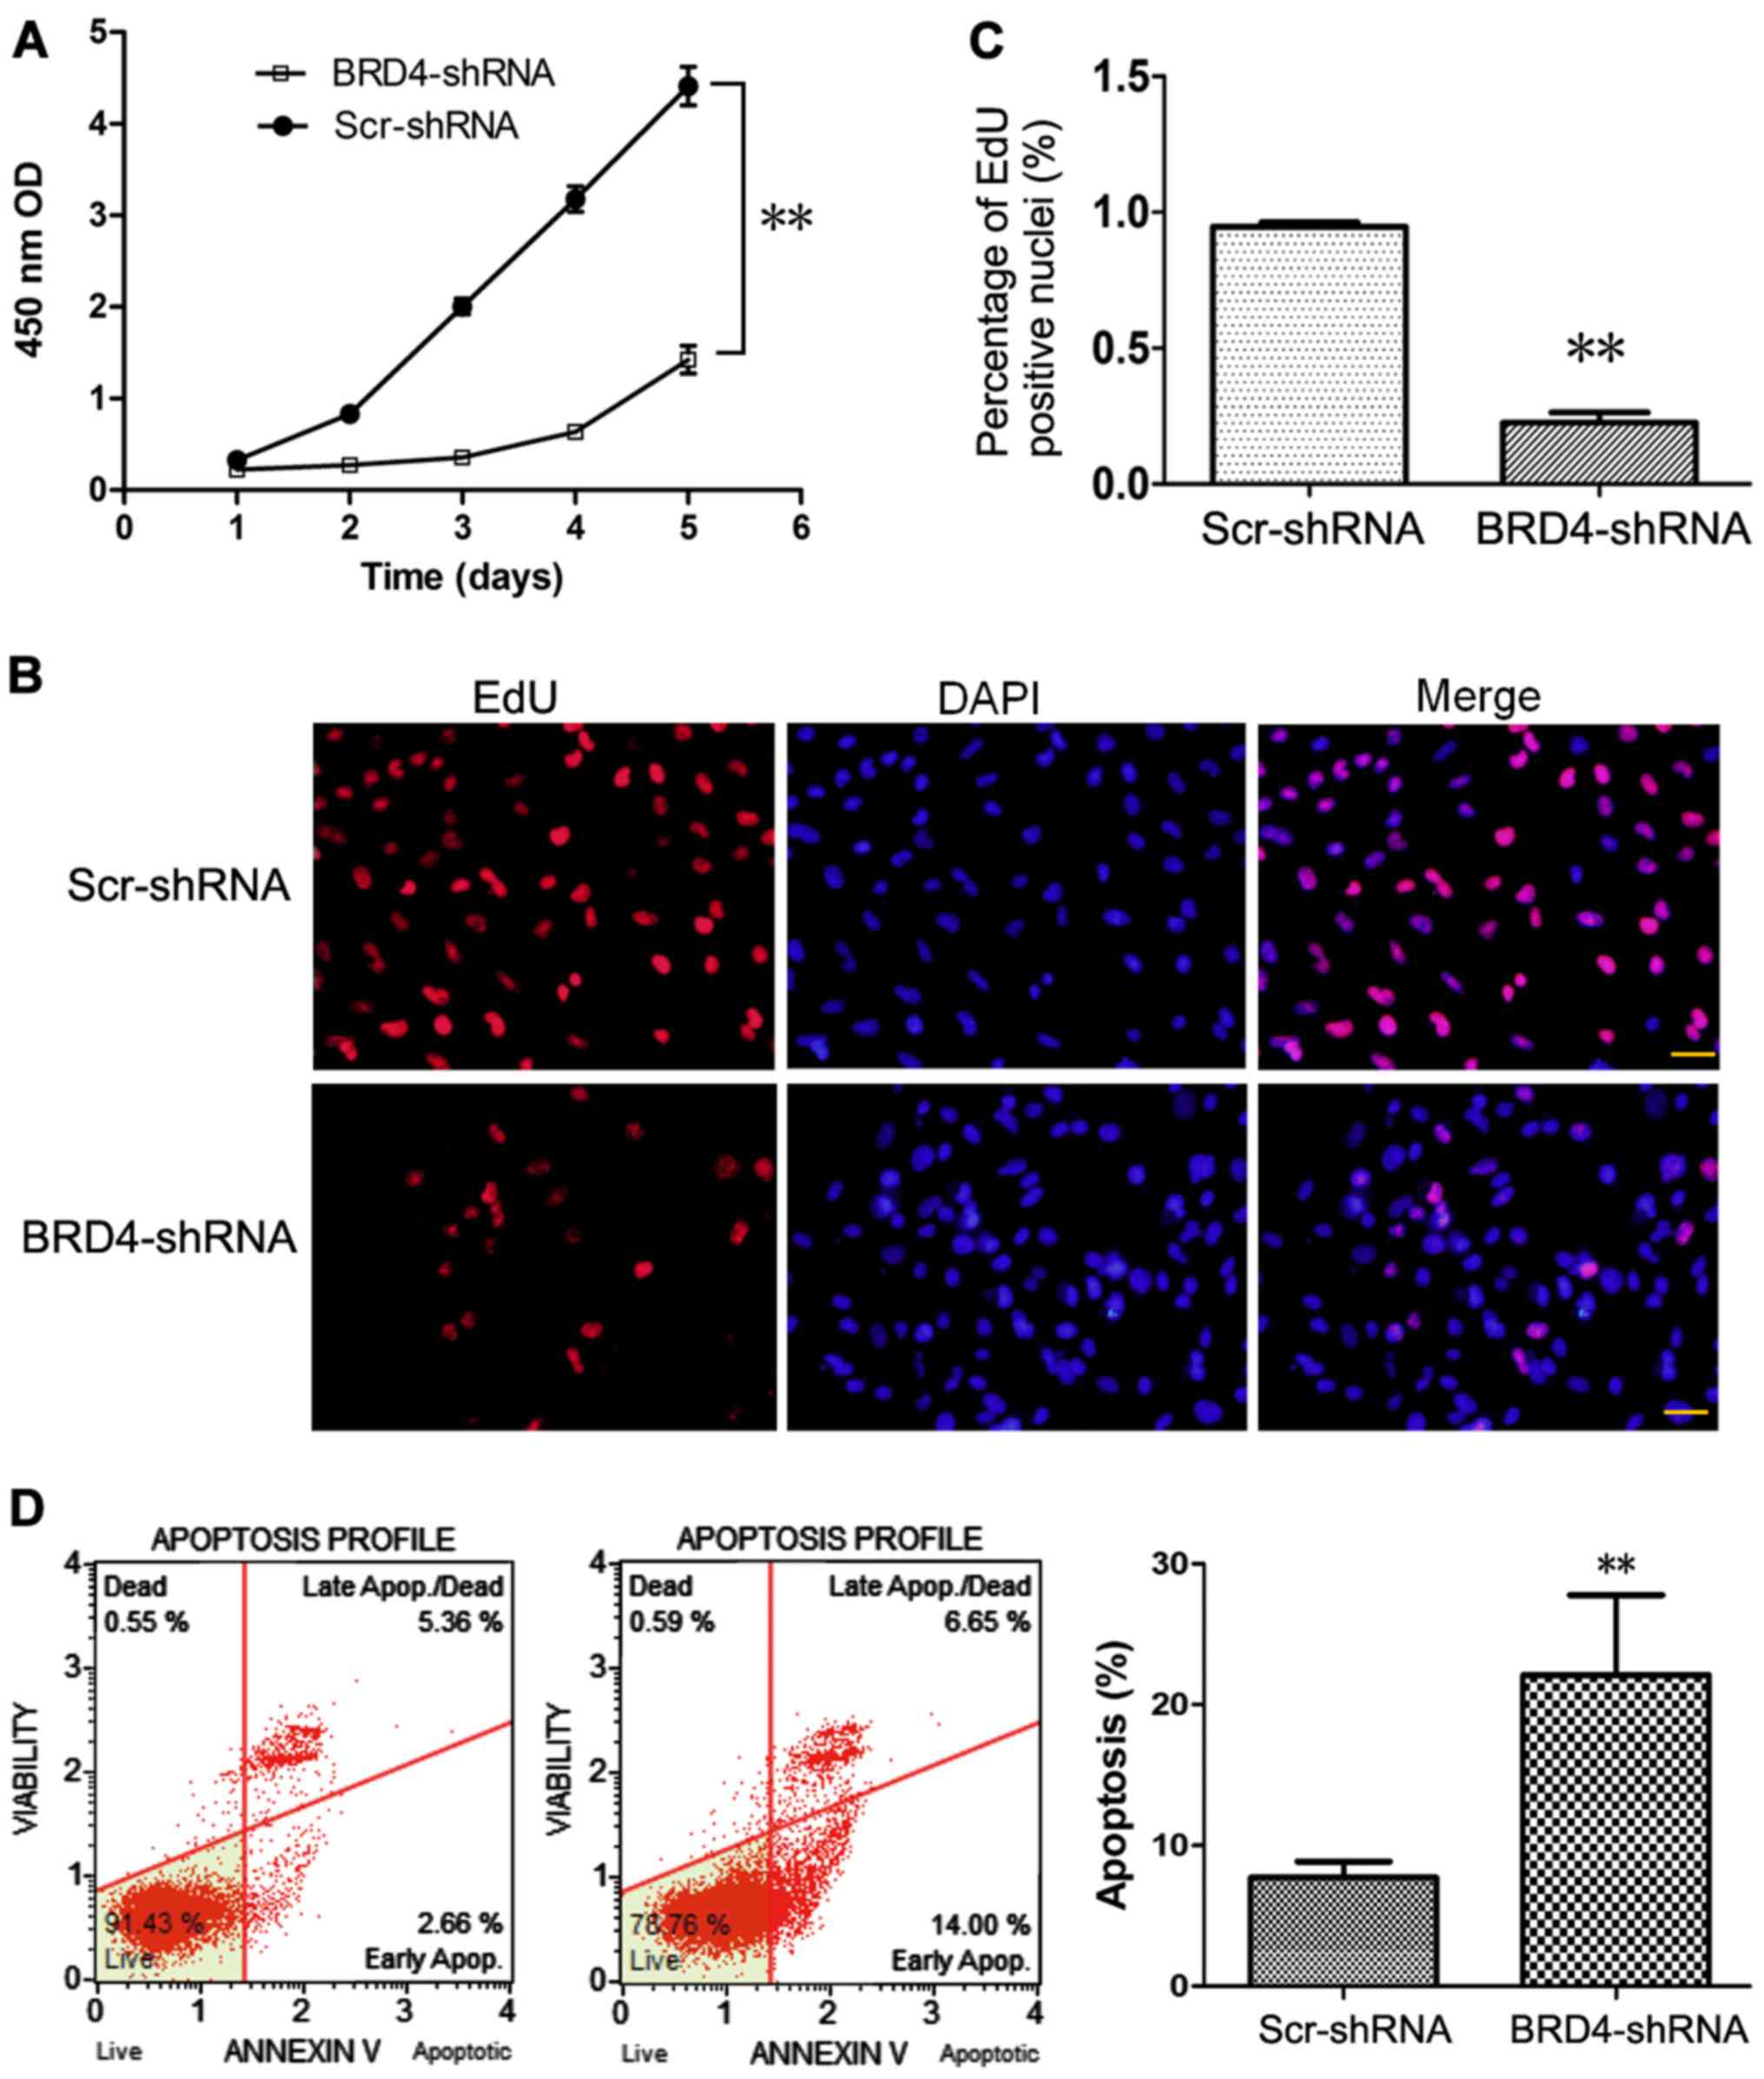
Effect of BRD4 knockdown on proliferation
and apoptosis of U251 cells
As presented in Fig.
2A, CCK-8 assays were performed at different time-points to
determine the effect of BRD4 knockdown on U251 cell proliferation.
Compared with control Scr-shRNA, BRD4-shRNA significantly decreased
the proliferation of U251 cells (Fig.
2A), suggesting that BRD4 promoted the proliferation of glioma
cells. Consistent with this result, the EdU incorporation assay
indicated that the % of proliferating cells was decreased in the
BRD4-shRNA group compared with the Scr-shRNA group (Fig. 2B and C).
Cell apoptosis was evaluated by flow
cytometry using a Muse Annexin V Dead Cell kit
Apoptosis was detected in only 7.7±1.2% of control
Scr-shRNA-transduced U251 cells, while 22.1±5.7% of cells were
apoptotic following BRD4-shRNA transduction (Fig. 2D).
Analysis of differentially expressed mRNA
between BRD4-shRNA and Scr-shRNA-transduced U251 cells
In total, 3,529 separately and differentially
expressed mRNAs were identified between the BRD4-shRNA and
Scr-shRNA groups by microarray analysis; 1,648 of these genes were
upregulated and 1,881 were downregulated (Fig. 3A). The data regarding the
differentially expressed genes between the two groups were
subjected to unsupervised hierarchical clustering and TreeView
analysis. The heatmap demonstrated distinguishable mRNA expression
profiles between the two groups (Fig.
3B).
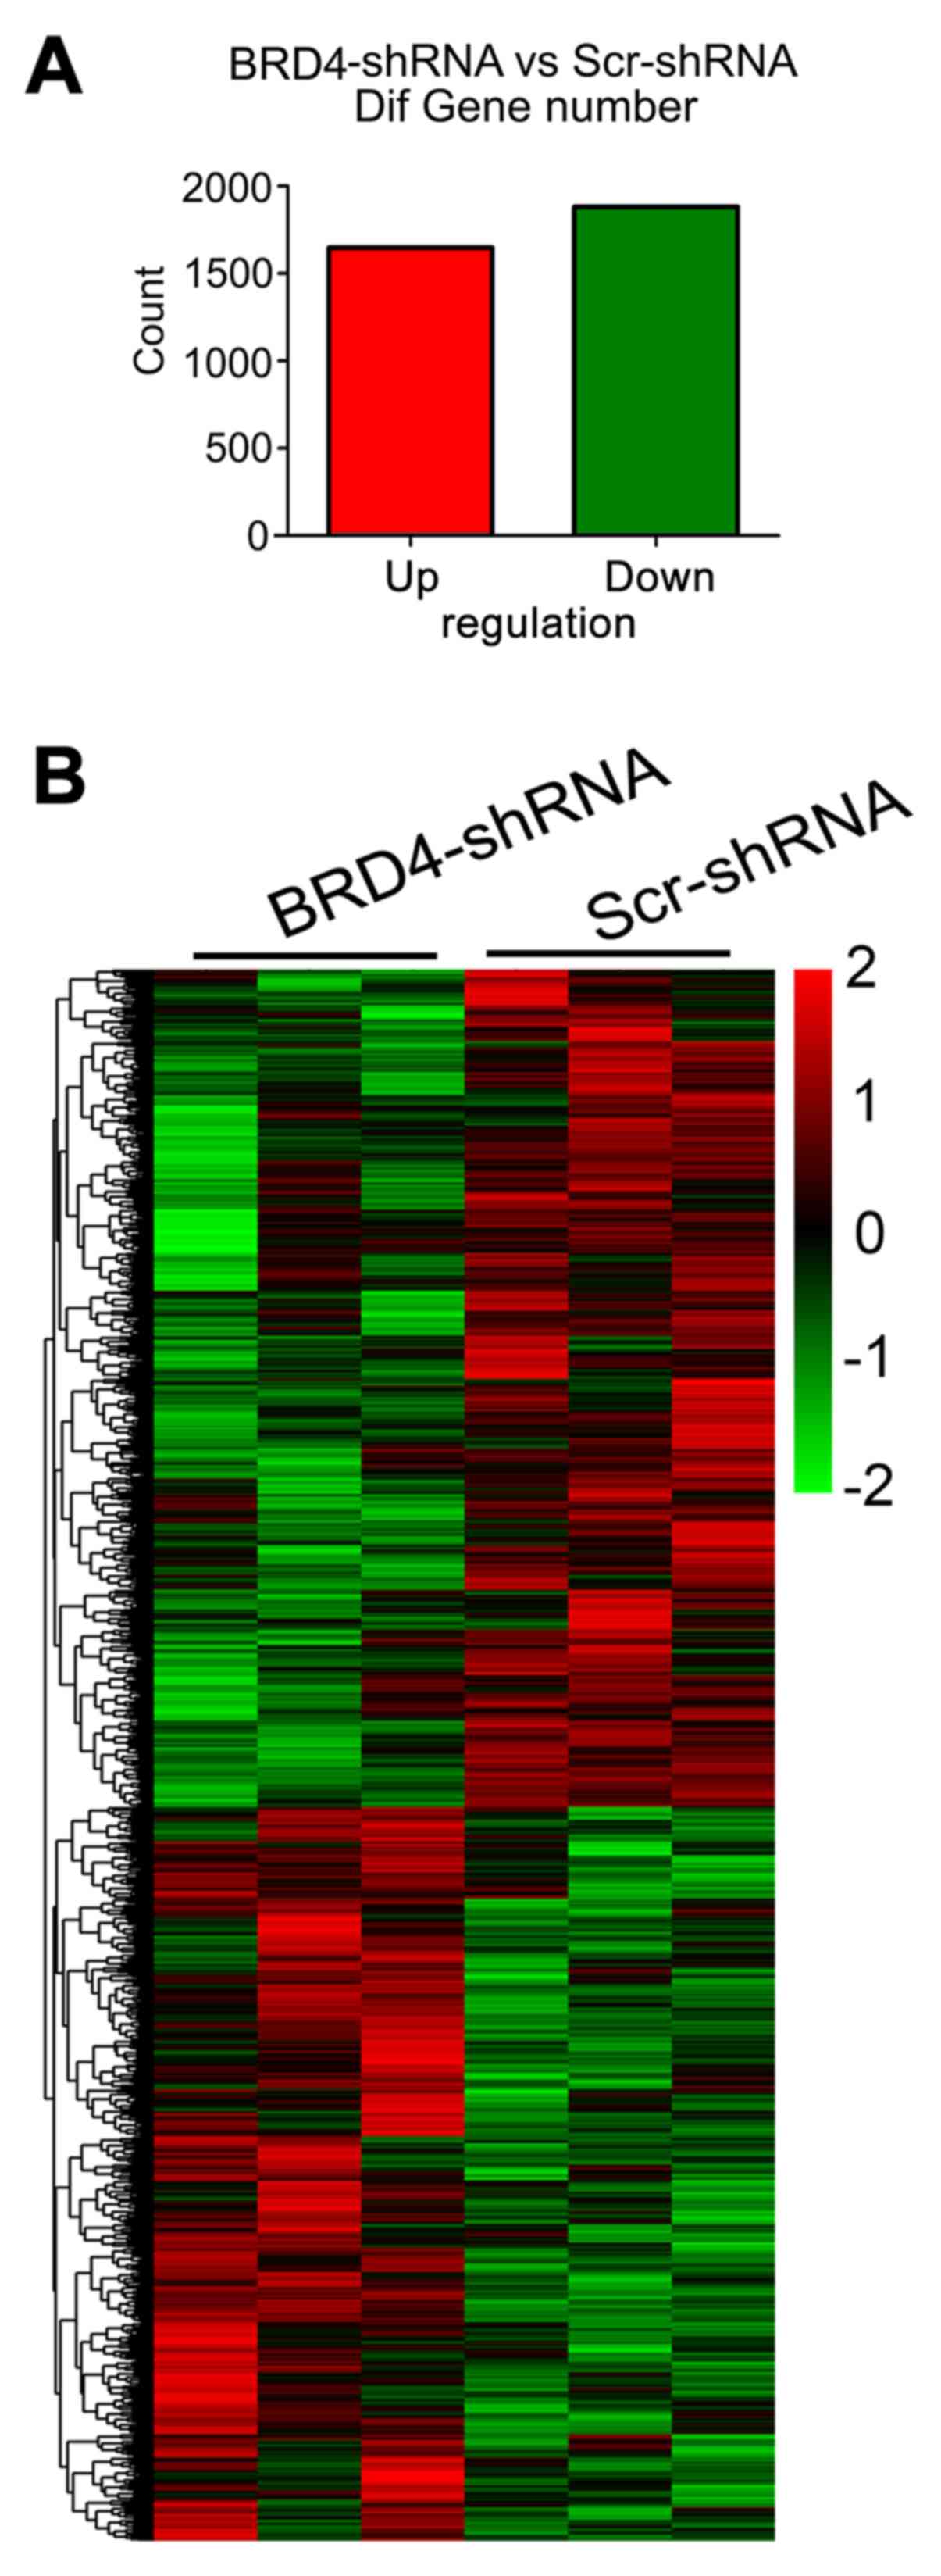 | Figure 3Differentially expressed genes
induced by BRD4 knockdown. (A) There were 3,529 differentially
expressed genes identified in U251 cells following BRD4 knockdown
compared with the control (filtering criteria, fold change >2
and P<0.05), of which 1,648 were upregulated and 1,881 were
downregulated. (B) Heatmap of the 3,529 differentially expressed
genes resulting from the microarray analysis. Genes and samples are
listed in rows and columns, respectively. The colour scale at the
top right of the heatmap represents the normalized expression data
(red indicates upregulation and green indicates downregulation).
BRD4, bromodomain containing 4; sh, short hairpin; Scr, scrambled
control. |
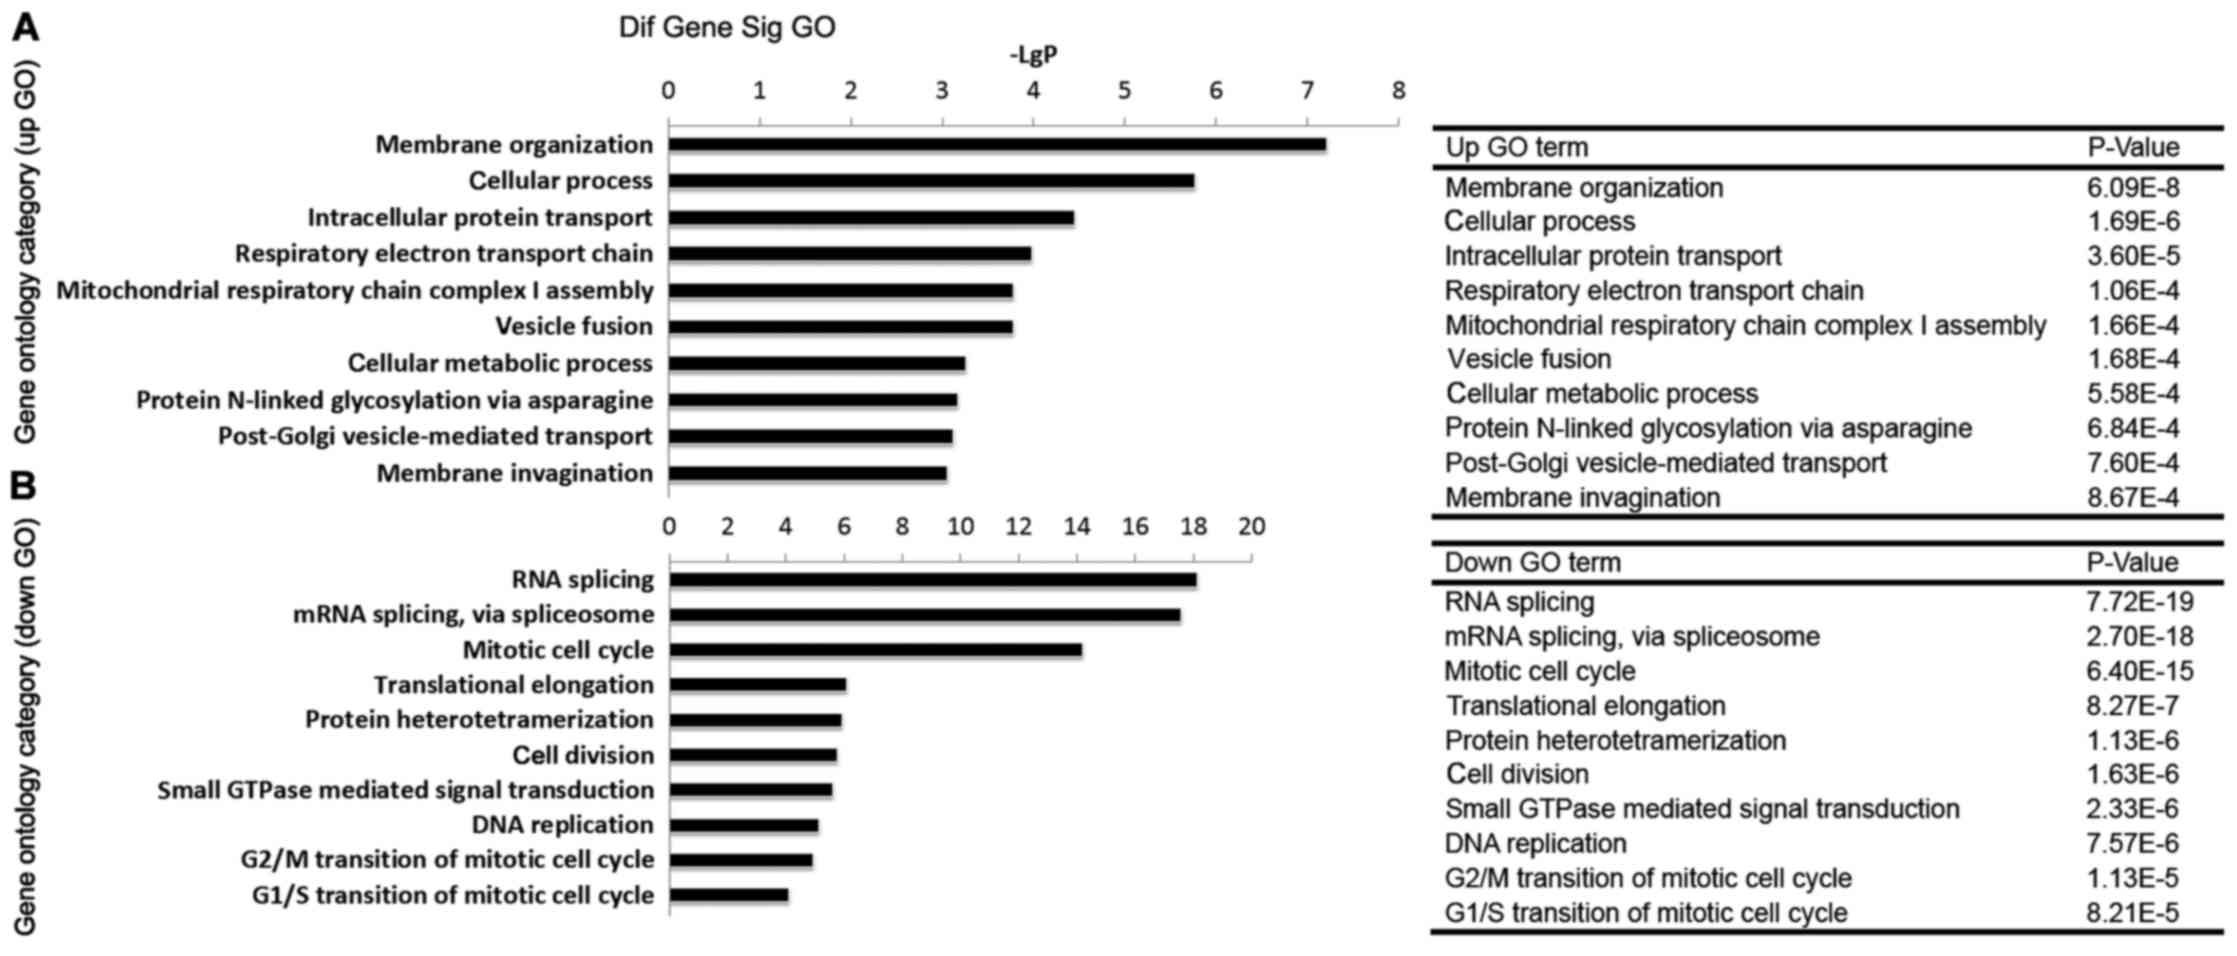
GO analysis of BRD4-regulated genes
The differentially expressed genes were subjected to
GO analysis, in order to explore the main cell functions affected
by BRD4. As presented in Fig. 4A,
the top five GOs involving the upregulated genes (upGOs) following
BRD4 knockdown were membrane organization, cellular process,
intracellular protein transport, respiratory electron transport
chain, and mitochondrial respiratory chain complex I assembly. The
relevant GOs involving the downregulated genes (downGOs) following
BRD4 knockdown included mitotic cell cycle, cell division, small
GTPase-mediated signal transduction, DNA replication, G2/M
transition of mitotic cell cycle, and G1/S transition of mitotic
cell cycle (Fig. 4B).
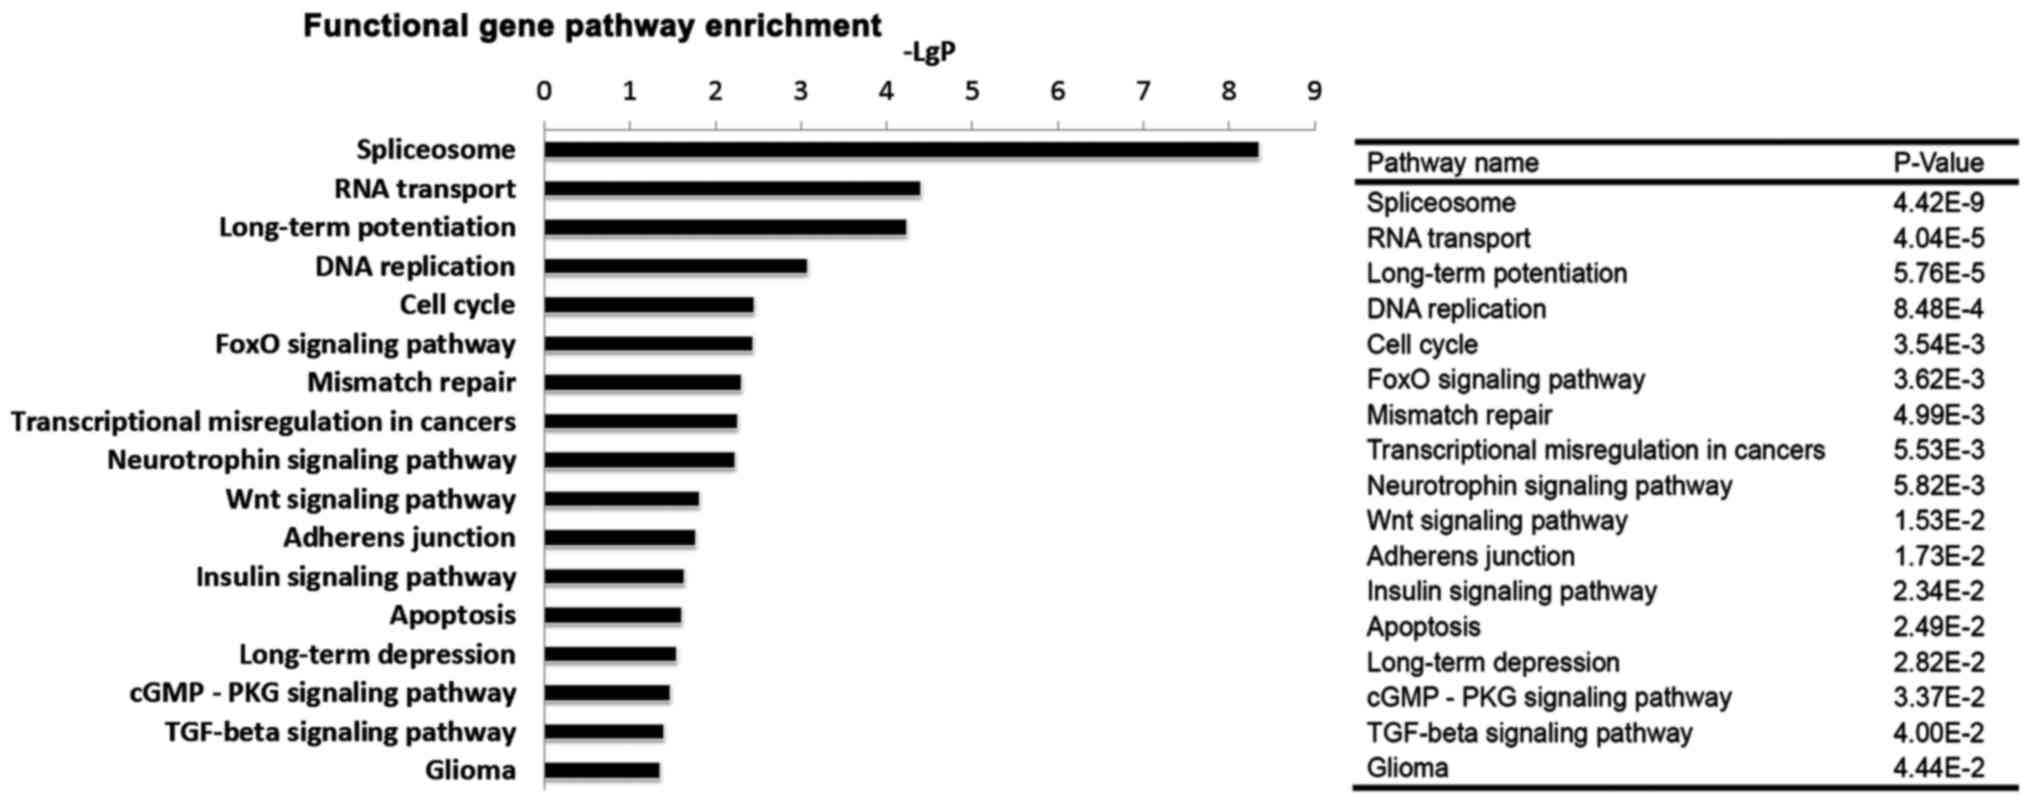
Analysis of pathways affected by BRD4
knockdown
Based on the KEGG database, the pathways in which
the differentially expressed genes were involved were analysed. As
presented in Table II, 53
pathways were identified and classified into 19 categories, of
which 8 pathways were involved in the nervous system, 6 pathways in
cancer, and 3 pathways in cell growth and death. Among the 53
pathways, some important pathways, including spliceosome, DNA
replication, cell cycle, the forkhead box O (FoxO) signalling
pathway, transcriptional misregulation in cancer, the Wnt
signalling pathway, the insulin signalling pathway, apoptosis, the
transforming growth factor (TGF)-β signalling pathway, and glioma
were significantly altered (Fig.
5).
| Table IICategory distribution of the 53
pathways enriched with the differentially expressed genes. |
Table II
Category distribution of the 53
pathways enriched with the differentially expressed genes.
| Category | No. of
pathways |
|---|
| Nervous system | 8 |
| Cancer | 6 |
| Endocrine
system | 5 |
| Replication and
repair | 5 |
| Signal
transduction | 5 |
| Cell growth and
death | 3 |
| Infectious
diseases | 3 |
| Neurodegenerative
diseases | 3 |
| Translation | 3 |
| Transport and
catabolism | 3 |
| Carbohydrate
metabolism | 1 |
| Cellular
immunity | 1 |
| Development | 1 |
| Endocrine and
metabolic diseases | 1 |
| Energy
metabolism | 1 |
| Folding, sorting
and degradation | 1 |
| Immune
diseases | 1 |
| Substance
dependence | 1 |
| Transcription | 1 |
Analysis of the global signal
transduction network predicts the key candidate genes regulated by
BRD4
The global signal transduction network was analysed
to screen for the key candidate genes regulated by BRD4 in U251
cells. As illustrated in Fig. 6,
the results revealed that the high degree genes were KRAS, BRAF,
calmodulin 2 (CALM2), A-Raf proto-oncogene (ARAF), RHOA, MAPK8,
phospholipase C β3 (PLCB3), MAPK10, G protein subunit α i1 (GNAI1)
and adenylate cyclase 6 (ADCY6). Among these ten genes, GNAI1 was
upregulated, and the others were downregulated (Table III).
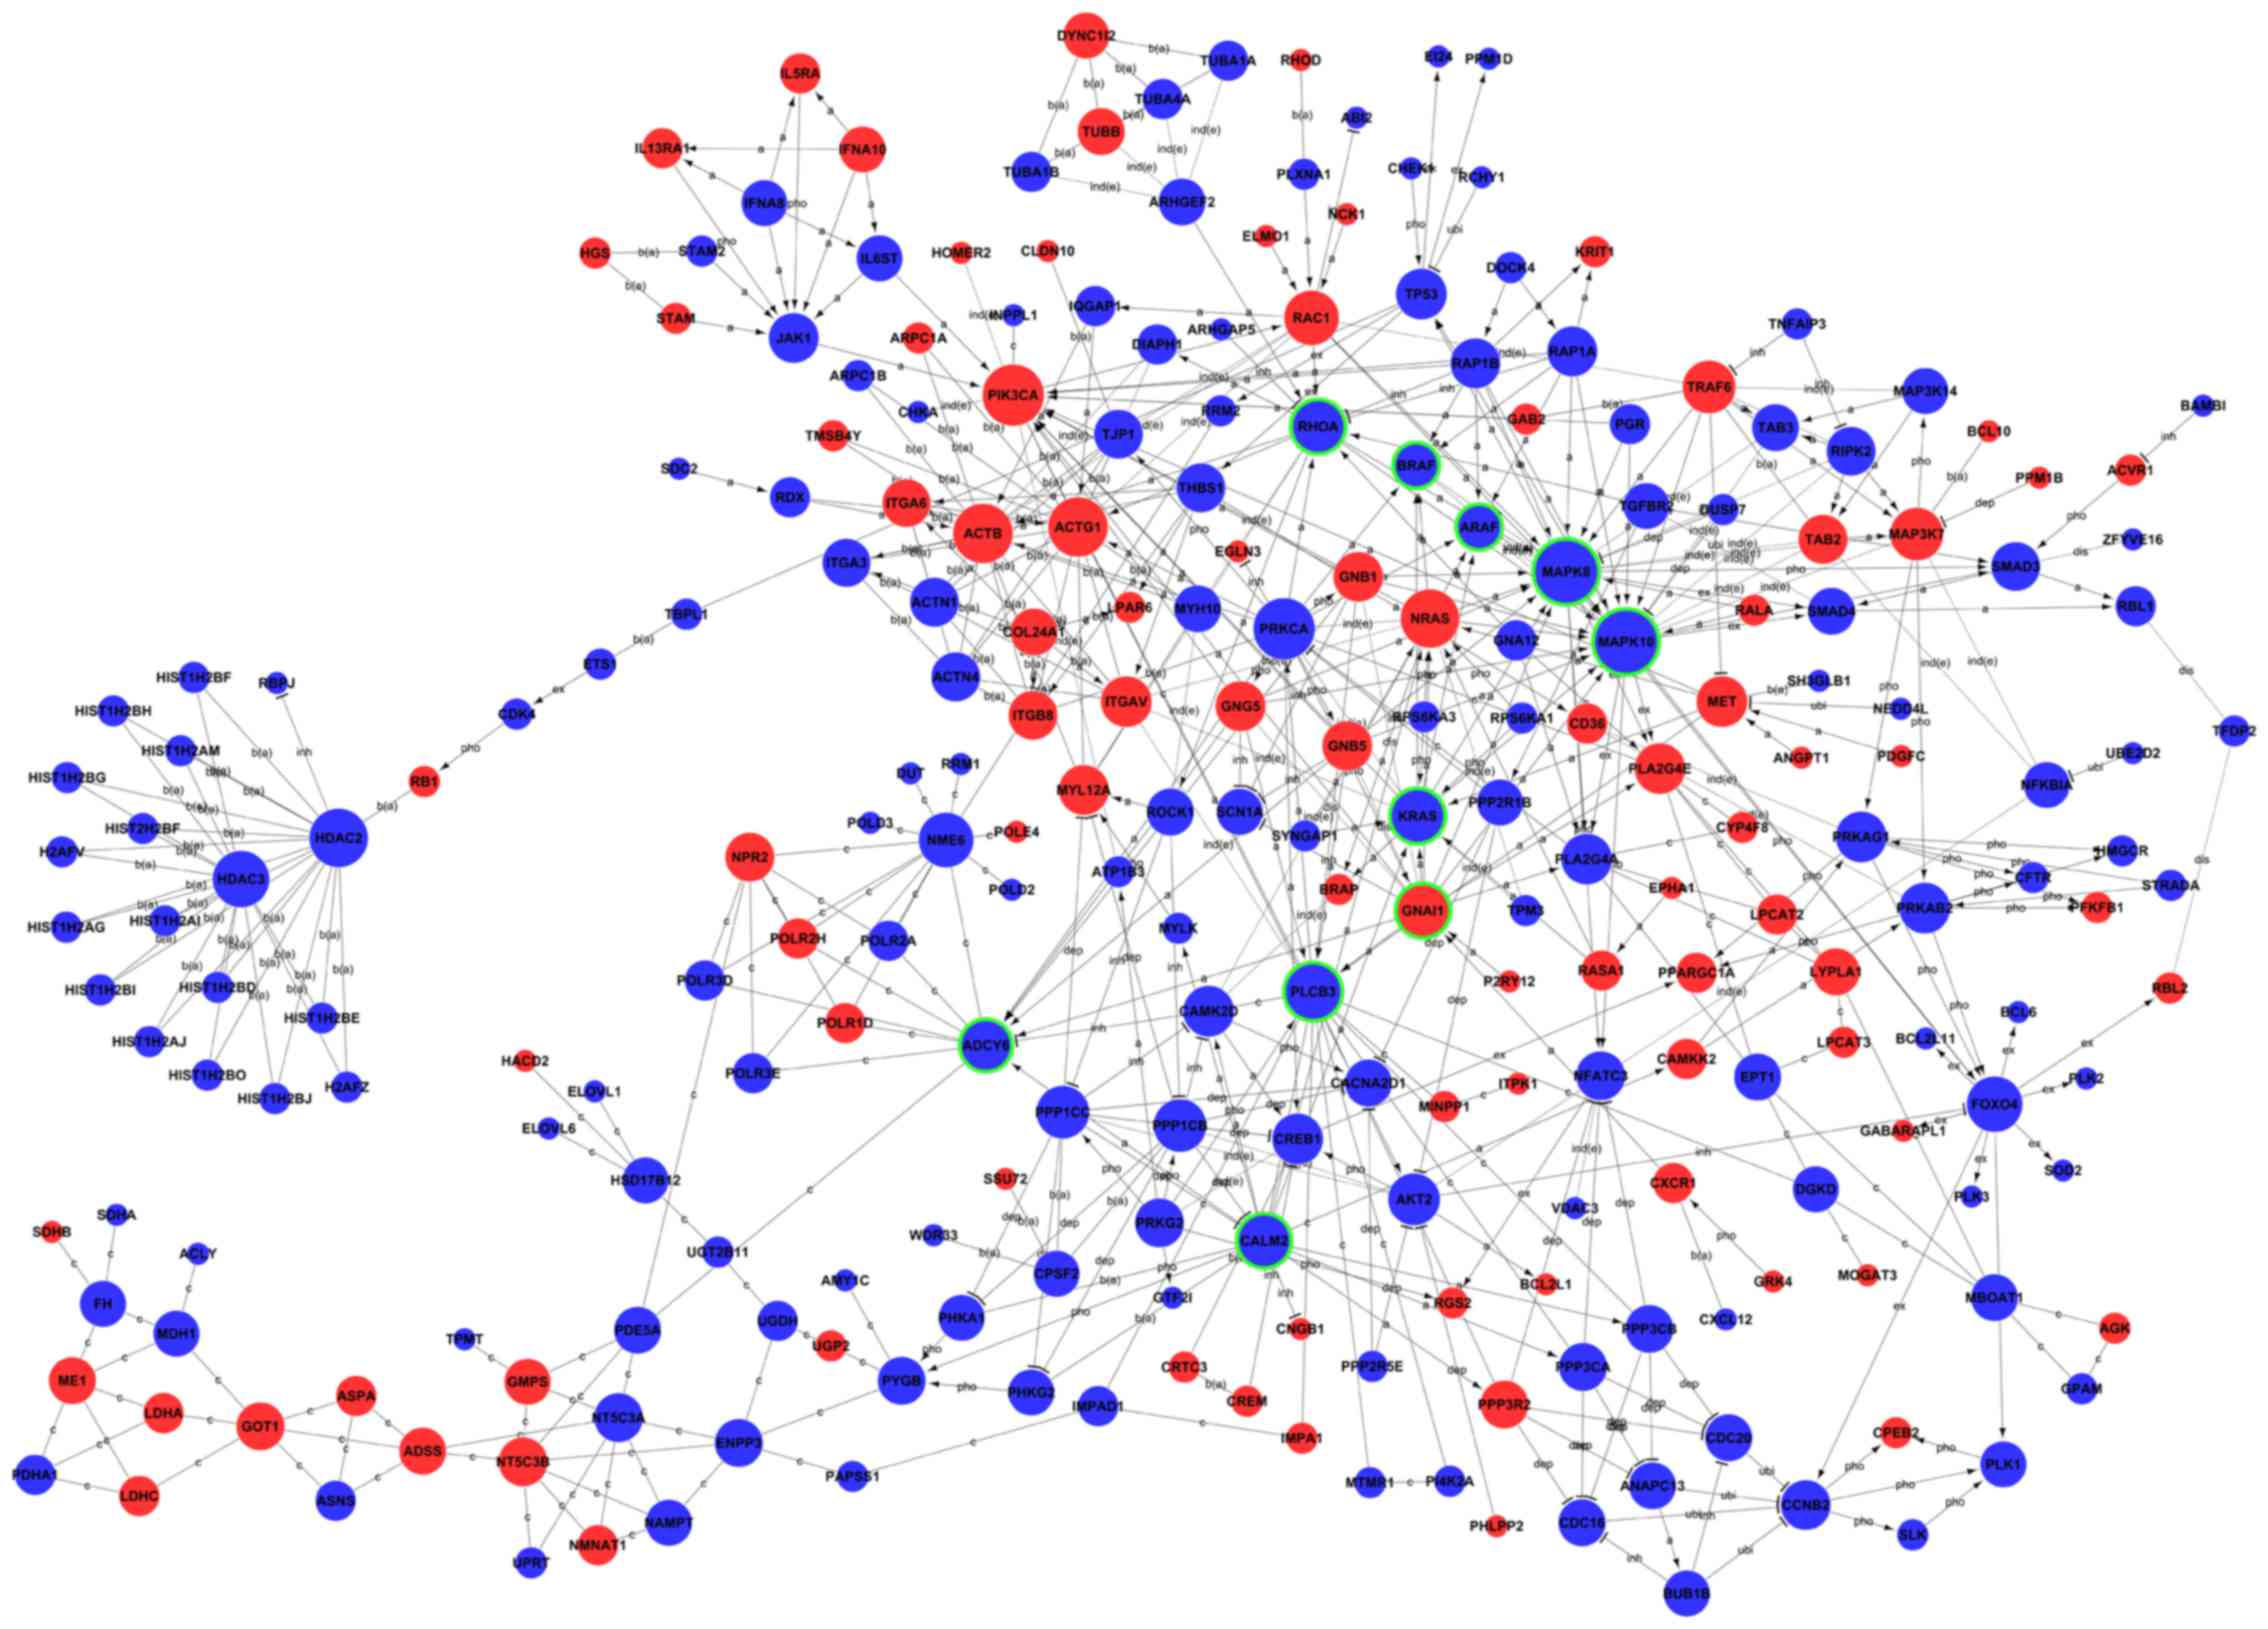 | Figure 6Global signal transduction network of
regulated genes following BRD4 knockdown. Red circles represent
upregulated genes, and blue circles represent downregulated genes.
Circles with green rings represent the genes that were selected to
be experimentally validated. The area of the circle represents the
degree, which is defined as the number of binding genes. A higher
degree indicated that the gene had a strong correlation with other
genes. The line exhibits the interaction between the genes. BRD4,
bromodomain containing 4; a, activation; dep, dephosphorylation;
pho, phosphorylation; ex, expression; b (a), binding-association;
inh, inhibition; ind (e), indirect effect; c, compound; ubi,
ubiquitination; dis, dissociation. |
| Table IIITen key genes identified by global
signal transduction network analysis. |
Table III
Ten key genes identified by global
signal transduction network analysis.
| Gene symbol | Official full
name | Degree | Indegree | Outdegree | Style |
|---|
| KRAS | KRAS proto-oncogene
GTPase | 74 | 59 | 15 | Down |
| BRAF | B-Raf
proto-oncogene serine/threonine kinase | 64 | 2 | 62 | Down |
| CALM2 | Calmodulin 2 | 59 | 54 | 5 | Down |
| ARAF | A-Raf
proto-oncogene serine/threonine kinase | 44 | 2 | 42 | Down |
| RHOA | Ras homolog family
member A | 34 | 25 | 9 | Down |
| MAPK8 | Mitogen-activated
protein kinase 8 | 33 | 8 | 25 | Down |
| PLCB3 | Phospholipase C
β3 | 33 | 13 | 20 | Down |
| MAPK10 | Mitogen-activated
protein kinase 10 | 33 | 7 | 26 | Down |
| GNAI1 | G protein subunit α
i1 | 25 | 22 | 3 | Up |
| ADCY6 | Adenylate cyclase
6 | 19 | 7 | 12 | Down |
The expression levels of these ten differentially
expressed mRNAs were validated by RT-qPCR. The relative change in
mRNA expression as detected by RT-qPCR was consistent with the
results obtained from the microarray experiment; GNAI1 was
upregulated, while the rest of the genes were downregulated
following BRD4 knockdown (Fig.
7A). In addition, the results of western blot analysis revealed
that the protein expression levels of KRAS, BRAF, RHOA, MAPK8 (also
known as JNK1) and MAPK10 (also known as JNK3) were markedly
decreased in BRD4-shRNA cells compared with Scr-shRNA cells
(Fig. 7B), further confirming the
results from the microarray analysis.
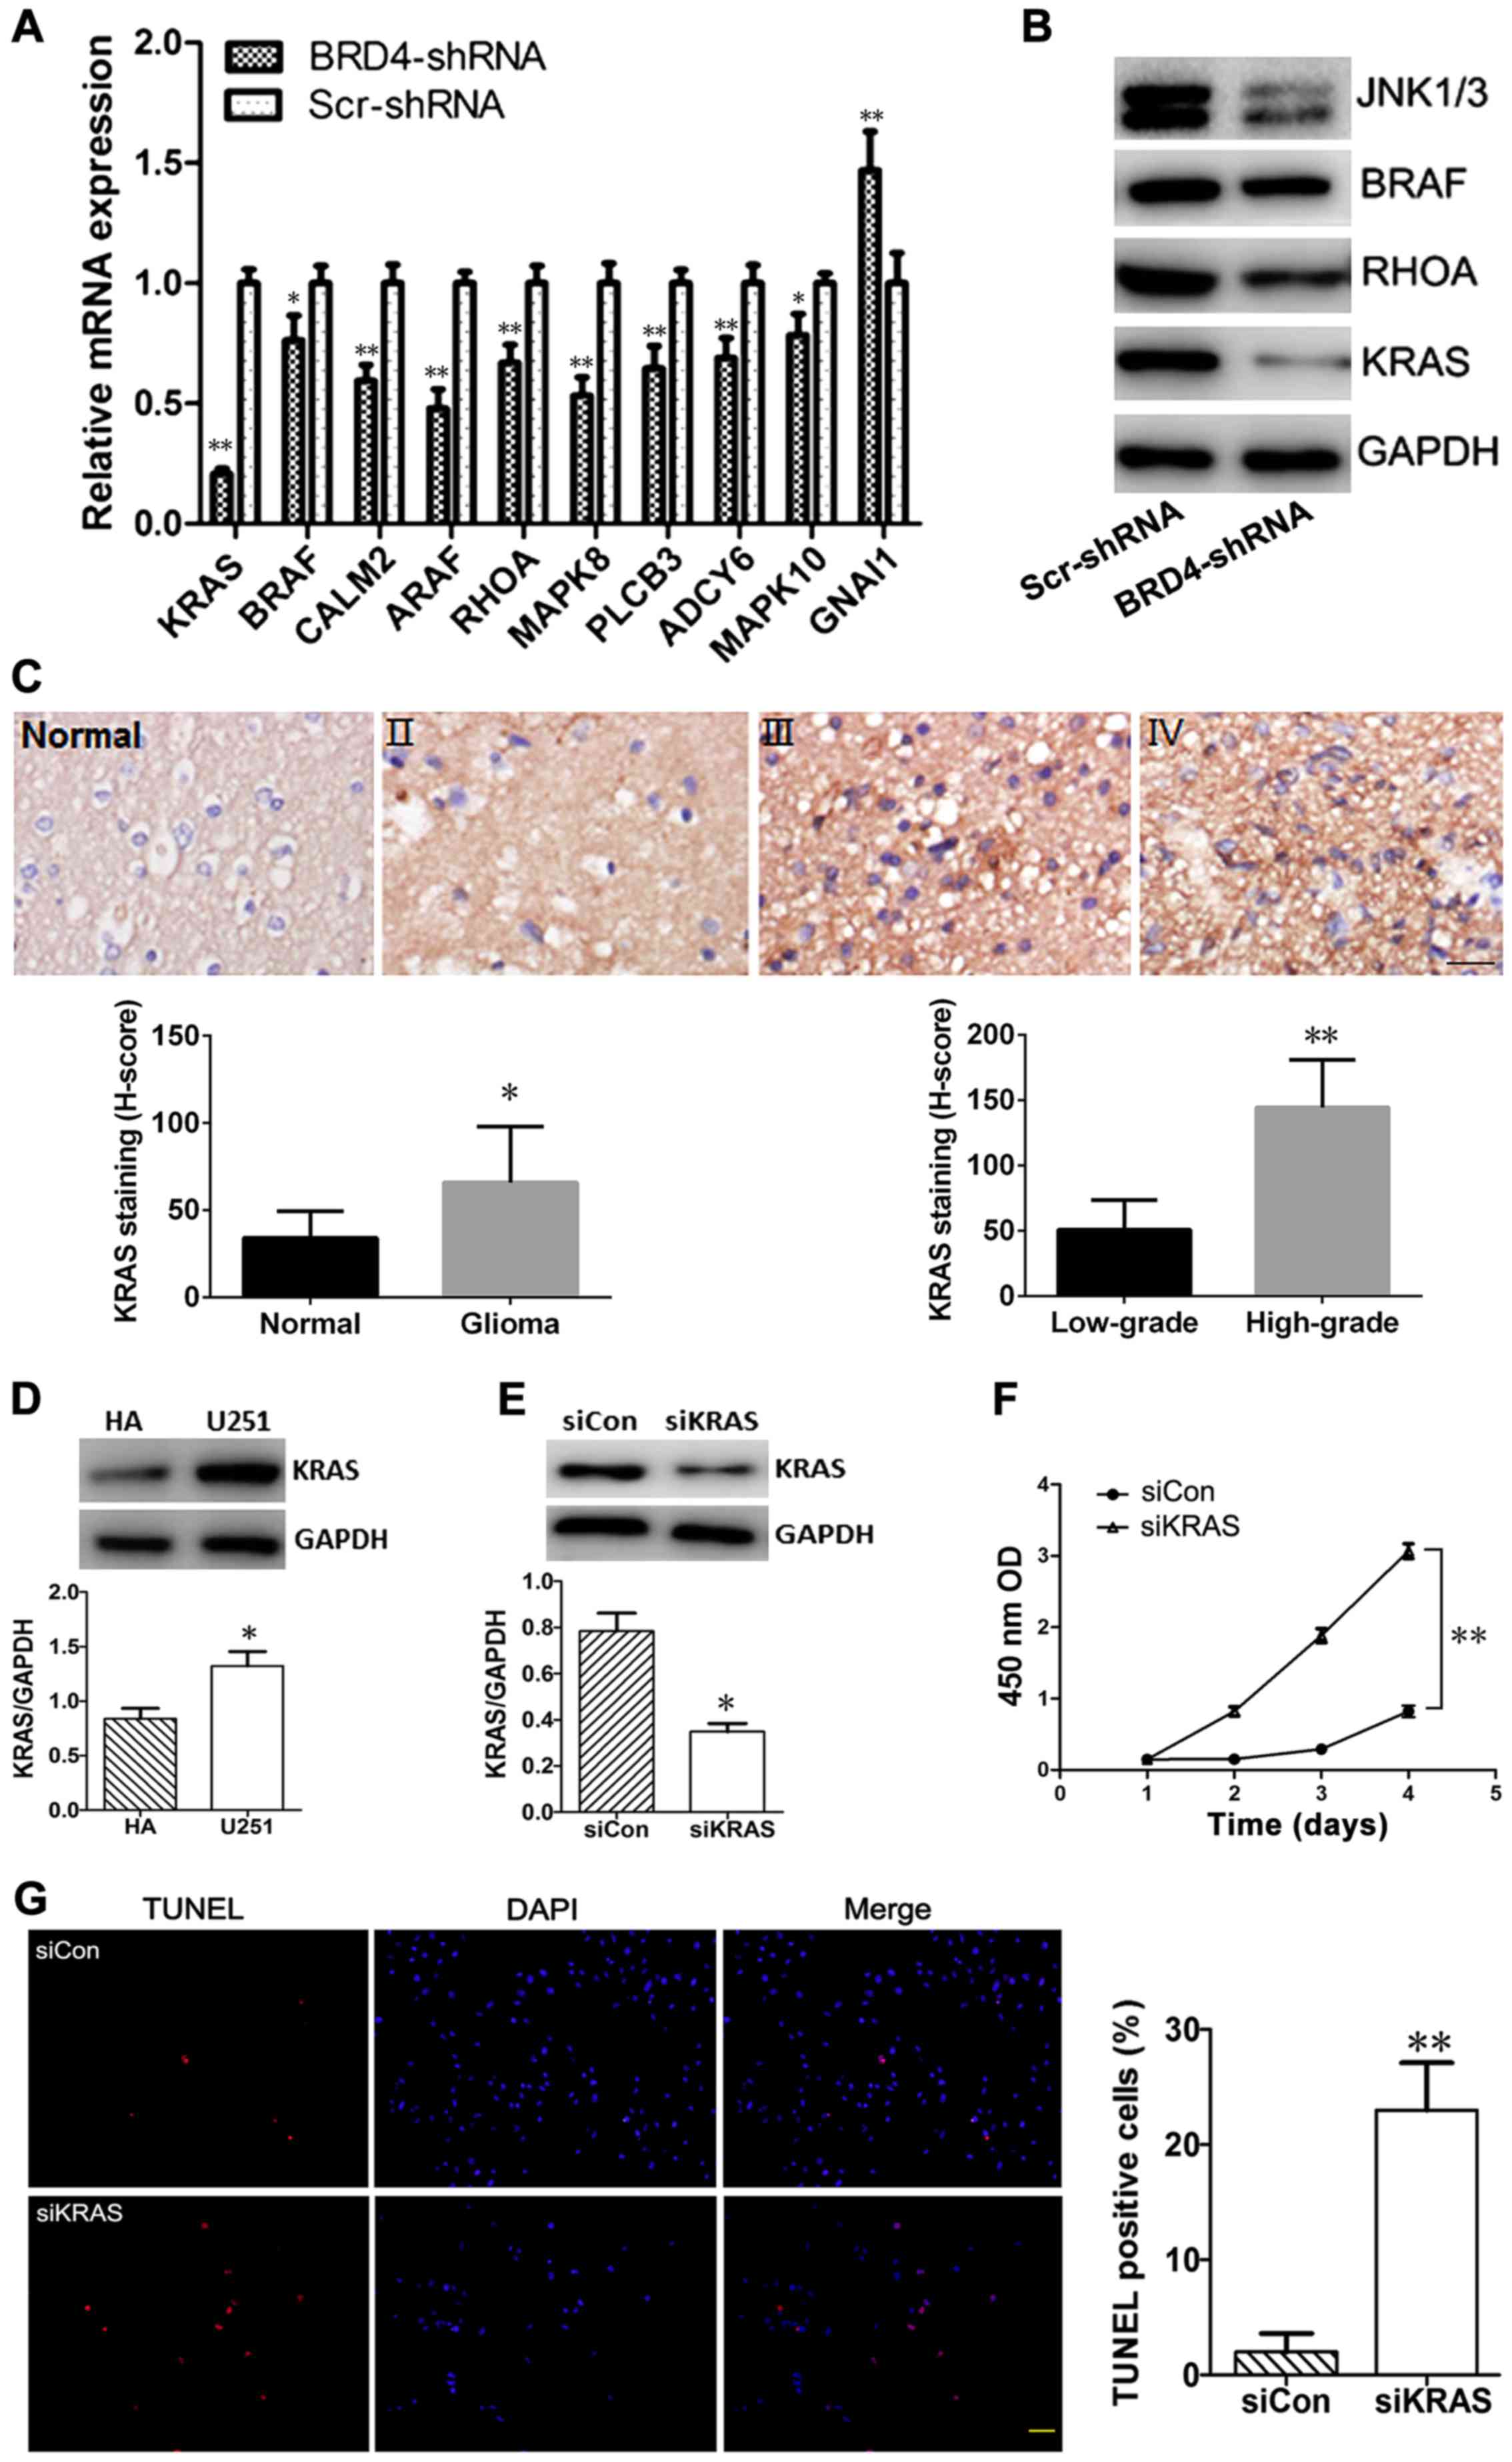 | Figure 7Experimental validation of microarray
results. (A) Reverse transcription-quantitative polymerase chain
reaction results for the mRNA expression levels of the ten key
genes identified by global signal transduction network analysis.
(B) Western blotting validation of the protein expression changes
of key genes in the BRD4-shRNA and the Scr-shRNA groups. GAPDH was
used as an internal control. (C) Representative photographs and
quantification of KRAS immunostaining in normal brain tissue and
glioma tissues of grades II, III and IV. Scale bar, 20 µm.
(D) Western blot analysis of KRAS levels in HA and U251 cells. (E)
KRAS silencing following siRNA transfection in U251 cells was
confirmed by western blotting (at 72 h post-transfection). (F) A
cell counting kit-8 assay was performed to detect the proliferation
rates of siKRAS and or siCon-transfected U251 cells. Each
experiment was performed in triplicate. (G) The apoptosis rates of
siKRAS and siCon-transfected U251 cells were determined by TUNEL
staining (red). Nuclei were counterstained with DAPI (blue). Scar
bar, 50 µm. Experimental data are presented as the mean ±
standard deviation of at least three experiments.
*P<0.05 and **P<0.01. BRD4, bromodomain
containing 4; sh, short hairpin; Scr, scrambled control; KRAS, KRAS
proto-oncogene GTPase; HA, human astrocytes; si, small interfering;
Con, control; TUNEL, terminal deoxynucleotidyl transferase dUTP
nick end labelling; OD, optical density. |
siRNA-mediated knockdown of KRAS
suppressed the growth of U251 cells
The expression of KRAS in glioma tissues was
detected by immunohistochemistry. The results demonstrated that
KRAS staining was obviously stronger in glioma tissues compared
with normal tissues (H-score, 65.88±32.22 and 34.13±15.34,
respectively; P<0.05), and the protein expression of KRAS in the
high-grade group (grade III and IV) was higher compared with the
low-grade group (144.38±36.34 and 50.83±22.80, respectively;
P<0.01). Representative images from the immunostaining of KRAS
in glioma and normal brain tissues are presented in Fig. 7C. The results of the western blot
analysis indicated that the protein expression levels of KRAS were
significantly increased in U251 cells compared with HA cells
(P<0.05; Fig. 7D).
KRAS-siRNA transfection effectively downregulated
the protein expression of KRAS in U251 cells compared with cells
transfected with control siRNA (P<0.05; Fig. 7E). Cell proliferation was measured
using the CCK-8 kit. Compared with control siRNA, KRAS-siRNA
inhibited the proliferation of U251 cells (P<0.01; Fig. 7F). Results from a TUNEL assay
demonstrated that the % of TUNEL-positive cells was significantly
higher in the KRAS-siRNA group compared with the control siRNA
group (P<0.01; Fig. 7G).
Discussion
BRD4 is a therapeutic target for multiple cancers.
Inhibition of the bromodomains in BRD4 by small molecules or by
targeting shRNAs has been extensively evaluated and proven
effective in alleviating several types of cancer (2,9–12,22–25).
Therefore, it is important to study the transcriptome and molecular
pathways controlled by BRD4 in cancer. In the present study,
microarray analysis was performed in order to explore the molecular
pathways regulated by BRD4 in glioma cells.
In the current study, BRD4 was demonstrated to be
over-expressed in U251 glioma cells compared with normal HA cells.
Then, BRD4 expression was silenced in U251 cells, and efficiency
was confirmed by RT-qPCR and western blot analyses. BRD4 knockdown
by shRNA resulted in a reduction of proliferation and induction of
apoptosis in the U251 cells.
These results implied that BRD4 may have a
pro-proliferation effect on glioma cells. Pastori et al
(26) have reported that BET
bromodomain proteins were elevated in glioblastomas and were
required for glioblastoma cell proliferation; these results are
similar with the present study. However, the present study focused
on the molecular pathways controlled by BRD4 in glioma and further
addressed BRD4-regulated mRNAs and pathways in U251 cells.
Collectively, the present results confirmed the role of BRD4 in
promoting glioma cell proliferation.
Using genome-wide transcriptional analysis, 3,529
differentially expressed genes were identified between BRD4-shRNA
and Scr-shRNA-transduced U251 cells. Among these genes, 1,648 genes
were upregulated, and 1,881 genes were downregulated, suggesting
that BRD4 acts primarily as a transcriptional activator.
GO classification and pathway analysis were
performed to understand the functional significance of the
differentially expressed genes. GO analysis organized the
differentially expressed genes into hierarchical categories
according to their pertinent biological processes. BRD4 is known to
bind acetylated lysine residues on histone tails and has been
identified as a chromatin reader that regulates many key biological
processes, including the G2/M transition, DNA replication,
chromatin remodelling, and transcriptional regulation (27–31).
The present data exhibited that BRD4 was involved in regulating
'gene expression', 'mitotic cell cycle', 'membrane organization',
'cell division', 'DNA replication', and 'G2/M transition of mitotic
cell cycle'. These results demonstrated that the genes regulated by
BRD4 in glioma had biological functions relevant to glioma growth
and the maintenance of its malignant phenotype. The tight overlap
between the existing literature and the present enrichment analysis
highlights the strength of the data from the micro-array
analysis.
Pathway analysis identified 53 pathways, and the
highest enrichment was in categories related to 'nervous system',
'cancer', 'endocrine system', and 'replication and repair'. Among
the 53 significant pathways, spliceosome, the most deregulated
pathway following BRD4 knockdown, is critical for tumorigenesis
(32–34). Other enriched pathways altered in
the analysis were DNA replication, cell cycle, FoxO signalling
pathway, transcriptional misregulation, Wnt signalling pathway,
insulin signalling pathway, apoptosis and TGF-β signalling pathway,
all of which are closely associated with cancer development
(35–39). For instance, the FoxO signalling
pathway contributes to the maintenance of leukemia-initiating cells
in acute and chronic myeloid leukemia (35). The Wnt signalling pathway is
frequently dysregulated in multiple tumour types and has critical
roles in tumour progression (40–44).
Emerging evidence has suggested that glioma formation and
progression are associated with dysregulation of many Wnt
signalling pathway components involved in the regulation of
migration, invasion, and proliferation of malignant glioma cells
(45–47). The pathway analysis of
BRD4-regulated genes revealed the key role of BRD4 in the
occurrence and development of glioma.
To screen for the key genes regulated by BRD4 in
glioma development, a global signal transduction network analysis
was performed by overlapping the significantly regulated GOs and
pathways in the present study. KRAS, BRAF, CALM2, ARAF, RHOA,
MAPK8, PLCB3, MAPK10, GNAI1 and ADCY6 were selected as candidate
genes. Among the ten genes, KRAS, having the highest degrees, is
one of the most widely known oncogenes. KRAS is a member of the RAS
family and is reportedly involved in the progression of numerous
tumours, such as pilocytic astrocytoma (48) and glioblastoma (49). The present results suggested that
KRAS was upregulated in glioma compared with the normal controls,
and its expression was decreased in U251 cells transduced with
BRD4-shRNA. Downregulation of KRAS expression by KRAS-specific
siRNA attenuated the proliferation and promoted the apoptosis of
U251 cells. This effect was similar to the effect of BRD4 knockdown
on U251 cells. Therefore, it can be speculated that the
BRD4-mediated proliferation of glioma cells might occur through
regulating KRAS and subsequently the Ras pathway. The inhibition of
BRD4 by siRNA or inhibitors has exhibited potent anticancer effects
in several types of cancer, including osteosarcoma, leukemia,
lymphoma, lung cancer and prostate cancer (10,13,50,51).
However, the precise molecular mechanisms mediating the actions of
BET inhibition in glioblastoma remain elusive.
c-MYC is a well-known and important transcription
factor gene directly regulated by BRD4, and inhibiting BET
bromodomains effectively reduces cell proliferation and tumour
growth, mainly through the downregulation of c-MYC (11,52).
However, several studies have proposed that c-MYC may not be the
only transcriptional target of BET proteins and demonstrated that
other genes undergoing expressional changes simultaneously
contributed to the decrease of cell proliferation (10,15,22).
Cheng et al (14) reported
that downregulation of c-MYC upon BRD4 inhibition was rather modest
and appeared to only serve a minor role in mediating the effects of
JQ1 in glioblastoma of different genetic background. This indicates
the existence of additional, unidentified targets of BRD4 in
glioma. The main purpose of the present study was to screen for
novel potential targets of BRD4 in glioma through microarray
analysis. Consistent with the observations of Cheng et al,
the present microarray results demonstrated that the mRNA
expression of c-MYC was not significantly changed in the BRD4-shRNA
group compared with the control group (expression levels, 6.14 vs.
6.93, respectively; P=0.08), and c-MYC was not in a core position
of the global gene-gene interaction network. These results
indicated that the effects of BRD4 in carcinogenesis are mediated
by complex mechanisms including, but not limited, to MYC-mediated
transcriptional regulation.
The discovery that KRAS might be a downstream
mediator of BRD4 in glioma will help us better understand the
potential activity of BRD4 inhibitors and the central BET-dependent
transcriptional program. In addition, the ability of BRD4
inhibition to reduce expression of KRAS highlights the potential of
this novel therapeutic strategy to improve treatment for cancers
that require KRAS activity. However, it remains to be determined
whether BRD4 activates KRAS directly or indirectly and whether the
effect of BRD4 inhibition in glioma is KRAS-dependent. Although
several BRD4 chromatin immunoprecipitation (ChIP)-sequencing data
have been previously published (accession nos. GSM2635249,
GSM823382 and GSM823378), those ChIP assays were performed in K562
cells (53), human embryonic stem
cells (54), and human
CD4+ T cells (54),
respectively. The target genes of BRD4 might be different in
different tissues. For example, FoxM1 is a target of BRD4 in
ovarian cancer (15), and
interleukin 7 receptor is a target of BRD4 in lymphoblastic
leukemia (10). Therefore, ChIP
experiments will be necessary to determine whether KRAS is a direct
target of BRD4 in glioma in further studies.
In conclusion, a comprehensive analysis of the gene
expression profiles of U251 cells with or without BRD4 knockdown
was conducted. The strong overlap between the existing literature
and the present enrichment analysis highlights the robustness of
the results obtained in the current study. This integrated analysis
provides information for further research on the molecular
mechanisms of BRD4 in glioma tumorigenesis.
Acknowledgments
We thank Dr Jing Li (Cnkingbio Company, Ltd.,
Beijing, China) for technical support.
Notes
[1]
Funding
This study was supported by the Natural Science
Foundation of Shandong Province (grant no. ZR2013HQ057), the
Medical Science and Technology Development Plan of Shandong
Province (grant nos. 2014WS0147 and 2014WS0416), the Shandong
Province outstanding Young Scientists Research Award Fund (grant
no. BS2015YY026), the China Postdoctoral Science Foundation (grant
nos. 2015M572055, 2016M590642 and 2016M600543), and the Shandong
Postdoctoral Innovation Fund (grant no. 20160213).
[2] Author's
contributions
ZD performed experiments, contributed to analysis
and interpretation of the data, and was a major contributor in
writing the manuscript. XS and FY performed experiments, and
contributed in drafting and revising the manuscript. JW collected
the clinical data, helped to perform the cell experiments, and
contributed in the revision of the manuscript. YZ and SL
contributed to the conception and design of the study, the data
analysis and interpretation, and the writing and revision of the
manuscript, as well as were responsible for acquisition of funding.
All authors read and approved the final manuscript.
[3] Availability
of data and materials
The microarray data discussed in this article are
publicly available at the NCBI Gene Expression Omnibus (GEO) under
the accession number GSE 97791.
[4] Ethics
approval and consent to participate
The study was approved by the Ethics Committee of
Qilu Hospital (Jinan, China), and informed written consent was
obtained from each patient.
[5] Consent for
publication
Not applicable.
[6] Competing
interests
The authors declare that they have no competing
interests.
References
|
1
|
Stupp R, Mason WP, van den Bent MJ, Weller
M, Fisher B, Taphoorn MJ, Belanger K, Brandes AA, Marosi C, Bogdahn
U, et al European Organisation for Research and Treatment of Cancer
Brain Tumor and Radiotherapy Groups; National Cancer Institute of
Canada Clinical Trials Group: Radiotherapy plus concomitant and
adjuvant temozolomide for glioblastoma. N Engl J Med. 352:987–996.
2005. View Article : Google Scholar : PubMed/NCBI
|
|
2
|
Dawson MA, Prinjha RK, Dittmann A,
Giotopoulos G, Bantscheff M, Chan WI, Robson SC, Chung CW, Hopf C,
Savitski MM, et al: Inhibition of BET recruitment to chromatin as
an effective treatment for MLL-fusion leukaemia. Nature.
478:529–533. 2011. View Article : Google Scholar : PubMed/NCBI
|
|
3
|
Andrieu G, Tran AH, Strissel KJ and Denis
GV: BRD4 regulates breast cancer dissemination through
Jagged1/Notch1 signaling. Cancer Res. 76:6555–6567. 2016.
View Article : Google Scholar : PubMed/NCBI
|
|
4
|
Papavassiliou KA and Papavassiliou AG:
Bromodomains: Pockets with therapeutic potential. Trends Mol Med.
20:477–478. 2014. View Article : Google Scholar : PubMed/NCBI
|
|
5
|
Filippakopoulos P and Knapp S: Targeting
bromodomains: Epigenetic readers of lysine acetylation. Nat Rev
Drug Discov. 13:337–356. 2014. View
Article : Google Scholar : PubMed/NCBI
|
|
6
|
Dhalluin C, Carlson JE, Zeng L, He C,
Aggarwal AK and Zhou MM: Structure and ligand of a histone
acetyltransferase bromodomain. Nature. 399:491–496. 1999.
View Article : Google Scholar : PubMed/NCBI
|
|
7
|
Jang MK, Mochizuki K, Zhou M, Jeong HS,
Brady JN and Ozato K: The bromodomain protein Brd4 is a positive
regulatory component of P-TEFb and stimulates RNA polymerase
II-dependent transcription. Mol Cell. 19:523–534. 2005. View Article : Google Scholar : PubMed/NCBI
|
|
8
|
Zeng L and Zhou MM: Bromodomain: An
acetyl-lysine binding domain. FEBS Lett. 513:124–128. 2002.
View Article : Google Scholar : PubMed/NCBI
|
|
9
|
Segura MF, Fontanals-Cirera B,
Gaziel-Sovran A, Guijarro MV, Hanniford D, Zhang G, González-Gomez
P, Morante M, Jubierre L, Zhang W, et al: BRD4 sustains melanoma
proliferation and represents a new target for epigenetic therapy.
Cancer Res. 73:6264–6276. 2013. View Article : Google Scholar : PubMed/NCBI
|
|
10
|
Lockwood WW, Zejnullahu K, Bradner JE and
Varmus H: Sensitivity of human lung adenocarcinoma cell lines to
targeted inhibition of BET epigenetic signaling proteins. Proc Natl
Acad Sci USA. 109:19408–19413. 2012. View Article : Google Scholar : PubMed/NCBI
|
|
11
|
Delmore JE, Issa GC, Lemieux ME, Rahl PB,
Shi J, Jacobs HM, Kastritis E, Gilpatrick T, Paranal RM, Qi J, et
al: BET bromodomain inhibition as a therapeutic strategy to target
c-Myc. Cell. 146:904–917. 2011. View Article : Google Scholar : PubMed/NCBI
|
|
12
|
Zuber J, Shi J, Wang E, Rappaport AR,
Herrmann H, Sison EA, Magoon D, Qi J, Blatt K, Wunderlich M, et al:
RNAi screen identifies Brd4 as a therapeutic target in acute
myeloid leukaemia. Nature. 478:524–528. 2011. View Article : Google Scholar : PubMed/NCBI
|
|
13
|
Rahl PB, Lin CY, Seila AC, Flynn RA,
McCuine S, Burge CB, Sharp PA and Young RA: c-Myc regulates
transcriptional pause release. Cell. 141:432–445. 2010. View Article : Google Scholar : PubMed/NCBI
|
|
14
|
Cheng Z, Gong Y, Ma Y, Lu K, Lu X, Pierce
LA, Thompson RC, Muller S, Knapp S and Wang J: Inhibition of BET
bromodomain targets genetically diverse glioblastoma. Clin Cancer
Res. 19:1748–1759. 2013. View Article : Google Scholar : PubMed/NCBI
|
|
15
|
Zhang Z, Ma P, Jing Y, Yan Y, Cai MC,
Zhang M, Zhang S, Peng H, Ji ZL, Di W, et al: BET Bromodomain
inhibition as a therapeutic strategy in ovarian cancer by
downregulating FoxM1. Theranostics. 6:219–230. 2016. View Article : Google Scholar : PubMed/NCBI
|
|
16
|
Liao YF, Wu YB, Long X, Zhu SQ, Jin C, Xu
JJ and Ding JY: High level of BRD4 promotes non-small cell lung
cancer progression. Oncotarget. 7:9491–9500. 2016. View Article : Google Scholar : PubMed/NCBI
|
|
17
|
Du Z, Jia D, Liu S, Wang F, Li G, Zhang Y,
Cao X, Ling EA and Hao A: Oct4 is expressed in human gliomas and
promotes colony formation in glioma cells. Glia. 57:724–733. 2009.
View Article : Google Scholar
|
|
18
|
Azim HA Jr, Peccatori FA, Brohée S,
Branstetter D, Loi S, Viale G, Piccart M, Dougall WC, Pruneri G and
Sotiriou C: RANK-ligand (RANKL) expression in young breast cancer
patients and during pregnancy. Breast Cancer Res. 17:242015.
View Article : Google Scholar : PubMed/NCBI
|
|
19
|
Yeo W, Chan SL, Mo FK, Chu CM, Hui JW,
Tong JH, Chan AW, Koh J, Hui EP, Loong H, et al: Phase I/II study
of temsirolimus for patients with unresectable Hepatocellular
Carcinoma (HCC)-a correlative study to explore potential biomarkers
for response. BMC Cancer. 15:3952015. View Article : Google Scholar
|
|
20
|
Livak KJ and Schmittgen TD: Analysis of
relative gene expression data using real-time quantitative PCR and
the 2(−Delta Delta C(T)) method. Methods. 25:402–408. 2001.
View Article : Google Scholar
|
|
21
|
Saldanha AJ: Java Treeview - extensible
visualization of microarray data. Bioinformatics. 20:3246–3248.
2004. View Article : Google Scholar : PubMed/NCBI
|
|
22
|
Asangani IA, Dommeti VL, Wang X, Malik R,
Cieslik M, Yang R, Escara-Wilke J, Wilder-Romans K, Dhanireddy S,
Engelke C, et al: Therapeutic targeting of BET bromodomain proteins
in castration-resistant prostate cancer. Nature. 510:278–282. 2014.
View Article : Google Scholar : PubMed/NCBI
|
|
23
|
Bandopadhayay P, Bergthold G, Nguyen B,
Schubert S, Gholamin S, Tang Y, Bolin S, Schumacher SE, Zeid R,
Masoud S, et al: BET bromodomain inhibition of MYC-amplified
medulloblastoma. Clin Cancer Res. 20:912–925. 2014. View Article : Google Scholar
|
|
24
|
Shi J, Wang Y, Zeng L, Wu Y, Deng J, Zhang
Q, Lin Y, Li J, Kang T, Tao M, et al: Disrupting the interaction of
BRD4 with diacetylated Twist suppresses tumorigenesis in basal-like
breast cancer. Cancer Cell. 25:210–225. 2014. View Article : Google Scholar :
|
|
25
|
Whyte WA, Orlando DA, Hnisz D, Abraham BJ,
Lin CY, Kagey MH, Rahl PB, Lee TI and Young RA: Master
transcription factors and mediator establish super-enhancers at key
cell identity genes. Cell. 153:307–319. 2013. View Article : Google Scholar : PubMed/NCBI
|
|
26
|
Pastori C, Daniel M, Penas C, Volmar CH,
Johnstone AL, Brothers SP, Graham RM, Allen B, Sarkaria JN, Komotar
RJ, et al: BET bromodomain proteins are required for glioblastoma
cell proliferation. Epigenetics. 9:611–620. 2014. View Article : Google Scholar : PubMed/NCBI
|
|
27
|
Dawson MA, Kouzarides T and Huntly BJP:
Targeting epigenetic readers in cancer. N Engl J Med. 367:647–657.
2012. View Article : Google Scholar : PubMed/NCBI
|
|
28
|
Muller S, Filippakopoulos P and Knapp S:
Bromodomains as therapeutic targets. Expert Rev Mol Med.
13:e292011. View Article : Google Scholar :
|
|
29
|
Belkina AC and Denis GV: BET domain
co-regulators in obesity, inflammation and cancer. Nat Rev Cancer.
12:465–477. 2012. View Article : Google Scholar : PubMed/NCBI
|
|
30
|
Dey A, Ellenberg J, Farina A, Coleman AE,
Maruyama T, Sciortino S, Lippincott-Schwartz J and Ozato K: A
bromodomain protein, MCAP, associates with mitotic chromosomes and
affects G(2)-to-M transition. Mol Cell Biol. 20:6537–6549. 2000.
View Article : Google Scholar : PubMed/NCBI
|
|
31
|
Dey A, Chitsaz F, Abbasi A, Misteli T and
Ozato K: The double bromodomain protein Brd4 binds to acetylated
chromatin during interphase and mitosis. Proc Natl Acad Sci USA.
100:8758–8763. 2003. View Article : Google Scholar : PubMed/NCBI
|
|
32
|
Hsu TY, Simon LM, Neill NJ, Marcotte R,
Sayad A, Bland CS, Echeverria GV, Sun T, Kurley SJ, Tyagi S, et al:
The spliceosome is a therapeutic vulnerability in MYC-driven
cancer. Nature. 525:384–388. 2015. View Article : Google Scholar : PubMed/NCBI
|
|
33
|
Hahn CN, Venugopal P, Scott HS and Hiwase
DK: Splice factor mutations and alternative splicing as drivers of
hematopoietic malignancy. Immunol Rev. 263:257–278. 2015.
View Article : Google Scholar
|
|
34
|
Wojtuszkiewicz A, Assaraf YG, Maas MJ,
Kaspers GJ, Jansen G and Cloos J: Pre-mRNA splicing in cancer: The
relevance in oncogenesis, treatment and drug resistance. Expert
Opin Drug Metab Toxicol. 11:673–689. 2015. View Article : Google Scholar
|
|
35
|
Coomans de Brachène A and Demoulin JB:
FOXO transcription factors in cancer development and therapy. Cell
Mol Life Sci. 73:1159–1172. 2016. View Article : Google Scholar
|
|
36
|
Powathil GG, Gordon KE, Hill LA and
Chaplain MA: Modelling the effects of cell-cycle heterogeneity on
the response of a solid tumour to chemotherapy: Biological insights
from a hybrid multiscale cellular automaton model. J Theor Biol.
308:1–19. 2012. View Article : Google Scholar : PubMed/NCBI
|
|
37
|
Hallett RM, Huang C, Motazedian A, Auf der
Mauer S, Pond GR, Hassell JA, Nordon RE and Draper JS:
Treatment-induced cell cycle kinetics dictate tumor response to
chemotherapy. Oncotarget. 6:7040–7052. 2015. View Article : Google Scholar : PubMed/NCBI
|
|
38
|
Koval A, Ahmed K and Katanaev VL:
Inhibition of Wnt signalling and breast tumour growth by the
multi-purpose drug suramin through suppression of heterotrimeric G
proteins and Wnt endocytosis. Biochem J. 473:371–381. 2016.
View Article : Google Scholar
|
|
39
|
Leek RD, Stratford I and Harris AL: The
role of hypoxia-inducible factor-1 in three-dimensional tumor
growth, apoptosis, and regulation by the insulin-signaling pathway.
Cancer Res. 65:4147–4152. 2005. View Article : Google Scholar : PubMed/NCBI
|
|
40
|
Sawa M, Masuda M and Yamada T: Targeting
the Wnt signaling pathway in colorectal cancer. Expert Opin Ther
Targets. 20:419–429. 2016. View Article : Google Scholar
|
|
41
|
Ramos-Solano M, Álvarez-Zavala M,
García-Castro B, Jave-Suárez LF and Aguilar-Lemarroy A: Wnt
signalling pathway and cervical cancer. Rev Med Inst Mex Seguro
Soc. 53(Suppl 2): S218–S224. 2015.In Spanish.
|
|
42
|
Yong X, Tang B, Xiao YF, Xie R, Qin Y, Luo
G, Hu CJ, Dong H and Yang SM: Helicobacter pylori upregulates Nanog
and Oct4 via Wnt/β-catenin signaling pathway to promote cancer stem
cell-like properties in human gastric cancer. Cancer Lett.
374:292–303. 2016. View Article : Google Scholar : PubMed/NCBI
|
|
43
|
Yang L, Tang H, Kong Y, Xie X, Chen J,
Song C, Liu X, Ye F, Li N, Wang N, et al: LGR5 Promotes Breast
Cancer Progression and Maintains Stem-Like Cells Through Activation
of Wnt/β-Catenin Signaling. Stem Cells. 33:2913–2924. 2015.
View Article : Google Scholar : PubMed/NCBI
|
|
44
|
Zhi X, Lin L, Yang S, Bhuvaneshwar K, Wang
H, Gusev Y, Lee MH, Kallakury B, Shivapurkar N, Cahn K, et al:
βII-Spectrin (SPTBN1) suppresses progression of hepatocellular
carcinoma and Wnt signaling by regulation of Wnt inhibitor
kallistatin. Hepatology. 61:598–612. 2015. View Article : Google Scholar :
|
|
45
|
Zhang N, Wei P, Gong A, Chiu WT, Lee HT,
Colman H, Huang H, Xue J, Liu M, Wang Y, et al: FoxM1 promotes
β-catenin nuclear localization and controls Wnt target-gene
expression and glioma tumorigenesis. Cancer Cell. 20:427–442. 2011.
View Article : Google Scholar : PubMed/NCBI
|
|
46
|
Zheng H, Ying H, Wiedemeyer R, Yan H,
Quayle SN, Ivanova EV, Paik JH, Zhang H, Xiao Y, Perry SR, et al:
LAGL2 regulates Wnt signaling to impede differentiation in neural
stem cells and gliomas. Cancer Cell. 17:497–509. 2010. View Article : Google Scholar : PubMed/NCBI
|
|
47
|
Jiang X, Yu Y, Yang HW, Agar NY, Frado L
and Johnson MD: The imprinted gene PEG3 inhibits Wnt signaling and
regulates glioma growth. J Biol Chem. 285:8472–8480. 2010.
View Article : Google Scholar : PubMed/NCBI
|
|
48
|
Ryu MJ, Liu Y, Zhong X, Du J, Peterson N,
Kong G, Li H, Wang J, Salamat S, Chang Q, et al: Oncogenic Kras
expression in post-mitotic neurons leads to S100A8-S100A9 protein
overexpression and gliosis. J Biol Chem. 287:22948–22958. 2012.
View Article : Google Scholar : PubMed/NCBI
|
|
49
|
Milinkovic VP, Skender Gazibara MK,
Manojlovic Gacic EM, Gazibara TM and Tanic NT: The impact of TP53
and RAS mutations on cerebellar glioblastomas. Exp Mol Pathol.
97:202–207. 2014. View Article : Google Scholar : PubMed/NCBI
|
|
50
|
Lee DH, Qi J, Bradner JE, Said JW, Doan
NB, Forscher C, Yang H and Koeffler HP: Synergistic effect of JQ1
and rapamycin for treatment of human osteosarcoma. Int J Cancer.
136:2055–2064. 2015. View Article : Google Scholar
|
|
51
|
Chapuy B, McKeown MR, Lin CY, Monti S,
Roemer MG, Qi J, Rahl PB, Sun HH, Yeda KT, Doench JG, et al:
Discovery and characterization of super-enhancer-associated
dependencies in diffuse large B cell lymphoma. Cancer Cell.
24:777–790. 2013. View Article : Google Scholar : PubMed/NCBI
|
|
52
|
Mertz JA, Conery AR, Bryant BM, Sandy P,
Balasubramanian S, Mele DA, Bergeron L and Sims RJ III: Targeting
MYC dependence in cancer by inhibiting BET bromodomains. Proc Natl
Acad Sci USA. 108:16669–16674. 2011. View Article : Google Scholar : PubMed/NCBI
|
|
53
|
Liu X, Zhang Y, Chen Y, Li M, Zhou F, Li
K, Cao H, Ni M, Liu Y, Gu Z, et al: In situ capture of chromatin
interactions by biotinylated dCas9. Cell. 170:1028–1043.e19. 2017.
View Article : Google Scholar : PubMed/NCBI
|
|
54
|
Zhang W, Prakash C, Sum C, Gong Y, Li Y,
Kwok JJ, Thiessen N, Pettersson S, Jones SJ, Knapp S, et al:
Bromodomain-containing protein 4 (BRD4) regulates RNA polymerase II
serine 2 phosphorylation in human CD4+ T cells. J Biol
Chem. 287:43137–43155. 2012. View Article : Google Scholar : PubMed/NCBI
|