Introduction
Breast cancer (BC) is the most prevalent type of
cancer affecting women, and the second most common type of cancer
as a whole. Globally, the incidence of BC is one in nine women
(1). Despite substantial
advancements in diagnosis and treatment, the mortality rates for BC
are still at 15% (2).
One of the most aggressive variants of BC is
triple-negative BC (TNBC). This subgroup of BC cells does not
express the receptors for estrogen (ER), progesterone receptor (PR)
and human epidermal growth factor 2 (HER2). The absence of these
proteins renders commonly used clinical interventions, such as
inhibiting aromatase and blocking hormone receptors ineffectual for
TNBC therapy (3,4). Treatment is therefore limited to
surgical resection and adjuvant chemotherapy, making TNBC a
significant unmet clinical need (5).
Synthetic glucocorticoids, such as dexamethasone are
commonly used in tumor therapy (6). However, recent data have indicated
that mortality is increased in patients with TNBC variants
overexpressing glucocorticoid receptor (GR). GR signaling activates
oncogenes, inhibits apoptosis and represses tumor suppressor genes
in TNBC, leading to unfavorable clinical outcomes (7). A high GR expression is also
associated with therapy resistance and increased recurrence
(8).
In addition to regulating protein-coding genes, GR
is known to activate non-coding RNAs, including microRNAs (miRNAs
or miRs) (9). These molecules of
18-22 nt in length modulate cellular gene expression by
specifically binding complementary mRNA sequences and repressing
their translation. Highly malignant tumor cells commonly display
dysregulated miRNA profiles, leading to oncogenic and
anti-apoptotic signaling (10).
For TNBC, previous studies have discovered signatures of altered
miRNA expression that distinguish cancer cells from surrounding
tissues, and predict the receptor status for ER, PR and HER2
(11,12). Additionally, the analysis of miRNAs
highlights the heterogeneity of TNBC phenotypes and their
respective signaling pathways (13). Unraveling miRNA regulation for
individual TNBC variants is therefore crucial to understand
pathogenesis and draw consequences about potential therapeutic
interventions.
Recent studies have indicated that TNBC modulates
distant cells by secreting signaling factors, including
extracellular vesicles (EVs). EVs shed from tumor cells are
enriched in specific miRNAs that might contribute to tumor
progression and metastasis (14).
Indeed, BC EVs have been found to induce the proliferation,
migration and invasion of recipient cells, thus enhancing disease
progression (15–17). Exploiting circulating miRNAs for
the diagnosis and prognosis of TNBC patients might yield powerful
biomarkers that are easily accessible via liquid biopsy (18).
To the best of our knowledge, however, to date,
there is no study available investigating the effects of GR
signaling on miRNA regulation in TNBC. Thus, in this study, to
address this knowledge gap, we analyzed cellular and vesicular
miRNA profiles in an in vitro model of GR-overexpressing
TNBC by high-throughput next-generation sequencing (NGS).
Surprisingly, no statistically significant alterations in EV miRNAs
were detected in two TNBC cell lines upon GR overexpression. We
did, however, detect a small set of cellular miRNAs regulated by GR
in a cell line-specific manner. As the validation of miRNA target
genes yielded ambiguous results, we concluded that the unfavorable
influence of a high GR expression on TNBC phenotypes is not
mediated by miRNAs to a significant extent.
Materials and methods
TNBC cell culture and transfection
The human TNBC cell lines, MDA-MB-231, MDA-MB-436
and MDA-MB-468, were purchased from the Leibnitz Institute
DSMZ-German Collection of Microorganisms and Cell Culture
(Braunschweig, Germany) and Cell line services (Eppelheim,
Germany).
The cells were cultured in T75 flasks in a monolayer
in DMEM (Sigma-Aldrich, Hamburg, Germany) containing 4.5 g/l
glucose, 1% L-glutamine, 10% exosome-depleted fetal bovine serum
(FBS) (BioCat GmbH, Heidelberg, Germany), 160 ng/l cortisol and 1%
penicillin/streptomycin (Invitrogen, Karlsruhe, Germany). Cultures
were maintained in a humidified atmosphere at 37°C and 5%
CO2. For the experiments studying cellular miRNAs, the
MDA-MB-231, MDA-MB-436 and MDA-MB-468 cells were seeded 4.5 h prior
to transfection at a concentration of 1×10⁵ cells per
well in 24-well plates (Greiner Bio-One, Frickenhausen, Germany)
using 0.5 ml culture medium.
GR overexpression was induced by transfecting the
TNBC cells with nuclear receptor subfamily 3 group C member 1
(NR3C1)-encoding DNA plasmids. The coding sequence
(CCDS4278.1) of the predominant glucocorticoid receptor gene
NR3C1 transcript variant 1 (NM_000176.2) was synthesized
with the restriction sites KpnI and XhoI on the 5′
and 3′ end, respectively (MWG Eurofins, Ebersberg, Germany), and
cloned in frame into the pcDNA6/V5-His A vector (Life Technologies,
Darmstadt, Germany). The cells were transfected with the NR3C1
plasmid (0.4 µg) for 24 h using Lipofectamine 2000
transfection reagent (Invitrogen). Following 30 h of cultivation,
the cells had reached 90% confluency, and were rinsed once with
HBSS before proceeding to total RNA extraction.
For experiments studying EV miRNAs, the MDA-MB-231
and MDA-MB-468 cells were seeded at a concentration of
3×10⁶ cells per well in 6-well plates (Greiner Bio-One).
Both parental and transfected cells were seeded in 3 wells with 2.5
ml culturing medium each. Transfection was performed with 2.5
µg of plasmid harboring the coding sequence of
NR3C1.
For all experiments, untransfected cells with
endogenous GR expression were used as control samples. Three
independent technical replicates per cell line were analyzed.
Validation of NR3C1 overexpression
To evaluate the effectiveness of transfection, the
NR3C1 mRNA levels were quantified by reverse
transcription-quantitative (real-time) PCR (RT-qPCR). Total RNA
from each cell line was initially reverse transcribed using the
QuantiTect Reverse Transcription kit (Qiagen, Hilden, Germany)
according to the manufacturer's instructions. Quantitative PCR was
performed using the Prime PCR Assay NR3C1 and GAPDH
human SsoAdvanced universal supermix (Bio-Rad, Munich, Germany) and
10 ng of template cDNA. PCR reactions were run on a MiniOpticon
real-time PCR system (Bio-Rad). Additionally, the transcription
levels of NR3C1 downstream targets dual specificity phosphatase 1
(DUSP1; NM_004417), serum/glucocorticoid regulated kinase 1
(SGK1; NM_005627.3) and glucocorticoid-induced leucine
zipper protein (GILZ; NM_198057.2) were assessed by RT-qPCR.
For each cell line, total RNA from three biological replicates was
reverse transcribed using the QuantiTect Reverse Transcription kit
(Qiagen). Subsequently, 8 ng cDNA were analyzed in a 10 µl
reaction volume of SsoFast EvaGreen Supermix (Bio-Rad) and 300 nM
primers (Sigma-Aldrich). Real-time PCR was carried out on
triplicate samples using a Rotor-Gene Q thermal cycler (Qiagen) and
a thermal profile for polymerase activation (95°C for 1 min) and 45
cycles of amplification (95°C for 10 sec 60°C for 15 sec, 65°C for
45 sec). The primer sequences are provided in Table I. The expression of NR3C1
and its downstream targets was normalized to GAPDH, a stable
reference gene for breast cancer cells (19). Relative quantification was carried
out using the ΔΔCq method (20).
Statistical significance was determined using the Student's t-test.
Values of P<0.05 were considered to indicate statistically
significant differences.
 | Table IPrimer pairs used for validation of
NR3C1 overexpression. |
Table I
Primer pairs used for validation of
NR3C1 overexpression.
| Name | Forward primer
(5′-3′) | Reverse primer
(5′-3′) |
|---|
| DUSP1 |
GCCATTGACTTCATAGACTCCATC |
ATGATGCTTCGCCTCTGCTT |
| SGK1 |
GACGGTGAAAACTGAGGCTG |
AGAAGGACTTGGTGGAGGAGA |
| GILZ |
TCTTCTTCCACAGTGCCTCC |
TCTTCAGGGCTCAGACAGGA |
Extracellular vesicle isolation and
characterization
For EV isolation, 7.5 ml of cell culture supernatant
were collected from the parental and transfected cells after 30 h
of cultivation, and centrifuged (3,200 × g, 5 min) to remove the
cellular debris. EVs were isolated from pre-cleared supernatant
using the miRCURY Exosome Isolation kit - Cells, urine and CSF
according to the manufacturer's instructions (Exiqon, Vedbaek,
Denmark). EV pellets were resuspended in either lysis buffer for
RNA extraction, or PBS for vesicle characterization.
For nanoparticle tracking analysis (NTA), the EVs
were diluted in particle-free PBS and analyzed on a NanoSight LM10
(Malvern Instruments GmbH, Herrenberg, Germany) using a 408 nm
laser and NTA 3.0 software. Four videos of 30 sec each were
captured, and analyzed using default settings for blur and minimum
track length, and a detection threshold of two.
RNA extraction and NGS library
preparation
Total RNA was isolated from the cells and EVs using
the miRCURY RNA Isolation kit – Cell and Plant (Exiqon,) according
to the manufacturer's instructoins. Cellular RNA was quantified
using a nanophotometer (Implen GmbH, Munich, Germany), and RNA
integrity was assessed by capillary electrophoresis on the
Bioanalyzer 2100 using the RNA 6000 Nano kit (Agilent Technologies,
Waldbronn, Germany). EV RNA was analyzed using the Agilent Small
RNA kit (Agilent Technologies).
Sequencing libraries were constructed from 190 ng of
cellular RNA, or the entire EV RNA isolated from 7.5 ml conditioned
culture medium, respectively. Library preparation was performed as
previously described by Spornraft et al (21). Briefly, the RNA was
adaptor-ligated, reverse-transcribed, amplified by PCR and barcoded
using the NEBNext Multiplex Small RNA Library Prep Set for Illumina
(New England BioLabs Inc., Frankfurt, Germany). Adaptors and
primers were diluted 1:2 in nuclease-free water to accommodate the
low RNA input. Size selection of pooled PCR products was performed
by agarose gel electrophoresis (4%), cutting out bands with 130 to
150 bp fragments. The purity and concentration of the libraries
extracted from the gel were verified by capillary electrophoresis
using the High Sensitivity DNA kit on the Bioanalyzer 2100 (Agilent
Technologies). Finally, the libraries were subjected to Illumina
single-end sequencing-by-synthesis using 50 cycles on the HiSeq
2500 (Illumina Inc., San Diego, CA, USA).
Data processing and differential gene
expression analysis
FastQC (version 0.11.5) was used to assess the
sequence length distribution and quality of the NGS data, as
previously described (22).
Adaptor sequences were trimmed using BTRIM, and all reads without
adaptors were discarded (23).
Additionally, reads shorter than 15 nt were excluded from the data
set (24). Prior to miRNA
analysis, reads pertaining to ribosomal RNA (rRNA), transfer RNA
(tRNA), small nuclear RNA (snRNA) and small nucleolar RNA (snoRNA)
were removed by mapping to sequences obtained from RNAcentral
(25). The remaining reads were
then aligned to miRBase (version 21) (26). Mapping was carried out using Bowtie
and the 'best' alignment algorithm, allowing one mismatch for both
RNAcentral and miRBase (27).
Final read count tables were generated by sorting and indexing
aligned reads using SAMtools, and calling the sum of hits per miRNA
sequence (28). Differential gene
expression analysis was subsequently performed via the bioconductor
package DESeq2 (version 1.8.1), using the Benjamini-Hochberg method
to correct for false discovery (29). A log2 fold change ≥|1| and an
adjusted p-value (Padj) of ≤0.05 were set as thresholds to identify
significantly regulated miRNAs. Only miRNAs with a mean expression
of at least 50 counts were included in the analysis. Principal
component analysis (regularized log-transformed,
sizefactor-corrected counts obtained from DESeq2), and data
visualization were performed in R (version 3.4.0) using the
packages gplots, ggfortify, genefilter and RColorBrewer.
Validation of regulated miRNAs
Based on the NGS data, differentially regulated
cellular miRNAs were validated by RT-qPCR. First, 111 ng of RNA
were reverse transcribed in triplicate using the miScript II RT kit
(Qiagen) according to the manufacturer's instructions. A total of 1
µl cDNA was subjected to real-time PCR in a 10 µl
reaction volume using the miScript SYBR-Green PCR kit (Qiagen).
Reactions were run on a CFX384 real-time PCR detection system
(Bio-Rad) using the recommended protocol of polymerase activation
(95°C for 15 min) and 45 cycles of amplification (94°C for 15 sec,
55°C for 30 sec, 70°C for 30 sec). Quantification cycle (Cq) values
were determined automatically using default threshold settings, and
Cq values above 37 were manually set to 40. The NGS data was
utilized to assess potential reference miRNAs using the geNorm and
NormFinder algorithms (30,31).
Cq values of regulated miRNAs were subsequently normalized to the
geometric mean of the following reference miRNAs: miR-24-3p,
miR-25-3p and miR-148b-3p for MDA-MB-231 and MDA-MB-436, and
miR-24-3p, miR-25-3p and let-7a-5p for MDA-MB-468. Relative
quantification was carried out using the ΔΔCq method (20). Statistical significance was
assessed using Student's t-test. Values of P<0.05 were
considered to indicate statistically significant differences.
Prediction and quantification of miRNA
target genes
miRWalk 2.0 was used to predict mRNAs targeted by
miR-203a-3p (32). Four target
genes known to be associated with metastasis in solid tumors
[Actin, gamma 2, smooth muscle, enteric (ACTG2), calponin 1
(CNN1), major histocompatibility complex, class II, DP beta
1 (HLA-DPB1) and myosin light chain kinase (MYLK)]
were selected for analysis by RT-qPCR (33). The expression of these genes was
quantified in the same cellular MDA-MB-436 samples previously used
for NGS. Initially, RNA was reverse transcribed in triplicate using
the QuantiTect Reverse Transcription kit (Qiagen) according to the
manufacturer's instructions. Quantitative PCR was then performed
using Prime PCR Assays, SsoAdvanced Universal Supermix (Bio-Rad)
and 10 ng of template cDNA. PCR reactions were run on a MiniOpticon
real-time PCR system (Bio-Rad). Target gene Cq values were
normalized to GAPDH (19).
Results
Plasmid transfection induces the
expression of NR3C1 and downstream effectors
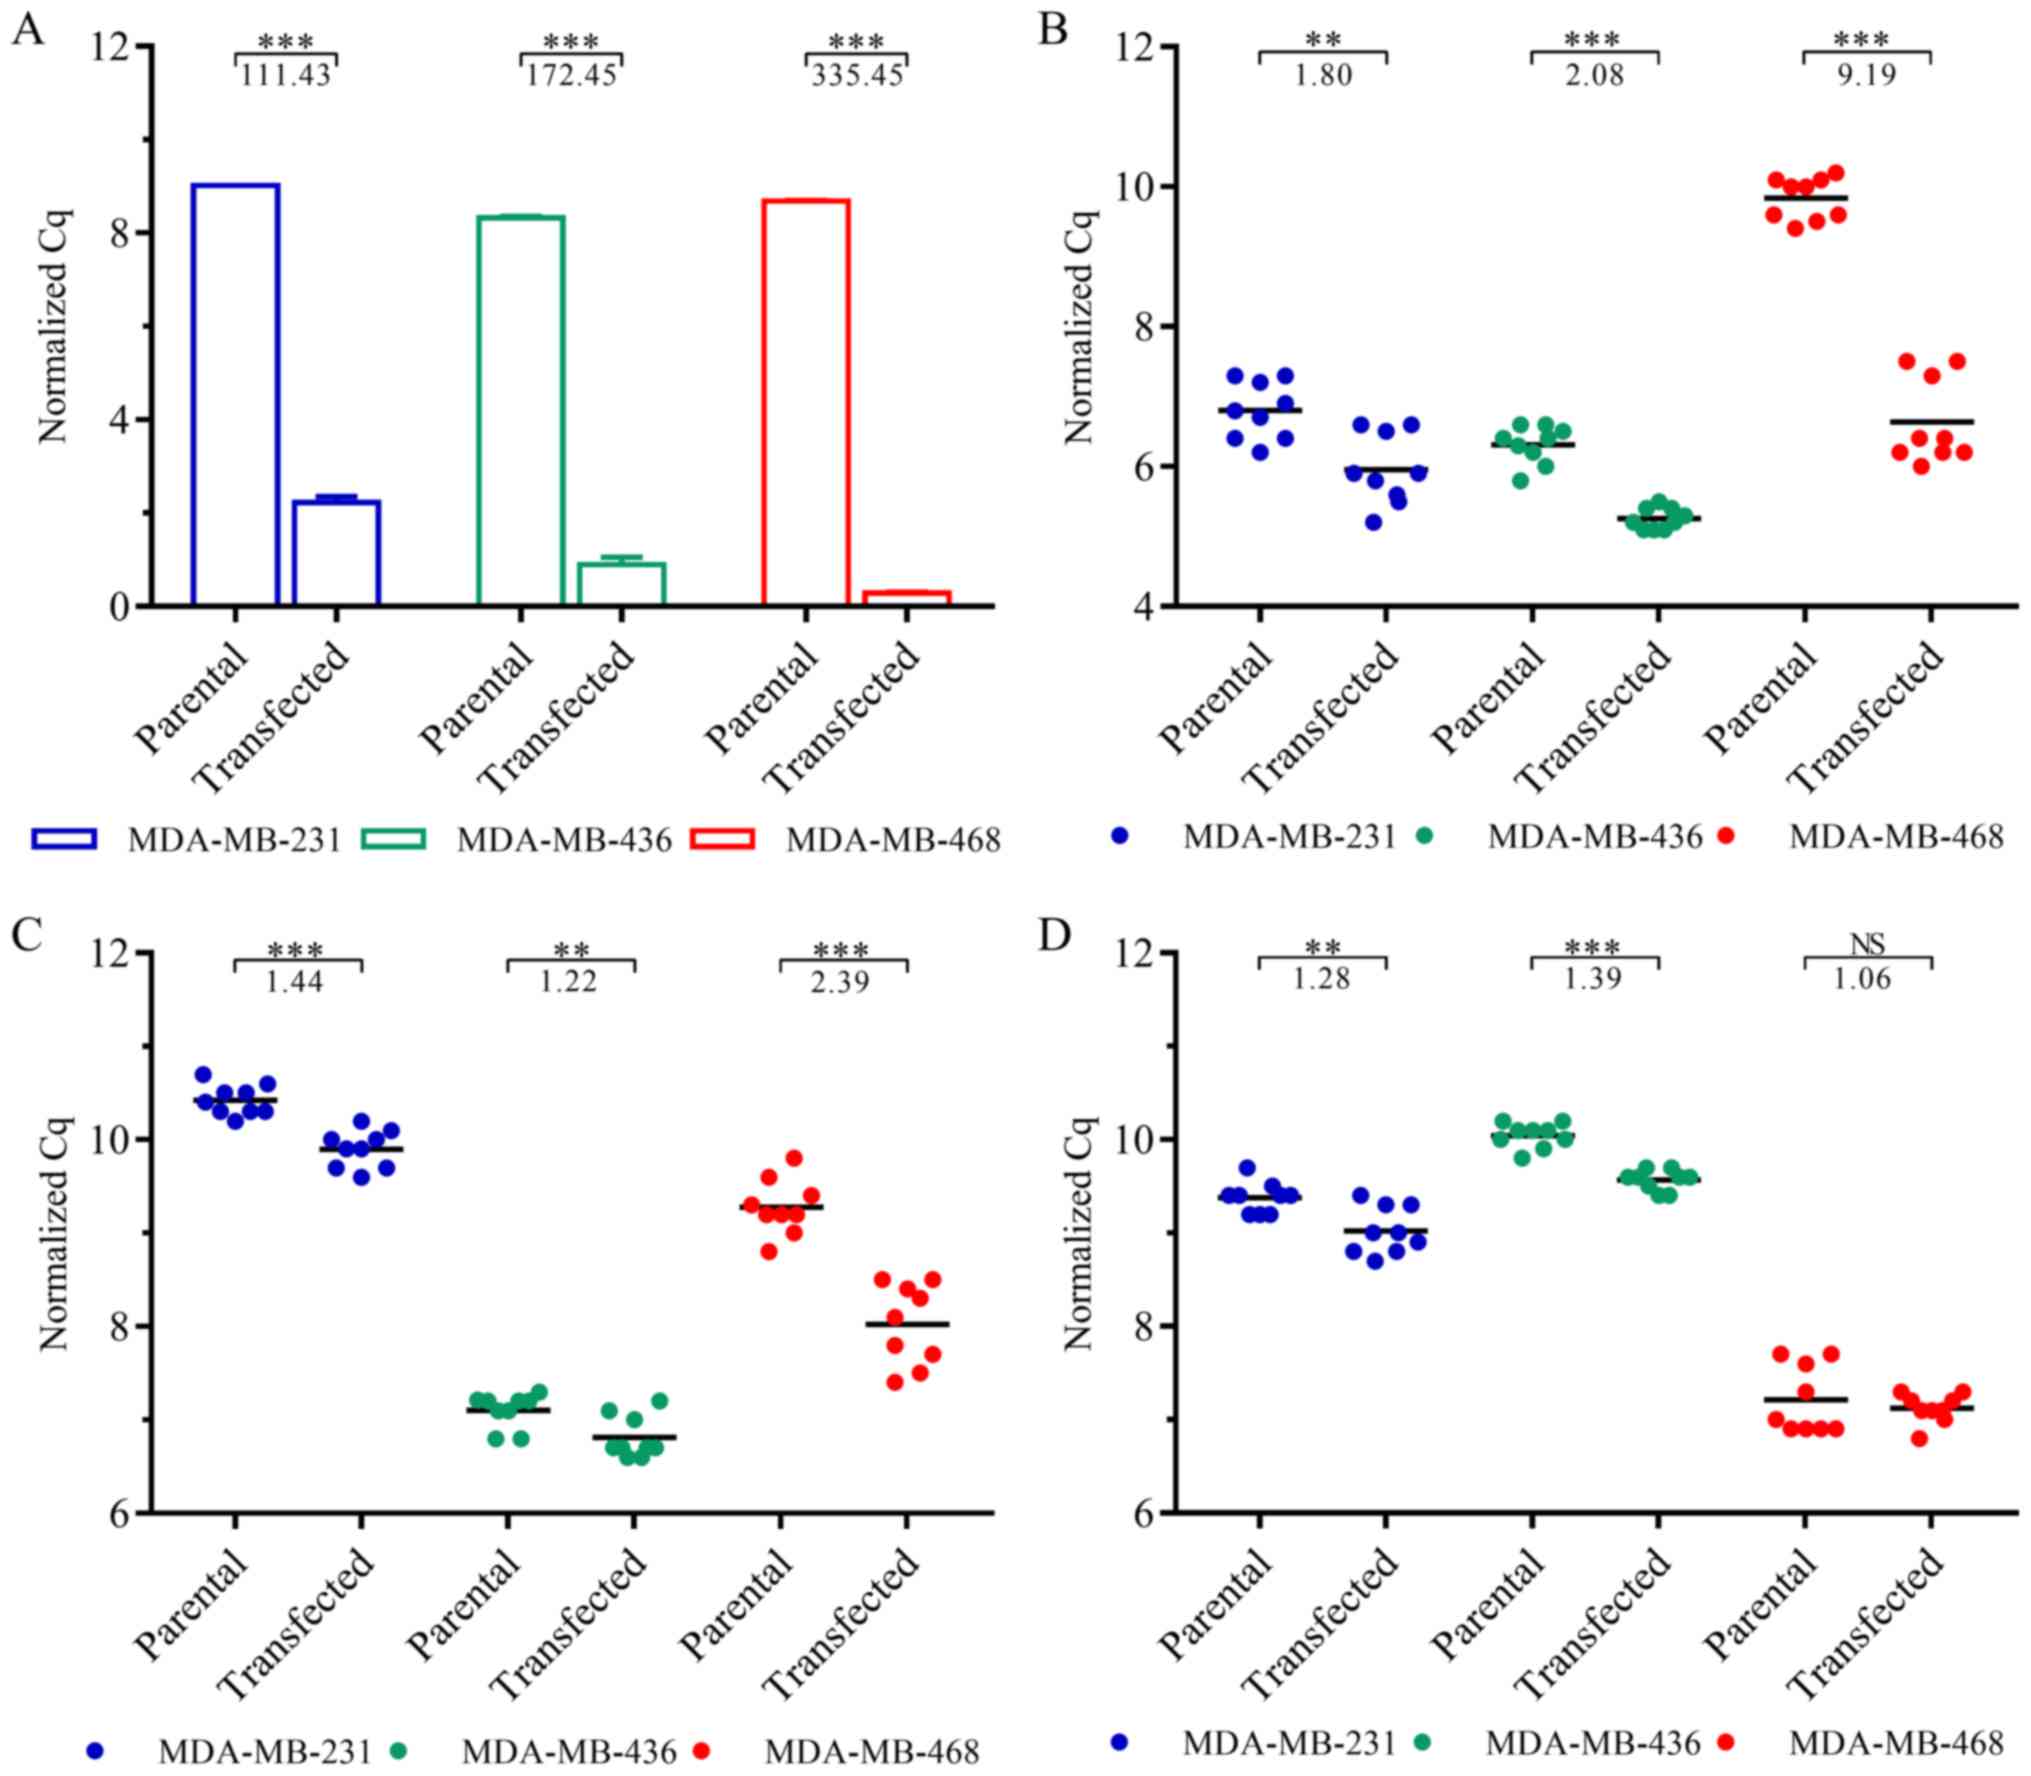
The transfection of the TNBC cells with
NR3C1-coding plasmids was validated by RT-qPCR (Fig. 1A). GR expression was significantly
increased in the transfected MDA-MB-231 (111-fold, P=1.75E-4),
MDA-MB-436 (172-fold, P=2.51E-4) and MDA-MB-468 (335-fold,
P=6.39E-6) cells.
To assess overexpression-induced changes in GR
signaling, we additionally quantified the expression levels of GR
target genes DUSP1 (Fig.
1B), SGK1 (Fig. 1C) and
GILZ (Fig. 1D). While
DUSP1 and SGK1 were significantly upregulated in all
cell lines, GILZ expression was not altered significantly in the
MDA-MB-468 cells (P=0.51). In the MDA-MB-231 and MDA-MB-436 cells,
however, GILZ expression was significantly increased
(P=2.79E-3 and P=3.79E-7, respectively).
TNBC secretes extracellular vesicles
carrying RNA
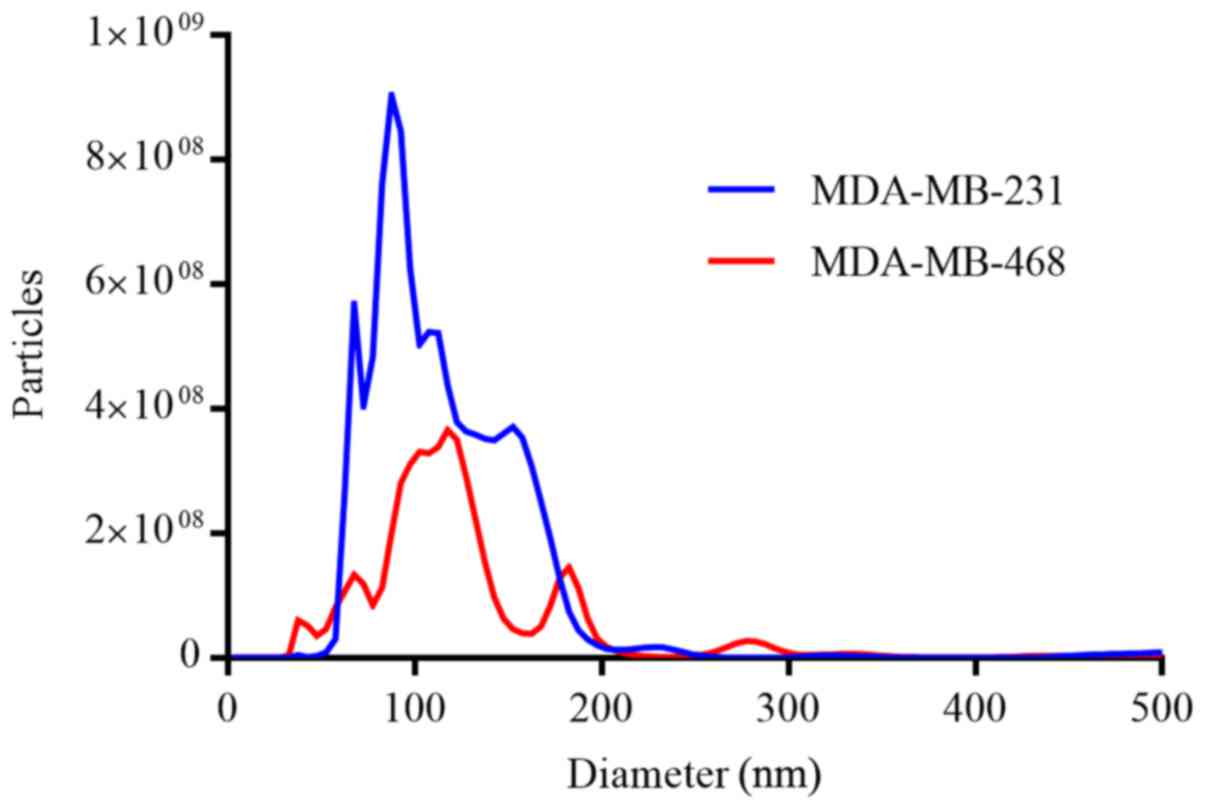
EVs isolated from the conditioned media of the
parental MDA-MB-231 and MDA-MB-468 cells were characterized by NTA
(Fig. 2). Single-particle analysis
revealed a narrow size distribution with mean particle diameters of
119.0±74.4 nm (mode, 87.5 nm) and 140.0±116.7 nm (mode, 117.5 nm)
for the MDA-MB-231 and MDA-MB-468 cells, respectively. Despite the
similarities in diameter, significantly more particles were
isolated from the MDA-MB-231 cells (P<0.001).
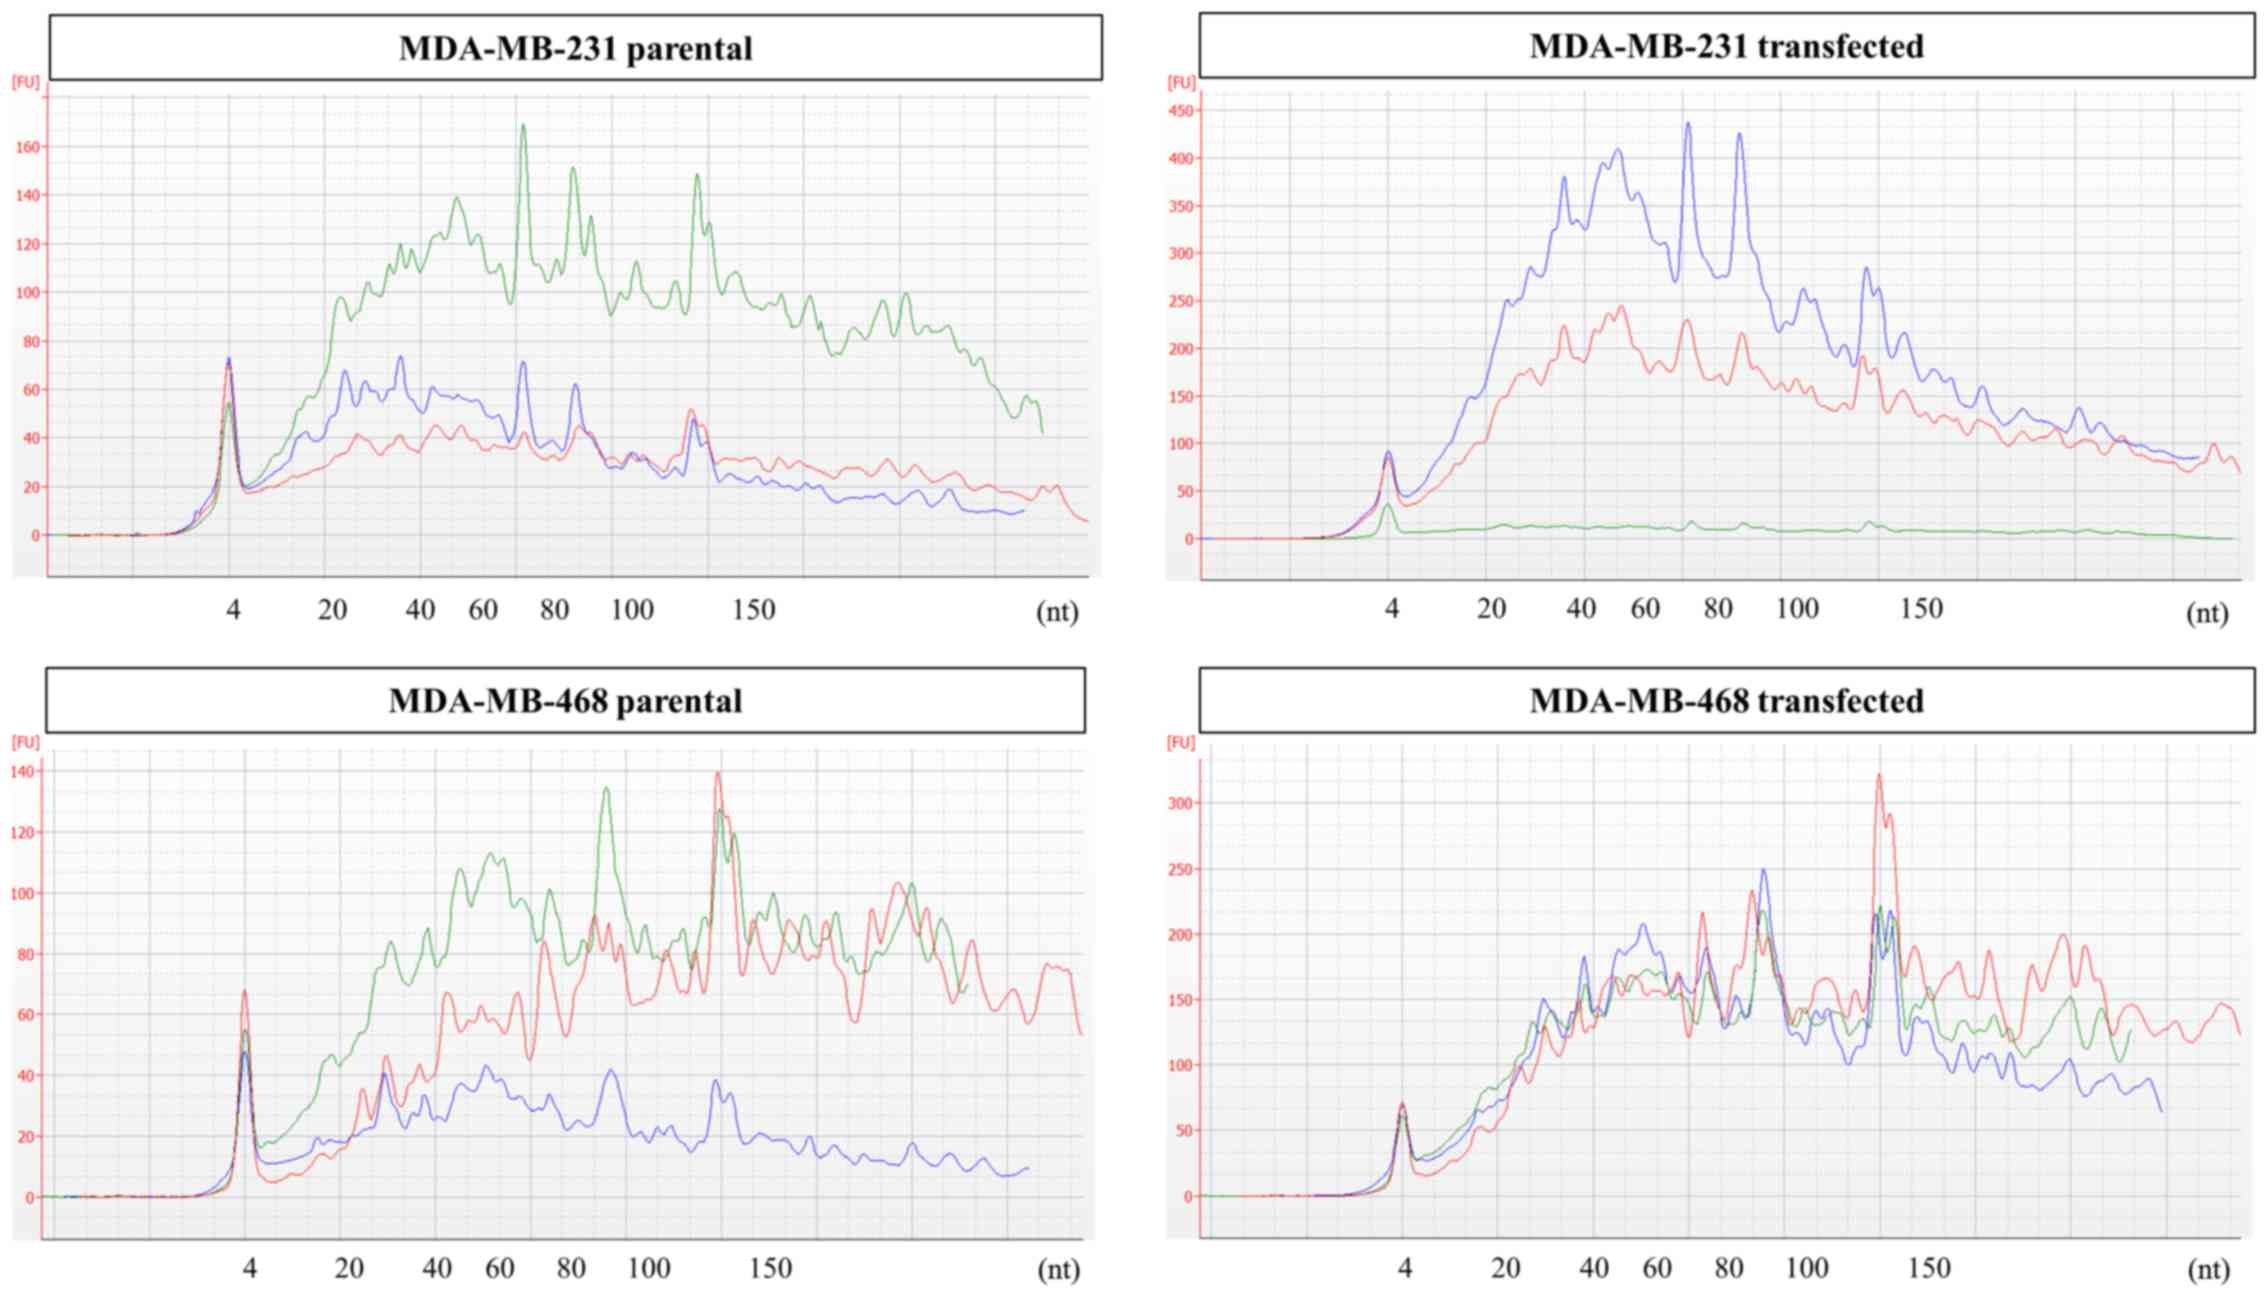
Prior to sequencing, RNA extracted from EV
preparations was analyzed by capillary electrophoresis. Samples
from both cell lines were found to be enriched in small RNA species
<150 nt without obvious differences in size profiles between the
parental and transfected cells. Full electropherograms for small
RNA analysis are provided in Fig.
3.
GR overexpression does not alter
vesicular miRNA profiles
EV RNA from the MDA-MB-231 and MDA-MB-468 cells was
profiled by small RNA-Seq. The mean per-replicate library sizes are
provided in Table II. After
mapping to miRBase, between 736 (MDA-MB-468, transfected) and 796
(MDA-MB-231, parental) distinct miRNA transcripts were detected in
at least one sample. For EVs from both cell lines, there was
significant overlap in the 10 most highly expressed miRNAs between
the treatment groups (Table
III).
| Table IILibrary sizes and number of detected
miRNA species in MDA-MB-231 and MDA-MB-468 EVs. |
Table II
Library sizes and number of detected
miRNA species in MDA-MB-231 and MDA-MB-468 EVs.
| MDA-MB-231 cells
|
|---|
| Parental | Transfected |
|---|
| Library size ±
SD | 1.11E7±1.66E6 | 1.27E7±1.64E6 |
| Distinct
miRNAs | 796 | 788 |
|
| MDA-MB-468 cells
|
| Parental | Transfected |
|
| Library size ±
SD | 1.09E7±1.25E6 | 1.25E7±1.50E6 |
| Distinct
miRNAs | 762 | 736 |
| Table IIITop 10 most highly expressed miRNAs
in EVs from parental and transfected MDA-MB-231 and MDA-MB-468
EVs. |
Table III
Top 10 most highly expressed miRNAs
in EVs from parental and transfected MDA-MB-231 and MDA-MB-468
EVs.
MDA-MB-231 parental
| MDA-MB-231
transfected
|
|---|
| miRNA | Count ± SD | miRNA | Count ± SD |
|---|
| miR-100-5p |
32,896.06±15,567.28 | miR-100-5p |
28,093.64±1,746.75 |
| miR-21-5p |
20,517.88±6,132.81 | miR-21-5p |
20,563.67±13,352.19 |
| let-7f-5p |
14,534.16±7,389.27 | let-7i-5p |
16,700.98±7,018.44 |
| let-7i-5p |
13,851.26±3,041.99 | let-7f-5p |
13,224.79±6,215.57 |
| miR-486-5p |
12,773.16±9,474.51 | let-7a-5p |
13,170.83±7,480.14 |
| let-7a-5p |
12,044.75±4,144.34 | miR-486-5p |
12,251.12±9,557.67 |
| miR-92a-3p |
9,763.94±5,940.53 | miR-451a |
11,594.65±13,346.77 |
| let-7g-5p |
9,167.48±3,312.17 | let-7g-5p |
9,583.62±3,853.93 |
| miR-451a |
8,899.87±5,035.93 | miR-92a-3p |
8,909.74±4,096.12 |
| miR-27b-3p |
7,298.91±2,952.47 | miR-27b-3p |
7,004.21±4,888.94 |
|
MDA-MB-468 parental
| MDA-MB-468
transfected
|
| miRNA | Count ± SD | miRNA | Count ± SD |
|
| let-7f-2-3p |
20,174.15±3,134.83 | miR-505-3p |
17,483.16±12,287.71 |
| miR-103b |
14,956.91±4,896.68 | miR-4742-3p |
15,703.77±5,227.01 |
| miR-4742-3p |
14,411.10±5,455.42 | miR-103b |
14,095.48±11,598.41 |
| let-7a-3p |
13,768.25±2,884.00 | let-7f-2-3p |
13,819.32±4,499.01 |
| miR-505-3p |
10,494.01±2,170.28 | let-7a-3p |
9,814.04±2,947.26 |
| let-7f-5p |
10,065.30±2,199.66 | let-7i-3p |
8,987.19±3,015.38 |
| let-7i-3p |
9,369.82±1,379.22 | let-7f-5p |
8,452.97±2,966.55 |
| miR-22-5p |
7,455.85±526.85 | miR-22-5p |
7,692.73±2,962.41 |
| let-7b-3p |
5,176.99±1,522.35 | miR-196b-5p |
4,445.60±5,386.47 |
| miR-196b-5p |
3,375.73±1,780.00 | miR-27b-3p |
3,582.84±1,131.12 |
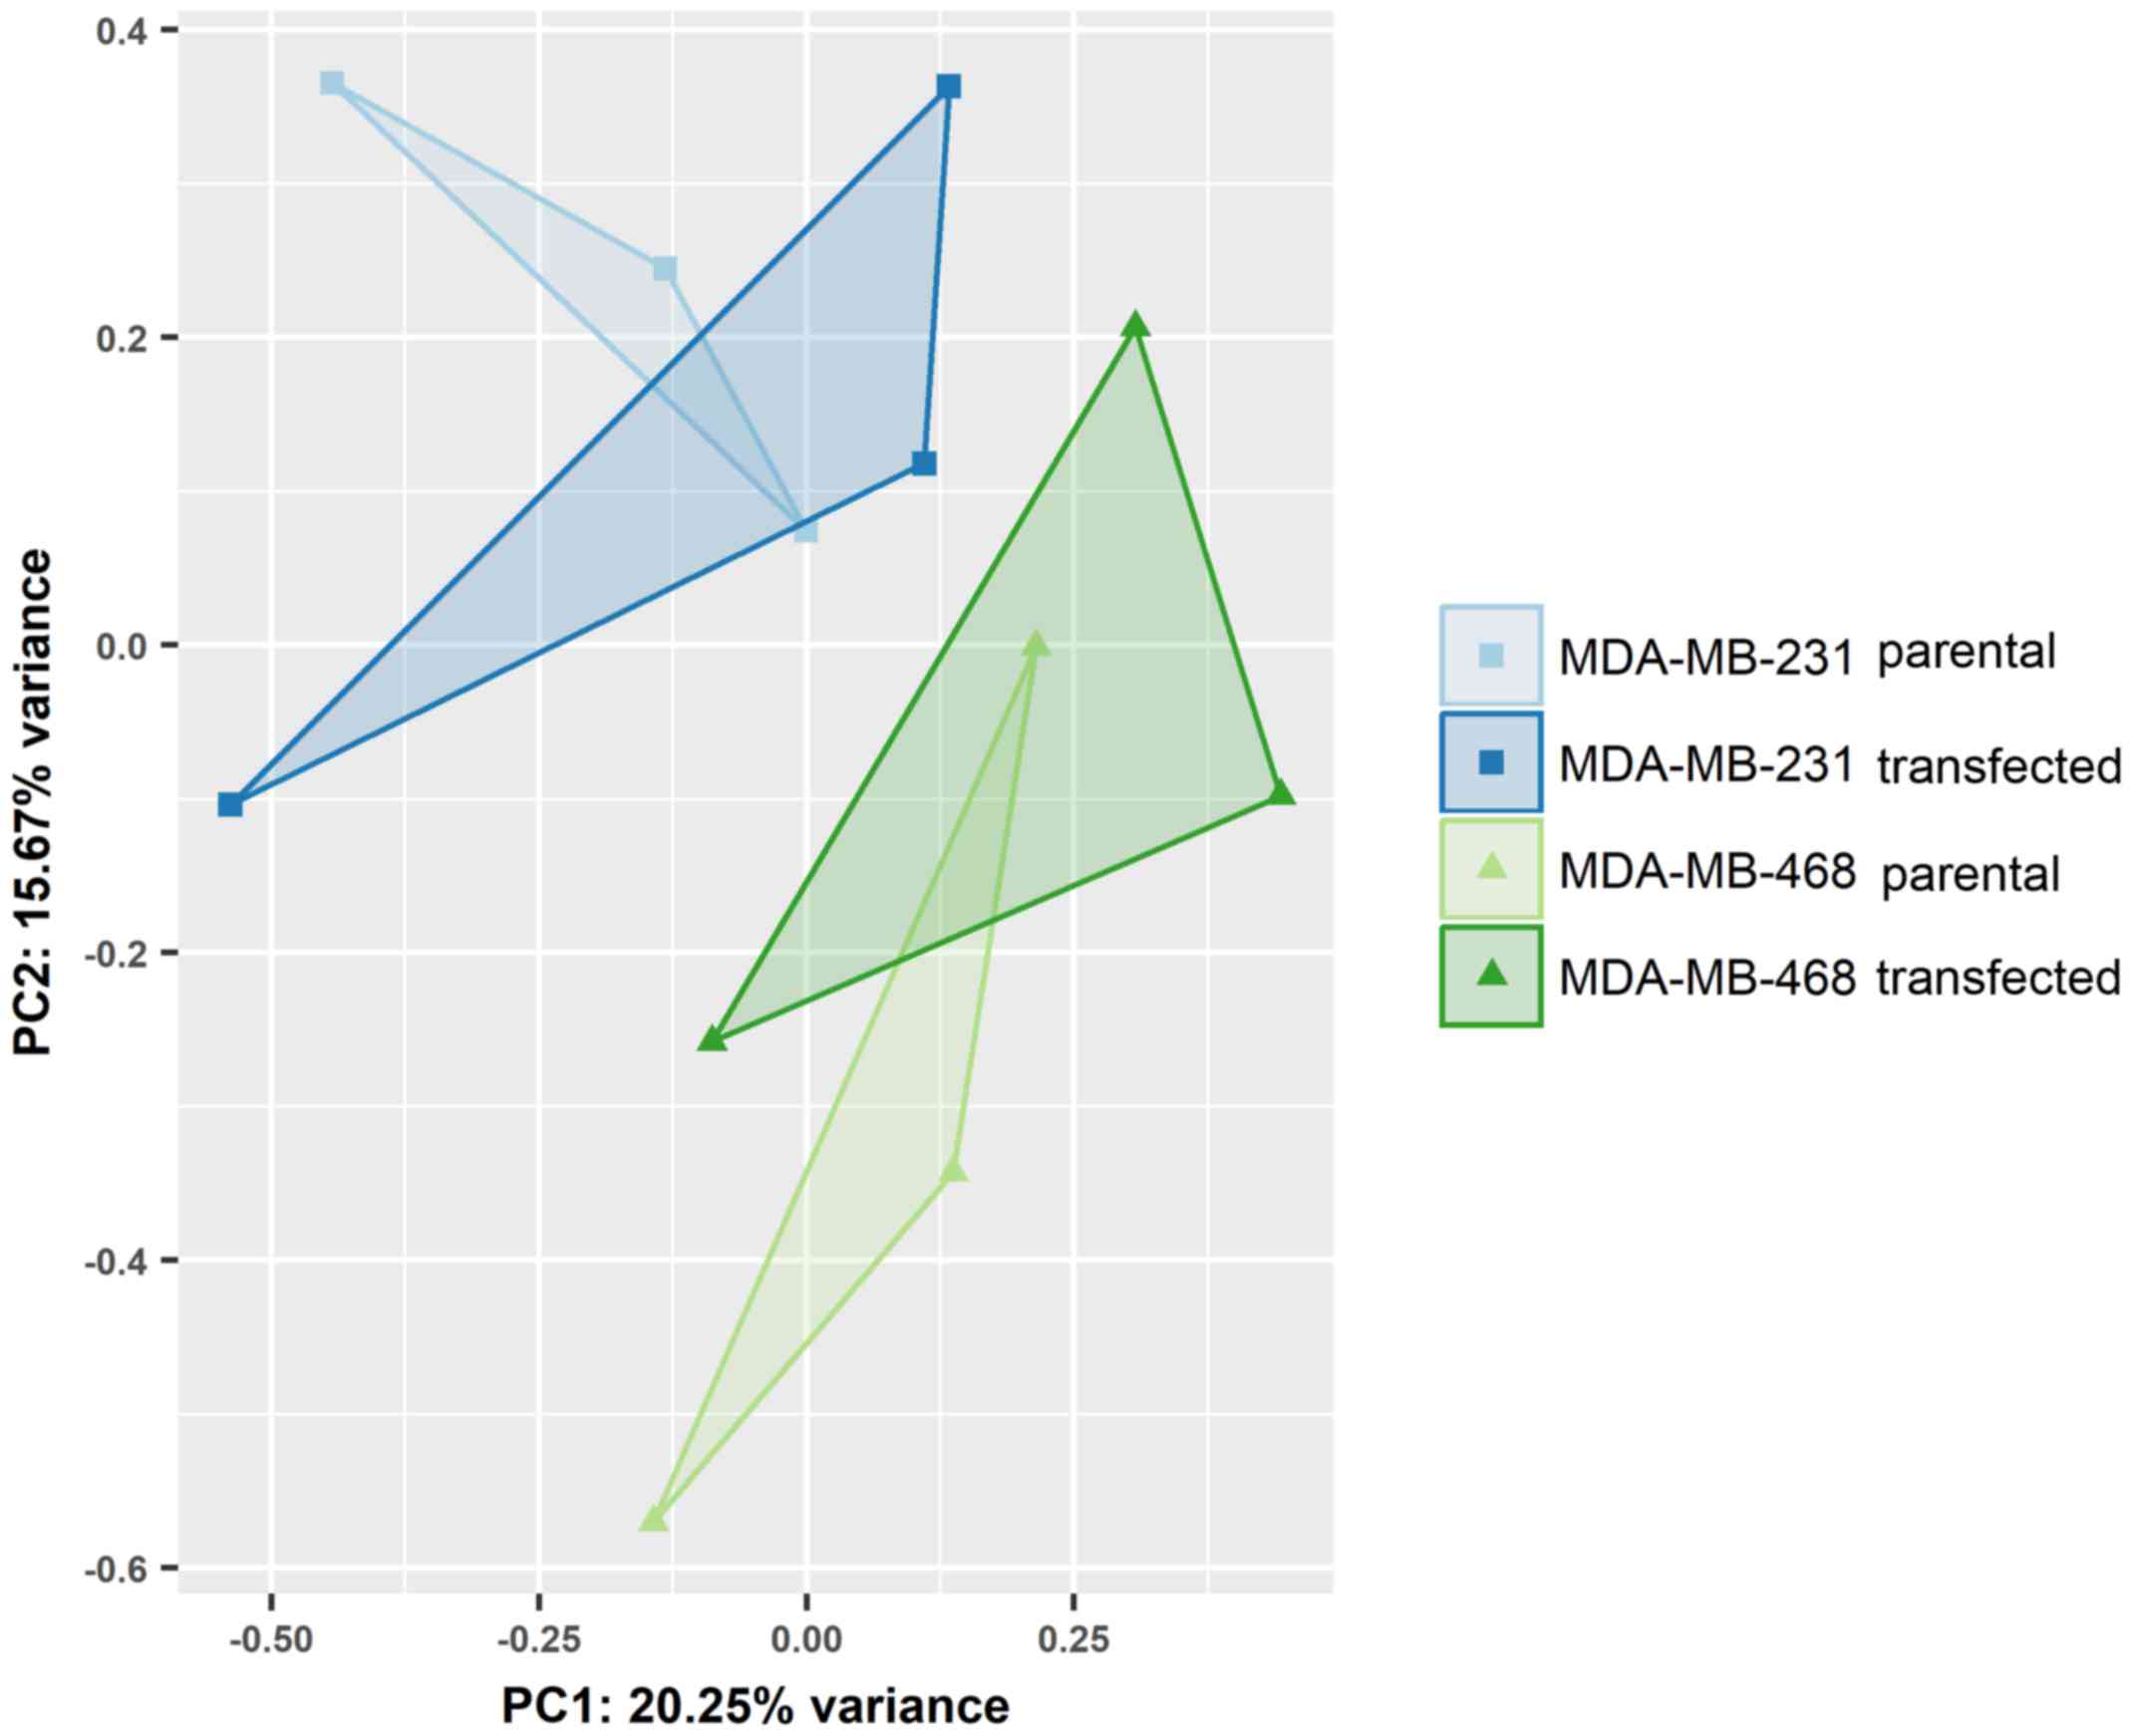
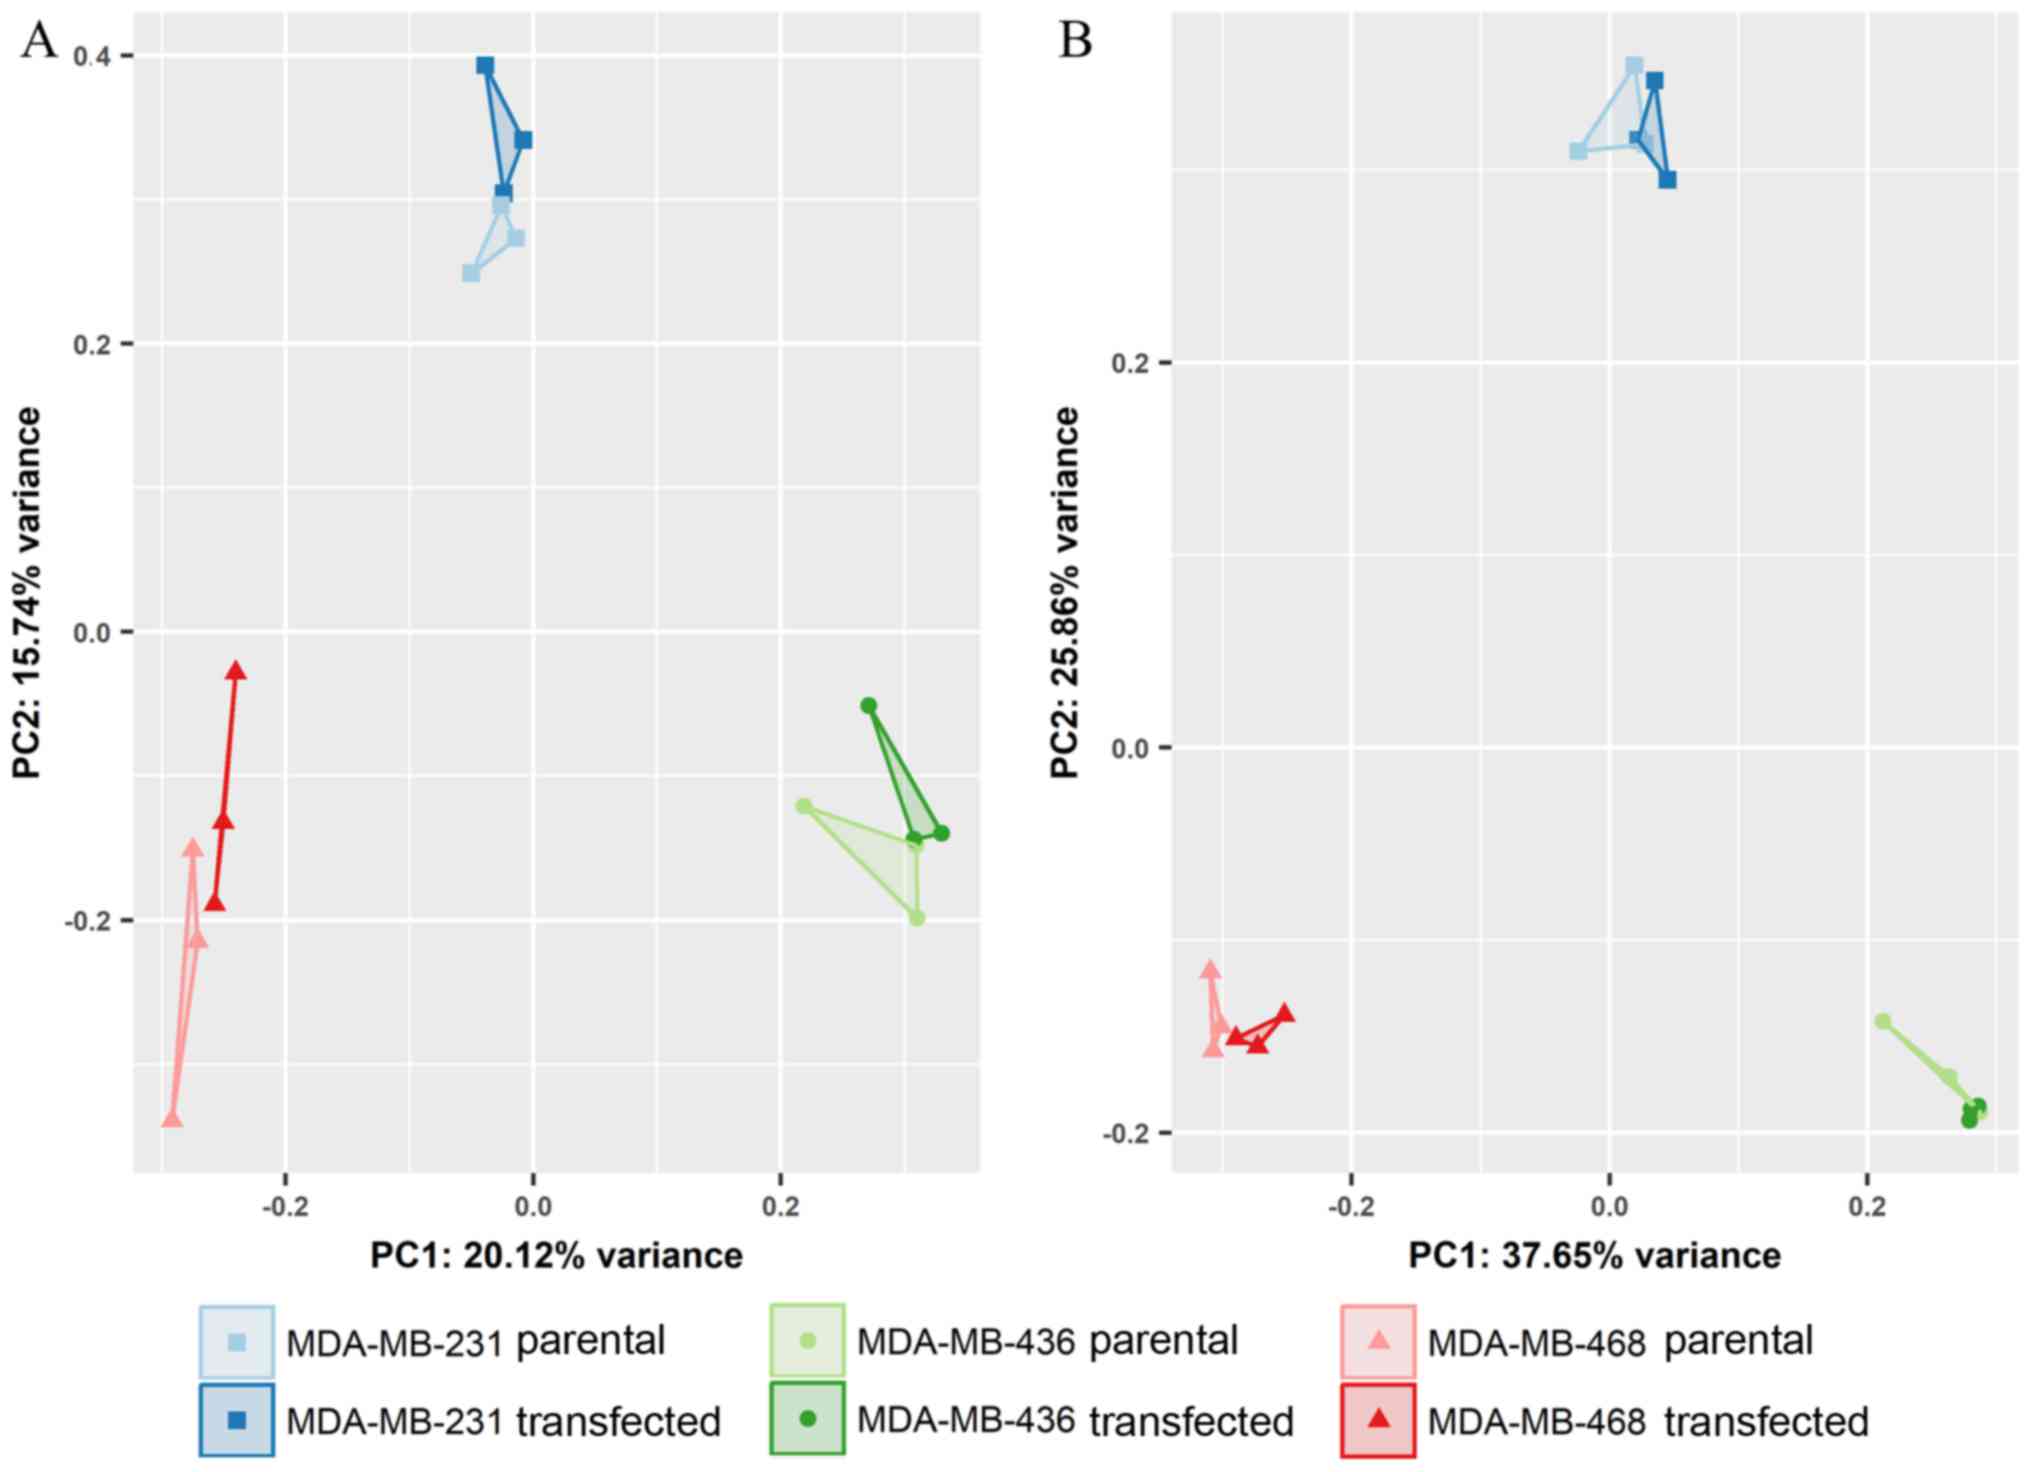
Differential expression of miRNAs was assessed in
EVs from the parental and transfected MDA-MB-231 and MDA-MB-468
cells. While individual cell lines were clearly distinguished by
principal component analysis (Fig.
4), the overexpression of GR did not lead to noticeable changes
in miRNA expression. None of the miRNAs detected in small RNA-Seq
displayed statistically significant regulation between endogenous
and artificially induced GR expression.
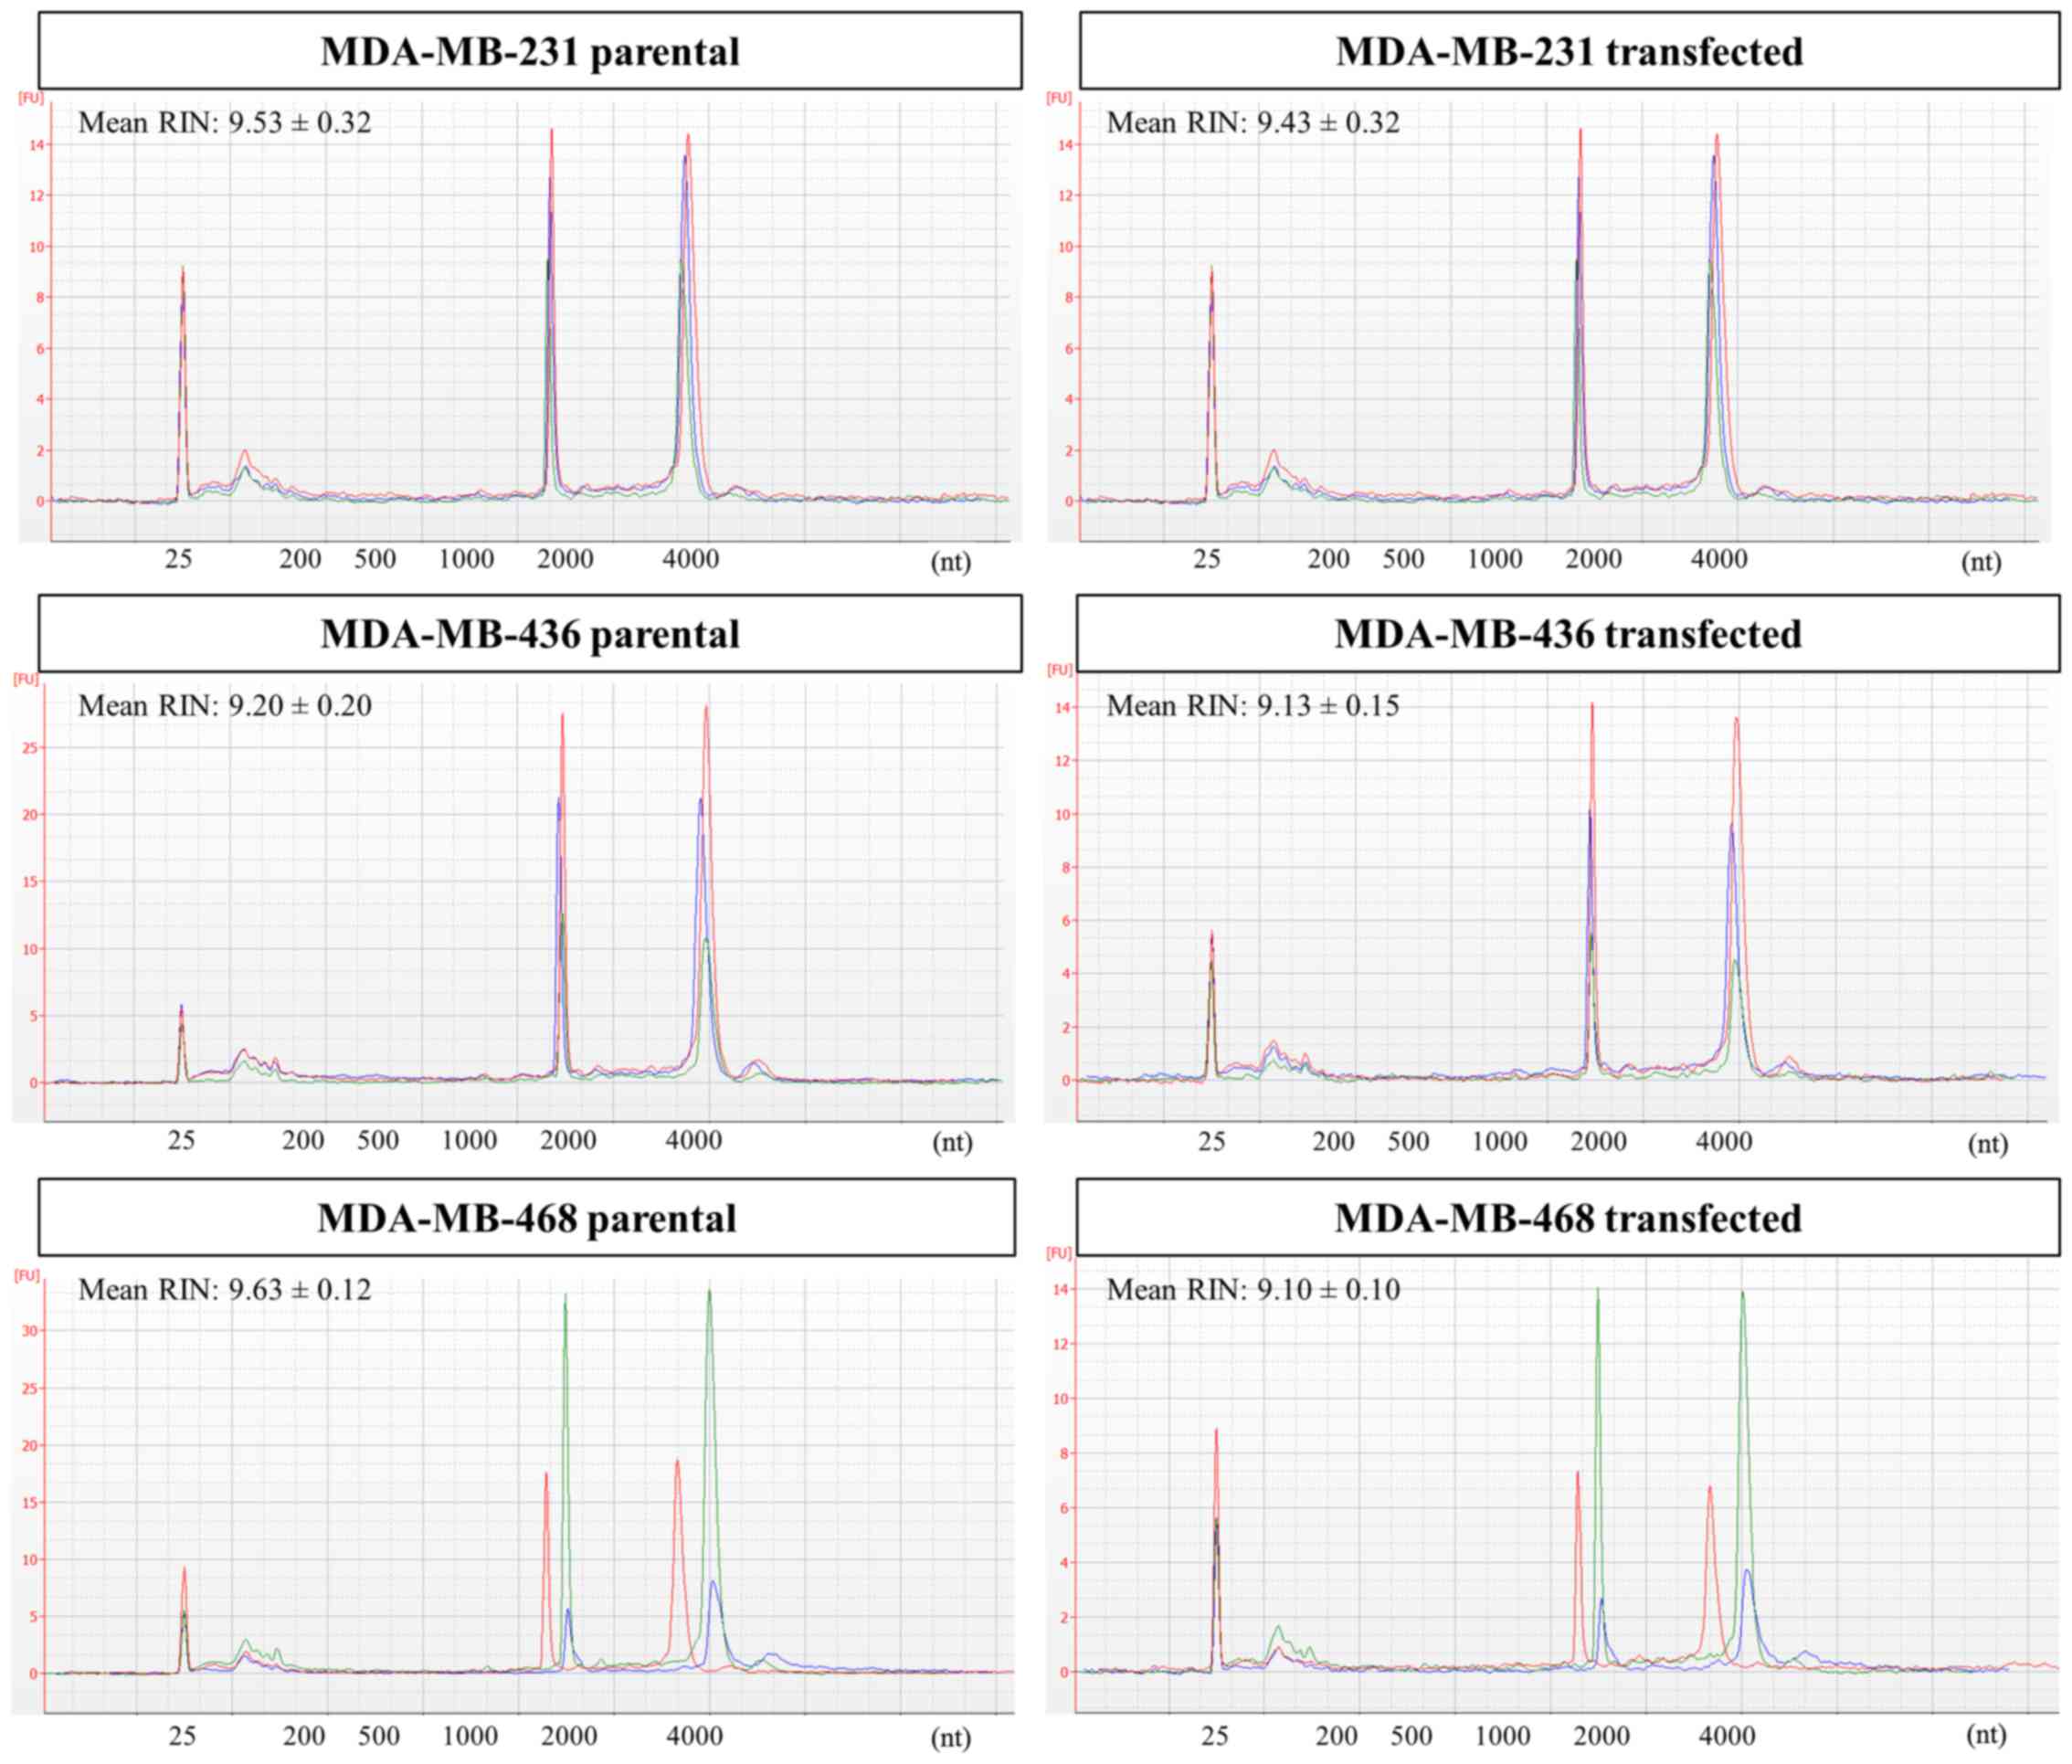
Changes in cellular RNA profiles upon GR
overexpression
Cellular RNA was initially analyzed by capillary
electrophoresis to assess its suitability for NGS analysis. For all
cell lines, samples from both parental and transfected cells
featured excellent RNA integrity, as indicated by the RNA integrity
number (RIN) values >9. Bioanalyzer electropherograms for
cellular RNA are shown in Fig.
5.
In the NGS data, both the mean size of sequencing
libraries and the number of detected miRNAs were higher than in the
EV samples (Table IV compared
with Table II). The most highly
expressed miRNAs in all of the three parental cell lines displayed
a high degree of similarity, sharing 8 of the top 10 miRNAs
(Table V). Similarly, 7 of the top
10 most highly expressed miRNAs were common to all transfected cell
lines.
| Table IVLibrary sizes and number of detected
miRNA species in MDA-MB-231, MDA-MB-436 and MDA-MB-468 cells. |
Table IV
Library sizes and number of detected
miRNA species in MDA-MB-231, MDA-MB-436 and MDA-MB-468 cells.
| MDA-MB-231 cells
|
|---|
| Parental | Transfected |
|---|
| Library size ±
SD | 9.42E6 1.56E6 | 7.98E6±8.10E5 |
| Distinct
miRNAs | 1,025 | 949 |
|
| MDA-MB-436 cells
|
| Parental | Transfected |
|
| Library size ±
SD | 9.25E6±8.75E5 | 8.28E6±5.92E5 |
| Distinct
miRNAs | 1,187 | 1,216 |
|
| MDA-MB-468 cells
|
| Parental | Transfected |
|
| Library size ±
SD | 8.32E6±1.23E6 | 7.27E6±9.70E5 |
| Distinct
miRNAs | 1,096 | 1,016 |
| Table VTop 10 most highly expressed miRNAs
in parental and transfected MDA-MB-231, MDA-MB-436 and MDA-MB-468
cells. |
Table V
Top 10 most highly expressed miRNAs
in parental and transfected MDA-MB-231, MDA-MB-436 and MDA-MB-468
cells.
MDA-MB-231 parental
| MDA-MB-231
transfected
|
|---|
| miRNA | Count ± SD | miRNA | Count ± SD |
|---|
| miR-100-5p |
963,722.05±111,405.87 | miR-100-5p |
1,348,718.94±345,916.54 |
| let-7i-5p |
663,458.05±68,993.69 | let-7i-5p |
774,622.60±97,337.13 |
| let-7f-5p |
267,434.97±31,684.39 | let-7f-5p |
324,183.97±17,197.04 |
| let-7a-5p |
195,527.39±12,006.56 | let-7a-5p |
204,938.44±20,414.46 |
| miR-151a-3p |
106,021.75±1å1,082.05 | miR-151a-3p |
163,277.67±56,462.79 |
| let-7g-5p |
90,178.84±13,127.37 | miR-21-5p |
80,090.23±21,445.21 |
| miR-21-5p |
67,628.11±16,283.91 | let-7g-5p |
78,292.35±25,760.59 |
| miR-92a-3p |
57,221.86±7,227.13 | miR-92a-3p |
61,589.95±11,515.77 |
| miR-99b-5p |
51,137.53±9,440.27 | miR-10a-5p |
60,968.56±16,758.93 |
| miR-26a-5p |
46,946.37±4,194.59 | miR-99b-5p |
57,331.95±10,509.88 |
|
MDA-MB-436 parental
| MDA-MB-436
transfected
|
| miRNA | Count ± SD | miRNA | Count ± SD |
|
| let-7f-5p |
374,536.91±26,561.27 | let-7f-5p |
340,698.27±40,869.66 |
| miR-148a-3p |
184,192.97±10,352.18 | miR-148a-3p |
226,502.28±169,068.63 |
| let-7a-5p |
153,782.25±10,424.01 | let-7a-5p |
163,998.51±24,567.84 |
| let-7i-5p |
146,573.76±5,731.89 | let-7i-5p |
157,923.40±59,299.50 |
| miR-92a-3p |
138,702.18±11,122.50 | miR-151a-3p |
148,161.03±108,764.69 |
| miR-151a-3p |
123,436.41±9,688.08 | miR-92a-3p |
116,819.87±14,412.48 |
| miR-100-5p |
71,942.27±10,410.65 | miR-100-5p |
74,514.77±19,201.37 |
| let-7g-5p |
71,876.07±1,749.76 | miR-21-5p |
66,313.38±31,125.38 |
| miR-21-5p |
55,083.27±6,735.91 | let-7g-5p | 62,873.25±
0,847.78 |
| miR-99b-5p |
38,293.24±5,041.04 | miR-27a-3p |
46,550.47±14,720.23 |
|
MDA-MB-468 parental
| MDA-MB-468
transfected
|
| miRNA | Count ± SD | miRNA | Count ± SD |
|
| let-7f-5p |
265,322.95±28,671.87 | let-7f-5p |
284,627.19±31,730.98 |
| let-7i-5p |
235,059.66±20,017.95 | let-7i-5p |
187,056.07±30,924.33 |
| let-7a-5p |
92,998.25±9,551.52 | let-7a-5p |
92,984.74±14,147.88 |
| miR-99b-5p |
78,640.71±22,892.91 | miR-92a-3p |
85,018.48±14,067.98 |
| miR-92a-3p |
75,727.64±7,097.75 | miR-99b-5p |
64,627.71±7,761.79 |
| miR-151a-3p |
73,088.61±32,556.30 | let-7g-5p |
62,517.17±6,768.50 |
| let-7g-5p |
50,292.17±10,045.56 | miR-21-5p |
49,269.32±7,542.30 |
| miR-21-5p |
43,287.45±14,869.30 | miR-151a-3p |
43,104.23±13,278.15 |
| miR-25-3p |
38,646.33±3,045.93 | miR-25-3p |
40,277.41±1,076.45 |
| miR-30a-3p |
35,921.06±9,828.02 | miR-26a-5p |
33,429.91±3,036.12 |
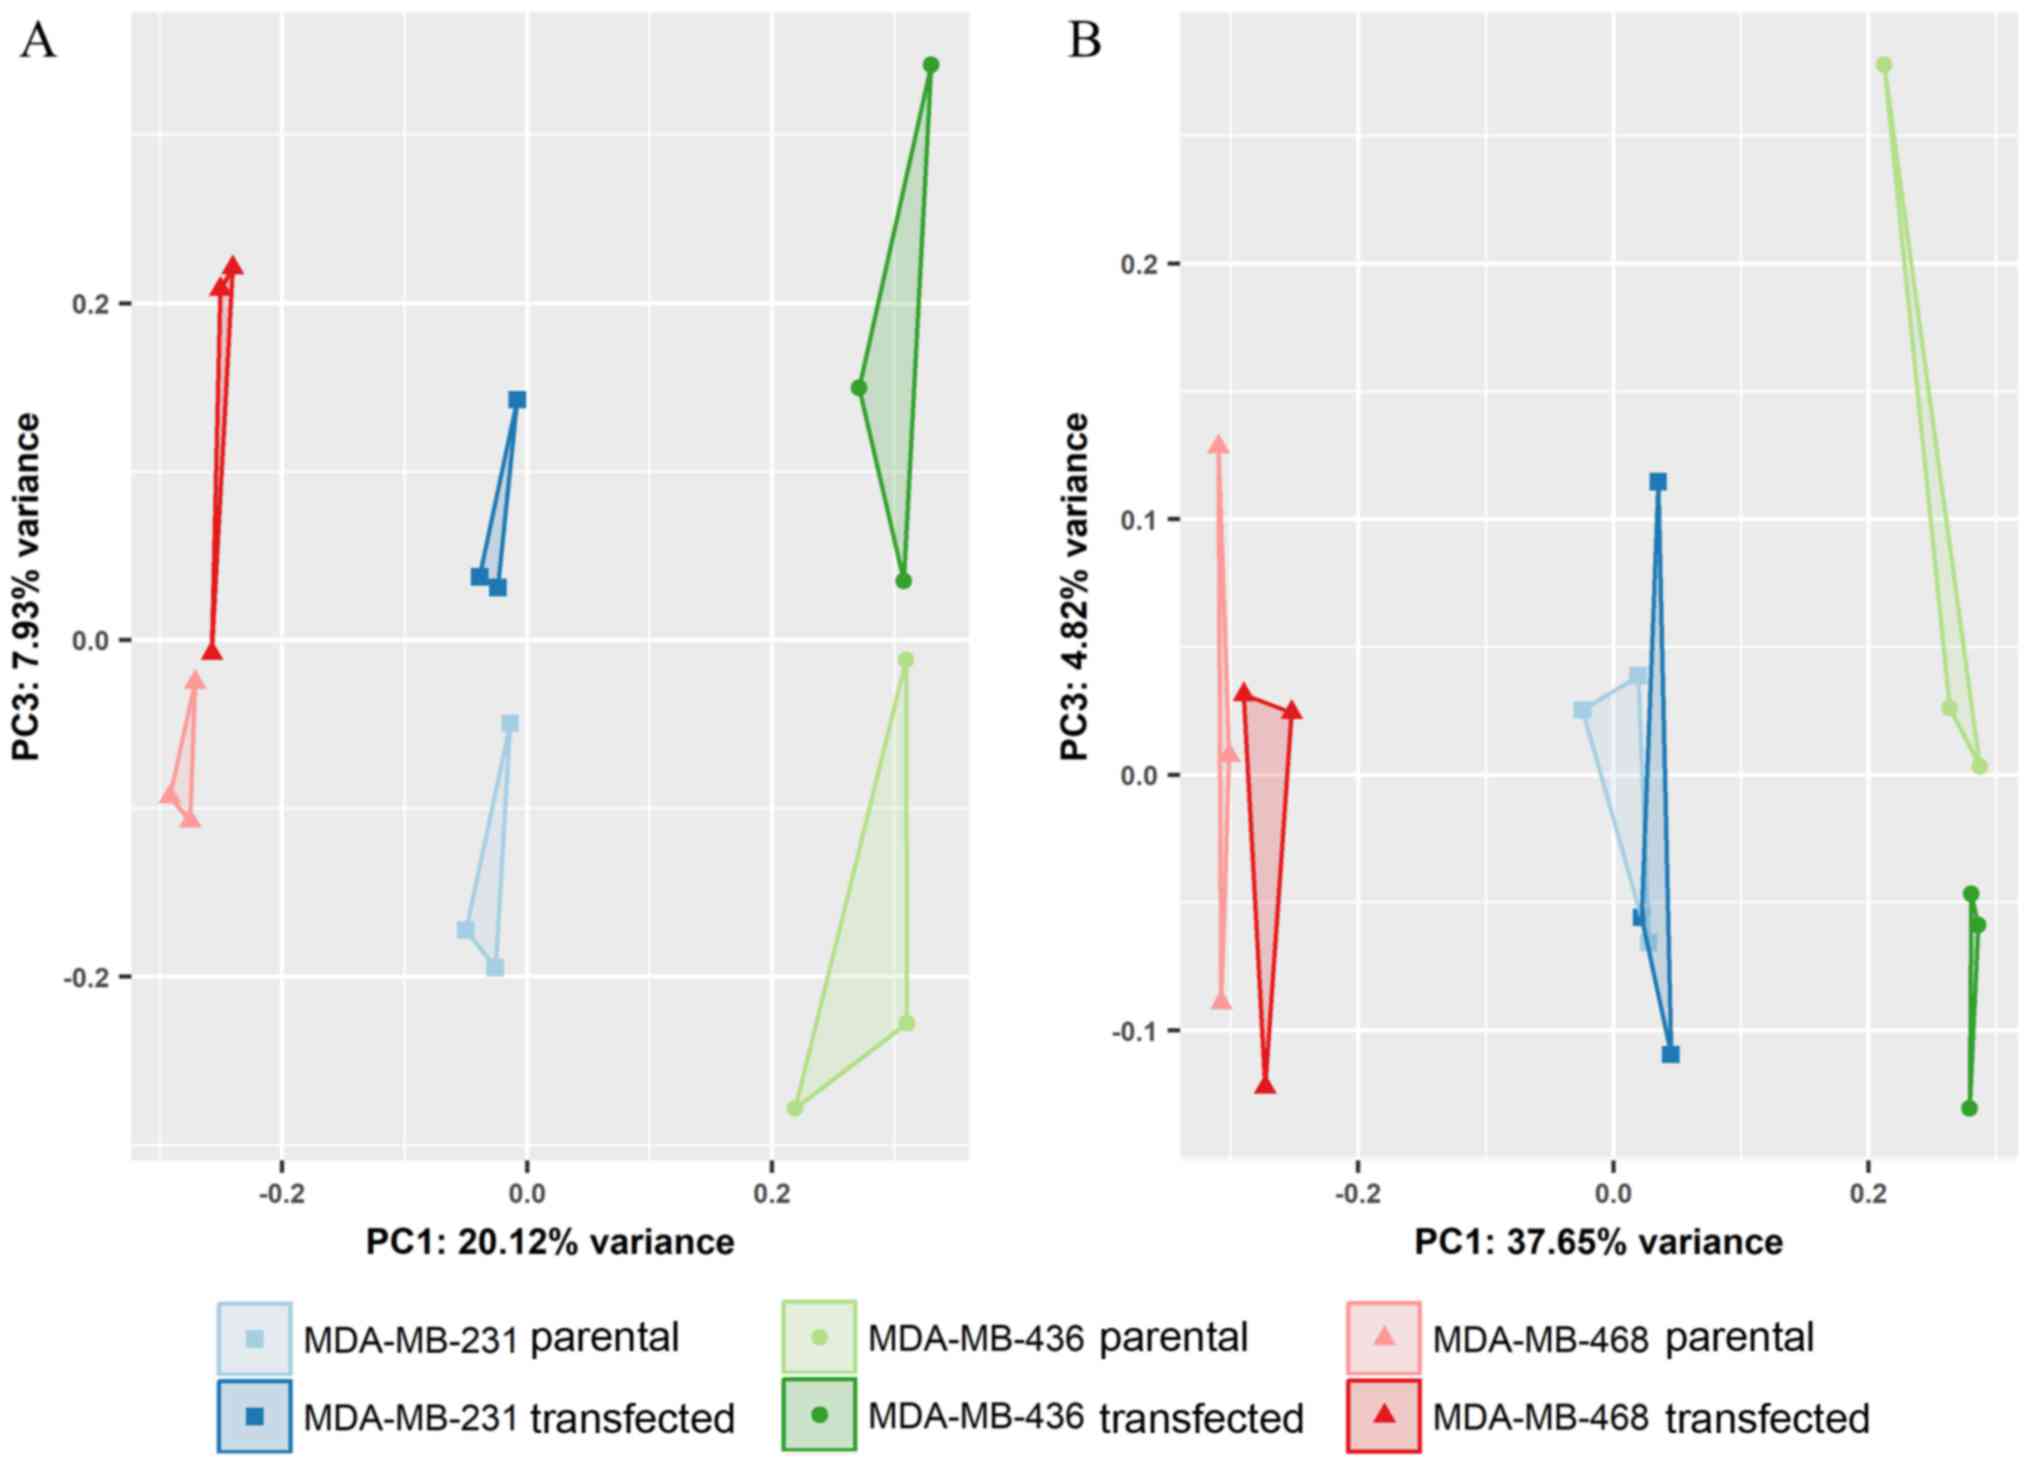
Differential gene expression analysis revealed
slight, yet statistically significant changes in specific miRNAs
during GR overexpression (Table
VI). Of note, a different set of GR-responsive miRNAs was
detected in each of the TNBC cell lines studied herein,
highlighting the heterogeneity of molecular signaling. As shown in
Fig. 6, miRNA expression clearly
separated individual cell lines, but exhibited only minor
differences between the transfected and parental cells. Based on
the expression profiles of all miRNAs, principal component 3 (PC3),
distinguished parental and GR-overexpressing cells (Fig. 7A). Limiting the input for analysis
to the 500 miRNAs with highest variance, however, a reduced
separation of groups was observed (Fig. 7B).
| Table VICellular miRNAs significantly
regulated by GR. |
Table VI
Cellular miRNAs significantly
regulated by GR.
| miRNA | log2FC | baseMean | P-adj |
|---|
| MDA-MB-231 | miR-221-5p | 1.13 | 223.75 | 0.0010 |
| miR-576-3p | 1.11 | 53.47 | 0.0071 |
| let-7b-3p | −1.10 | 88.78 | 0.0118 |
| MDA-MB-436 | miR-203a-3p | 1.35 | 134.76 | 0.0301 |
| miR-4746-5p | −1.07 | 74.25 | 0.0444 |
| MDA-MB-468 | miR-1260a | −1.54 | 291.24 | 0.0003 |
| miR-1260b | −1.54 | 335.12 | 0.0001 |
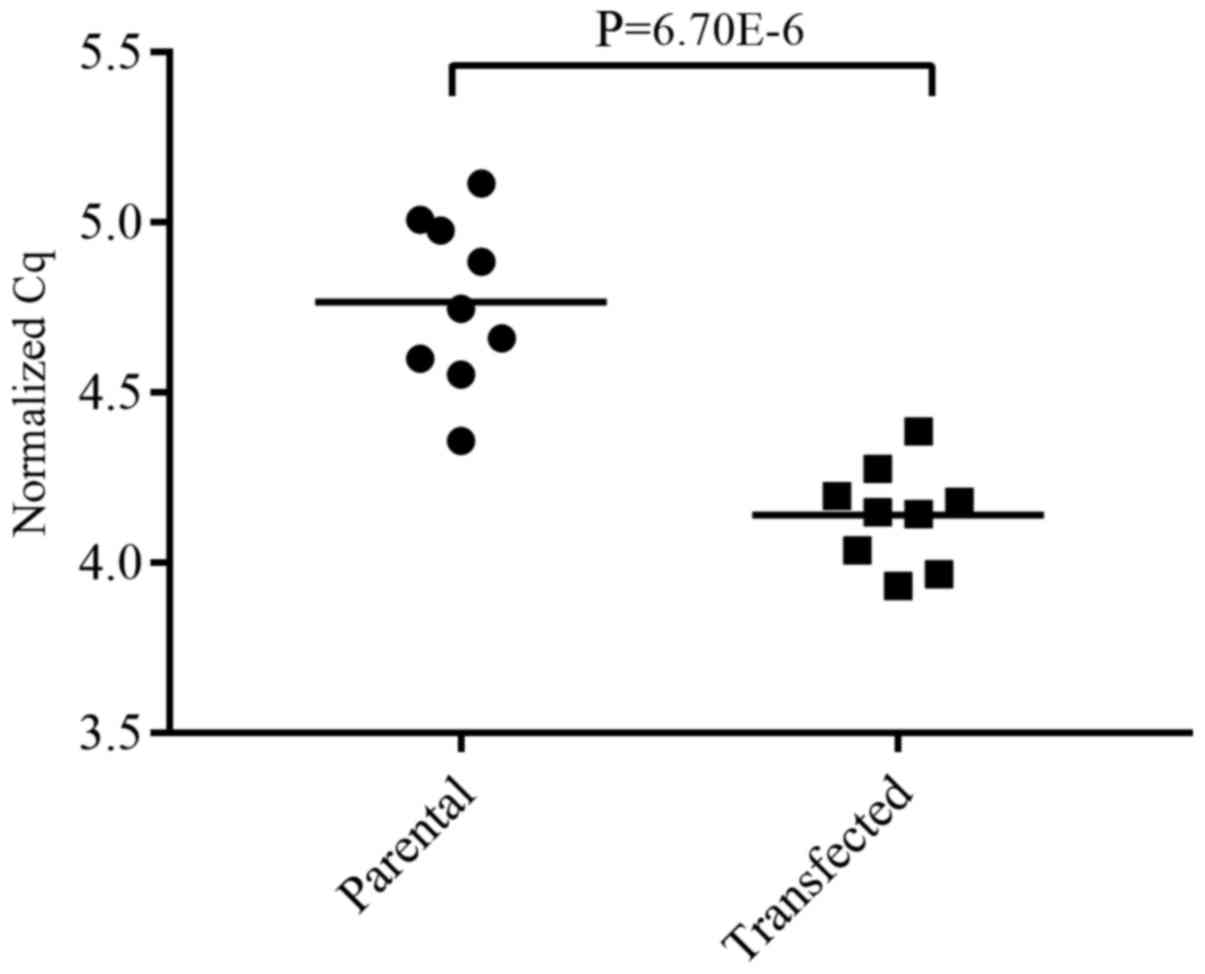
We then assessed differential miRNA regulation
between endogenous and induced GR expression using RT-qPCR and the
Student's t-test. Of the 7 miRNAs found to be significantly
regulated in the NGS data, only miR-203a-3p was validated with
statistical significance. In the transfected MDA-MB-436 cells, it
was upregulated with a log2 fold change of 0.63 (Fig. 8).
To assess the potential biological functions of
miR-203a-3p in the MDA-MB-436 cells, in which it was found to be
significantly increased in, we quantified the mRNA levels of 4 of
its predicted target genes. Using RT-qPCR, we detected a 3-fold
increase in MYLK expression during GR overexpression
(P=0.03). The expression of ACTG2, CNN1 and HLA-DPB1
was not significantly altered between the parental and transfected
cells (data not shown).
Discussion
TNBC is a particularly aggressive form of BC,
leading to a poor prognosis for patients. Both the absence of
hormone receptors and its molecular heterogeneity render TNBC a
difficult target for therapeutic intervention. Additionally, a high
GR expression was recently linked to therapy failure and worse
outcomes in patients with TNBC, as well as other solid tumors. As
Chen et al have previously reported, dexamethasone-mediated
GR activation induced the expression of genes involved in
carcinogenesis and tumor progression (7). These pro-oncogenic processes may also
be fostered by GR-responsive non-coding RNAs, including miRNAs.
This study therefore aimed at deciphering potential alterations in
extracellular and intracellular miRNAs during GR
overexpression.
GR biology is fascinatingly complex, involving
ligand- dependent receptor activation and isoform-specific
transcriptional activity (7,34).
In this study, we focused on NR3C1 transcript variant 1, as
this is not only the most common isoform in epithelial cells, but
also more transcriptionally active than others. Additionally,
previous studies have demonstrated notable increases in
NR3C1 variant 1 in TNBC (35,36).
As expected, the transfection of TNBC cell lines with
NR3C1-coding plasmids induced both a strong overexpression
of GR mRNA and the increased the expression of several downstream
targets (37–39). In concordance with previous
reports, we found that TNBC cell lines secrete EVs in an
exosome-like size range (15–17).
Small RNA from cells with endogenous and artificially increased GR
expression was sequenced, and miRNAs compared in differential
expression analyses. Although a total of 419 and 442 miRNAs were
detected in the MDA-MB-231 and MDA-MB-468 EVs, respectively, there
were no statistically significant changes in miRNA profiles for
either cell line. Increased metastasis and the progression of
GR-overexpressing TNBC may therefore not be mediated by the
secretion of soluble mediators to a significant extent. On the
other hand, Harris et al recently identified vesicular
proteins involved in BC metastasis, indicating a signaling function
of vesicle components other than miRNAs (15). Circulating miRNAs are, however, not
restricted to EVs, but can also be transported by lipoproteins and
protein complexes, such as Argonaute2 (Ago2) (40,41).
Given that this study focused exclusively on vesicular miRNAs, no
conclusions can be drawn about the impact of GR expression on
secreted miRNAs associated with other carrier vehicles.
When assessing the impact of GR overexpression on
intracellular expression profiles, we detected a slight, cell
line-specific modulation of 7 miRNAs. Even though the impact of GR
signaling on TNBC miRNAs has not yet been elucidated, previous
studies have reported GR-responsive miRNAs in primary lymphocytes,
as well as in liver and spleen cells (42–44).
In our data, the non-overlapping profiles of regulated miRNAs in
the studied cell lines may be reflective of the inherent
transcriptional heterogeneity of TNBC phenotypes (13,45,46).
Rainer et al reported similar findings for several lymphoma
cell lines that, although featuring GR-reactive miRNAs, only
displayed moderate and nonuniform changes in miRNA profiles upon GR
activation by dexamethasone (47).
In our data, the parental and transfected cells were separated by
changes in the global expression profile of miRNAs (Fig. 7). Distances between groups
decreased when reducing the number of analyzed miRNAs, indicating
that GR slightly shifts the expression patterns of many miRNAs,
instead of inducing large changes in the abundance of a few
specific transcripts.
Of note, miR-203a-3p, upregulated by GR expression
in MDA-MB-436 cells, is controversially discussed in BC literature.
Several studies have reported its overexpression in BC, as well as
an association with a poor prognosis (48–50).
Different data, on the other hand, have suggested that miR-203a-3p
serves as a tumor suppressor miRNA, and have stated a decreased
expression in BC (51-53). In this study, we found miR-203a-3p
to be significantly upregulated in the MDA-MB-436 cells upon the
overexpression of GR. As GR is known to be associated with tumor
progression, this finding may corroborate the postulation of
miR-203a-3p as an oncogenic factor in BC. However, considering the
magnitude of expression changes, its biological impact may be of
minor relevance. In line with our findings, a previous study
reported an upregulation of miR-203 in dexamethasone-treated bone
cells, potentially indicating a common miRNA response to GR
activation across cell types (54).
The myosin light chain kinase (MYLK, MLCK)
has been shown to interact with PI3K-AKT and p38 signaling,
increasing cell motility and inhibiting apoptosis in BC cells
(55,56). Furthermore, Sundararajan et
al pointed out the ability of MYLK to promote
invasiveness in several BC cell lines (57). Additionally, using LC-MS/MS-based
proteomic profiling, Lawrence et al reported TNBC to feature
particularly high levels of MYLK compared to less aggressive
BC variants (58). As MYLK
is a predicted miR-203a-3p target, we quantified its expression in
MDA-MB-436 levels using RT-qPCR. Surprisingly, an increased
miR-203a-3p expression in the transfected cells was accompanied by
a 3-fold increase in MYLK mRNA levels. This finding was not
in concordance with our expectations, as canonical miRNA regulation
involves binding of mRNAs and repressing their translation.
Consequently, the observed upregulation indicates that MYLK
is not directly bound and downregulated by miR-203a-3p.
Taken together, our data suggest that MYLK
may be regulated by GR, and can be regarded as a candidate gene
involved in the poor survival rates of TNBC patients overexpressing
GR. GR's mode of action on MYLK, however, seems not to be
mediated by major alterations in cellular miRNAs.
In conclusion, we did not observe any prominent
alterations in cellular or vesicular miRNA profiles upon
overexpression of GR. The patterns of miRNA expression seem to be
influenced by GR to only a small degree, and other mechanisms may
therefore be the primary driver for the higher mortality rates of
patients suffering from TNBC with GR overexpression.
Acknowledgments
The authors wish to thank Franz Jansen for excellent
technical assistance. We are grateful to Renate Scheler and Dr
Ricarda Schumann from the University Eye Hospital LMU Munich for
excellent assistance with TEM. We also wish to thank Professor Jörg
Kleiber for kindly providing access to the NanoSight LM10.
Funding
This study was supported by the K.L. Weigand'sche
Stiftung, Curt-Bohnewands-Fonds, Georg and Traud Gravenhorst
Stiftung, as well as by the Friedrich-Baur-Stiftung. The funders
had no role in the study design, data collection and analysis,
decision to publish, or preparation of the manuscript.
Availability of data and materials
The analyzed datasets generated during the study are
available from the corresponding author on reasonable request.
Authors' contributions
MR, GS and OS conceived and designed the
experiments; DB, RG, CM and MR performed the experiments; DB, RG,
BK and MR and performed the validation and formal analysis; DB, BK,
MWP and MR curated and analyzed the data; DB, BK and MR wrote the
manuscript; MWP, GS and OS reviewed and revised the manuscript; MR,
OS and GS acquired funding. All authors have read and approved the
final manuscript.
Ethics approval and consent to
participate
Not applicable.
Consent for publication
Not applicable.
Competing interests
The authors declare that they have no competing
interests.
References
|
1
|
Ataollahi MR, Sharifi J, Paknahad MR and
Paknahad A: Breast cancer and associated factors: A review. J Med
Life. 8:6–11. 2015.PubMed/NCBI
|
|
2
|
Malvezzi M, Bertuccio P, Levi F, La
Vecchia C and Negri E: European cancer mortality predictions for
the year 2014. Ann Oncol. 25:1650–1656. 2014. View Article : Google Scholar : PubMed/NCBI
|
|
3
|
Wahba HA and El-Hadaad HA: Current
approaches in treatment of triple-negative breast cancer. Cancer
Biol Med. 12:106–116. 2015.PubMed/NCBI
|
|
4
|
Yagata H, Kajiura Y and Yamauchi H:
Current strategy for triple-negative breast cancer: Appropriate
combination of surgery, radiation, and chemotherapy. Breast Cancer.
18:165–173. 2011. View Article : Google Scholar : PubMed/NCBI
|
|
5
|
Hurvitz S and Mead M: Triple-negative
breast cancer: Advancements in characterization and treatment
approach. Curr Opin Obstet Gynecol. 28:59–69. 2016.
|
|
6
|
Sundahl N, Clarisse D, Bracke M, Offner F,
Berghe WV and Beck IM: Selective glucocorticoid receptor-activating
adjuvant therapy in cancer treatments. Oncoscience. 3:188–202.
2016.PubMed/NCBI
|
|
7
|
Chen Z, Lan X, Wu D, Sunkel B, Ye Z, Huang
J, Liu Z, Clinton SK, Jin VX and Wang Q: Ligand-dependent genomic
function of glucocorticoid receptor in triple-negative breast
cancer. Nat Commun. 6:83232015. View Article : Google Scholar : PubMed/NCBI
|
|
8
|
Skor MN, Wonder EL, Kocherginsky M, Goyal
A, Hall BA, Cai Y and Conzen SD: Glucocorticoid receptor antagonism
as a novel therapy for triple-negative breast cancer. Clin Cancer
Res. 19:6163–6172. 2013. View Article : Google Scholar
|
|
9
|
Tessel MA, Krett NL and Rosen ST: Steroid
receptor and microRNA regulation in cancer. Curr Opin Oncol.
22:592–597. 2010. View Article : Google Scholar : PubMed/NCBI
|
|
10
|
Zhang B, Pan X, Cobb GP and Anderson TA:
microRNAs as oncogenes and tumor suppressors. Dev Biol. 302:1–12.
2007. View Article : Google Scholar
|
|
11
|
Lowery AJ, Miller N, Devaney A, McNeill
RE, Davoren PA, Lemetre C, Benes V, Schmidt S, Blake J, Ball G, et
al: MicroRNA signatures predict oestrogen receptor, progesterone
receptor and HER2/neu receptor status in breast cancer. Breast
Cancer Res. 11:R272009. View
Article : Google Scholar : PubMed/NCBI
|
|
12
|
Chang YY, Kuo WH, Hung JH, Lee CY, Lee YH,
Chang YC, Lin WC, Shen CY, Huang CS, Hsieh FJ, et al: Deregulated
microRNAs in triple-negative breast cancer revealed by deep
sequencing. Mol Cancer. 14:362015. View Article : Google Scholar : PubMed/NCBI
|
|
13
|
Cascione L, Gasparini P, Lovat F, Carasi
S, Pulvirenti A, Ferro A, Alder H, He G, Vecchione A, Croce CM, et
al: Integrated microRNA and mRNA signatures associated with
survival in triple negative breast cancer. PLoS One. 8:e559102013.
View Article : Google Scholar : PubMed/NCBI
|
|
14
|
Falcone G, Felsani A and D'Agnano I:
Signaling by exosomal microRNAs in cancer. J Exp Clin Cancer Res.
34:322015. View Article : Google Scholar : PubMed/NCBI
|
|
15
|
Harris DA, Patel SH, Gucek M, Hendrix A,
Westbroek W and Taraska JW: Exosomes released from breast cancer
carcinomas stimulate cell movement. PLoS One. 10:e01174952015.
View Article : Google Scholar : PubMed/NCBI
|
|
16
|
O'Brien K, Rani S, Corcoran C, Wallace R,
Hughes L, Friel AM, McDonnell S, Crown J, Radomski MW and
O'Driscoll L: Exosomes from triple-negative breast cancer cells can
transfer phenotypic traits representing their cells of origin to
secondary cells. Eur J Cancer. 49:1845–1859. 2013. View Article : Google Scholar : PubMed/NCBI
|
|
17
|
Singh R, Pochampally R, Watabe K, Lu Z and
Mo YY: Exosome-mediated transfer of miR-10b promotes cell invasion
in breast cancer. Mol Cancer. 13:2562014. View Article : Google Scholar : PubMed/NCBI
|
|
18
|
Liu Y, Zhang Y, Li Q, Li J, Ma X, Xing J,
Rong S, Wu Z, Tian Y, Li J, et al: MiRNAs predict the prognosis of
patients with triple negative breast cancer: A meta-analysis. PLoS
One. 12:e01700882017. View Article : Google Scholar : PubMed/NCBI
|
|
19
|
Liu LL, Zhao H, Ma TF, Ge F, Chen CS and
Zhang YP: Identification of valid reference genes for the
normalization of RT-qPCR expression studies in human breast cancer
cell lines treated with and without transient transfection. PLoS
One. 10:e01170582015. View Article : Google Scholar : PubMed/NCBI
|
|
20
|
Livak KJ and Schmittgen TD: Analysis of
relative gene expression data using real-time quantitative PCR and
the 2(−Delta Delta C(T)) Method. Methods. 25:402–408. 2001.
View Article : Google Scholar
|
|
21
|
Spornraft M, Kirchner B, Haase B, Benes V,
Pfaffl MW and Riedmaier I: Optimization of extraction of
circulating RNAs from plasma - enabling small RNA sequencing. PLoS
One. 9:e1072592014. View Article : Google Scholar
|
|
22
|
Andrews S: FastQC: a quality control tool
for high throughput sequence data. http://www.citeulike.org/user/nailest/article/11583827.
Accessed Nov 21, 2017.
|
|
23
|
Kong Y: Btrim: A fast, lightweight adapter
and quality trimming program for next-generation sequencing
technologies. Genomics. 98:152–153. 2011. View Article : Google Scholar : PubMed/NCBI
|
|
24
|
Buschmann D, Haberberger A, Kirchner B,
Spornraft M, Riedmaier I, Schelling G and Pfaffl MW: Toward
reliable biomarker signatures in the age of liquid biopsies - how
to standardize the small RNA-Seq workflow. Nucleic Acids Res.
44:5995–6018. 2016. View Article : Google Scholar : PubMed/NCBI
|
|
25
|
Consortium RN; RNAcentral Consortium:
RNAcentral: An international database of ncRNA sequences. Nucleic
Acids Res. 43D:D123–D129. 2015.
|
|
26
|
Kozomara A and Griffiths-Jones S: miRBase:
Annotating high confidence microRNAs using deep sequencing data.
Nucleic Acids Res. 42(D1): D68–D73. 2014. View Article : Google Scholar :
|
|
27
|
Langmead B, Trapnell C, Pop M and Salzberg
SL: Ultrafast and memory-efficient alignment of short DNA sequences
to the human genome. Genome Biol. 10:R252009. View Article : Google Scholar : PubMed/NCBI
|
|
28
|
Li H, Handsaker B, Wysoker A, Fennell T,
Ruan J, Homer N, Marth G, Abecasis G and Durbin R; 1000 Genome
Project Data Processing Subgroup: The Sequence Alignment/Map format
and SAMtools. Bioinformatics. 25:2078–2079. 2009. View Article : Google Scholar : PubMed/NCBI
|
|
29
|
Love MI, Huber W and Anders S: Moderated
estimation of fold change and dispersion for RNA-seq data with
DESeq2. Genome Biol. 15:5502014. View Article : Google Scholar
|
|
30
|
Vandesompele J, Kubista M and Pfaffl MW:
Reference gene validation software for improved normalization.
Real-Time PCR: Current Technology and Applications. Logan J,
Edwards K and Saunders N: Caister Academic Press; London: pp.
47–64. 2009
|
|
31
|
Andersen CL, Jensen JL and Ørntoft TF:
Normalization of real-time quantitative reverse transcription-PCR
data: A model-based variance estimation approach to identify genes
suited for normalization, applied to bladder and colon cancer data
sets. Cancer Res. 64:5245–5250. 2004. View Article : Google Scholar : PubMed/NCBI
|
|
32
|
Dweep H, Sticht C, Pandey P and Gretz N:
miRWalk - database: Prediction of possible miRNA binding sites by
'walking' the genes of three genomes. J Biomed Inform. 44:839–847.
2011. View Article : Google Scholar : PubMed/NCBI
|
|
33
|
Ramaswamy S, Ross KN, Lander ES and Golub
TR: A molecular signature of metastasis in primary solid tumors.
Nat Genet. 33:49–54. 2003. View
Article : Google Scholar
|
|
34
|
Lu NZ and Cidlowski JA: Glucocorticoid
receptor isoforms generate transcription specificity. Trends Cell
Biol. 16:301–307. 2006. View Article : Google Scholar : PubMed/NCBI
|
|
35
|
Reeder A, Attar M, Nazario L, Bathula C,
Zhang A, Hochbaum D, Roy E, Cooper KL, Oesterreich S, Davidson NE,
et al: Stress hormones reduce the efficacy of paclitaxel in triple
negative breast cancer through induction of DNA damage. Br J
Cancer. 112:1461–1470. 2015. View Article : Google Scholar : PubMed/NCBI
|
|
36
|
McNamara KM, Kannai A and Sasano H:
Possible roles for glucocorticoid signalling in breast cancer. Mol
Cell Endocrinol. S0303-7207(17)30358-1. 2017.PubMed/NCBI
|
|
37
|
Wu W, Pew T, Zou M, Pang D and Conzen SD:
Glucocorticoid receptor-induced MAPK phosphatase-1 (MPK-1)
expression inhibits paclitaxel-associated MAPK activation and
contributes to breast cancer cell survival. J Biol Chem.
280:4117–4124. 2005. View Article : Google Scholar
|
|
38
|
Maiyar AC, Phu PT, Huang AJ and Firestone
GL: Repression of glucocorticoid receptor transactivation and DNA
binding of a glucocorticoid response element within the
serum/glucocorticoid-inducible protein kinase (sgk) gene promoter
by the p53 tumor suppressor protein. Mol Endocrinol. 11:312–329.
1997. View Article : Google Scholar : PubMed/NCBI
|
|
39
|
Ayroldi E and Riccardi C:
Glucocorticoid-induced leucine zipper (GILZ): A new important
mediator of glucocorticoid action. FASEB J. 23:3649–3658. 2009.
View Article : Google Scholar : PubMed/NCBI
|
|
40
|
Arroyo JD, Chevillet JR, Kroh EM, Ruf IK,
Pritchard CC, Gibson DF, Mitchell PS, Bennett CF,
Pogosova-Agadjanyan EL, Stirewalt DL, et al: Argonaute2 complexes
carry a population of circulating microRNAs independent of vesicles
in human plasma. Proc Natl Acad Sci USA. 108:5003–5008. 2011.
View Article : Google Scholar : PubMed/NCBI
|
|
41
|
Vickers KC, Palmisano BT, Shoucri BM,
Shamburek RD and Remaley AT: MicroRNAs are transported in plasma
and delivered to recipient cells by high-density lipoproteins. Nat
Cell Biol. 13:423–433. 2011. View Article : Google Scholar : PubMed/NCBI
|
|
42
|
Puimège L, Van Hauwermeiren F, Steeland S,
Van Ryckeghem S, Vandewalle J, Lodens S, Dejager L, Vandevyver S,
Staelens J, Timmermans S, et al: Glucocorticoid-induced
microRNA-511 protects against TNF by down-regulating TNFR1. EMBO
Mol Med. 7:1004–1017. 2015. View Article : Google Scholar : PubMed/NCBI
|
|
43
|
Smith LK, Tandon A, Shah RR, Mav D,
Scoltock AB and Cidlowski JA: Deep sequencing identification of
novel glucocorticoid-responsive miRNAs in apoptotic primary
lymphocytes. PLoS One. 8:e783162013. View Article : Google Scholar : PubMed/NCBI
|
|
44
|
Wang ZH, Liang YB, Tang H, Chen ZB, Li ZY,
Hu XC and Ma ZF: Dexamethasone down-regulates the expression of
microRNA-155 in the livers of septic mice. PLoS One. 8:e805472013.
View Article : Google Scholar : PubMed/NCBI
|
|
45
|
Mathe A, Scott RJ and Avery-Kiejda KA:
MiRNAs and other epigenetic changes as biomarkers in triple
negative breast cancer. Int J Mol Sci. 16:28347–28376. 2015.
View Article : Google Scholar : PubMed/NCBI
|
|
46
|
Radojicic J, Zaravinos A, Vrekoussis T,
Kafousi M, Spandidos DA and Stathopoulos EN: MicroRNA expression
analysis in triple-negative (ER, PR and Her2/neu) breast cancer.
Cell Cycle. 10:507–517. 2011. View Article : Google Scholar : PubMed/NCBI
|
|
47
|
Rainer J, Ploner C, Jesacher S, Ploner A,
Eduardoff M, Mansha M, Wasim M, Panzer-Grümayer R, Trajanoski Z,
Niederegger H, et al: Glucocorticoid-regulated microRNAs and
mirtrons in acute lymphoblastic leukemia. Leukemia. 23:746–752.
2009. View Article : Google Scholar : PubMed/NCBI
|
|
48
|
Shao Y, Gu W, Ning Z, Song X, Pei H and
Jiang J: Evaluating the prognostic value of microRNA-203 in solid
tumors based on a meta-analysis and the Cancer Genome Atlas (TCGA)
Datasets. Cell Physiol Biochem. 41:1468–1480. 2017. View Article : Google Scholar
|
|
49
|
He S, Zhang G, Dong H, Ma M and Sun Q:
miR-203 facilitates tumor growth and metastasis by targeting
fibroblast growth factor 2 in breast cancer. Onco Targets Ther.
9:6203–6210. 2016. View Article : Google Scholar : PubMed/NCBI
|
|
50
|
Liang Y, Yang W, Zhu Y and Yuan Y:
Prognostic role of microRNA-203 in various carcinomas: Evidence
from a meta-analysis involving 13 studies. Springerplus.
5:15382016. View Article : Google Scholar : PubMed/NCBI
|
|
51
|
Ding X, Park SI, McCauley LK and Wang CY:
Signaling between transforming growth factor β (TGF-β) and
transcription factor SNAI2 represses expression of microRNA miR-203
to promote epithelial-mesenchymal transition and tumor metastasis.
J Biol Chem. 288:10241–10253. 2013. View Article : Google Scholar : PubMed/NCBI
|
|
52
|
Wang C, Zheng X, Shen C and Shi Y:
MicroRNA-203 suppresses cell proliferation and migration by
targeting BIRC5 and LASP1 in human triple-negative breast cancer
cells. J Exp Clin Cancer Res. 31:582012. View Article : Google Scholar : PubMed/NCBI
|
|
53
|
Zhang Z, Zhang B, Li W, Fu L, Fu L, Zhu Z
and Dong JT: Epigenetic silencing of miR-203 upregulates SNAI2 and
contributes to the invasiveness of malignant breast cancer cells.
Genes Cancer. 2:782–791. 2011. View Article : Google Scholar
|
|
54
|
Laxman N, Rubin CJ, Mallmin H, Nilsson O,
Tellgren-Roth C and Kindmark A: Second generation sequencing of
microRNA in human bone cells treated with parathyroid hormone or
dexamethasone. Bone. 84:181–188. 2016. View Article : Google Scholar : PubMed/NCBI
|
|
55
|
Choi C, Kwon J, Lim S and Helfman DM:
Integrin β1, myosin light chain kinase and myosin IIA are required
for activation of PI3K-AKT signaling following MEK inhibition in
metastatic triple negative breast cancer. Oncotarget.
7:63466–63487. 2016. View Article : Google Scholar : PubMed/NCBI
|
|
56
|
Cui WJ, Liu Y, Zhou XL, Wang FZ, Zhang XD
and Ye LH: Myosin light chain kinase is responsible for high
proliferative ability of breast cancer cells via anti-apoptosis
involving p38 pathway. Acta Pharmacol Sin. 31:725–732. 2010.
View Article : Google Scholar : PubMed/NCBI
|
|
57
|
Sundararajan V, Gengenbacher N, Stemmler
MP, Kleemann JA, Brabletz T and Brabletz S: The ZEB1/miR-200c
feedback loop regulates invasion via actin interacting proteins
MYLK and TKS5. Oncotarget. 6:27083–27096. 2015. View Article : Google Scholar : PubMed/NCBI
|
|
58
|
Lawrence RT, Perez EM, Hernández D, Miller
CP, Haas KM, Irie HY, Lee SI, Blau CA and Villén J: The proteomic
landscape of triple-negative breast cancer. Cell Reports.
11:630–644. 2015. View Article : Google Scholar : PubMed/NCBI
|