Introduction
Bladder cancer (BC) was the 5th most commonly
diagnosed cancer and the 8th most common cause of cancer-associated
mortality among the 40 European Union countries in 2012. In that
same year, 429,800 new cases of BC were diagnosed, and 165,000
patients succumbed to BC worldwide (1,2). The
5-year survival rate of patients with BC has improved by only a
small percentage during the last 30 years according to the National
Cancer Institute program Surveillance, Epidemiology and End Results
(3). One factor in the lack of
improvement in BC survival rates is the limited efficacy of
cisplatin-based combination chemotherapy (4). Thus, innovative therapeutic
strategies are required to improve BC outcomes.
RAS proteins are small molecular weight GTPases that
couple extracellular signals to intracellular effector pathways.
Mammalian cells encode three closely related RAS proteins, HRas
proto-oncogene GTPase (HRAS), NRAS protooncogene GTPase (NRAS) and
KRAS proto-oncogene GTPase (KRAS), which have critical roles in
fundamental cellular processes, including proliferation, survival,
differentiation, motility and transcription (5). The RAS pathway is one of the most
commonly deregulated pathways in human cancer (6), and activating mutations in RAS genes
occur in ~30% of all tumors (7).
These mutations typically render RAS as constitutively GTP-bound,
resulting in activation of downstream effector pathways regardless
of extracellular stimulation (6).
Substitution of glycine for valine at amino acid 12 (G12V) is one
of the most frequently observed RAS mutations that interferes with
GTPase-activating protein-mediated GTP hydrolysis, leading to
excess amounts of active GTP-bound RAS. Notably, the type of
mutated RAS gene (HRAS, KRAS or NRAS)
varies depending on the tumor type; KRAS mutations are frequently
detected in pancreatic carcinoma (80–90%) and colorectal carcinoma
(30–60%), whereas HRAS mutations are frequent in BC (7–66%) and
thyroid cancer (0–60%) (8).
RAS is considered 'undruggable' because the RAS
protein lacks a druggable binding pocket (9,10).
Additionally, development of specific and competitive nucleotide
inhibitors is challenging, because RAS binds nucleotide ligands
with high affinity (10). To
overcome these challenges, the RAS antagonist salirasib, also
termed farnesylthiosalicylate, was designed to competitively
inhibit attachment of GTP-bound RAS to the plasma membrane, which
in turn inactivates RAS signaling (11). Salirasib inhibits all RAS isoforms
and inhibits the growth of RAS-driven cancer (11,12).
Although applications of salirasib have been tested in several
clinical trials for cancers other than BC (13–16),
it exhibited insufficient tumor suppressive effects in trials in
which salirasib was the single agent. In addition, relatively high
concentrations of salirasib were required to achieve sufficient
tumor suppressive effects (17,18).
Therefore, a more detailed examination of the effects of salirasib
is required to understand the mechanism by which salirasib acts on
RAS. Recently, Matsumoto et al (19) developed a targeted proteomics
platform, in vitro proteome-assisted multiple reaction
monitoring for protein absolute quantification (iMPAQT), that
analyzes 18,000 human recombinant proteins to enable absolute
protein quantification on a genome-wide scale (19) and overcome limitations in
quantitative accuracy, reproducibility, and analysis speed
associated with conventional analysis methods. Use of iMPAQT allows
large-scale and accurate assessment of protein abundances that can
influence cellular phenotypes.
In the current study, the therapeutic of potential
of HRAS knockdown by salirasib or RNA interference was
investigated in two BC cell lines (T24 cells with HRAS G12V
mutation and BOY cells without HRAS mutation). Furthermore, newly
developed quantitative proteome analysis of BC cells treated with
salirasib was performed to elucidate the mechanisms underlying the
actions of salirasib toward HRAS.
Materials and methods
Analysis in the BC cohort of The Cancer
Genome Atlas (TCGA)
Sequencing data were available for 407 BC samples
and 19 normal bladder epithelial samples in TCGA database
(tcga-data.nci.nih. gov/tcga/). We used TCGA to analyze HRAS
mRNA expression levels in normal and BC tissues and to evaluate
differences in HRAS mRNA expression levels according to HRAS
mutational status. RNA-Seq by Expectation Maximization software was
used for gene expression quantification (20). Full sequencing information, somatic
mutation information, and clinical information were acquired using
UCSC Xena (xena.ucsc.ed/) and TCGA. The current study meets
publication guidelines provided by TCGA (cancergenome.nih.gov/publications/publicationguidelines).
Cell culture and RNA extraction
Four human BC cell lines were used. T24, KK47 and
UMUC cells, which were obtained from the American Type Culture
Collection (Manassas, VA, USA), and BOY cells, which were
established in our laboratory from a 66-year-old Asian male patient
diagnosed with stage III BC with lung metastasis. These cell lines
were maintained in the minimum essential Eagle's medium
(Sigma-Aldrich; Merck KGaA, Darmstadt, Germany), containing 10%
fetal bovine serum (Equitech-Bio, Inc., Kerrville, TX, USA), 50
µg/ml streptomycin, and 50 U/ml penicillin in a humidified
atmosphere of 95% air/5% CO2 at 37°C. Total RNA was
isolated using Isogen (Nippon Gene Co., Ltd., Tokyo, Japan)
according to the manufacturer's protocol. The integrity of the RNA
was checked with an RNA 6000 Nano assay kit and a 2100 Bioanalyzer
(Agilent Technologies, Inc., Santa Clara, CA, USA).
Reverse transcription-quantitative
polymerase chain reaction (RT-qPCR)
A SYBR-Green qPCR-based array approach was used for
RT-qPCR. RT was performed using the TaqMan High-Capacity cDNA
Reverse Transcription Kit (cat. no. 4368814; Applied Biosystems;
Thermo Fisher Scientific, Inc., Waltham, MA, USA) under the
incubation conditions (25°C for 10 min, 37°C for 120 min and 85°C
for 5 min) according to the manufacturer's instructions. The primer
set for determination of mRNA expression levels was as follows:
HRAS, forward, 5′-ATGACGGAATATAAGCTGGTGGT-3′ and reverse,
5′-GGCACGTCTCCCCATCAATG-3′; hypoxia inducible factor-1α
(HIF-1α), forward, 5′-GAACGTCGAAAAGAAAA GTCTCG-3′ and
reverse, 5′-CCTTATCAAGATGCGAACTC ACA-3′; glucuronidase β
(GUSB), forward, 5′-CGTCCCACCTAGAATCTGCT-3′ and reverse,
5′-TTGCTCACAAAGGT CACAGG-3′. The experimental procedures followed
the protocol recommended by the manufacturer. RT-qPCR was performed
with 500 ng total RNA using the Power SYBR-Green Master Mix (cat.
no. 4367659) with the 7300 Real-time PCR System (both from Applied
Biosystems; Thermo Fisher Scientific, Inc.). Amplification
specificity was monitored using the dissociation curve of the
amplified product. All data values were normalized with respect to
GUSB, and the ΔΔCq method was used to calculate the
fold-change (21). Human Bladder
Total RNA (cat. no. AM7990; Applied Biosystems; Thermo Fisher
Scientific, Inc.) as control RNA derived from normal bladder
tissue.
Salirasib treatment
For in vitro experiments, salirasib (CAS
162520-00-5; Santa Cruz Biotechnology, Inc., Dallas, TX, USA) was
solubilized in 0.1% DMSO. The salirasib/DMSO solution and control
vehicle (0.1% DMSO) were prepared in Dulbecco's modified Eagle's
medium at different concentrations, and each mixture was placed in
cell culture plates (8×10⁴/ml) so that the final
salirasib concentrations were 1.6, 3.1, 6.3, 12.5, 25, 50, 100 and
200 µM, whereas the DMSO concentration was adjusted to 0.1%.
Each cell culture plate was treated with salirasib or control
vehicle for 24 h. For in vivo experiments, salirasib was
solubilized with 0.5% ethanol. The salirasib/ethanol solution was
alkalinized with 1 N NaOH and then diluted with phosphate buffered
saline to yield a 4 mg/ml (pH 8.0) solution. This solution or
control vehicle (0.5% ethanol) were intraperitoneally (i.p.)
injected daily 100 µl per mouse.
Transfection with small interfering RNA
(siRNA)
As described previously (22), T24 and BOY cells were transfected
using Lipofectamine RNAiMAX transfection reagent and Opti-MEM (both
from Thermo Fisher Scientific, Inc.) together with 10 nM HRAS siRNA
(nos. Hs_HRAS_1174, Hs_HRAS_1177 and Hs_HRAS_1178; Sigma-Aldrich;
Merck KGaA) or negative-control siRNA (no. D-001810-10; Thermo
Fisher Scientific, Inc.) for loss-of-function experiments. The
sequences of the siRNAs were as follows: Hs_HRAS_1174_s,
5′rGUrGrCrCUrGUUrGr GrArCrAUrCrCUrGTT; Hs_HRAS_1174_as, 5′rCrArGrGr
AUrGUrCrCrArArCrArGrGrCrArCTT; Hs_HRAS_1177_s,
5′rGrArCrGUrGrCrCUrGUUrGrGrArCrAUrCTT; Hs_HRAS_1177_as,
5′rGrAUrGUrCrCrArArCrArGrGrCrArCr GUrCTT; Hs_HRAS_1178_s,
5′rGrGrGrCUUrCrCUrGUrGU rGUrGUUUTT; and Hs_HRAS_1178_as,
5′rArArArCrArCrAr CrArCrArGrGrArArGrCrCrCTT. Subsequent experiments
were performed 72 h after siRNA transfection.
Cell proliferation, migration, and
invasion assays
T24 and BOY cells were transfected with 10 nM siRNA
by reverse transfection. Cells were seeded in 96-well plates with
3×10³ cells/well for XTT assays. After 72 h, cell
proliferation was determined using a Cell Proliferation Kit II
(Roche Diagnostics GmbH, Mannheim, Germany) as described previously
(22). Cell migration activity was
evaluated with wound healing assays. Cells were plated in 6-well
plates at 2×10⁵ cells per well, and after 48 h of
transfection the cell monolayer was scraped using a P-20
micropipette tip. The initial (0 h) and residual gap length 18 h
after wounding were calculated from photomicrographs as previously
described (22). Cell invasion
assays were performed using modified Boyden chambers consisting of
Matrigel-coated Transwell membrane filter inserts with 8-µM
pores in 24 well tissue culture plates (BD Biosciences, San Jose,
CA, USA). At 72 h after transfection, cells were plated in 24-well
plates at 1×10⁵ cells/well. Minimum essential Eagle's
medium containing 10% fetal bovine serum (Equitech-Bio, Inc.) in
the lower chamber served as the chemoattractant, as described
previously (22). Medium Eagle
fetal bovine serum and cells were prepared in the upper chamber and
incubated for 24 h.
Western blot analysis
Cells were harvested 72 h after transfection, and
lysates were prepared in radioimmunoprecipitation assay lysis
buffer (Thermo Fisher Scientific, Inc.) containing protease
inhibitor cocktail (Sigma-Aldrich; Merck KGaA). Proteins were
quantified by Bradford method using BioPhotometer (Eppendorf,
Hamburg, Germany). Proteins (50 µg) were separated by NuPAGE
on 4–12% bistris gels (Invitrogen; Thermo Fisher Scientific, Inc.)
and transferred to polyvinylidene difluoride membranes. Following
blocking in Tris-buffered saline containing 0.1% Tween-20 (TBS-T)
with 5% nonfat dry milk for 15 min at 25°C, membranes were washed
four times in TBS-T and incubated with primary antibodies overnight
at 4°C. Immunoblotting was performed with diluted rabbit polyclonal
anti-HRAS antibodies (1:1,000; cat. no. GTX116041; GeneTex, Inc.,
Irvine, CA, USA), goat polyclonal anti-HIF-1α antibodies (1:1,000;
cat. no. AF1935; R&D Systems, Inc., Minneapolis, MN, USA) and
rabbit polyclonal anti-β-actin antibodies (1:1,000; cat. no.
bs-0061R; BIOSS, Beijing, China) according to the manufacturer's
instructions for each antigen. The secondary antibodies were
peroxidase-labelled anti-rabbit IgG (1 h at 25°C; 1:5,000; cat. no.
7074S; Cell Signaling Technology, Inc., Danvers, MA, USA) and
anti-goat IgG (1 h at 25°C; 1:5,000; cat. no. sc-2020; Santa Cruz
Biotechnology, Inc.). Specific complexes were visualized with an
enhanced chemiluminescence detection system (GE Healthcare Life
Sciences, Little Chalfont, UK) as described previously (23).
Proteomic analysis
To comprehensively investigate metabolic changes in
BC cells treated with salirasib, proteomic analysis was performed
using iMPAQT (19). Proteins with
downregulated expression were detected in salirasib-treated BC
cells compared with untreated cells (fold change <0.5) and
proteins that were common to both T24 and BOY were identified. The
proteins were then categorized into Kyoto Encyclopedia of Genes and
Genomes (KEGG) pathways through GeneCodis analysis (genecodis.cnb.csic.es).
In vivo tumor xenograft model
To investigate in vivo effects of salirasib,
a mixture containing 100 µl BOY cells (5×10⁶) and
100 µl Matrigel Matrix (Corning Incorporated, Corning, NY,
USA) was injected subcutaneously into one side flank of 9 female
nude mice (BALB/c nu/nu; 8 weeks old; 16–19 g). The mice were
randomly separated into salirasib-treated (n=5) and control (n=4)
groups. Each breeding room was kept at a temperature of 23±1°C and
a humidity of 40–70%. The light/dark cycle was set to 12 h. Food
and water was placed to be accessible from each cage. From the day
following tumor implantation, salirasib (0.4 mg/mouse, i.p., daily)
and control vehicle (0.5% ethanol, 100 µl/mouse, i.p.,
daily) treatment were administered for 25 days. Tumor sizes were
measured twice weekly and tumor volumes were calculated as follows:
Tumor volume = [(long axis length in millimeters/2) × (short axis
length/2)2 × π × 4]/3. All animal experiments were
performed in accordance with institutional guidelines and were
approved by the animal care review board of Kagoshima University
(Kagoshima, Japan).
Statistical analysis
Data are presented as the mean ± standard deviation
at least three independent experiments. The relationships between
two groups were analyzed using Mann-Whitney U tests. The
relationships between three or more variables and numerical values
were analyzed using Bonferroni-adjusted Mann-Whitney U tests. All
analyses were performed using Expert StatView software, version 5.0
(SAS Institute, Inc., Cary, NC, USA). P<0.05 was considered to
indicate a statistically significant difference.
Results
Expression levels of HRAS in BC and BC
cell lines
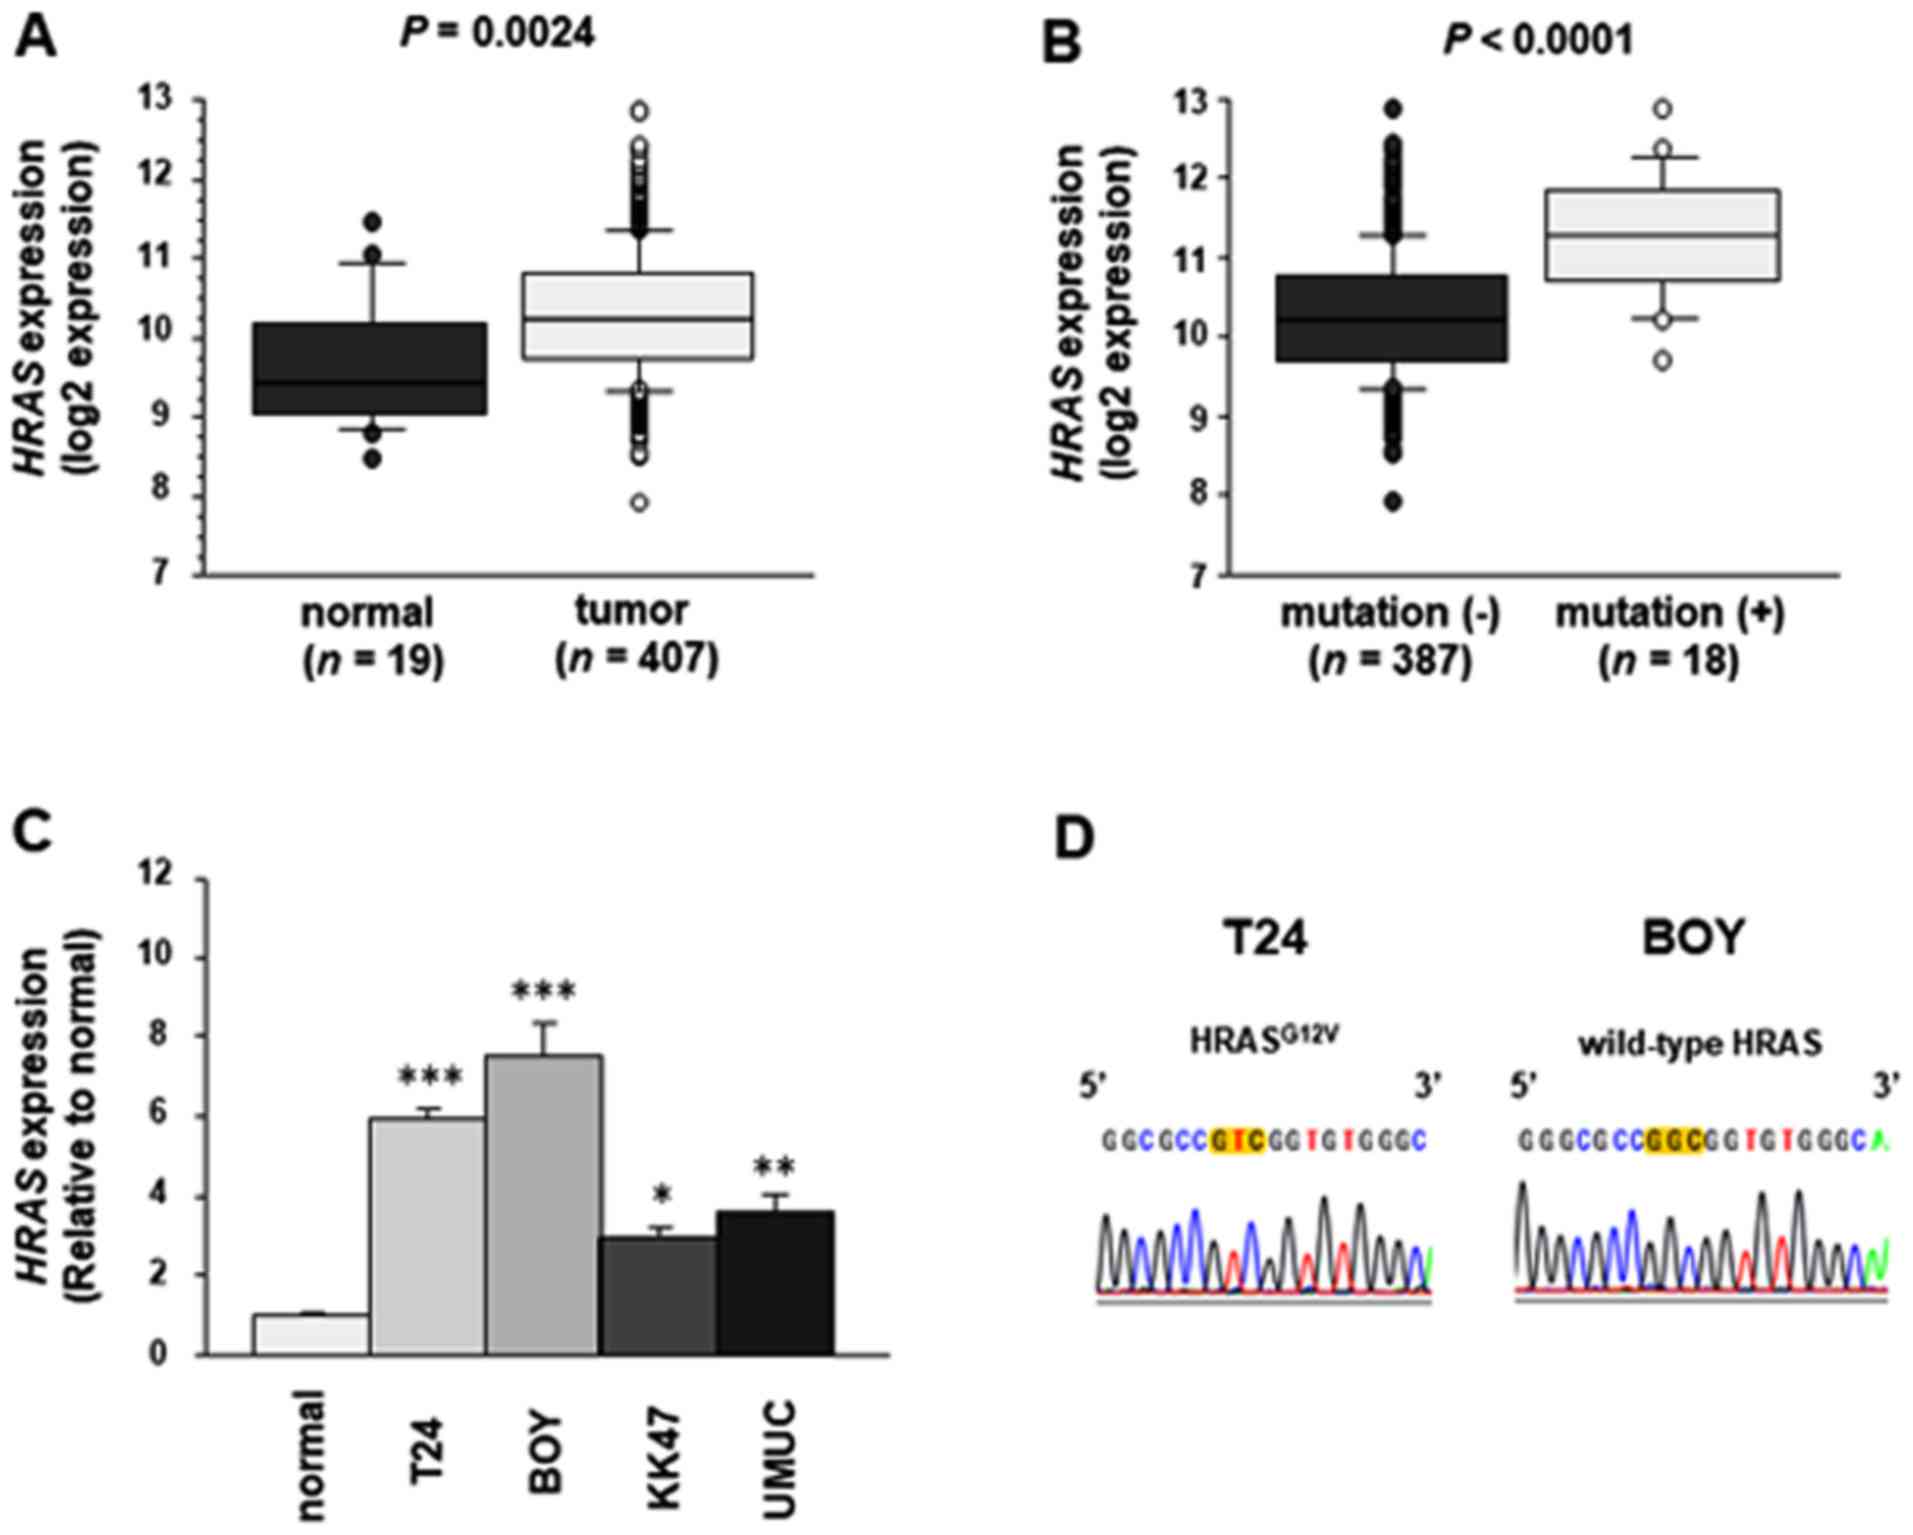
The expression levels of HRAS were evaluated
using TCGA data from BC samples (n=407) and normal samples (n=19).
HRAS expression levels were significantly upregulated in
tumor tissues compared with those in normal bladder epithelia
(tumor, 10.314±0.813; normal, 9.707±0.826; P=0.0024, Mann-Whitney U
tests; Fig. 1A). Furthermore,
HRAS expression was significantly upregulated in patients
with BC with mutant HRAS compared with patients with wild-type HRAS
(mutant HRAS, 11.277±0.805; wild-type HRAS, 10.267±0.788;
P<0.0001, Mann-Whitney U tests) (Fig. 1B). HRAS mRNA expression was
also significantly upregulated in BC cell lines compared to
patients with normal bladder tissues (T24, 5.960±0.344,
P<0.0001; BOY, 7.528±1.506, P<0.0001; KK47, 2.934±0.464,
P=0.0176; UMUC, 3.561±0.854, P=0.0034; Bonferroni-adjusted
Mann-Whitney U tests; Fig. 1C).
Sequencing data from TCGA revealed that T24 cells had
HRASG12V (the substitution of glycine by valine at codon
12 in HRAS) and BOY cells had wild-type HRAS (Fig. 1D).
Effects of HRAS knockdown on cell
proliferation, migration, and invasion of BC cell lines
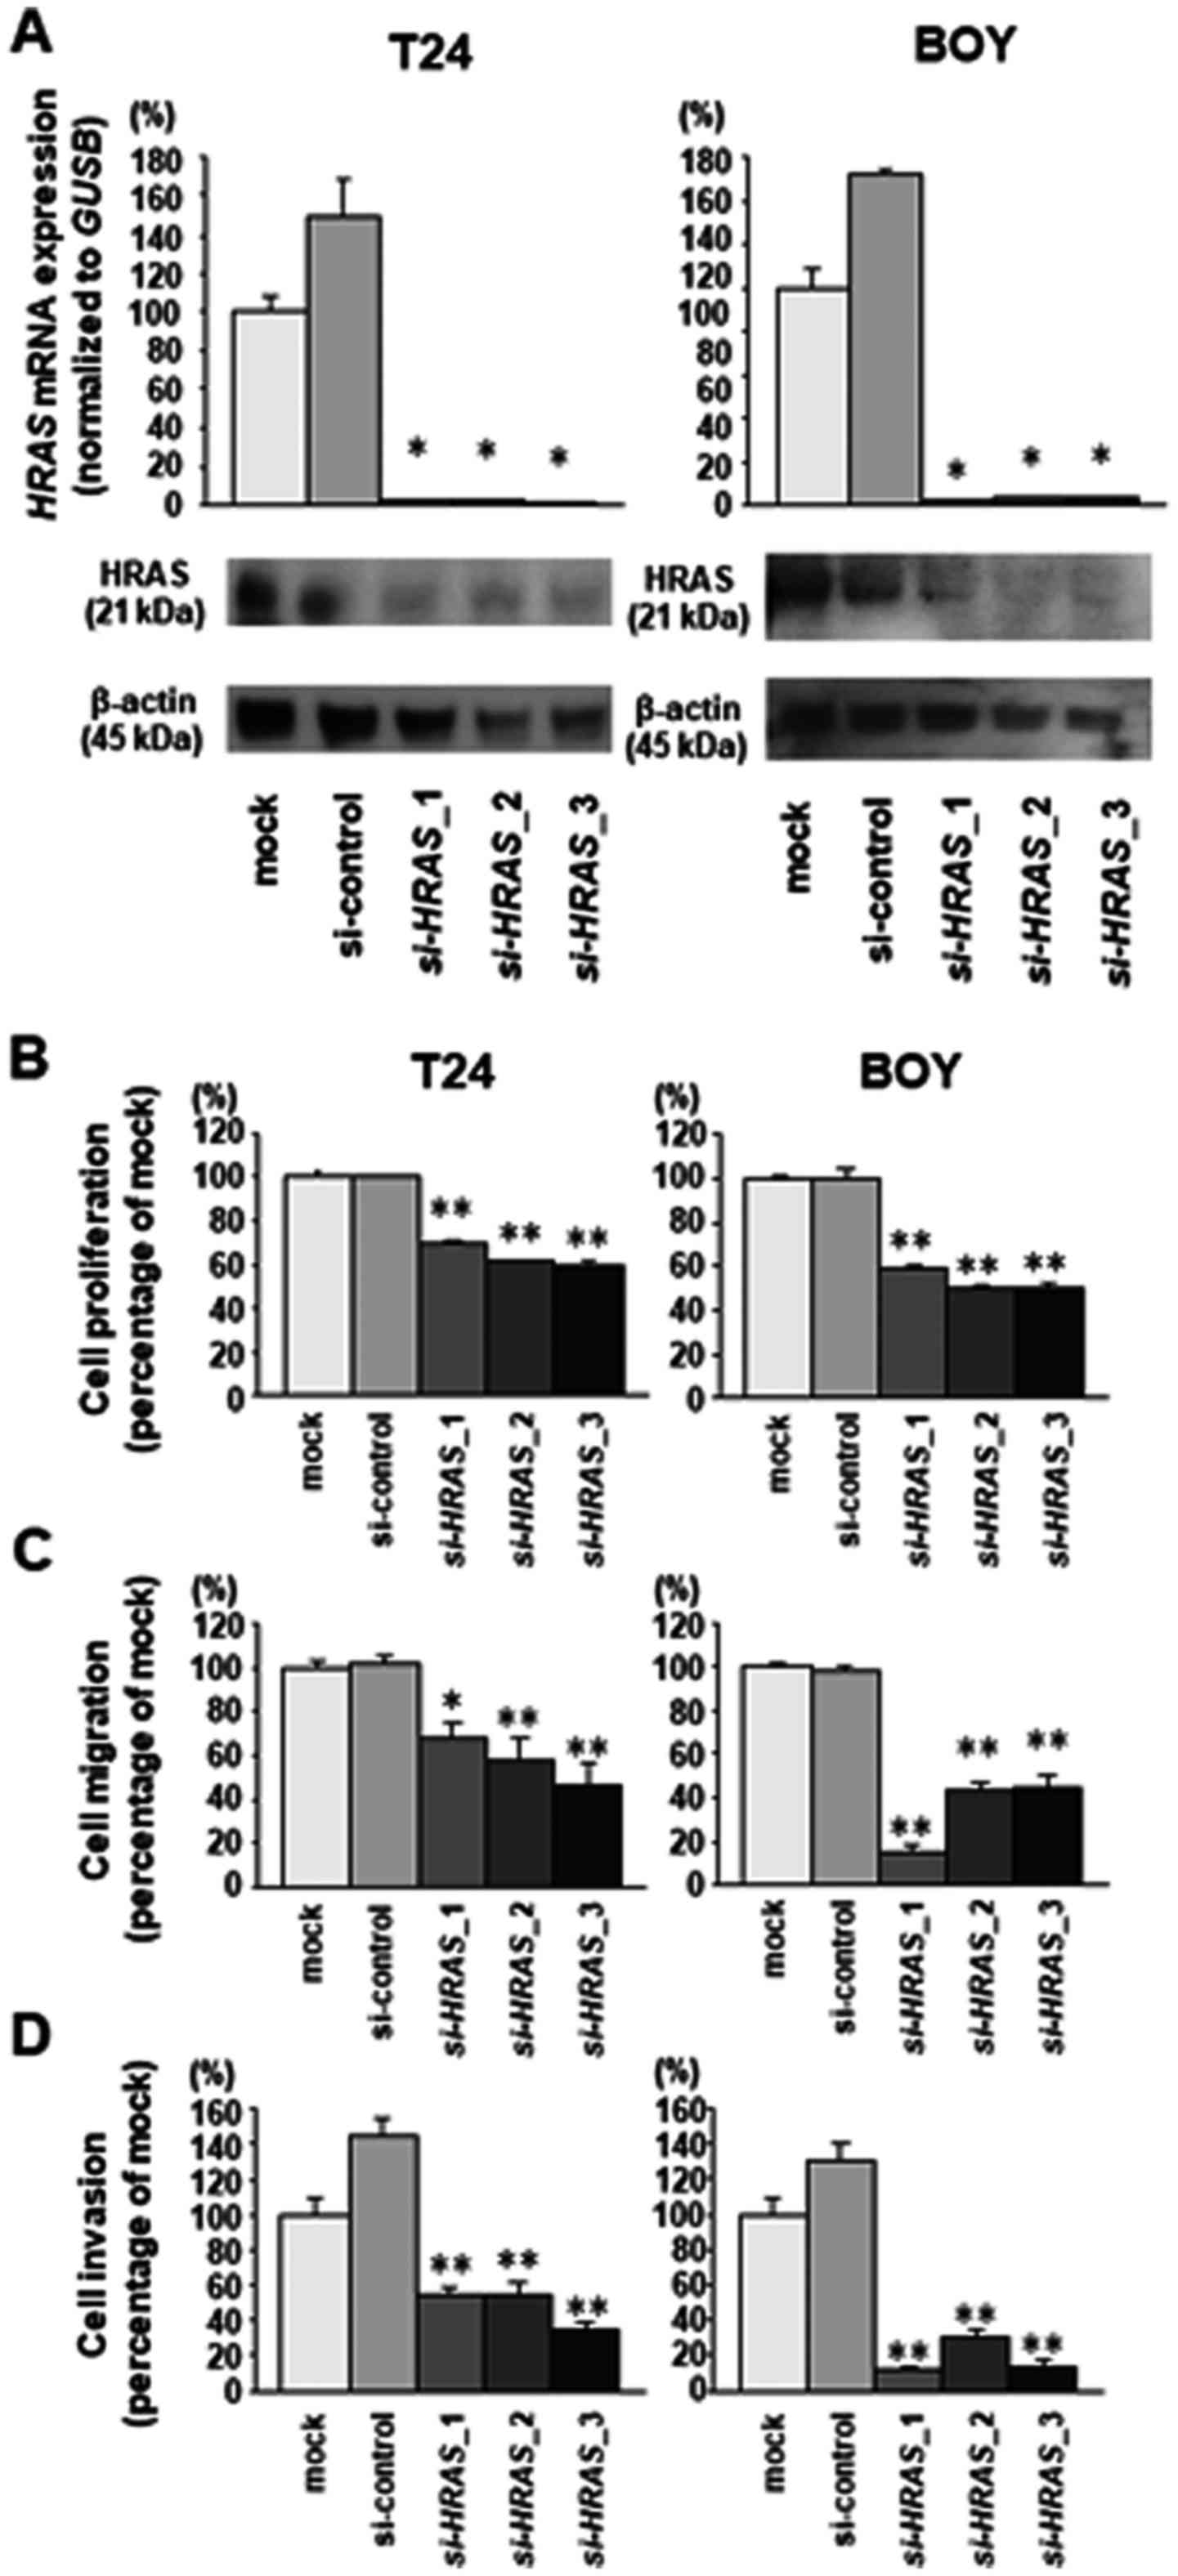
To investigate the functional role of HRAS in BC
cells, loss-of-function studies were performed using T24 and BOY BC
cells transfected with three si-HRAS constructs
(si-HRAS-1, si-HRAS-2 and si-HRAS-3). RT-qPCR
analysis and western blot analysis indicated that these siRNAs
effectively downregulated HRAS mRNA and protein expression in both
cell lines (Fig. 2A). XTT assays
demonstrated that cell proliferation was inhibited in
si-HRAS transfectants compared with mock or siRNA-control
transfectants (T24, mock 1.0±0.047, control 1.0±0.015,
si-HRAS-1 0.701±0.015, si-HRAS-2 0.615±0.011,
si-HRAS-3 0.599±0.024; BOY, mock 1.0±0.024, control
0.996±0.087, si-HRAS-1 0.585±0.030, si-HRAS-2
0.499±0.020, si-HRAS-3 0.508±0.016; each P<0.0001,
Bonferroni-adjusted Mann-Whitney test; Fig. 2B). Cell migration activity was also
significantly inhibited in si-HRAS transfectants compared
with mock or siRNA-control transfectants (T24, mock 1.0±0.111,
control 1.013±0.117, si-HRAS-1 0.684±0.198, si-HRAS-2
0.583±0.309, si-HRAS-3 0.462±0.348, P=0.0019 and P<0.0001
vs. mock; BOY, mock 1.0±0.186, control 0.978±0.080,
si-HRAS-1 0.158±0.105, si-HRAS-2 0.438±0.130,
si-HRAS-3 0.448±0.186, each P<0.0001 vs. mock,
Bonferroni-adjusted Mann-Whitney test; Fig. 2C), as was cell invasion activity in
Matrigel assays (T24, mock 1.0±0.280, control 1.443±0.289,
si-HRAS-1 0.543±0.113, si-HRAS-2 0.552±0.154,
si-HRAS-3 0.353±0.074; BOY, mock 1.0±0.288, control
1.309±0.268, si-HRAS-1 0.117±0.070, si-HRAS-2
0.296±0.121, si-HRAS-3 0.142±0.086, each P<0.0001,
Bonferroni-adjusted Mann-Whitney test; Fig. 2D).
Effects of salirasib on cell
proliferation, migration, and invasion activities in BC cell
lines
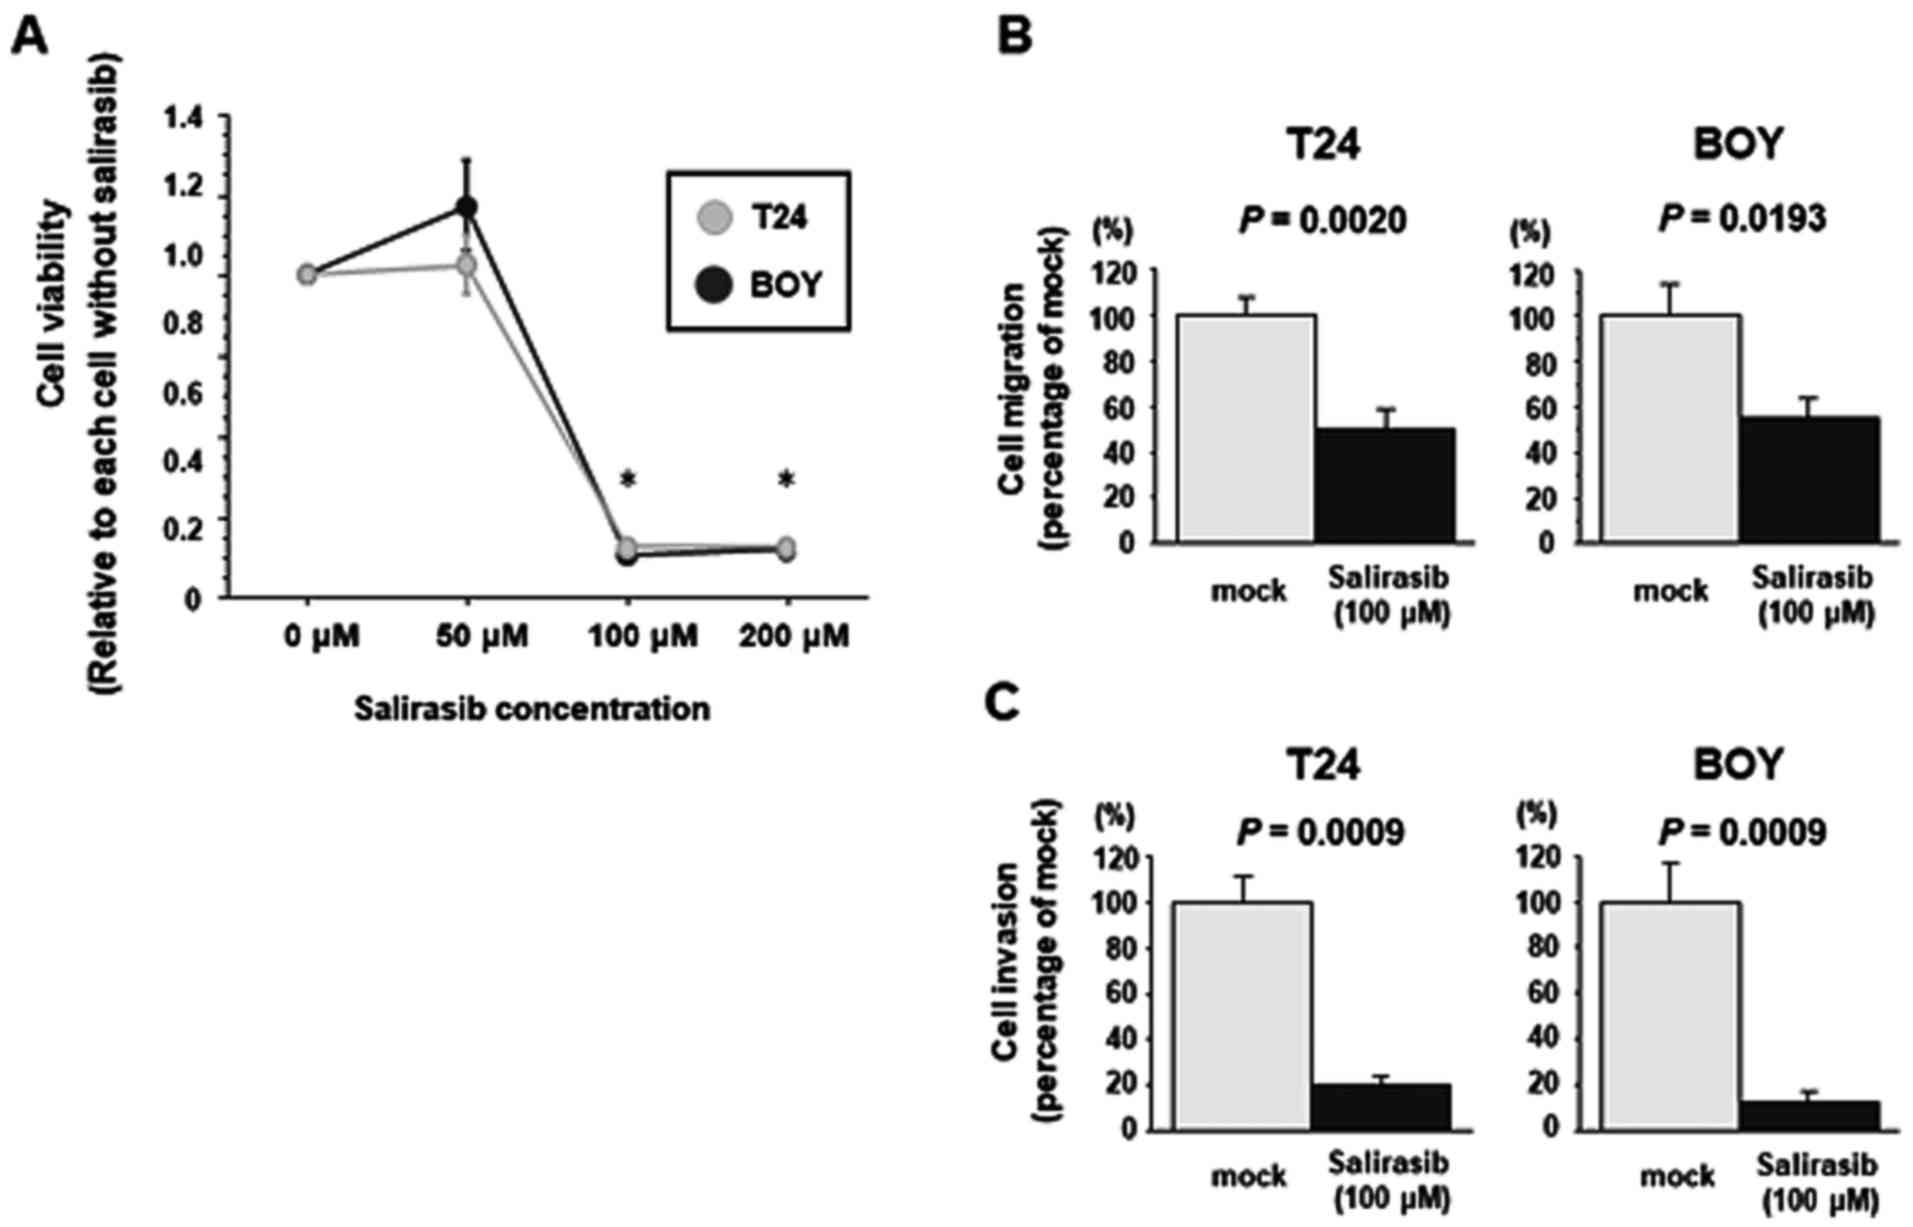
The effect of salirasib treatment was investigated
in T24 and BOY cells. XTT assays demonstrated that ≥100 µM
salirasib significantly reduced T24 and BOY viability compared with
untreated cells (each P<0.0001, Bonferroni-adjusted Mann-Whitney
test; Fig. 3A). Salirasib
treatment significantly reduced T24 and BOY cell migration compared
with the mock control (T24, mock 1.0±0.258, salirasib 0.498±0.326,
P=0.0020; BOY, mock 1.0±0.470, salirasib 0.556±0.289, P= 0.0193,
Mann-Whitney U tests; Fig. 3B) and
invasion activity (T24, mock 1.0±0.336, salirasib 0.200±0.116; BOY,
mock 1.0±0.477, salirasib 0.122±0.125, P=0.0009, Mann-Whitney U
tests; Fig. 3C) relative to
untreated cells.
Proteomic analysis in BC cells treated
with salirasib
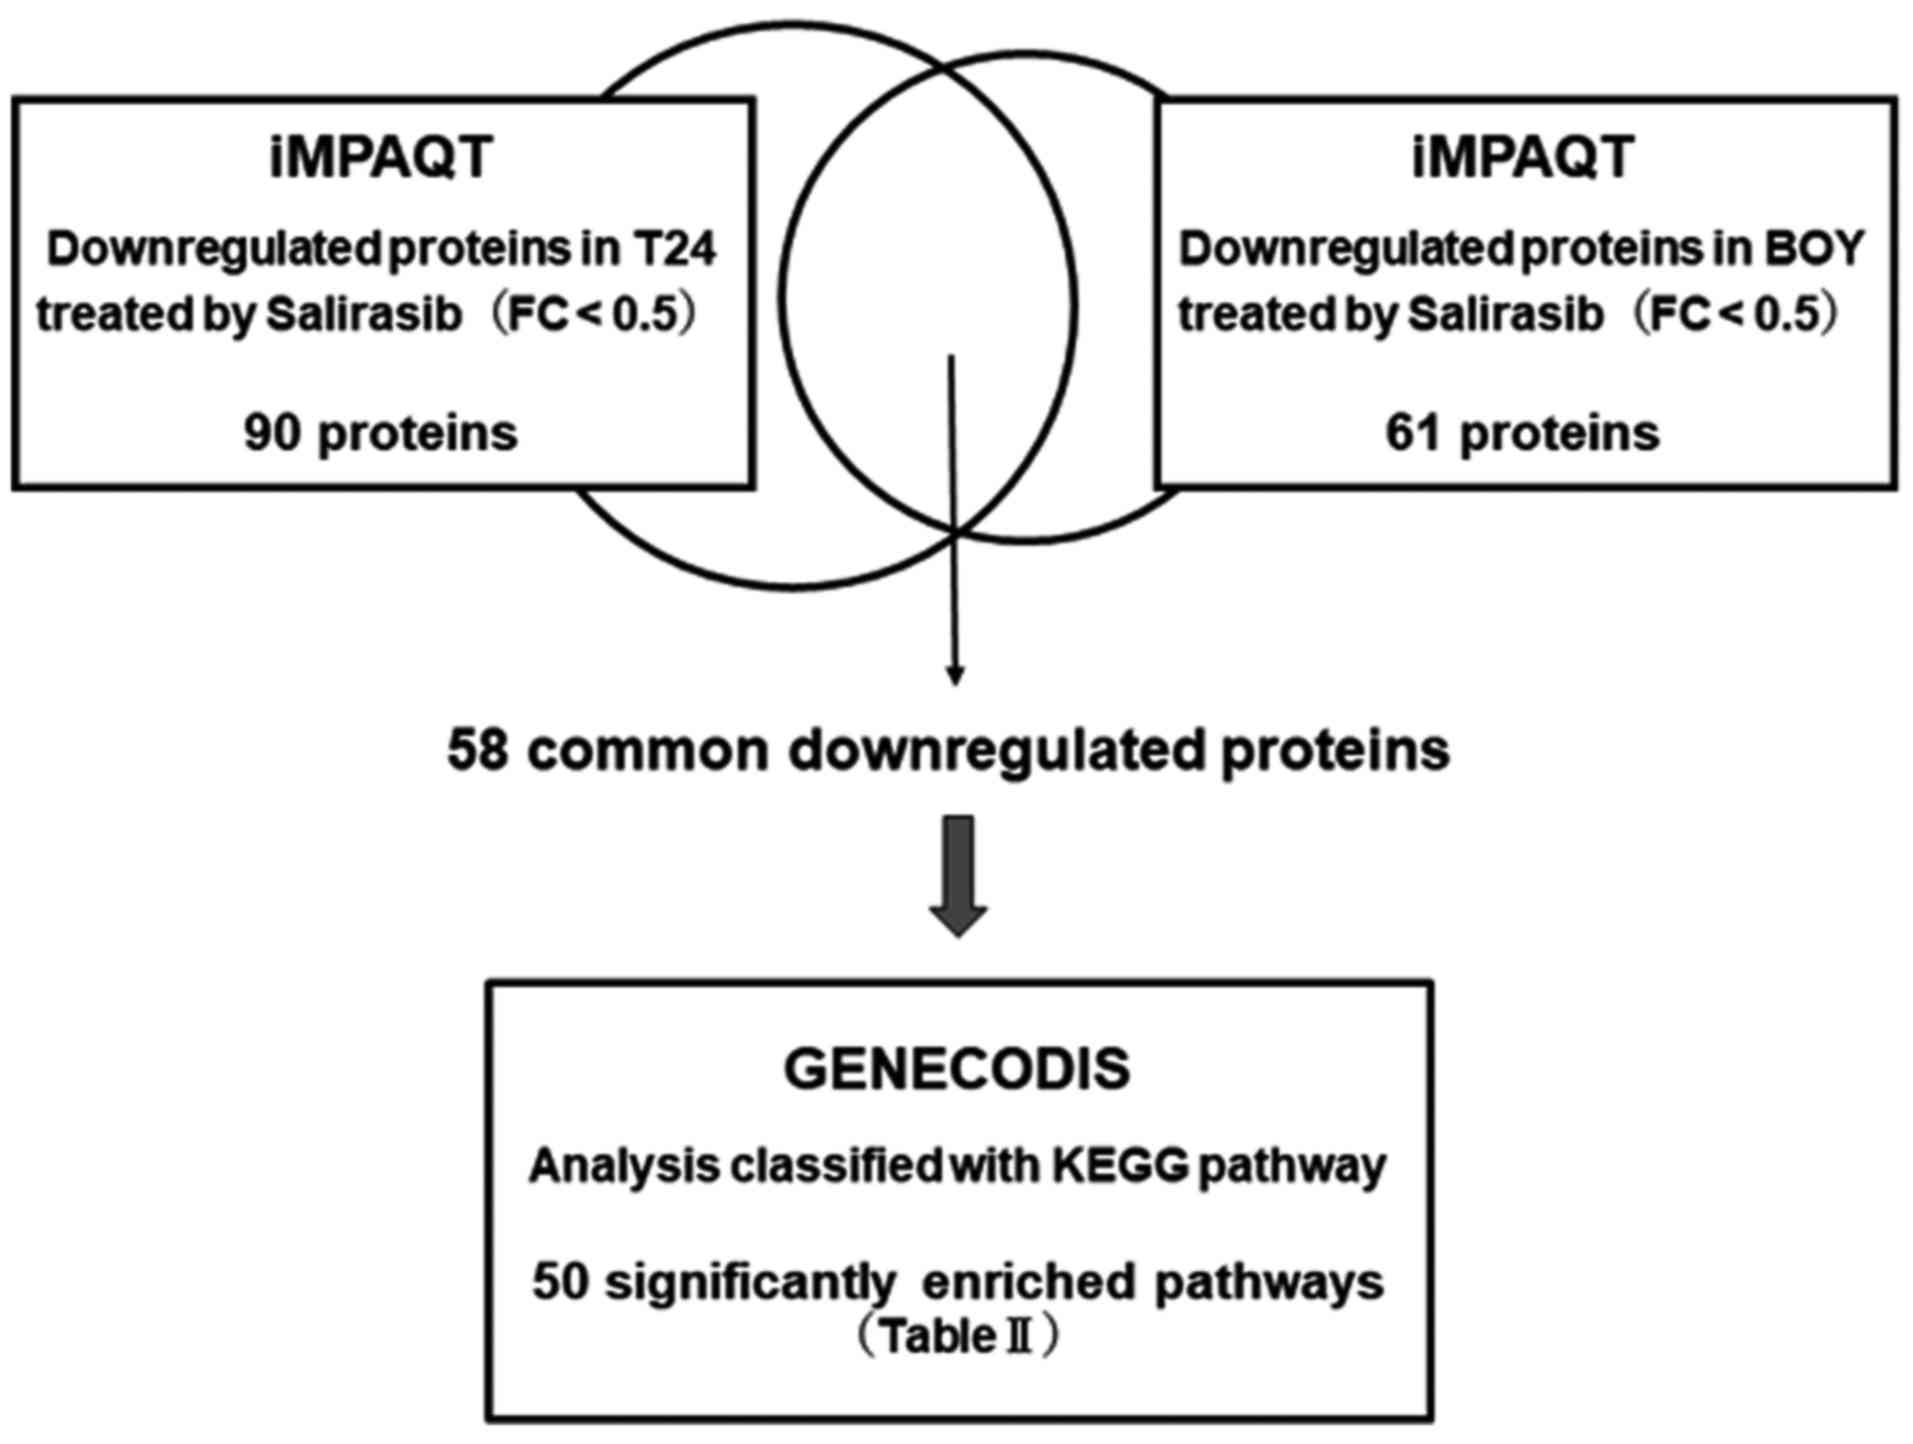
To comprehensively investigate metabolic changes in
BC cells treated with salirasib, proteomic analysis of
metabolism-associated genes was performed using iMPAQT. The results
revealed 58 proteins with downregulated expression (fold change
<0.5) in both T24 and BOY BC cells treated with salirasib
compared to untreated cells (Table
I). GeneCodis analysis to categorize the proteins into KEGG
pathways demonstrated that these proteins were included in 50
pathways that were significantly enriched following salirasib
treatment (listed in descending order of corrected P-values in
Table II; Fig. 4). 'Oxidative phosphorylation',
'pyrimidine metabolism', 'glycolysis/gluconeogenesis', 'pentose
phosphate pathway', 'cysteine and methionine metabolism',
'glutathione metabolism', and 'purine metabolism' were
significantly downregulated pathways in BC cells treated with
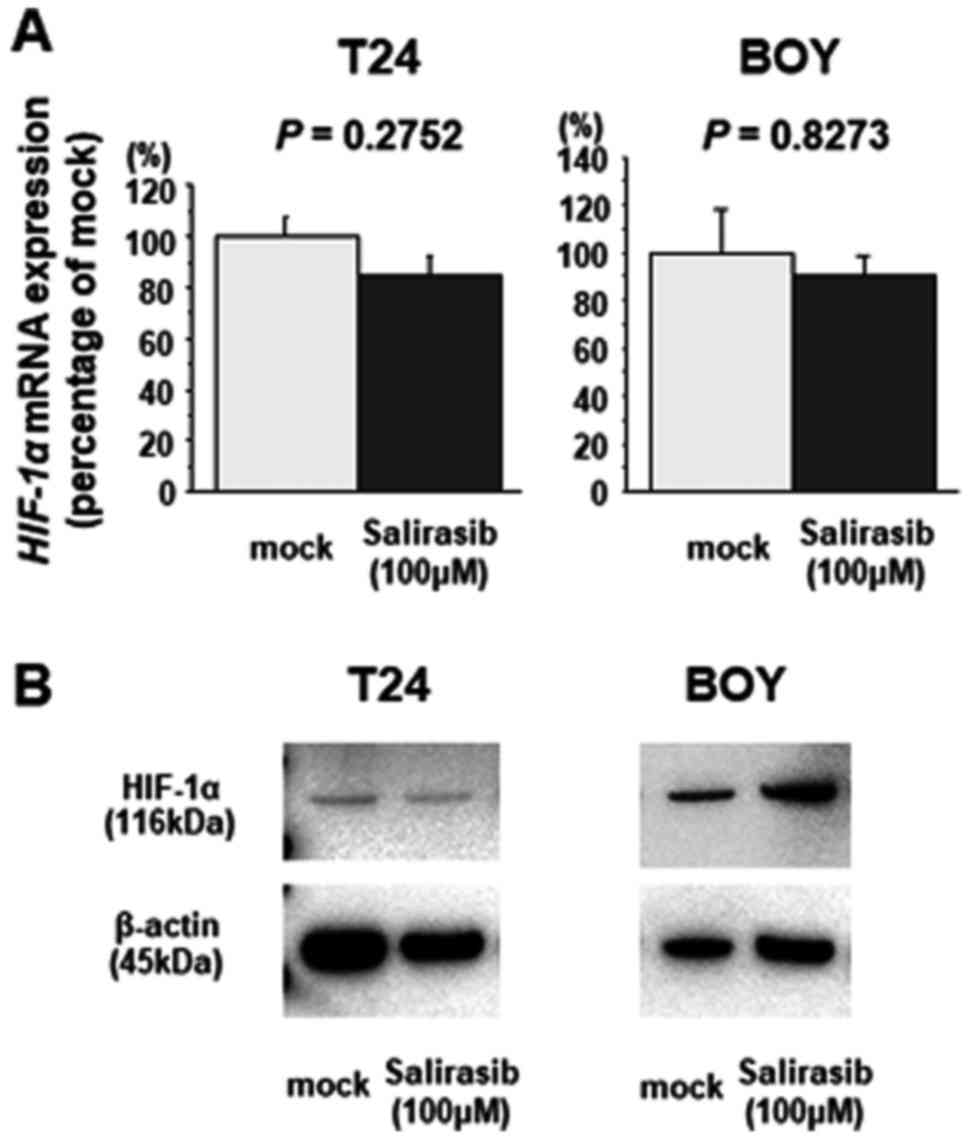
salirasib. However, target genes of the RAS effector HIF-1α,
including hexokinase 2, phosphoglycerate kinase 1, pyruvate kinase,
muscle (PKM)1, PKM2 and lactate dehydrogenase A, showed only modest
downregulation (fold change >0.5 in T24 and BOY cells) (Table III) (24–26).
Furthermore, RT-qPCR analysis and western blot analysis indicated
that expression of HIF-1α was not downregulated in
salirasib-treated BC cells (Fig.
5) (5,27).
 | Table IMetabolic changes in bladder cancer
cells treated by salirasib. |
Table I
Metabolic changes in bladder cancer
cells treated by salirasib.
| Gene symbol | Description | Expression ratio
(treated/untreated cells)
|
|---|
| T24 | BOY | Mean of T24 and
BOY |
|---|
| AHCYL1 |
Adenosylhomocysteinase-like 1 | ND | ND | ND |
| AK3 | Adenylate kinase
3 | ND | ND | ND |
| ALDH3A2 | Aldehyde
dehydrogenase 3 family, member A2 | ND | ND | ND |
| ALDH9A1 | Aldehyde
dehydrogenase 9 family, member A1 | ND | ND | ND |
| ASNS | Asparagine
synthetase (glutamine-hydrolyzing) | ND | ND | ND |
| ATP5L | ATP synthase,
H+ transporting, mitochondrial Fo complex, subunit
G | ND | ND | ND |
| ATP6V1E1 | Atpase,
H+ transporting, lysosomal, V1 subunit E1 | ND | ND | ND |
| ATP6V1G1 | Atpase,
H+ transporting, lysosomal, V1 subunit G1 | ND | ND | ND |
| DCXR |
Dicarbonyl/L-xylulose reductase | ND | ND | ND |
| DERA |
Deoxyribose-phosphate aldolase
(putative) | ND | ND | ND |
| DLD | Dihydrolipoamide
dehydrogenase | ND | ND | ND |
| G6PD | Glucose-6-phosphate
dehydrogenase | ND | ND | ND |
| GBA | Glucosidase β,
acid | ND | ND | ND |
| GMPPA | GDP-mannose
pyrophosphorylase A | ND | ND | ND |
| GMPR2 | Guanosine
monophosphate reductase 2 | ND | ND | ND |
| GNPDA1 |
Glucosamine-6-phosphate deaminase 1 | ND | ND | ND |
| HSD17B12 | Hydroxysteroid
(17-β) dehydrogenase 12 | ND | ND | ND |
| IDI1 |
Isopentenyl-diphosphate delta isomerase
1 | ND | ND | ND |
| IVD | Isovaleryl-coa
dehydrogenase | ND | ND | ND |
| MPST | Mercaptopyruvate
sulfurtransferase | ND | ND | ND |
| MTMR1 | Myotubularin
related protein 1 | ND | ND | ND |
| NDUFS8 | NADH dehydrogenase
(ubiquinone) | ND | ND | ND |
| Fe-S protein 8, 2
(NADH-coenzyme Q reductase) | | | |
| NUDT9 | Nudix (nucleoside
diphosphate linked moiety X)-type motif 9 | ND | ND | ND |
| PAFAH1B3 | Platelet-activating
factor acetylhydrolase 1b, catalytic subunit 3 | ND | ND | ND |
| PANK4 | Pantothenate kinase
4 | ND | ND | ND |
| PFKM |
Phosphofructokinase, muscle | ND | ND | ND |
| PGD | Phosphogluconate
dehydrogenase | ND | ND | ND |
| PGM2 | Phosphoglucomutase
2 | ND | ND | ND |
| PLOD3 | Procollagen-lysine,
2-oxoglutarate 5-dioxygenase 3 | ND | ND | ND |
| PMVK | Phosphomevalonate
kinase | ND | ND | ND |
| PRIM1 | Primase, DNA,
polypeptide 1 | ND | ND | ND |
| SCP2 | Sterol carrier
protein 2 | ND | ND | ND |
| UQCRB |
Ubiquinol-cytochrome c reductase binding
protein | ND | ND | ND |
| GAPDH |
Glyceraldehyde-3-phosphate
dehydrogenase | 0.068 | 0.113 | 0.091 |
| GOT1 |
Glutamic-oxaloacetic transaminase 1,
soluble (aspartate aminotransferase 1) | ND | 0.242 | 0.121 |
| BCAT1 | Branched chain
amino-acid transaminase 1, cytosolic | 0.247 | ND | 0.123 |
| AASDHPPT |
Aminoadipate-semialdehyde
dehydrogenase-phosphopantetheinyl transferase | ND | 0.256 | 0.128 |
| UAP1 |
UDP-N-acteylglucosamine pyrophosphorylase
1 | 0.107 | 0.212 | 0.16 |
| PGM3 | Phosphoglucomutase
3 | ND | 0.393 | 0.197 |
| PAFAH1B2 | Platelet-activating
factor acetylhydrolase 1b, catalytic subunit 2 | ND | 0.405 | 0.203 |
| BLVRB | Biliverdin
reductase B (flavin reductase (NADPH)) | ND | 0.407 | 0.204 |
| NDUFS1 | NADH dehydrogenase
(ubiquinone) Fe-S protein 1, 7 (NADH-coenzyme Q reductase) | ND | 0.492 | 0.246 |
| DLST | Dihydrolipoamide
S-succinyltransferase (E2 component of 2-oxo-glutarate
complex) | 0.293 | 0.201 | 0.247 |
| PHGDH | Phosphoglycerate
dehydrogenase | 0.224 | 0.284 | 0.254 |
| HMOX1 | Heme oxygenase
(decycling) 1 | 0.165 | 0.378 | 0.271 |
| DUT | Deoxyuridine
triphosphatase | 0.223 | 0.369 | 0.296 |
| AHCY |
Adenosylhomocysteinase | 0.297 | 0.315 | 0.306 |
| ATP5A1 | ATP synthase,
H+ transporting, mitochondrial F1 complex, α subunit 1,
cardiac muscle | 0.252 | 0.363 | 0.308 |
| SRM | Spermidine
synthase | 0.297 | 0.401 | 0.349 |
| RRM1 | Ribonucleotide
reductase M1 | 0.347 | 0.36 | 0.353 |
| ACAT1 | Acetyl-coa
acetyltransferase 1 | 0.271 | 0.439 | 0.355 |
| ISYNA1 |
Inositol-3-phosphate synthase 1 | 0.234 | 0.48 | 0.357 |
| NDUFA4 | NADH dehydrogenase
(ubiquinone) 1α subcomplex, 4 | 0.286 | 0.45 | 0.368 |
| RRM2B | Ribonucleotide
reductase M2 B (TP53 inducible) | 0.373 | 0.435 | 0.404 |
| NUDT2 | Nudix (nucleoside
diphosphate linked moiety X)-type motif 2 | 0.443 | 0.383 | 0.413 |
| UQCRQ |
Ubiquinol-cytochrome c reductase, complex
III subunit VII | 0.414 | 0.451 | 0.432 |
| CMPK1 | Cytidine
monophosphate (UMP-CMP) kinase 1, cytosolic | 0.462 | 0.443 | 0.452 |
| ATP6V1B2 | Atpase,
H+ transporting, lysosomal, V1 subunit B2 | 0.498 | 0.479 | 0.489 |
| Table IIDownregulated KEGG pathways in
bladder cancer cells treated by salirasib. |
Table II
Downregulated KEGG pathways in
bladder cancer cells treated by salirasib.
| KEGGID | Annotations | Number of
genes | Corrected
P-value | Genes |
|---|
| 00190 | Oxidative
phosphorylation | 10 |
1.22×10⁻¹² | ATP5A1, ATP6V1G1,
NDUFS8, ATP5L, ATP6V1E1, NDUFA4, NDUFS1, UQCRB, ATP6V1B2,
UQCRQ |
| 00280 | Valine, leucine and
isoleucine degradation | 6 |
3.79×10⁻⁹ | ALDH3A2, DLD,
BCAT1, IVD, ALDH9A1, ACAT1 |
| 00240 | Pyrimidine
metabolism | 7 |
4.84×10⁻⁹ | CMPK1, NUDT2,
RRM2B, AK3, RRM1, PRIM1, DUT |
| 00010 |
Glycolysis/gluconeogenesis | 6 |
1.29×10⁻⁸ | ALDH3A2, PGM2, DLD,
ALDH9A1, GAPDH, PFKM |
| 00030 | Pentose phosphate
pathway | 5 |
1.43×10⁻⁸ | PGM2, DERA, G6PD,
PGD, PFKM |
| 00270 | Cysteine and
methionine metabolism | 5 |
4.39×10⁻⁸ | MPST, AHCY, AHCYL1,
SRM, GOT1 |
| 00480 | Glutathione
metabolism | 5 |
8.35×10⁻⁸ | RRM2B, G6PD, RRM1,
SRM, PGD |
| 00230 | Purine
metabolism | 7 |
8.57×10⁻⁸ | NUDT2, PGM2, GMPR2,
RRM2B, RRM1, NUDT9, PRIM1 |
| 05010 | Alzheimer's
disease | 7 |
9.31×10⁻⁸ | ATP5A1, NDUFS8,
NDUFA4, NDUFS1, UQCRB, GAPDH, UQCRQ |
| 00520 | Amino sugar and
nucleotide sugar metabolism | 5 |
1.18×10⁻⁷ | PGM2, UAP1, GMPPA,
PGM3, GNPDA1 |
| 00310 | Lysine
degradation | 5 |
1.19×10⁻⁷ | ALDH3A2, ALDH9A1,
PLOD3, DLST, ACAT1 |
| 05012 | Parkinson's
disease | 6 |
4.55×10⁻⁷ | ATP5A1, NDUFS8,
NDUFA4, NDUFS1, UQCRB, UQCRQ |
| 05016 | Huntington's
disease | 6 |
2.79×10⁻⁶ | ATP5A1, NDUFS8,
NDUFA4, NDUFS1, UQCRB, UQCRQ |
| 00620 | Pyruvate
metabolism | 4 |
2.79×10⁻⁶ | ALDH3A2, DLD,
ALDH9A1, ACAT1 |
| 00330 | Arginine and
proline metabolism | 4 |
8.56×10⁻⁶ | ALDH3A2, ALDH9A1,
SRM, GOT1 |
| 00900 | Terpenoid backbone
biosynthesis | 3 |
8.57×10⁻⁶ | PMVK, IDI1,
ACAT1 |
| 00770 | Pantothenate and
CoA biosynthesis | 3 |
1.13×10⁻⁵ | BCAT1, AASDHPPT,
PANK4 |
| 00410 | β-alanine
metabolism | 3 |
3.82×10⁻⁵ | ALDH3A2, ALDH9A1,
SRM |
| 04966 | Collecting duct
acid secretion | 3 |
3.82×10⁻⁵ | ATP6V1G1, ATP6V1E1,
ATP6V1B2 |
| 00640 | Propanoate
metabolism | 3 |
6.87×10⁻⁵ | ALDH3A2, ALDH9A1,
ACAT1 |
| 00051 | Fructose and
mannose metabolism | 3 |
9.37×10⁻⁵ | GMPPA, MTMR1,
PFKM |
| 00071 | Fatty acid
metabolism | 3 | 0.000127 | ALDH3A2, ALDH9A1,
ACAT1 |
| 00380 | Tryptophan
metabolism | 3 | 0.000127 | ALDH3A2, ALDH9A1,
ACAT1 |
| 05110 | Vibrio cholerae
infection | 3 | 0.000264 | ATP6V1G1, ATP6V1E1,
ATP6V1B2 |
| 05120 | Epithelial cell
signaling in Helicobacter pylori infection | 3 | 0.000509 | ATP6V1G1, ATP6V1E1,
ATP6V1B2 |
| 05323 | Rheumatoid
arthritis | 3 | 0.000953 | ATP6V1G1, ATP6V1E1,
ATP6V1B2 |
| 00053 | Ascorbate and
aldarate metabolism | 2 | 0.002054 | ALDH3A2,
ALDH9A1 |
| 00052 | Galactose
metabolism | 2 | 0.002137 | PGM2, PFKM |
| 00340 | Histidine
metabolism | 2 | 0.002381 | ALDH3A2,
ALDH9A1 |
| 00020 | Citrate cycle (TCA
cycle) | 2 | 0.002464 | DLD, DLST |
| 00040 | Pentose and
glucuronate interconversions | 2 | 0.002546 | ALDH3A2, DCXR |
| 00250 | Alanine, aspartate
and glutamate metabolism | 2 | 0.002548 | ASNS, GOT1 |
| 00260 | Glycine, serine and
threonine metabolism | 2 | 0.002548 | DLD, PHGDH |
| 00565 | Ether lipid
metabolism | 2 | 0.002791 | PAFAH1B3,
PAFAH1B2 |
| 04145 | Phagosome | 3 | 0.002924 | ATP6V1G1, ATP6V1E1,
ATP6V1B2 |
| 00860 | Porphyrin and
chlorophyll metabolism | 2 | 0.004011 | HMOX1, BLVRB |
| 00561 | Glycerolipid
metabolism | 2 | 0.004873 | ALDH3A2,
ALDH9A1 |
| 04260 | Cardiac muscle
contraction | 2 | 0.011811 | UQCRB, UQCRQ |
| 04146 | Peroxisome | 2 | 0.011811 | PMVK, SCP2 |
| 00400 | Phenylalanine,
tyrosine and tryptophan biosynthesis | 1 | 0.013097 | GOT1 |
| 00072 | Synthesis and
degradation of ketone bodies | 1 | 0.022922 | ACAT1 |
| 00290 | Valine, leucine and
isoleucine biosynthesis | 1 | 0.024264 | BCAT1 |
| 04122 | Sulfur relay
system | 1 | 0.024264 | MPST |
| 00740 | Riboflavin
metabolism | 1 | 0.026063 | BLVRB |
| 00360 | Phenylalanine
metabolism | 1 | 0.036111 | GOT1 |
| 00120 | Primary bile acid
biosynthesis | 1 | 0.036111 | SCP2 |
| 00511 | Other glycan
degradation | 1 | 0.03752 | GBA |
| 00630 | Glyoxylate and
dicarboxylate metabolism | 1 | 0.038867 | ACAT1 |
| 01040 | Biosynthesis of
unsaturated fatty acids | 1 | 0.044309 | HSD17B12 |
| 00910 | Nitrogen
metabolism | 1 | 0.04748 | ASNS |
| Table IIIEffects of salirasib downstream of
hypoxia inducible factor-1α. |
Table III
Effects of salirasib downstream of
hypoxia inducible factor-1α.
| Name | Description | T24 fold
change | BOY fold
change | Mean of T24 and
BOY |
|---|
| PKM2 | Pyruvate kinase,
muscle 2 | 1.369 | 1.194 | 1.281 |
| LDHA | Lactate
dehydrogenase A | 0.918 | 1.005 | 0.961 |
| PKM1 | Pyruvate kinase,
muscle 1 | 0.900 | 1.044 | 0.972 |
| PGK1 | Phosphoglycerate
kinase 1 | 0.857 | 1.192 | 1.025 |
| HK2 | Hexokinase 2 | 0.735 | 0.697 | 0.716 |
| ENO1 | Enolase 1, (α) | 0.453 | 0.587 | 0.520 |
| GAPDH |
Glyceraldehyde-3-phosphate
dehydrogenase | 0.068 | 0.113 | 0.091 |
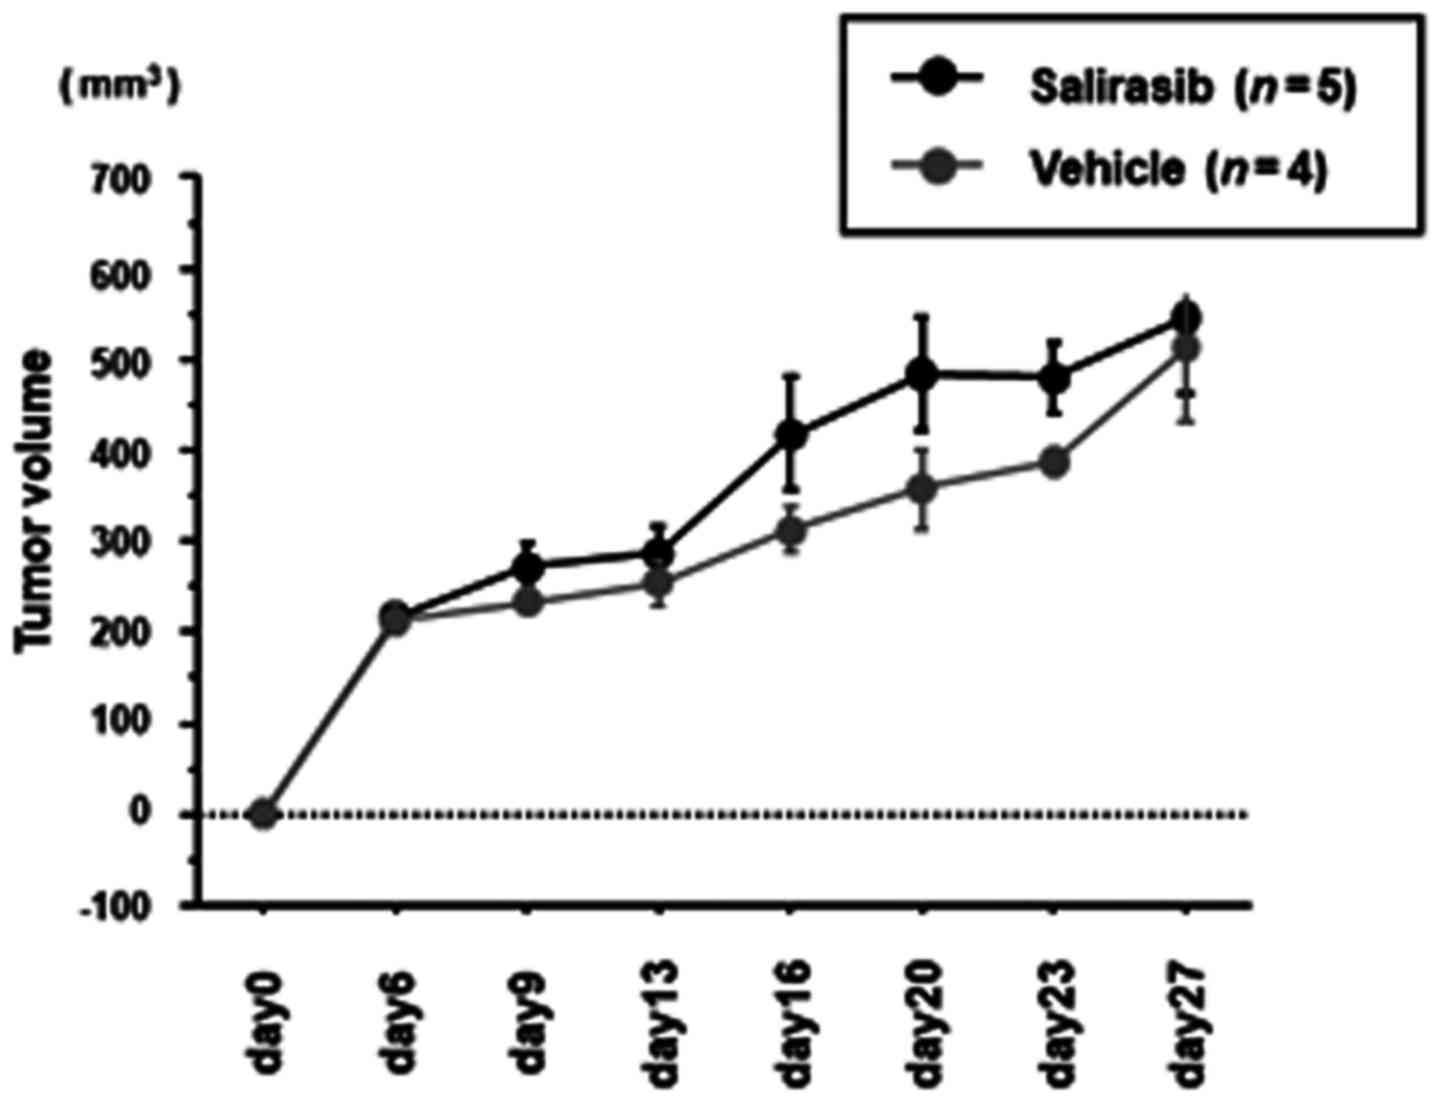
Xenograft model study to investigate the
in vivo effects of salirasib
To investigate the in vivo effects of
salirasib, either salirasib or control vehicle was i.p. injected
daily into BC xenograft mice from one day after tumor implantation.
There was no difference in tumor growth between the
salirasib-treated group (n=5, 545.9±187.4 mm3) and
control group (n=4, 511.2±165.6 mm3) (Fig. 6) on day 27 after tumor
implantation.
Discussion
HRAS was the first human oncogene reported in
the T24 BC cell line in 1982 (28). Several reports have indicated that
HRAS mutations critically influence tumorigenesis and
development of BC (8,29–33).
Haliassos et al (29)
detected HRAS codon 12 point mutations in 66% of BC specimens and
the mutant HRAS allele in the urine of 47% of patients with BC,
Pandith et al (33)
reported that HRAS single nucleotide polymorphism increases BC
risk, and rare allele is a predictive marker of advanced bladder
tumors. However, RAS had been considered to be 'undruggable'
because the RAS protein lacked a druggable binding pocket until
salirasib was produced. Salirasib inhibits RAS-dependent cell
growth by dislodging all isoforms of RAS from the plasma membrane
(11,12). The anti-tumor efficacy of salirasib
has been demonstrated in several cell lines and xenograft models
(17,34–36).
Goldberg et al (34)
demonstrated that salirasib induces pancreatic cancer cell death
and tumor shrinkage in mice, and that salirasib was efficient and
nontoxic for treatment of glioblastoma in a rat model (35). Charette et al (36) reported that salirasib inhibits the
growth of hepatocarcinoma cell lines in vitro and in
vivo through RAS and mTOR inhibition. Salirasib was evaluated
as a single agent in two clinical trials; however, neither produced
promising results in patients with KRAS mutation positive lung
adenocarcinoma (13) or refractory
hematologic malignancies (14).
Even though these clinical trials demonstrated the relative safety
of salirasib, diarrhea, nausea and fatigue were the most common
toxicities, and there were no grade 4 or 5 drug-associated adverse
events or dose-limiting toxicity. On the other hand, results of a
combination study of salirasib with gemcitabine to treat pancreatic
adenocarcinoma were sufficiently encouraging to warrant further
investigation (15,16).
Although the efficacy of salirasib has been reported
for several types of cancers, to the best of our knowledge, this is
the first report concerning the effect of salirasib in BC. Two BC
cell lines were used to evaluate the ability of salirasib to target
HRAS. T24 carries the HRASG12V mutation (substitution of
glycine by valine at codon 12 of HRAS) and sequencing data
demonstrated that BOY cells have wild-type HRAS. siRNA-induced
HRAS knockdown and salirasib inhibition of HRAS exerted
tumor suppressive effects regardless of HRAS mutational status
in vitro, which was consistent with several previously
published results demonstrating a lack of correlation between RAS
mutational status and response to RAS-targeting therapy (37,38).
However, salirasib still required relatively high concentrations to
achieve a tumor-suppressive effect in vitro, and exhibited
no tumor-suppressive effects in vivo.
It had been reported that oncogenic RAS
predominantly affects the metabolic reprogramming of cancer cells
through the upregulation of HIF-1α, one of target genes of RAS
(5). Although salirasib is known
to competitively block intracellular signaling via the RAS cascade,
there are no reports concerning comprehensive metabolomic analysis
of salirasib mechanisms. In the current study, proteomic analysis
was performed using iMPAQT to investigate metabolic changes in
salirasib-treated BC cells. Pathway analysis using the proteomic
data indicated that 50 pathways were significantly downregulated
following salirasib treatment of BC cells, including 'Oxidative
phosphorylation', 'Glycolysis/gluconeogenesis', and 'Pentose
phosphate pathway'. However, proteomic analysis showed that the
expression of proteins downstream of HIF-1α were not significantly
downregulated. Furthermore, HIF-1α expression was not efficiently
suppressed in salirasib-treated BC cells, although it was
previously reported that salirasib suppressed HIF-1α expression in
other type of cancer cells (27).
Therefore, downregulation of RAS target genes in in vitro
assays involving BC cell lines may require a high concentration of
salirasib, and this need for high concentrations was responsible
for the lack of tumor suppressive effects observed in the BC
xenograft mouse model. In this study, whether factors downstream of
HIF-1α were insufficiently downregulated in the tumors from animal
experiments was not analyzed by iMPAQT, because iMPAQT is so
sensitive that contamination of surrounding tissues adjacent to
tumor tissue may make the interpretation of the results difficult.
However, these analyses of micro-dissected in vivo samples
will be performed in the future. Recently, a novel RAS inhibitor
developed using an innovative approach was reported to inhibit
tumor growth in animal models of RAS-dependent cancers at low
concentrations (39). This novel
RAS inhibitor was computationally designed to target multiple sites
on RAS proteins, thus enabling sufficient affinity and selectivity
for pharmacological RAS inhibition. This new inhibitor may provide
successful targeting of RAS in the near future. Therefore, clinical
trials with these inhibitors or next-generation RAS inhibitors are
required to improve cancer treatment options in the near
future.
In conclusion, the current study demonstrated that
salirasib and siRNA-induced HRAS knockdown produced tumor
suppressive effects regardless of HRAS mutational status in BC cell
lines. However, high concentrations of salirasib were required to
inhibit cell proliferation, migration and invasion activity in
vitro, and the same high concentrations exhibited no tumor
suppressive effects in vivo. Proteomic analysis revealed
that several metabolic pathways were significantly downregulated in
BC cells treated with salirasib. However, salirasib treatment of BC
cells did not significantly affect expression of genes targeted by
HIF-1α in BC cells. These findings provide novel information
concerning the mechanism of salirasib effects, and suggest that
novel therapeutics involving combination therapies of salirasib
with other inhibitors, or the newly-identified novel RAS inhibitor,
may be effective for treating BC and other types of cancer.
Acknowledgments
The authors wish to thank Ms. Mutsumi Miyazaki,
(Department of Urology, Graduate School of Medical and Dental
Sciences, Kagoshima University, Kagoshima, Japan) for laboratory
assistance.
Funding
This study was supported by JSPS Grants-in-Aid for
Scientific Research (grant nos. 16H05464, 17H04332 and
16K11015).
Availability of data and materials
The analyzed datasets generated during the study are
available from the corresponding author on reasonable request.
Authors' contributions
HY conceived and designed the experiments. SS, HY,
KM, MY, TS and YO performed the experiments. SS, HE, HY and KM
performed the validation and formal analysis. SS and KM wrote the
manuscript. HE, HY and MN interpreted experimental data for the
work, and reviewed and revised the manuscript. HE, HY and MN
acquired funding. All authors have read and approved the final
manuscript.
Ethics approval and consent to
participate
Not applicable.
Patient consent for publication
Not applicable.
Competing interests
The authors declare that they have no competing
interests.
References
|
1
|
Ferlay J, Steliarova-Foucher E,
Lortet-Tieulent J, Rosso S, Coebergh JW, Comber H, Forman D and
Bray F: Cancer incidence and mortality patterns in Europe:
Estimates for 40 countries in 2012. Eur J Cancer. 49:1374–1403.
2013. View Article : Google Scholar : PubMed/NCBI
|
|
2
|
Torre LA, Bray F, Siegel RL, Ferlay J,
Lortet-Tieulent J and Jemal A: Global cancer statistics, 2012. CA
Cancer J Clin. 65:87–108. 2015. View Article : Google Scholar : PubMed/NCBI
|
|
3
|
Abdollah F, Gandaglia G, Thuret R,
Schmitges J, Tian Z, Jeldres C, Passoni NM, Briganti A, Shariat SF,
Perrotte P, et al: Incidence, survival and mortality rates of
stage-specific bladder cancer in United States: A trend analysis.
Cancer Epidemiol. 37:219–225. 2013. View Article : Google Scholar : PubMed/NCBI
|
|
4
|
Advanced Bladder Cancer Meta-analysis
Collaboration: Neoadjuvant chemotherapy in invasive bladder cancer:
A systematic review and meta-analysis. Lancet. 361:1927–1934. 2003.
View Article : Google Scholar : PubMed/NCBI
|
|
5
|
Pylayeva-Gupta Y, Grabocka E and Bar-Sagi
D: RAS oncogenes: Weaving a tumorigenic web. Nat Rev Cancer.
11:761–774. 2011. View
Article : Google Scholar : PubMed/NCBI
|
|
6
|
Karnoub AE and Weinberg RA: Ras oncogenes:
Split personalities. Nat Rev Mol Cell Biol. 9:517–531. 2008.
View Article : Google Scholar : PubMed/NCBI
|
|
7
|
Ding L, Getz G, Wheeler DA, Mardis ER,
McLellan MD, Cibulskis K, Sougnez C, Greulich H, Muzny DM, Morgan
MB, et al: Somatic mutations affect key pathways in lung
adenocarcinoma. Nature. 455:1069–1075. 2008. View Article : Google Scholar : PubMed/NCBI
|
|
8
|
Kiaris H and Spandidos D: Mutations of ras
genes in human tumors (Review). Int J Oncol. 7:413–421.
1995.PubMed/NCBI
|
|
9
|
Baines AT, Xu D and Der CJ: Inhibition of
Ras for cancer treatment: The search continues. Future Med Chem.
3:1787–1808. 2011. View Article : Google Scholar : PubMed/NCBI
|
|
10
|
Cox AD, Fesik SW, Kimmelman AC, Luo J and
Der CJ: Drugging the undruggable RAS: Mission possible? Nat Rev
Drug Discov. 13:828–851. 2014. View
Article : Google Scholar : PubMed/NCBI
|
|
11
|
Elad G, Paz A, Haklai R, Marciano D, Cox A
and Kloog Y: Targeting of K-Ras 4B by S-trans, transfarnesyl
thiosalicylic acid. Biochim Biophys Acta. 1452:228–242. 1999.
View Article : Google Scholar : PubMed/NCBI
|
|
12
|
Weisz B, Giehl K, Gana-Weisz M, Egozi Y,
Ben-Baruch G, Marciano D, Gierschik P and Kloog Y: A new functional
Ras antagonist inhibits human pancreatic tumor growth in nude mice.
Oncogene. 18:2579–2588. 1999. View Article : Google Scholar : PubMed/NCBI
|
|
13
|
Riely GJ, Johnson ML, Medina C, Rizvi NA,
Miller VA, Kris MG, Pietanza MC, Azzoli CG, Krug LM, Pao W, et al:
A phase II trial of Salirasib in patients with lung adenocarcinomas
with KRAS mutations. J Thorac Oncol. 6:1435–1437. 2011. View Article : Google Scholar : PubMed/NCBI
|
|
14
|
Badar T, Cortes JE, Ravandi F, O'Brien S,
Verstovsek S, Garcia-Manero G, Kantarjian H and Borthakur G: Phase
I study of S-trans, trans-farnesylthiosalicylic acid (salirasib), a
novel oral RAS inhibitor in patients with refractory hematologic
malignancies. Clin Lymphoma Myeloma Leuk. 15:433–438.e2. 2015.
View Article : Google Scholar : PubMed/NCBI
|
|
15
|
Bustinza-Linares E, Kurzrock R and
Tsimberidou AM: Salirasib in the treatment of pancreatic cancer.
Future Oncol. 6:885–891. 2010. View Article : Google Scholar : PubMed/NCBI
|
|
16
|
Laheru D, Shah P, Rajeshkumar NV,
McAllister F, Taylor G, Goldsweig H, Le DT, Donehower R, Jimeno A,
Linden S, et al: Integrated preclinical and clinical development of
S-trans, trans-Farnesylthiosalicylic Acid (FTS, Salirasib) in
pancreatic cancer. Invest New Drugs. 30:2391–2399. 2012. View Article : Google Scholar : PubMed/NCBI
|
|
17
|
Makovski V, Haklai R and Kloog Y:
Farnesylthiosalicylic acid (salirasib) inhibits Rheb in TSC2-null
ELT3 cells: A potential treatment for lymphangioleiomyomatosis. Int
J Cancer. 130:1420–1429. 2012. View Article : Google Scholar
|
|
18
|
Zundelevich A, Elad-Sfadia G, Haklai R and
Kloog Y: Suppression of lung cancer tumor growth in a nude mouse
model by the Ras inhibitor salirasib (farnesylthiosalicylic acid).
Mol Cancer Ther. 6:1765–1773. 2007. View Article : Google Scholar : PubMed/NCBI
|
|
19
|
Matsumoto M, Matsuzaki F, Oshikawa K,
Goshima N, Mori M, Kawamura Y, Ogawa K, Fukuda E, Nakatsumi H,
Natsume T, et al: A large-scale targeted proteomics assay resource
based on an in vitro human proteome. Nat Methods. 14:251–258. 2017.
View Article : Google Scholar : PubMed/NCBI
|
|
20
|
Li B and Dewey CN: RSEM: Accurate
transcript quantification from RNA-Seq data with or without a
reference genome. BMC Bioinformatics. 12:3232011. View Article : Google Scholar : PubMed/NCBI
|
|
21
|
Livak KJ and Schmittgen TD: Analysis of
relative gene expression data using real-time quantitative PCR and
the 2(-Delta Delta C(T)) method. Methods. 25:402–408. 2001.
View Article : Google Scholar
|
|
22
|
Ichimi T, Enokida H, Okuno Y, Kunimoto R,
Chiyomaru T, Kawamoto K, Kawahara K, Toki K, Kawakami K, Nishiyama
K, et al: Identification of novel microRNA targets based on
microRNA signatures in bladder cancer. Int J Cancer. 125:345–352.
2009. View Article : Google Scholar : PubMed/NCBI
|
|
23
|
Yoshino H, Chiyomaru T, Enokida H,
Kawakami K, Tatarano S, Nishiyama K, Nohata N, Seki N and Nakagawa
M: The tumoursuppressive function of miR-1 and miR-133a targeting
TAGLN2 in bladder cancer. Br J Cancer. 104:808–818. 2011.
View Article : Google Scholar : PubMed/NCBI
|
|
24
|
Masoud GN and Li W: HIF-1α pathway: Role,
regulation and intervention for cancer therapy. Acta Pharm Sin B.
5:378–389. 2015. View Article : Google Scholar : PubMed/NCBI
|
|
25
|
Qing G, Skuli N, Mayes PA, Pawel B,
Martinez D, Maris JM and Simon MC: Combinatorial regulation of
neuroblastoma tumor progression by N-Myc and hypoxia inducible
factor HIF-1alpha. Cancer Res. 70:10351–10361. 2010. View Article : Google Scholar : PubMed/NCBI
|
|
26
|
Hong SS, Lee H and Kim KW: HIF-1alpha: A
valid therapeutic target for tumor therapy. Cancer Res Treat.
36:343–353. 2004. View Article : Google Scholar : PubMed/NCBI
|
|
27
|
Hameiri-Grossman M, Porat-Klein A, Yaniv
I, Ash S, Cohen IJ, Kodman Y, Haklai R, Elad-Sfadia G, Kloog Y,
Chepurko E, et al: The association between let-7, RAS and HIF-1α in
Ewing Sarcoma tumor growth. Oncotarget. 6:33834–33848. 2015.
View Article : Google Scholar : PubMed/NCBI
|
|
28
|
Shih C and Weinberg RA: Isolation of a
transforming sequence from a human bladder carcinoma cell line.
Cell. 29:161–169. 1982. View Article : Google Scholar : PubMed/NCBI
|
|
29
|
Haliassos A, Liloglou T, Likourinas M,
Doumas C, Ricci N and Spandidos D: H-ras oncogene mutations in the
urine of patients with bladder-tumors - description of a
noninvasive method for the detection of neoplasia. Int J Oncol.
1:731–734. 1992.PubMed/NCBI
|
|
30
|
Zhang X and Zhang Y: Bladder cancer and
genetic mutations. Cell Biochem Biophys. 73:65–69. 2015. View Article : Google Scholar
|
|
31
|
Kompier LC, Lurkin I, van der Aa MN, van
Rhijn BW, van der Kwast TH and Zwarthoff EC: FGFR3, HRAS, KRAS,
NRAS and PIK3CA mutations in bladder cancer and their potential as
biomarkers for surveillance and therapy. PLoS One. 5:e138212010.
View Article : Google Scholar : PubMed/NCBI
|
|
32
|
Beukers W, Hercegovac A and Zwarthoff EC:
HRAS mutations in bladder cancer at an early age and the possible
association with the Costello Syndrome. Eur J Hum Genet.
22:837–839. 2014. View Article : Google Scholar :
|
|
33
|
Pandith AA, Shah ZA, Khan NP, Baba KM,
Wani MS and Siddiqi MA: HRAS T81C polymorphism modulates risk of
urinary bladder cancer and predicts advanced tumors in ethnic
Kashmiri population. Urol Oncol. 31:487–492. 2013. View Article : Google Scholar
|
|
34
|
Goldberg L, Israeli R and Kloog Y: FTS and
2-DG induce pancreatic cancer cell death and tumor shrinkage in
mice. Cell Death Dis. 3:e2842012. View Article : Google Scholar : PubMed/NCBI
|
|
35
|
Goldberg L, Ocherashvilli A, Daniels D,
Last D, Cohen ZR, Tamar G, Kloog Y and Mardor Y: Salirasib
(farnesyl thiosalicylic acid) for brain tumor treatment: A
convection-enhanced drug delivery study in rats. Mol Cancer Ther.
7:3609–3616. 2008. View Article : Google Scholar : PubMed/NCBI
|
|
36
|
Charette N, De Saeger C, Lannoy V,
Horsmans Y, Leclercq I and Stärkel P: Salirasib inhibits the growth
of hepatocarcinoma cell lines in vitro and tumor growth in vivo
through ras and mTOR inhibition. Mol Cancer. 9:2562010. View Article : Google Scholar : PubMed/NCBI
|
|
37
|
Kurzrock R, Kantarjian HM, Blascovich MA,
Bucher C, Verstovsek S, Wright JJ, Pilat SR, Cortes JE, Estey EH,
Giles FJ, et al: Phase I study of alternate-week administration of
tipifarnib in patients with myelodysplastic syndrome. Clin Cancer
Res. 14:509–514. 2008. View Article : Google Scholar : PubMed/NCBI
|
|
38
|
Lancet JE, Gojo I, Gotlib J, Feldman EJ,
Greer J, Liesveld JL, Bruzek LM, Morris L, Park Y, Adjei AA, et al:
A phase 2 study of the farnesyltransferase inhibitor tipifarnib in
poor-risk and elderly patients with previously untreated acute
myelogenous leukemia. Blood. 109:1387–1394. 2007. View Article : Google Scholar
|
|
39
|
Welsch ME, Kaplan A, Chambers JM, Stokes
ME, Bos PH, Zask A, Zhang Y, Sanchez-Martin M, Badgley MA, Huang
CS, et al: Multivalent small-molecule Pan-RAS inhibitors. Cell.
168:878–889.e29. 2017. View Article : Google Scholar : PubMed/NCBI
|