Introduction
The most recent data indicate that lung cancer
remains the type of cancer with the highest prevalence among men
and women and is also one of the most common causes of
cancer-related mortality (1).
Approximately 1.82 million cases of lung cancer are newly diagnosed
globally each year, and approximately 1.37 million individuals
succumb to the disease (2–4). Based on the histological
classification, lung cancers are divided into 2 types: Non-small
cancer lung cancer (NSCLC) and small cell lung cancer (SCLC). NSCLC
accounts for 85% of all lung cancer cases (5). NSCLS includes a number of
histological subtypes, including lung adenocarcinoma (LUAD), lung
squamous cell carcinoma (LUSC) and large cell carcinoma (LCC). LUAD
is one of the main subtypes of NSCLC (6). Despite in-depth studies and
significant progress being made in lung cancer treatment in recent
decades (7–10), comprehensive clinical evaluation
and in-depth molecular mechanistic studies are still required.
Therefore, further investigations of the pathological mechanisms of
NSCLC are warranted. Thus, the screening of novel functional genes
and targets in NSCLC may provide basic data and a preliminary
theoretic basis for further studies on the pathogenesis of
NSCLC.
The homeobox (HOX) gene family is composed of
39 genes. These genes play critical roles in normal embryonic
development by encoding transcription factors. The HOX gene
family is divided into 4 groups: HOXA, HOXB,
HOXC and HOXD. These genes localize to different
chromosomal regions. The human HOXA gene cluster localizes
to chromosome 7. There are 12 genes, including HOXA1 to
HOXA11 and HOXA13 (11–13).
The HOXA gene cluster plays important roles in colorectal
cancer, leukaemia, pancreatic cancer, oral squamous cell carcinoma
and lung cancer (14–18). For HOXA3, only one study
suggests that it nat be used as a biomarker of LUAD. This study was
conducted by Daugaard et al (19). These researchers used a DNA
methylation microarray to compare the genome-wide methylation
patterns between tumour and tumour-adjacent lung tissues from 4
patients with LUAD and identified 74 differential methylation
regions (DMRs). Through methylation sensitive-high resolution
melting (MS-HRM) analyses, 18 DMRs were selected for validation in
52 LUAD tissues and 32 cancer-adjacent lung tissues. Finally, this
study confirmed and validated 15 DMRs, including HOXA3, that
could be used as biomarkers of LUAD (19). However, studies on the clinical
significance and regulatory mechanisms of HOXA3 expression
in NSCLC are still lacking. Therefore, further studies are urgently
required to examine HOXA3 expression in NSCLC and to
investigate the potential regulatory mechanisms in order to provide
new insight into the pathogenic mechanisms of NSCLC.
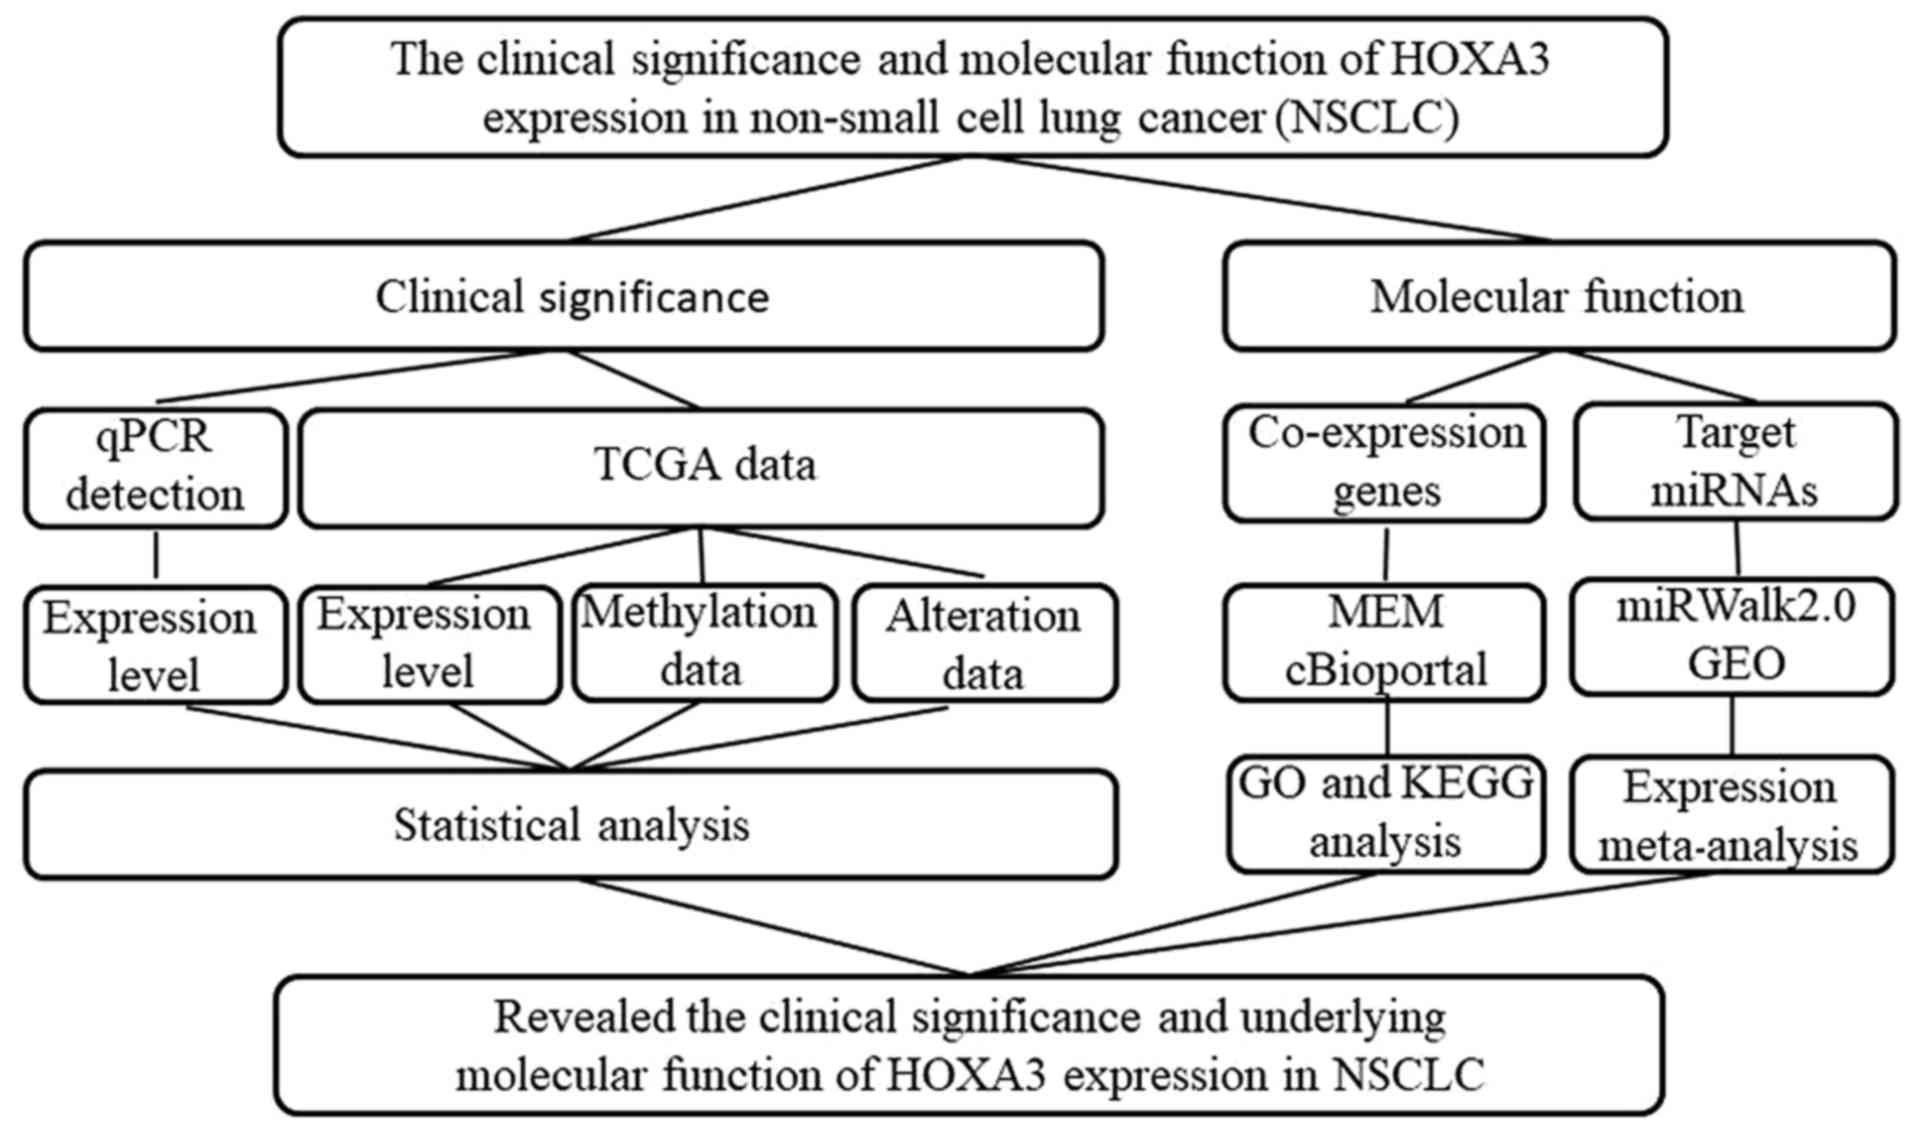
In this study, we used reverse
transcription-quantitative PCR (RT-qPCR) to detect HOXA3
expression in NSCLC and normal lung tissues. HOXA3
expression in NSCLC was validated using the Gene Expression
Profiling Interactive Analysis (GEPIA) database. In addition,
informatics analysis methods, including Gene Ontology (GO), Kyoto
Encyclopedia of Genes and Genomes (KEGG) and protein-protein
interaction (PPI), were performed to investigate the potential
molecular mechanisms of action of HOXA3. Furthermore, the
potential target microRNAs (miRNAs or miRs) of HOXA3 were
predicted using miRWalk2.0. The expression levels of miRNAs were
validated using the Gene Expression Omnibus (GEO) and the Cancer
Genome Atlas (TGCA) databases. The study design is presented in
Fig. 1.
Materials and methods
Clinical samples
A total of 55 tissues of cases of clinical NSCLC and
cancer-adjacent lung tissues were collected (from January, 2012 to
February, 2014) at the Department of Pathology of The First
Affiliated Hospital of Guangxi Medical University (Nanning, China).
Among these 55 patients, 32 cases were diagnosed with LUAD, and 23
cases were diagnosed with LUSC. There were 41 men and 14 women.
Patients were 23–90 years of age with a mean age of 56.9 years.
Among these 55 cases, tumours in 39 cases were larger than 3 cm.
Table I summarizes the detailed
clinicopathological data of all the patients. Samples were fixed in
formalin and embedded in paraffin. This research programme was
approved by the Ethics Committee of the First Affiliated Hospital
of Guangxi Medical University. All participants signed informed
consent forms. All samples were diagnosed by 2 pathologists (G.C.
and D.-M.W.) independently using the double-blind method.
 | Table IThe association of between HOXA3 mRNA
expression in NSCLC tissues and patient clinicopathological
characteristics based on RT-qPCR detection. |
Table I
The association of between HOXA3 mRNA
expression in NSCLC tissues and patient clinicopathological
characteristics based on RT-qPCR detection.
| Clinicopathological
characteristics | Case no. | HOXA3 expression
| t-test of data
|
|---|
| Mean | SD | FC | t-test | P-value |
|---|
| Group | | | | | | |
| Control | 55 | 0.19 | 0.20 | 1.00 | 2.86 | 0.006 |
| Cancer | 55 | 0.11 | 0.14 | 0.60 | | |
| Pathological
type | | | | | | |
|
Adenocarcinoma | 32 | 0.13 | 0.17 | 1.00 | 0.99 | 0.326 |
| Squamous cell
carcinoma | 23 | 0.09 | 0.08 | 0.70 | | |
| LUAD | | | | | | |
| Control | 32 | 0.23 | 0.24 | 1.00 | −1.94 | 0.023 |
| Cancer | 32 | 0.13 | 0.17 | 0.55 | | |
| LUAD | | | | | | |
| Non-smoker | 18 | 0.18 | 0.20 | 1.00 | 2.42 | 0.025 |
| Smoker | 14 | 0.06 | 0.04 | 0.32 | | |
| LUSC | | | | | | |
| Control | 23 | 0.12 | 0.09 | 1.00 | −1.32 | 0.034 |
| Cancer | 23 | 0.09 | 0.08 | 0.73 | | |
| Sex | | | | | | |
| Male | 41 | 0.12 | 0.15 | 1.00 | 0.35 | 0.732 |
| Female | 14 | 0.10 | 0.12 | 0.87 | | |
| Age (years) | | | | | | |
| <60 | 35 | 0.12 | 0.15 | 1.00 | 0.25 | 0.801 |
| ≥60 | 20 | 0.11 | 0.12 | 0.91 | | |
| Smoking | | | | | | |
| No | 30 | 0.14 | 0.17 | 1.00 | 1.91 | 0.064 |
| Yes | 25 | 0.08 | 0.06 | 0.54 | | |
| Size | | | | | | |
| ≤3 cm | 16 | 0.12 | 0.12 | 1.00 | 0.09 | 0.931 |
| >3 cm | 39 | 0.11 | 0.15 | 0.97 | | |
| LNM | | | | | | |
| No | 29 | 0.08 | 0.10 | 1.00 | −1.66 | 0.103 |
| Yes | 26 | 0.14 | 0.17 | 1.78 | | |
| TNM | | | | | | |
| I–II | 29 | 0.09 | 0.11 | 1.00 | −1.26 | 0.212 |
| III–IV | 26 | 0.14 | 0.17 | 1.54 | | |
| Vascular
invasion | | | | | | |
| No | 50 | 0.11 | 0.15 | 1.00 | 0.23 | 0.817 |
| Yes | 5 | 0.10 | 0.03 | 0.85 | | |
| Clinical
grading | | | | | | |
| I | 5 | 0.09 | 0.08 | | | 0.664 |
| II | 40 | 0.12 | 0.16 | | | |
| III | 10 | 0.08 | 0.07 | | | |
Detection of HOXA3 expression by
RT-qPCR
HOXA3 expression in NSCLC samples was
detected by RT-qPCR which was performed as previously described
(20–22). Total RNA was extracted from the
tumour and cancer-adjacent normal tissues using the RNeasy reagent
(Qiagen, Shanghai, China). The RNA concentration was measured using
NanoDrop2000 (Thermo Fisher Scientific, Wilmington, DE, USA). Total
RNA was reverse transcribed (10 µl reaction system) using a reverse
transcription kit (ABI, Life Technologies, Carlsbad, CA, USA) to
obtain cDNA for RT-qPCR. SYBR-Green (Shanghai GeneCore
BioTechnologies Co., Ltd., Shanghai, China) was used to perform
RT-qPCR and the distinctiveness of the PCR product was
differentiated based on melting curve (23–26).
RT-qPCR was carried out using the following conditions: preheating
for 10 min at temprature 95°C; and then repeating 40 cycles in
temperature 95°C for 15 sec and 60 sec at 60°C. The primer
sequences of HOXA3 were as follows: Upstream,
TCATTTAAGAGCGCCTGGACA and downstream primer, GAGCTGTCGTAGTAGGTCGC.
Using GAPDH as an internal reference gene and the primer
sequence were as follows: Upstream, 5′-TGGTCCCTGCTCCTCTAAC-3′,
downstream primer, 5′-GGCTCAATGGCGTACTCTC-3′. The relative
expression level of HOXA3 in this study was calculated using
the 2−ΔΔCq (27)
formula (28, 29).
Retrieval of TCGA data
GEPIA (http://gepia.cancer-pku.cn/) is a visualization
website based on TCGA data and contains differential gene
expression between cancer and non-cancer, and analysis of the
association between gene expression and overall survival (OS) or
disease-free survival (DFS) and clinical stages (Stage). Survival
analyses were performed using the log-rank test (also known as
Mantel-Cox test) for hypothesis tests and calculation of the hazard
ratio (HR) and 95% confidence interval (95% CI). Keywords, such as
'HOXA3', 'LUAD' and 'LUSC', were searched in GEPIA to
retrieve data of the differential expression of HOXA3 in
NSCLS, LUAD, LUSC and normal lung tissues, as well as information
regarding the association between HOXA3 and clinical stages
and prognostic survival.
The keywords 'lung' and 'HOXA3' were searched
in the cBioPortal (http://www.cbioportal.org/) website to retrieve
genetic alteration data of HOXA3 in LUAD and LUSC. Data were
obtained from microarray detection and RNA sequencing. In addition,
DNA methylation data in LUAD and LUSC were downloaded from the
Cancer Genome Atlas (TCGA: https://cancergenome.nih.gov/abouttcga/overview)
database. HOXA3 methylation data in LUAD and LUSC were
screened.
HOXA3 co-expression genes
To investigate the intrinsic mechanisms of
HOXA3 expression in NSCLC tissues, we acquired
HOXA3-associated co-expression genes from the MEM
(http://biit.cs.ut.ee/mem) and cBioPortal
databases. In MEM, when the score/P-value was smaller, the
association between that gene and HOXA3 was more
significant. The results of 2 gene probes were extracted from MEM
based on a P-value <0.0001, and the results were used for
intersection. On the other hand, Pearson's correlation analysis was
performed in cBioPortal to calculate the correlation between
co-expression genes and HOXA3. When the absolute value of
the Pearson's correlation coefficient was larger, the correlation
was stronger. This study selected genes with an absolute value of
the Pearsons' correlation coefficient >0.3 in NSCLC, LUAD and
LUSC. Finally, the intersection results between MEM and cBioPortal
were obtained and used for further analyses. The overlapping genes
were confirmed using a Venn diagram (http://bioinformatics.psb.ugent.be/webtools/Venn/).
Bioinformatics analyses
In this study, we used bioinformatics analyses to
preliminarily investigate the molecular mechanisms of action of
HOXA3 in NSCLC. The final overlapping genes in MEM and
cBioPortal were used for GO and KEGG analyses in David v6.7
(http://david.abcc.ncifcrf.gov/) to
elucidate the enrichment of genes in biological processes and
signalling pathways. PPI analyses were performed in STRING v10.5
(https://string-db.org/cgi/input.pl?input_page_show_search=on&UserId=HJJhhNv8hYyf&sessionId=Ce1Dx9pYDluc)
to validate the protein interaction association to hypothesize the
pathways through which HOXA3 carries out its functions in
NSCLC. The construction of the functional network was performed
using Cytoscape 3.5.0 software and ClueGO plugin.
Prediction and preliminary validation of
target miRNAs of HOXA3
The prediction of target miRNAs of HOXA3 was
performed in miRWalk2.0 (http://zmf.umm.uni-heidelberg.de/apps/zmf/mirwalk2/).
miRWalk2.0 contains 12 on-line target gene prediction tools:
Pictar2, miRWalk, miRMap, DIANA microT v4, PITA, miRanda, RNA22,
mirBridge, miRDB, RNAhybrid, miRNAMap and TargetScan. miRNAs that
were present in >8 software results were used as candidate
miRNAs for further analyses.
The microarray results of differentially expressed
miRNAs in lung cancer were searched in the GEO database and
downloaded. The following search formula was employed: (lung OR
pulmonary OR respiratory OR bronchi OR bronchioles OR alveoli OR
pneumocytes OR 'air way') AND (cancer OR carcinoma OR tumor OR
neoplas* OR malignan* OR adenocarcinoma) AND (microRNA OR miRNA OR
'micro RNA' OR 'small temporal RNA' OR 'noncoding RNA' OR ncRNA OR
'small RNA'). We included microarray data containing expression
data of miRNAs in lung cancer tissues and normal lung tissues and a
sample number >3 into this study. Microarray data that did not
conform to this condition were excluded. In addition, miRNA
expression data for the LUAD, LUSC and normal lung tissues were
extracted from the TCGA database. The mean value ± standard
deviation (means ± SD) of the expression of potential target miRNAs
in tumour and non-tumour tissues in each microarray was calculated.
The random effects model was used to calculate the standardized
mean difference (SMD) in STATA 2.0 software to evaluate the
expression trend of miRNAs in NSCLC and plot the forest plot. In
addition, analyses using the sROC method were performed to further
validate the expression trend of miRNAs in NSCLC.
Statistical analyses
Statistical analyses of the experimental data were
performed using SPSS 22.0 software (IBM, New York, NY, USA). The
HOXA3 expression levels detected by RT-qPCR were expressed
as the means ± SD and the Mann-Whitney test was used to determine
significance. The normal distribution was determined using the
single-sample K-S test. The comparison of the association between
the HOXA3 expression level and the patient
clinicopathological characteristics, and the comparison of mean
values of 2 factors were performed using the independent sample
t-test when variances were homogeneous. When variances were not
homogeneous, rank sum statistical analysis was performed. The
comparison of the mean values of multiple factors was performed
using one-way analysis of variance (ANOVA) followed by the
Bonferroni post hoc test, with a default P-value of 0.05. The
differences in HOXA3 expression levels between the NSCLC and
normal lung tissues were further validated using the calculation of
the area under the ROC curve. The Kaplan-Meier curve method was
performed to analyse the association between the HOXA3
expression level and NSCLC patient survival. Pearson's correlation
analysis was used to calculate the correlation between two genes.
GraphPad Prism was used to generate the scatter plot. Meta-analysis
of target miRNAs in NSCLC and normal lung tissues was performed
using the STATA 12.0 software. P<0.05 in all analytic results
indicated that the differences exhibited statistical
significance.
Results
HOXA3 expression in NSCLC
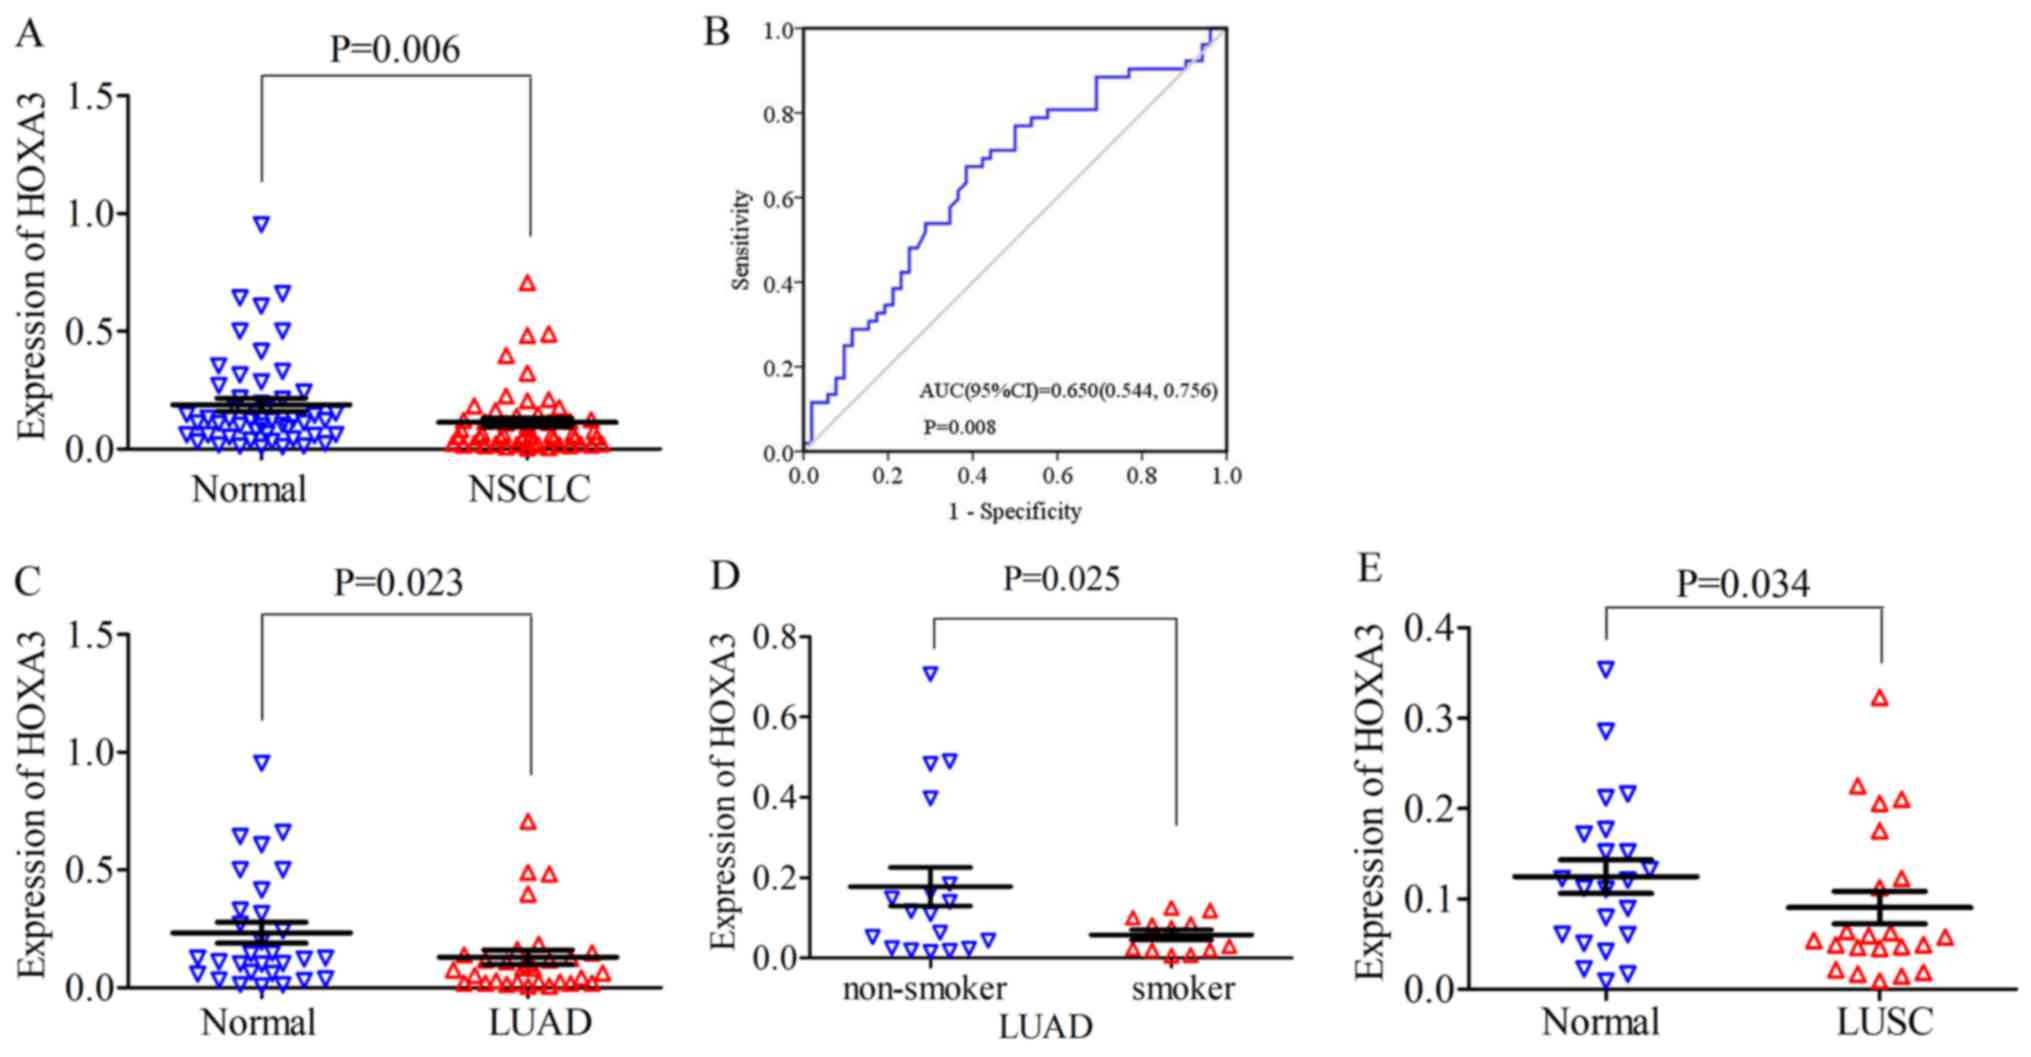
For NSCLC, the HOXA3 expression level in the
cancer tissues was 0.11±0.14 and the fold change (FC), 0.60 (FC is
the fold change of HOXA3 expression in tumour and non-tumour
adjacent tissue). Compared with the normal lung tissues (0.19±0.20,
P=0.006), HOXA3 expression was significantly decreased
(P=0.006; Fig. 2A). The median of
the HOXA3 level was 0.06 and the FC, 0.5 (control, 0.12;
P=0.008). The area under the ROC curve (AUC) of low HOXA3
expression in NSCLC was 0.65 (95% CI: 0.54, 0.76; P=0.008, Fig. 2B). Therefore, a low HOXA3
expression may have some value in the occurrence of NSCLC. A low
HOXA3 expression was not significantly associated with the
clinicopathological characteristics (Table I). In addition, in LUAD, the mean
expression level of HOXA3 was 0.13±0.17 and the FC, 0.55.
HOXA3 expression was significantly decreased in LUAD
compared with the cancer-adjacent normal tissues (0.24±0.24,
P=0.023) (Fig. 2C and Table I). The median of the HOXA3
level was 0.08 and the FC, 0.62 (control, 0.13; P=0.034). The AUC
of downregulated HOXA3 expression in LUAD was 0.66 (95% CI:
0.52, 0.80; P=0.035) (data not shown). Further analyses revealed
that the HOXA3 level in smokers (0.06±0.04) was reduced
compared with that in non-smokers (0.186±0.20, P=0.025) (Fig. 2D and Table I). The AUC of downregulated
HOXA3 in the smoking group was 0.70 (95% CI: 0.51, 0.89;
P=0.069) (data not shown). The combination of the above-mentioned
data analyses demonstrated that the downregulation of HOXA3
expression in LUAD was significant. In addition, HOXA3
expression in LUAD may be associated with smoking, but did not
exhibit a significant association with other clinicopathological
characteristics. The analyses of the LUSC group alone revealed that
HOXA3 expression differed significantly between the cancer
tissues and non-cancer tissues (cancer, 0.09±0.08 vs. control,
0.12±0.09, P=0.034, FC, 0.72) (Fig.
2E and Table I). The median of
the HOXA3 level was 0.06 and the FC, 0.5 (control, 0.12;
P=0.113). The AUC of the low HOXA3 level in the LUSC group
was 0.64 (95% CI: 0.47, 0.81; P=0.113) (data not shown). The low
expression of HOX3A in LUSC was not significantly associated with
disease progression.
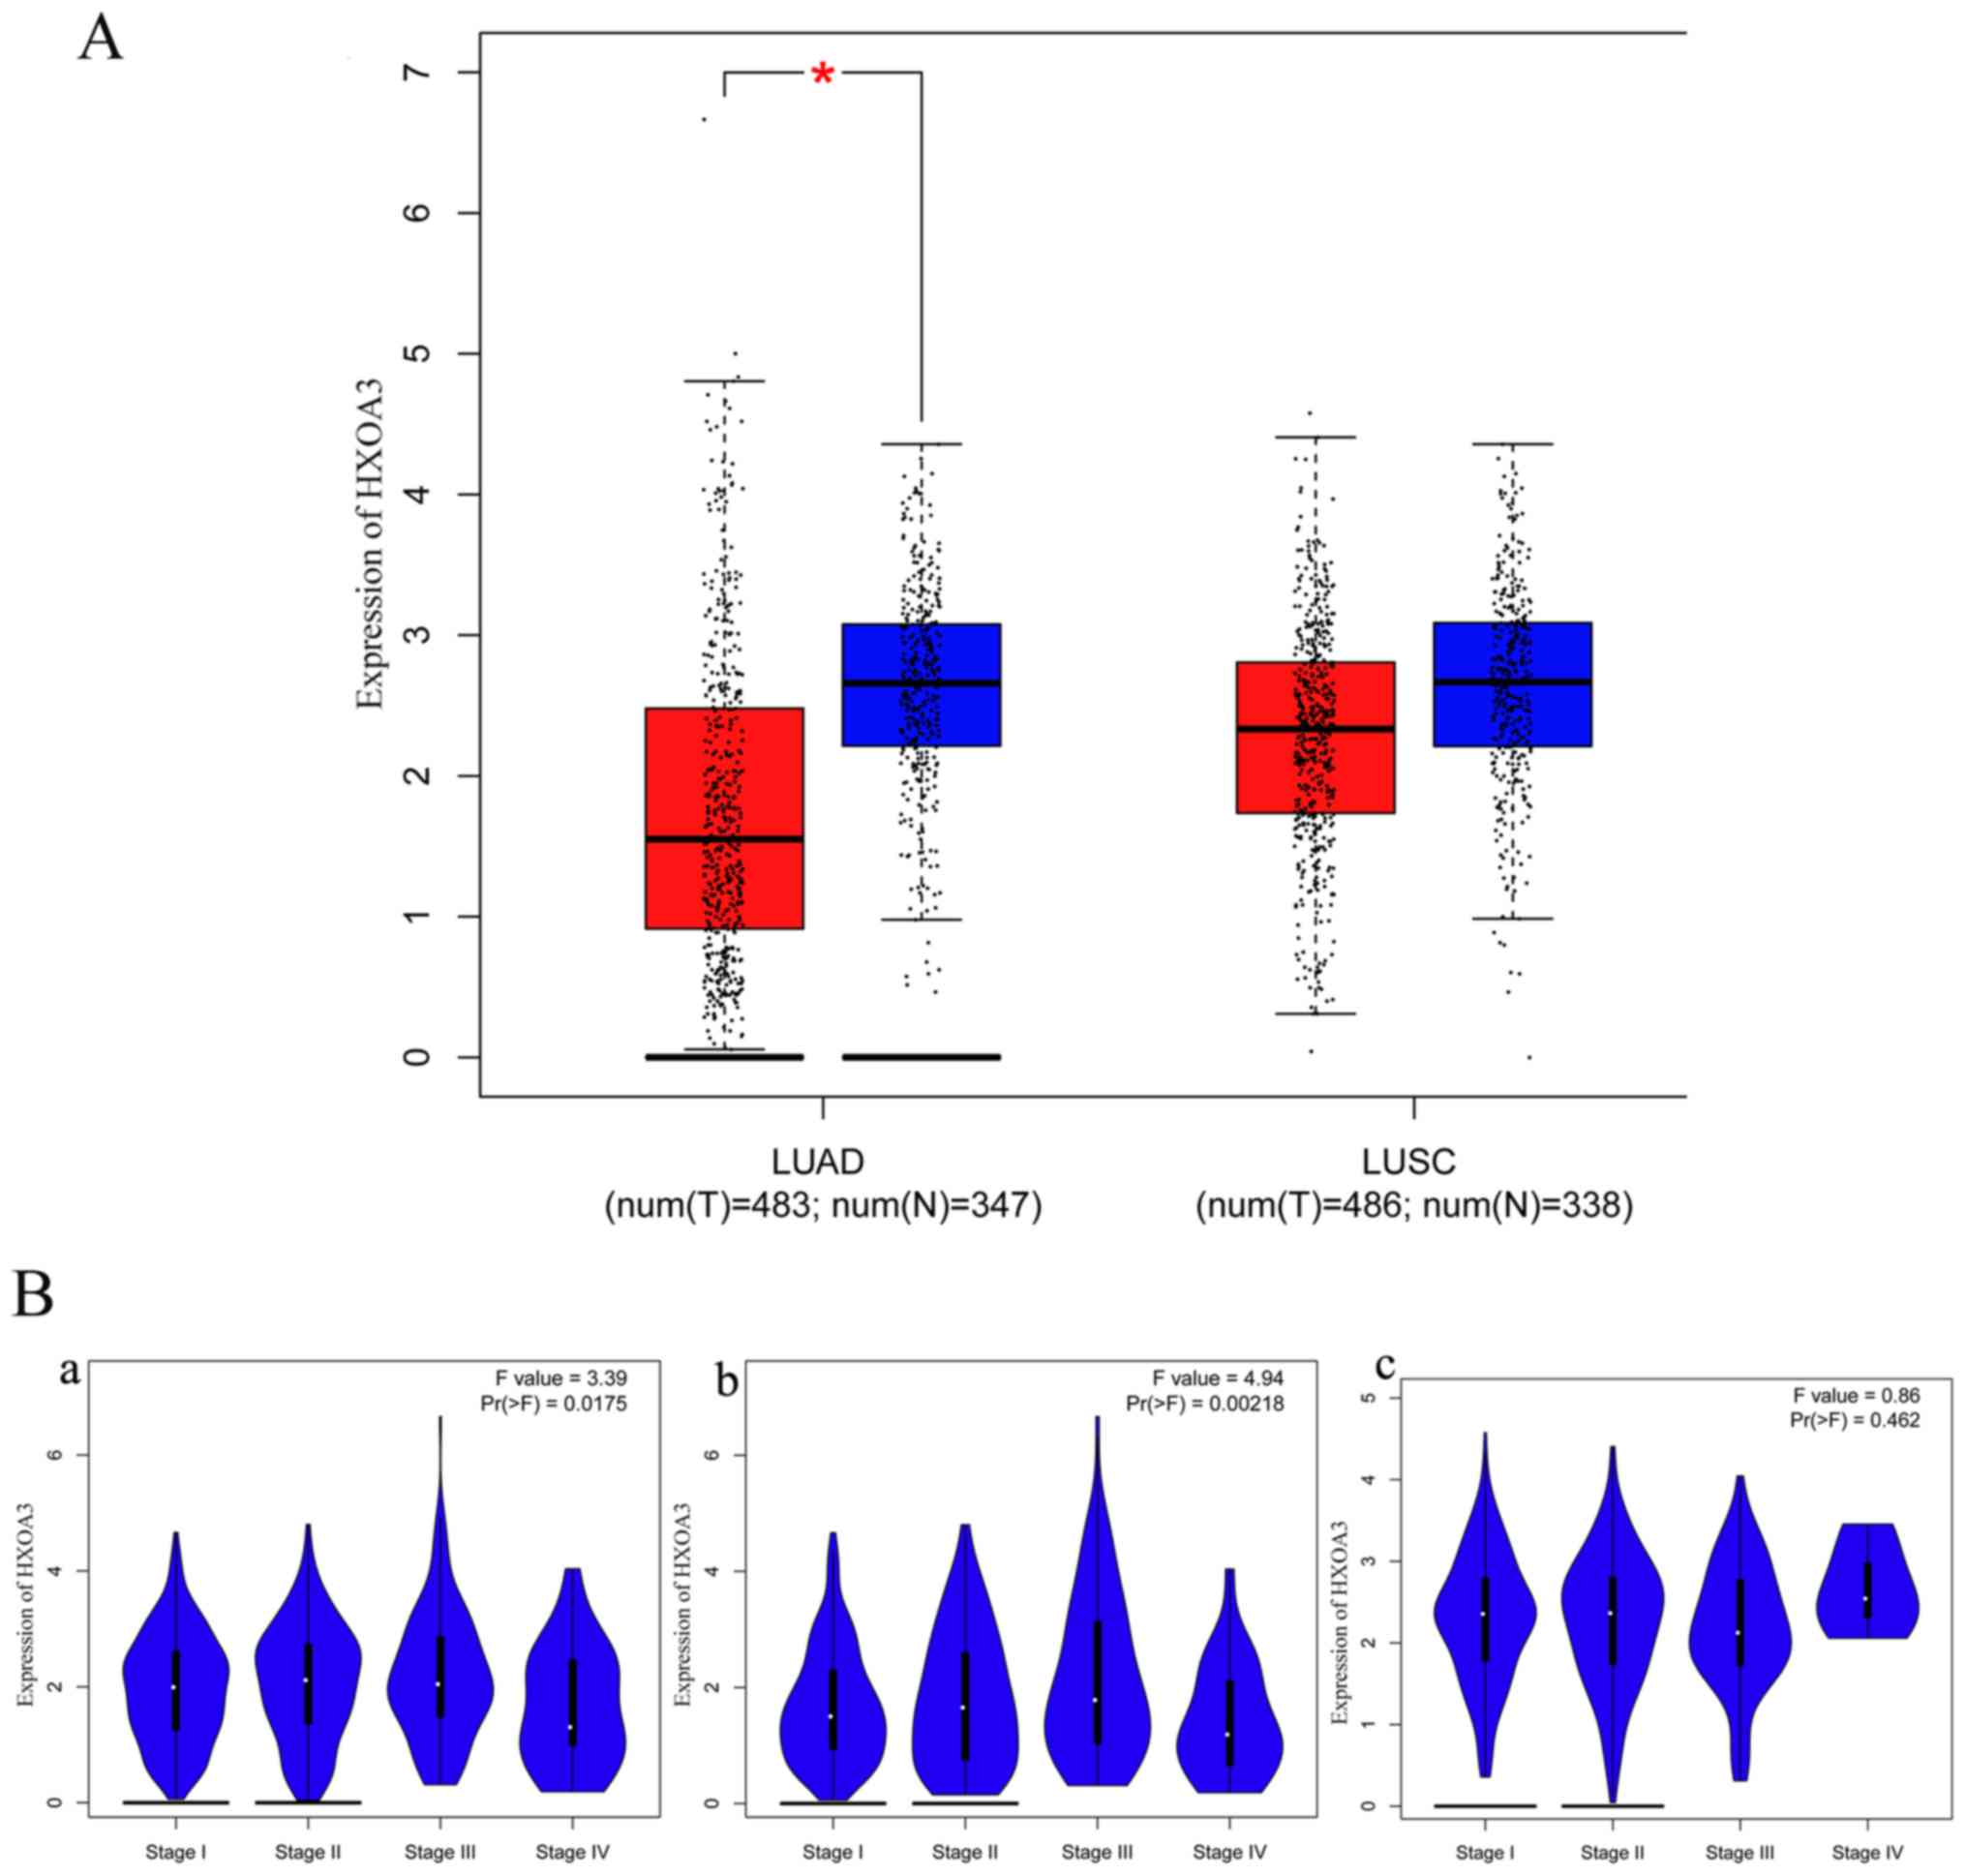
In addition, the GEPIA data revealed that
HOXA3 expression in LUAD (483 cases) was also significantly
decreased compared with the normal lung tissues (347 cases) and
exhibited a low expression trend in LUSC (LUSC, 486 cases; normal,
338 cases) (Fig. 3A). These
results were consistent with the results of RT-qPCR. However, the
association between the HOXA3 expression level and the
pathological stage did not exhibit an obvious pattern (Fig. 3B). We also acquired information
regarding the association between the HOXA3 expression level
and the survival of patients with NSCLC, LUAD and LUSC. Patients
with NSCLC with a low HOXA3 expression exhibited a better OS
[HR (high), 1.3; P=0.0035] (Fig.
4A, panel a). Thus, a low HOXA3 expression may be a
protective factor of OS in patients with NSCLC. However, further
analysis demonstrated that HOXA3 was not significantly
associated with the DFS of patients with NSCLC (Fig. 4A, panel d). The analyses of OS in
the LUAD group alone demonstrated that patients with a high
HOXA3 expression exhibited an HR of 1.4 (P=0.042) (Fig. 4A, panel b), suggesting that a high
HOXA3 level may be a risk factor for the prognosis of LUAD.
However, the HOXA3 expression levels did not exhibit obvious
predictive values as regards the DFS of patients with LUAD
(Fig. 4A, panel e). In addition,
the association between HOXA3 and the prognosis of patients
LUSC was not statistically significant (Fig. 4A, panels c and f), and this may
require further investigation.
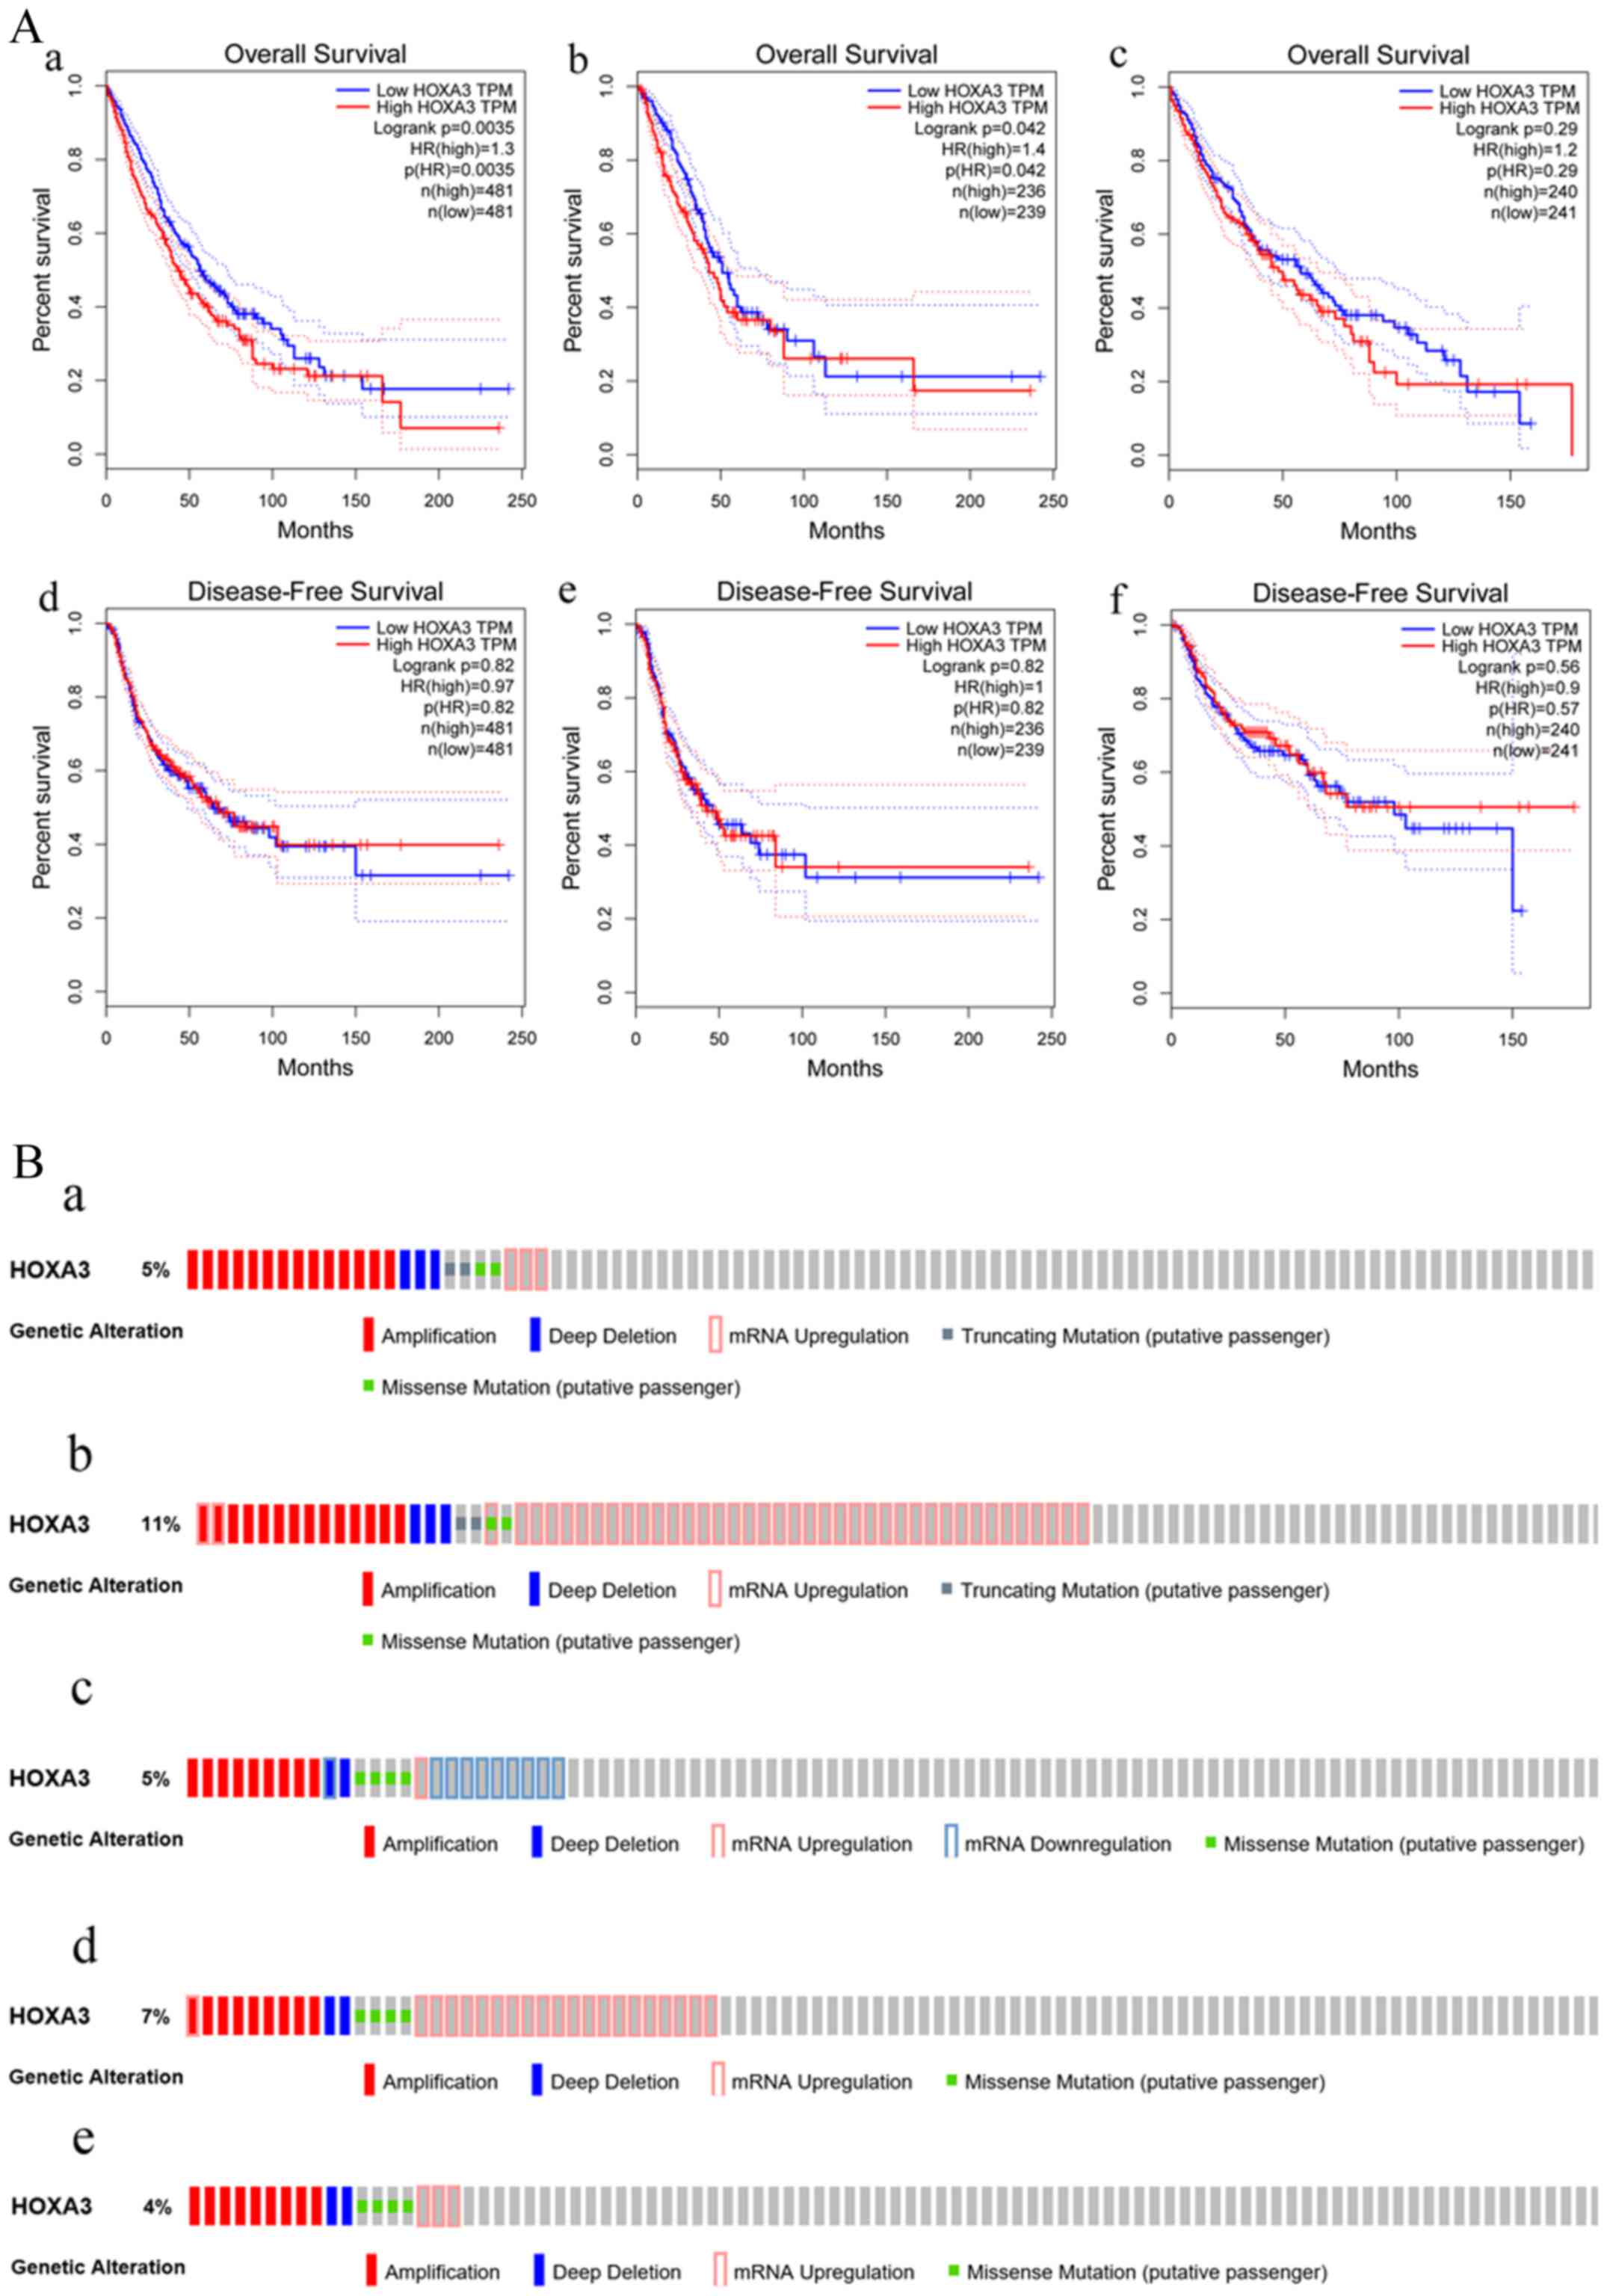 | Figure 4(A) Survival curve of HOXA3
expression in NSCLC. Overall survival (OS: panel a, NSCLC; panel b,
LUAD; panel c, LUSC) and disease-free survival (DFS: panel d,
NSCLC; panel e, LUAD; panel f, LUSC). (B) The atlas of genetic
alteration of HOXA3 mRNA in NSCLC. Panels a and b show HOXA3 mRNA
expression z-scores by microarray and RNA Seq V2 RSEM in LUAD.
Altered were 24 (5%) and 59 (11%) of 520 sequenced cases/patients
(520 total) respectively; panels c, d and e show HOXA3 mRNA
expression z-scores by U133 microarray only, microarray and RNA Seq
V2 RSEM in LUSC. Altered were 18 (4%), 25 (5%) and 35 (7%) of 504
sequenced cases/patients (504 total). HOXA3, homeobox A3; NSCLC,
non-small cell lung cancer; LUAD, lung adenocarcinoma; LUSC, lung
squamous cell carcinoma. |
Furthermore, based on the microarray and RNA
sequencing technologies, the sequencing results of 520 patients
with LUAD revealed that the genetic alteration rates of
HOXA3 were 5% (24/520) and 11% (59/520). In addition, the
sequencing results of 504 patients LUSC suggested that the genetic
alteration rates of HOXA3 were 5% (25/504), 7% (35/504) and
4% (18/504). Although the genetic alternation rates obtained using
different methods differed, the final results all confirmed that
HOXA3 harboured genetic alterations in the LUAD and LUSC
populations (Fig. 4B).
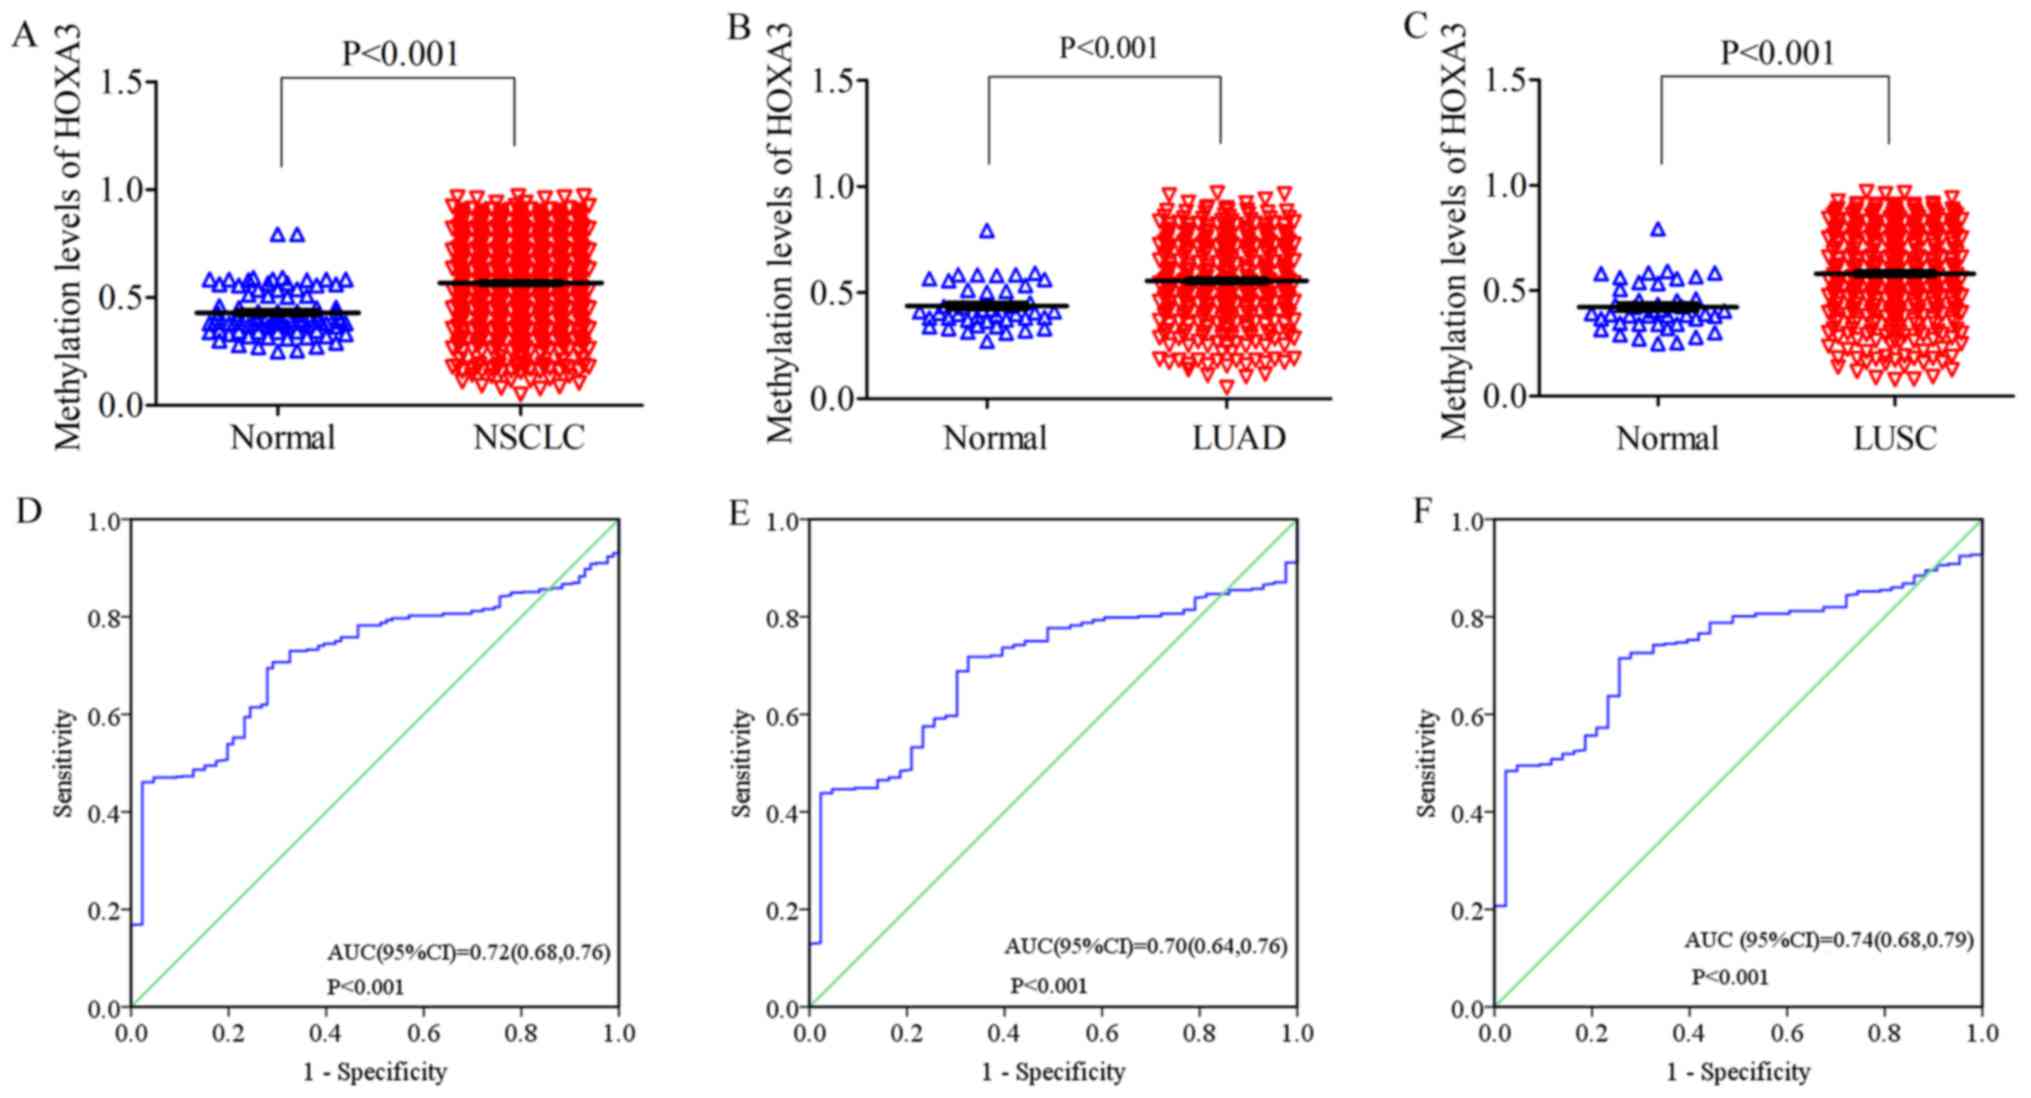
On the other hand, the methylation level of HOXA3
in the NSCLC tissues was 0.57±0.21 (FC, 1.32; P<0.001;
Fig. 5A), with an AUC value of
0.72 (95% CI: 0.68, 0.76; P<0.001, Fig. 5D). The methylation level in the
LUAD tissues was 0.56±0.20 (FC, 1.27; P<0.001; Fig. 5B), and an AUC value of 0.70 (95%
CI: 0.64, 0.76; P<0.001, Fig.
5E). The methylation level in the LUSC tissues was 0.58±0.21
(FC, 1.38; P<0.001; Fig. 5C),
and the AUC value was 0.74 (95% CI: 0.68, 0.79; P<0.001,
Fig. 5F) (Table II). Compared with the normal
tissues (NSCLC, 0.43±0.11; LUAD, 0.44±0.11; LUSC, 0.42±0.11), these
levels were all significantly upregulated.
| Table IIThe association of between the HOXA3
mRNA methylation level in NSCLC tissues and normal adjacent tissues
base on the TCGA data. |
Table II
The association of between the HOXA3
mRNA methylation level in NSCLC tissues and normal adjacent tissues
base on the TCGA data.
| Histological
type | Case no. | HOXA3 methylation
level
| t-test of data
|
|---|
| Mean | SD | FC | t-test | P-value |
|---|
| NSCLC | | | | | | |
| Normal
adjacent | 86 | 0.43 | 0.11 | 1.00 | 9.89 | <0.001 |
| Cancer | 744 | 0.57 | 0.21 | 1.32 | | |
| LUAD | | | | | | |
| Normal
adjacent | 43 | 0.44 | 0.11 | 1.00 | 6.19 | <0.001 |
| Cancer | 372 | 0.56 | 0.20 | 1.27 | | |
| LUSC | | | | | | |
| Normal
adjacent | 43 | 0.42 | 0.11 | 1.00 | 7.72 | <0.001 |
| Cancer | 372 | 0.58 | 0.21 | 1.38 | | |
HOXA3 co-expression genes
Based on MEM, 11,488 and 4,730 HOXA3
co-expression mRNA genes detected by 2 independent gene probes were
obtained. The intersection between the results of 2 gene probes was
collected, and a total of 1,709 more convincing co-expression mRNA
genes were extracted. The data from cBioPortal revealed 3,600 and
2,676 co-expression mRNA genes in the NSCLC group and the LUAD
group, respectively. Finally, the search results of the NSCLC group
and the LUAD group in MEM and cBioPortal were processed using the
crossing method (data not shown). In total, 293 and 213 genes were
obtained, respectively, for further analysis.
Bioinformatics analyses
GO and KEGG analyses were performed on 293 and 213
genes in DAVID, and PPI network analyses were performed in STRING.
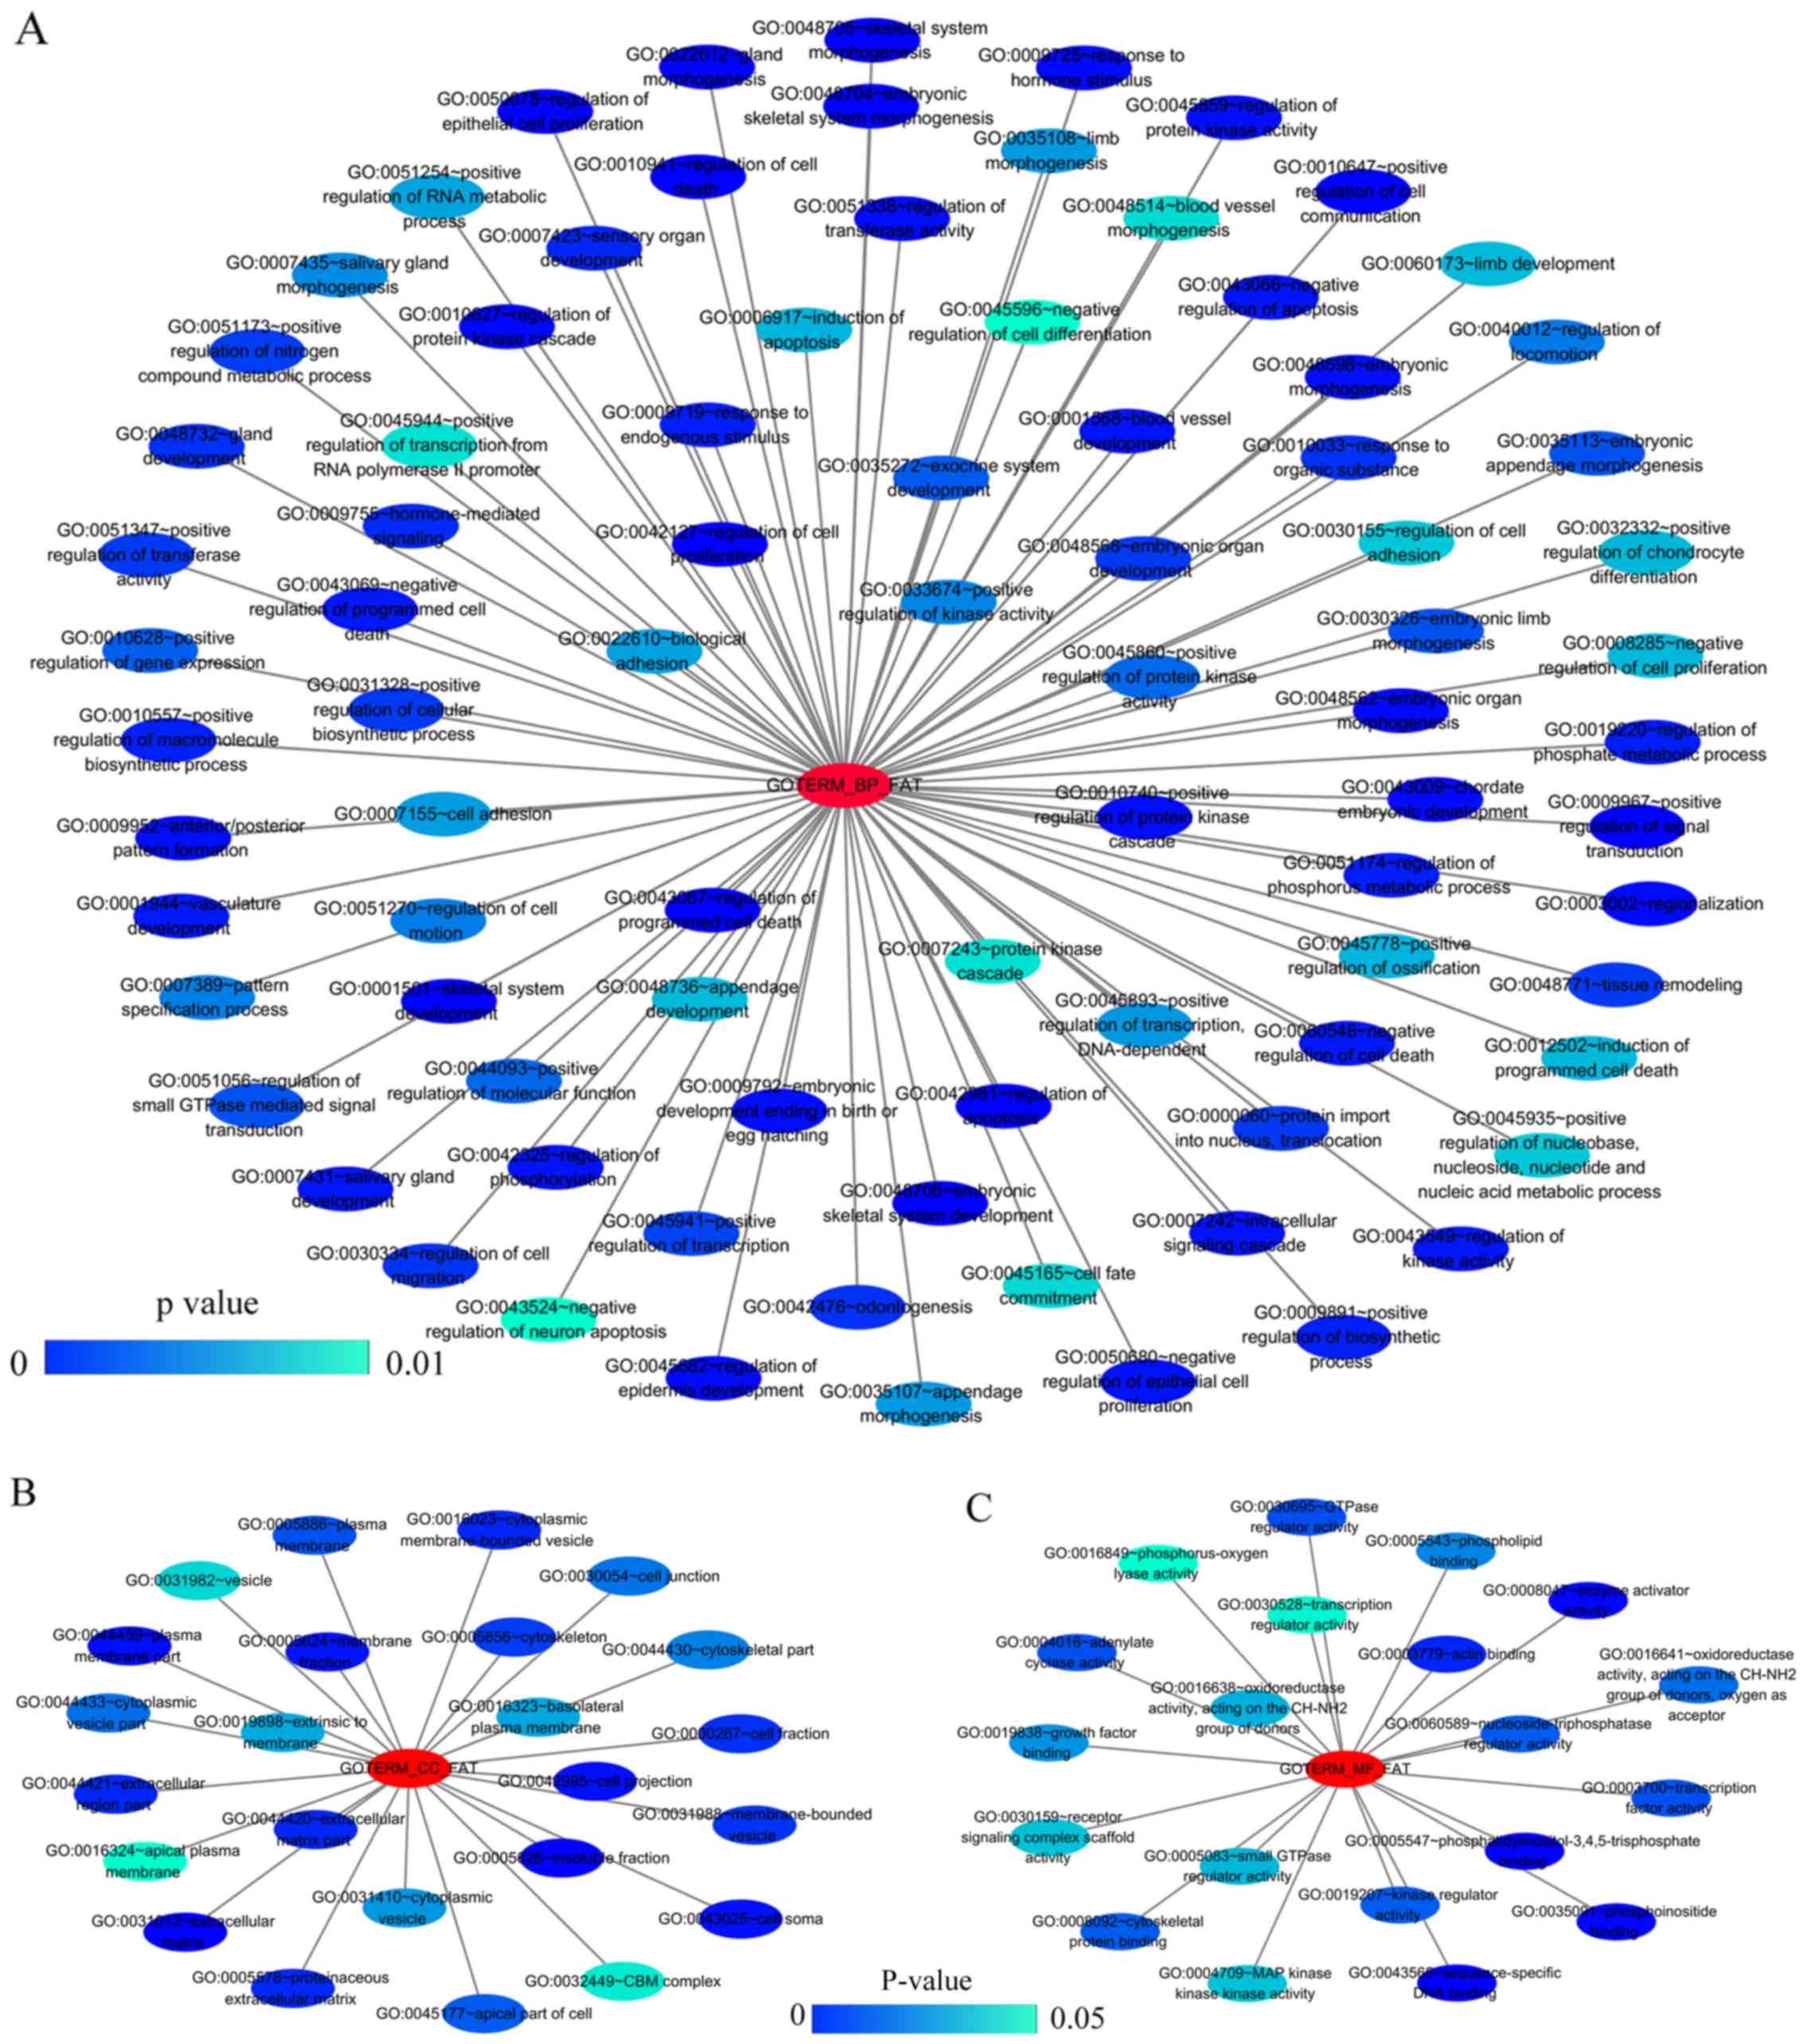
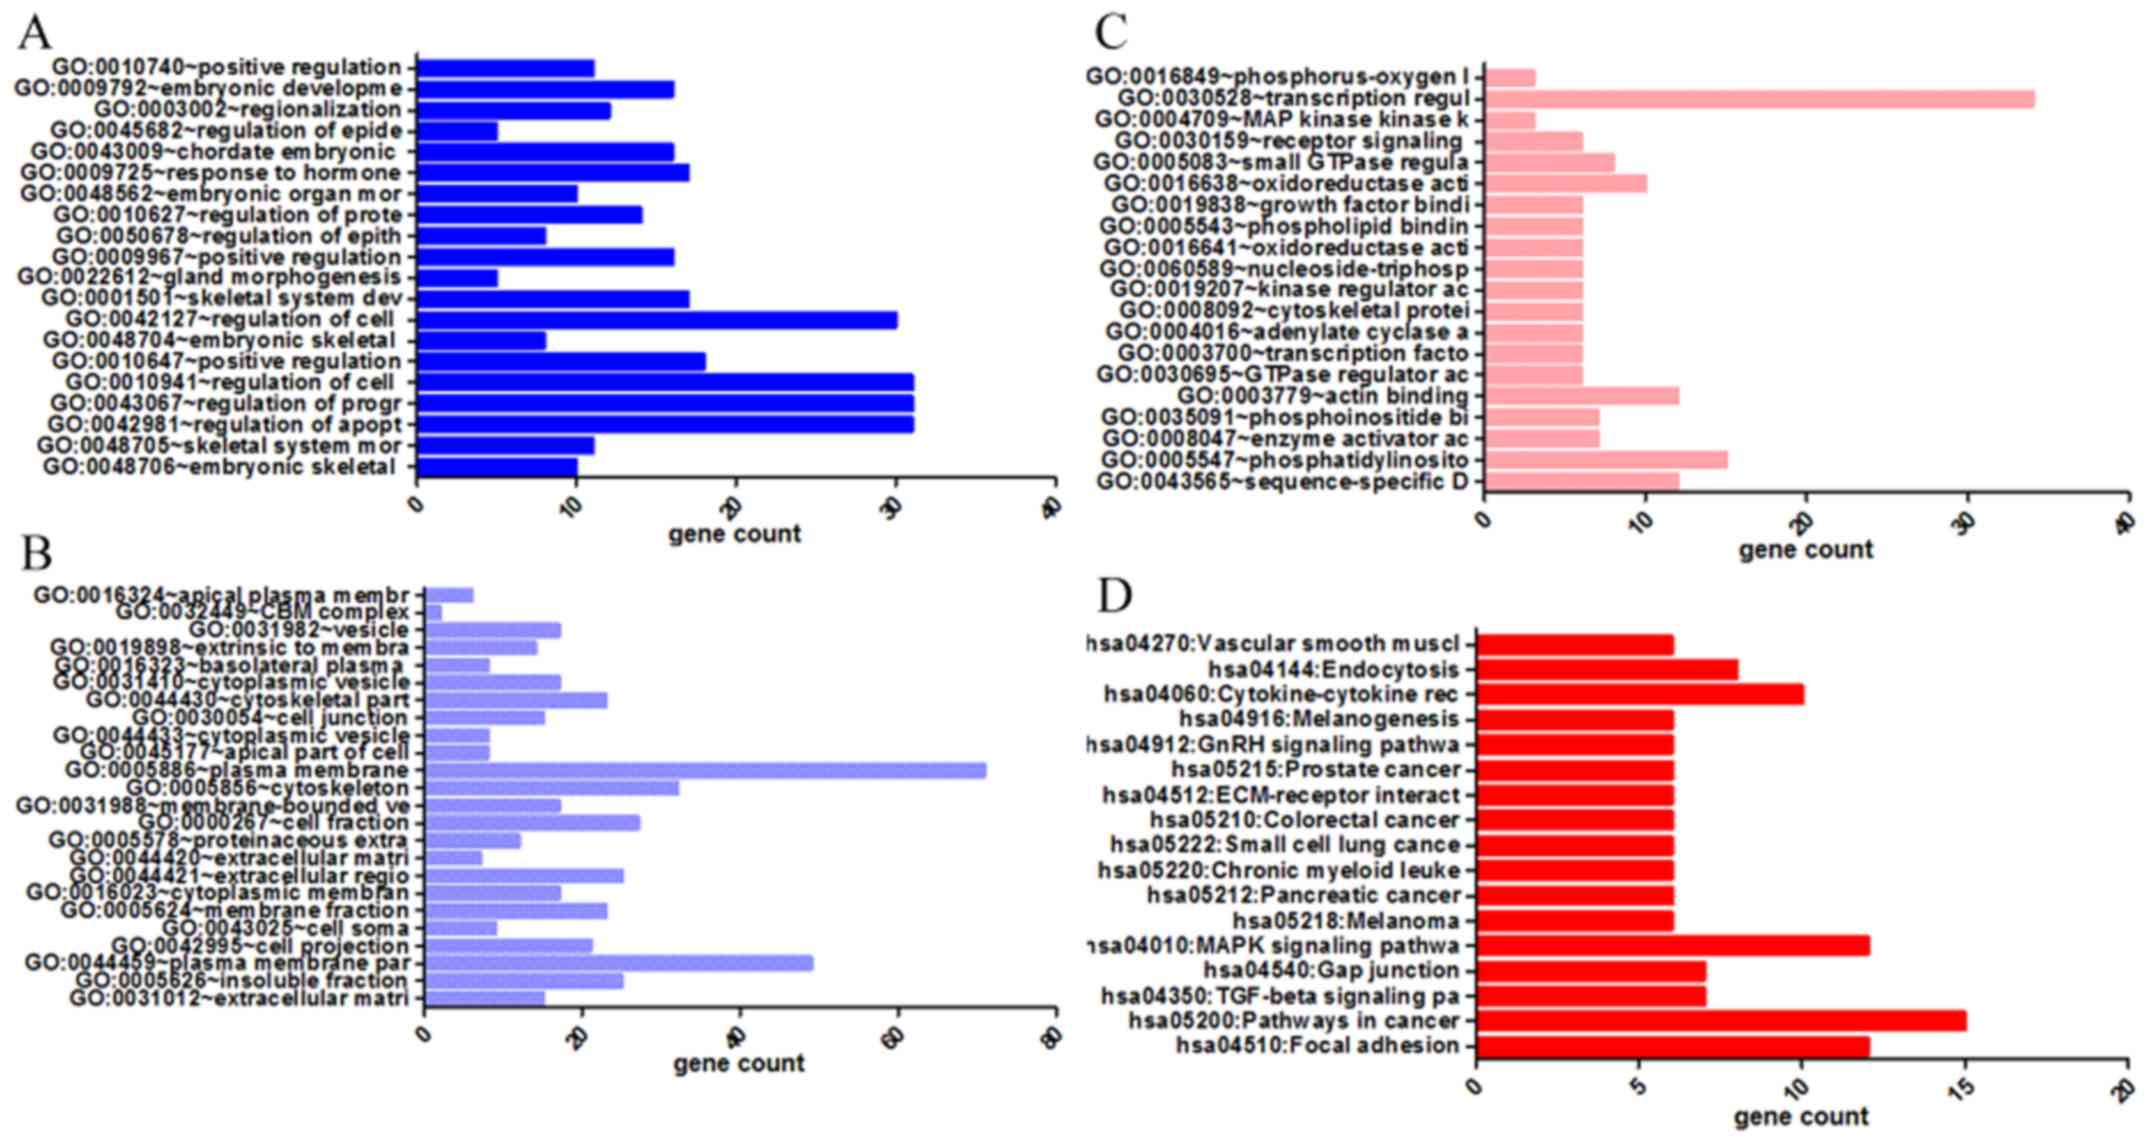
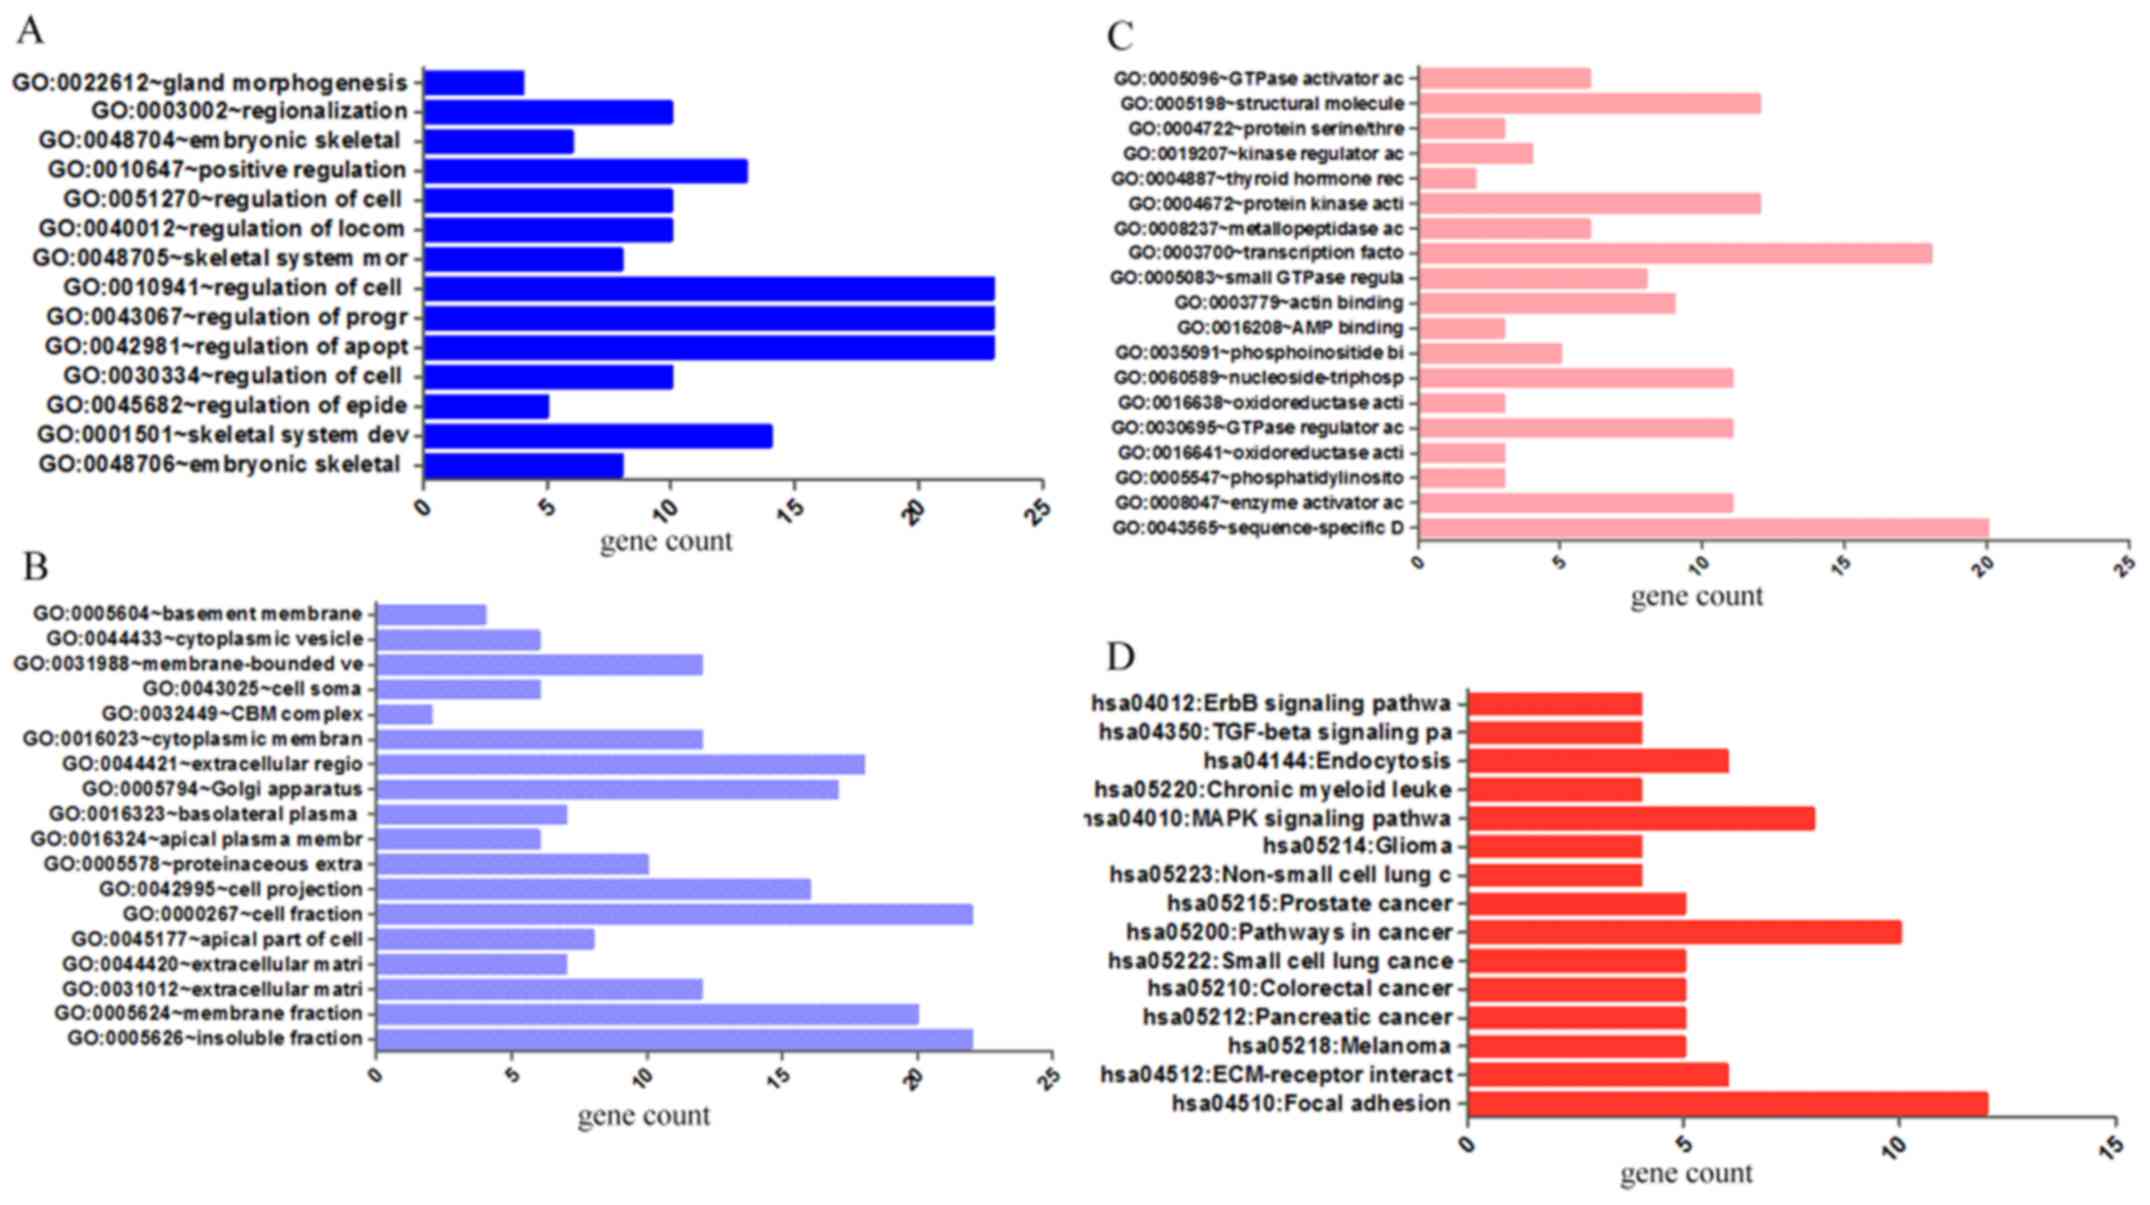
The results from GO analysis revealed that genes in the NSCLC group
mainly participated in biological processes, such as the regulation
of cell migration; the regulation of apoptosis; and the regulation
of programmed cell death; cellular components, such as insoluble
fraction, membrane fraction, and extracellular matrix; and
molecular functions, such as sequence-specific DNA binding, enzyme
activator activity, and phosphatidylinositol-3,4,5-tri-sphosphate
binding (Figs. 6 and 8A–C, and Table III). The results of KEGG pathway
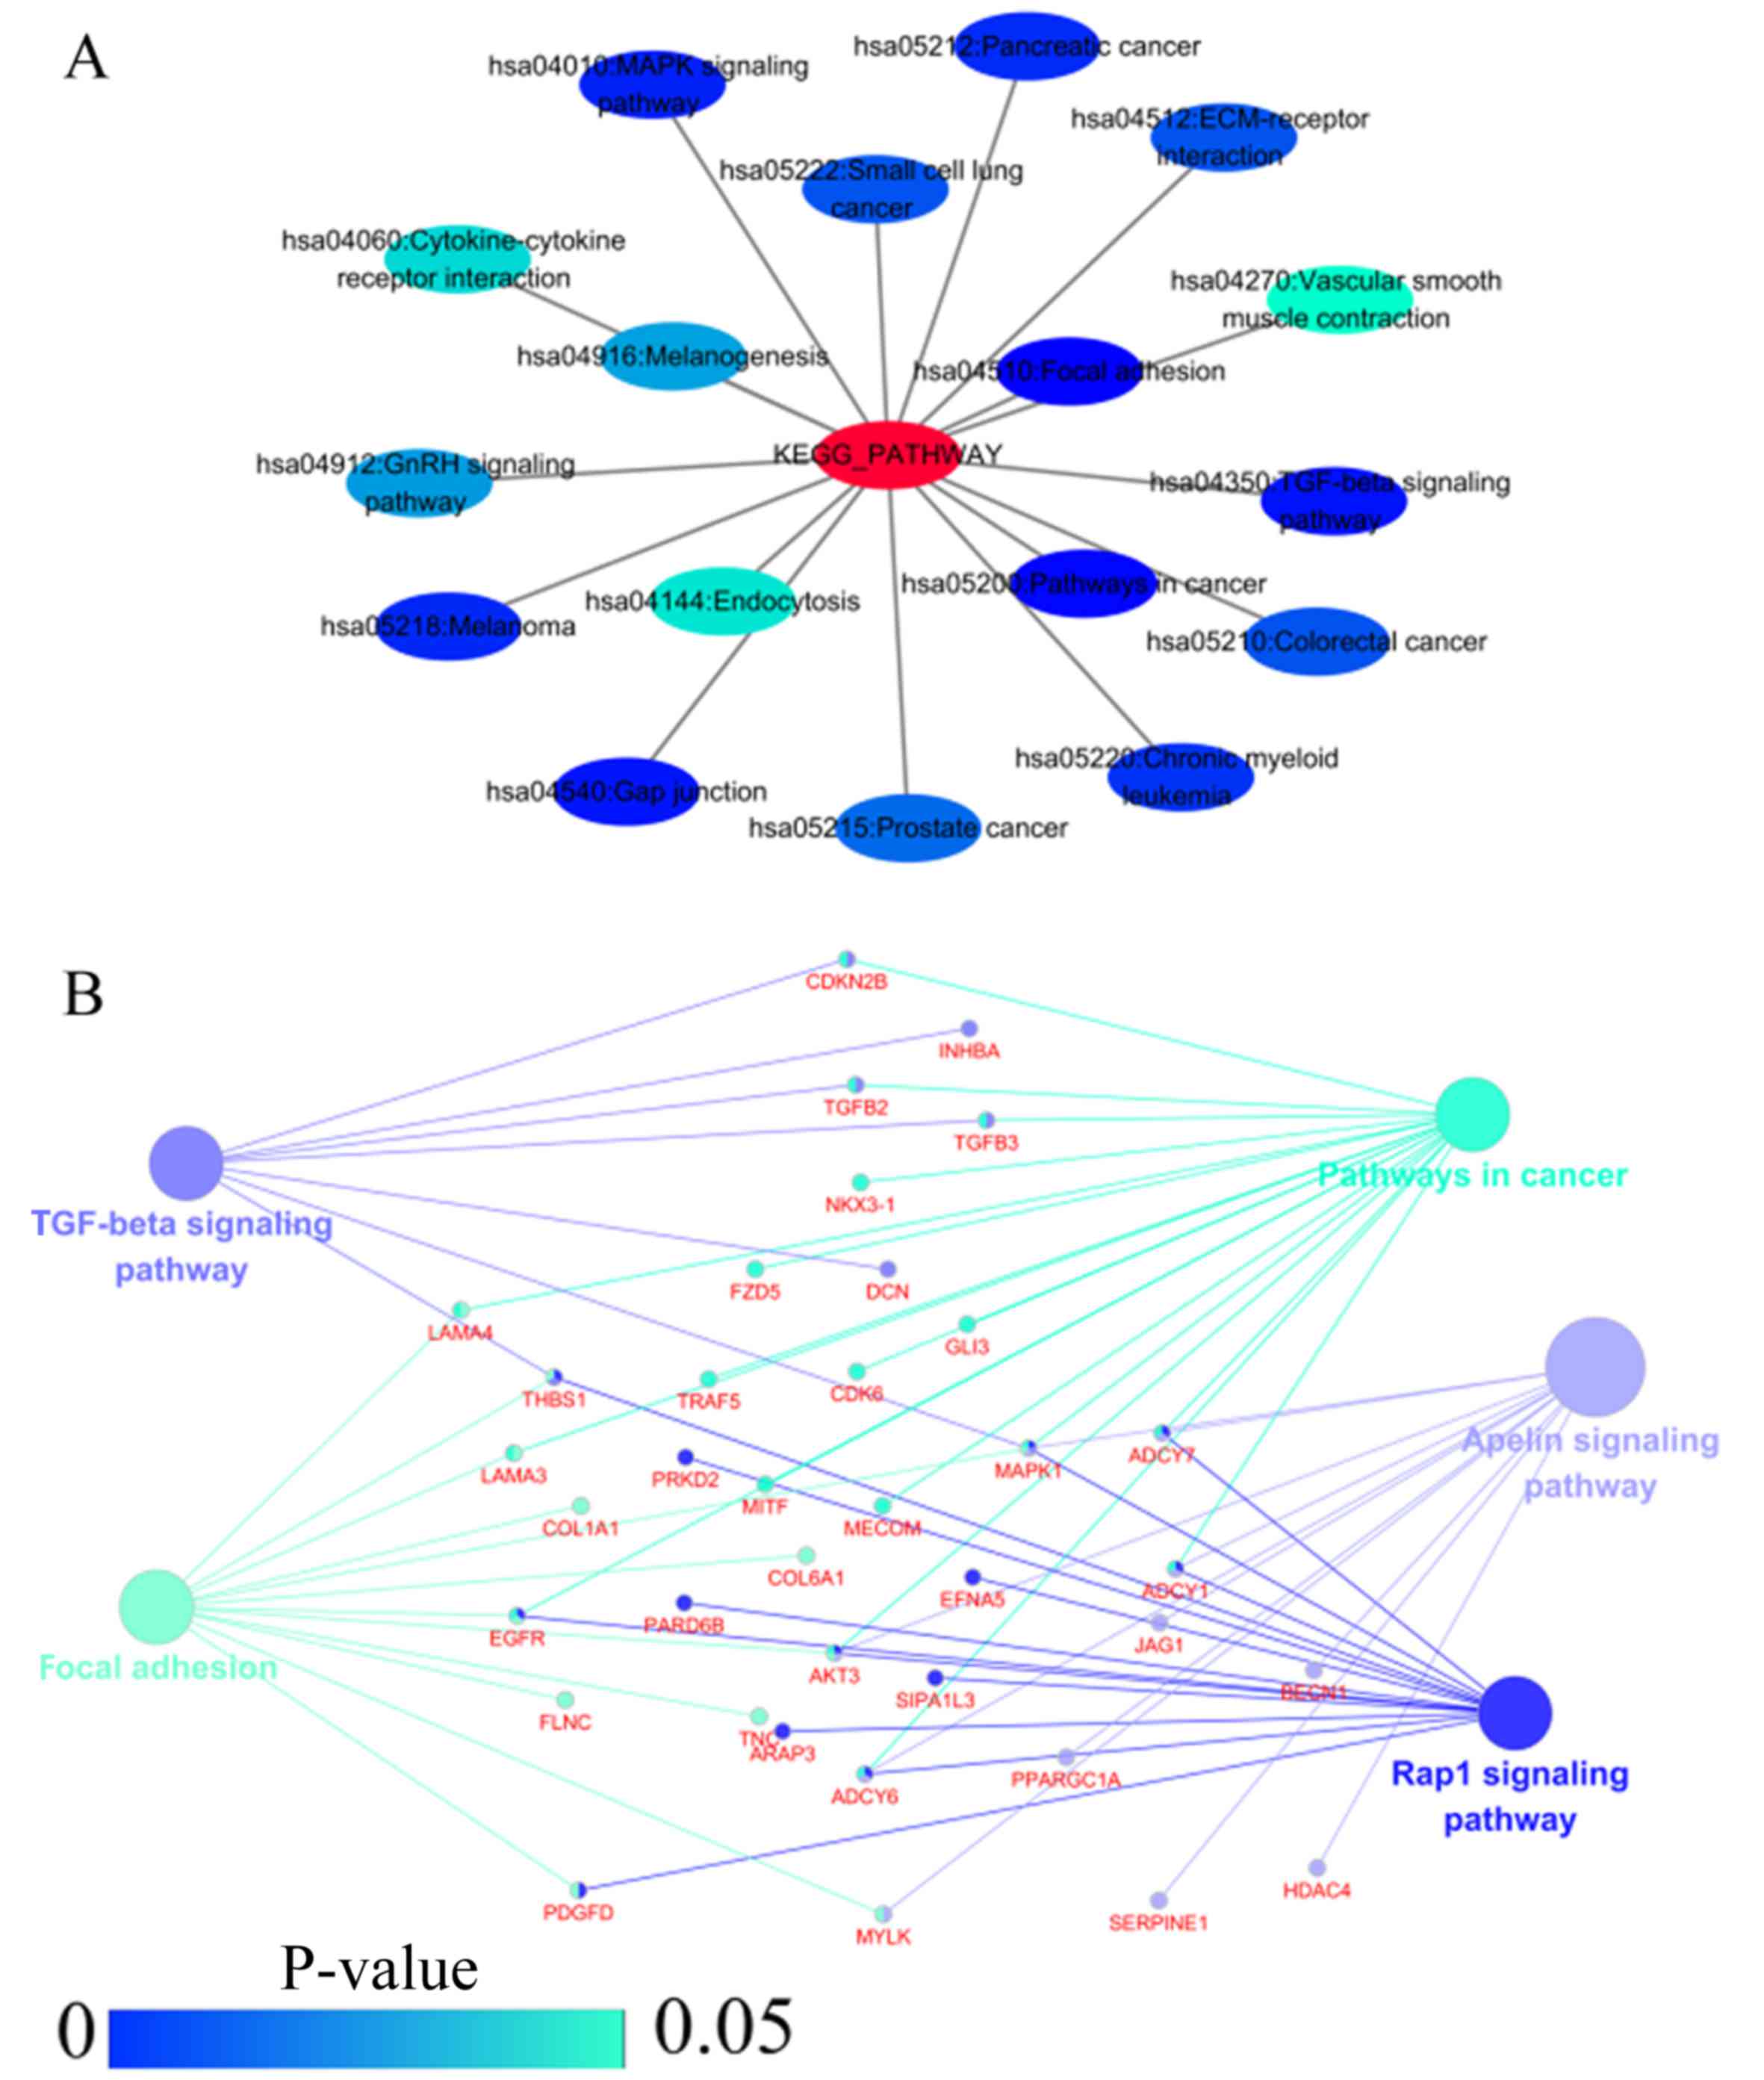
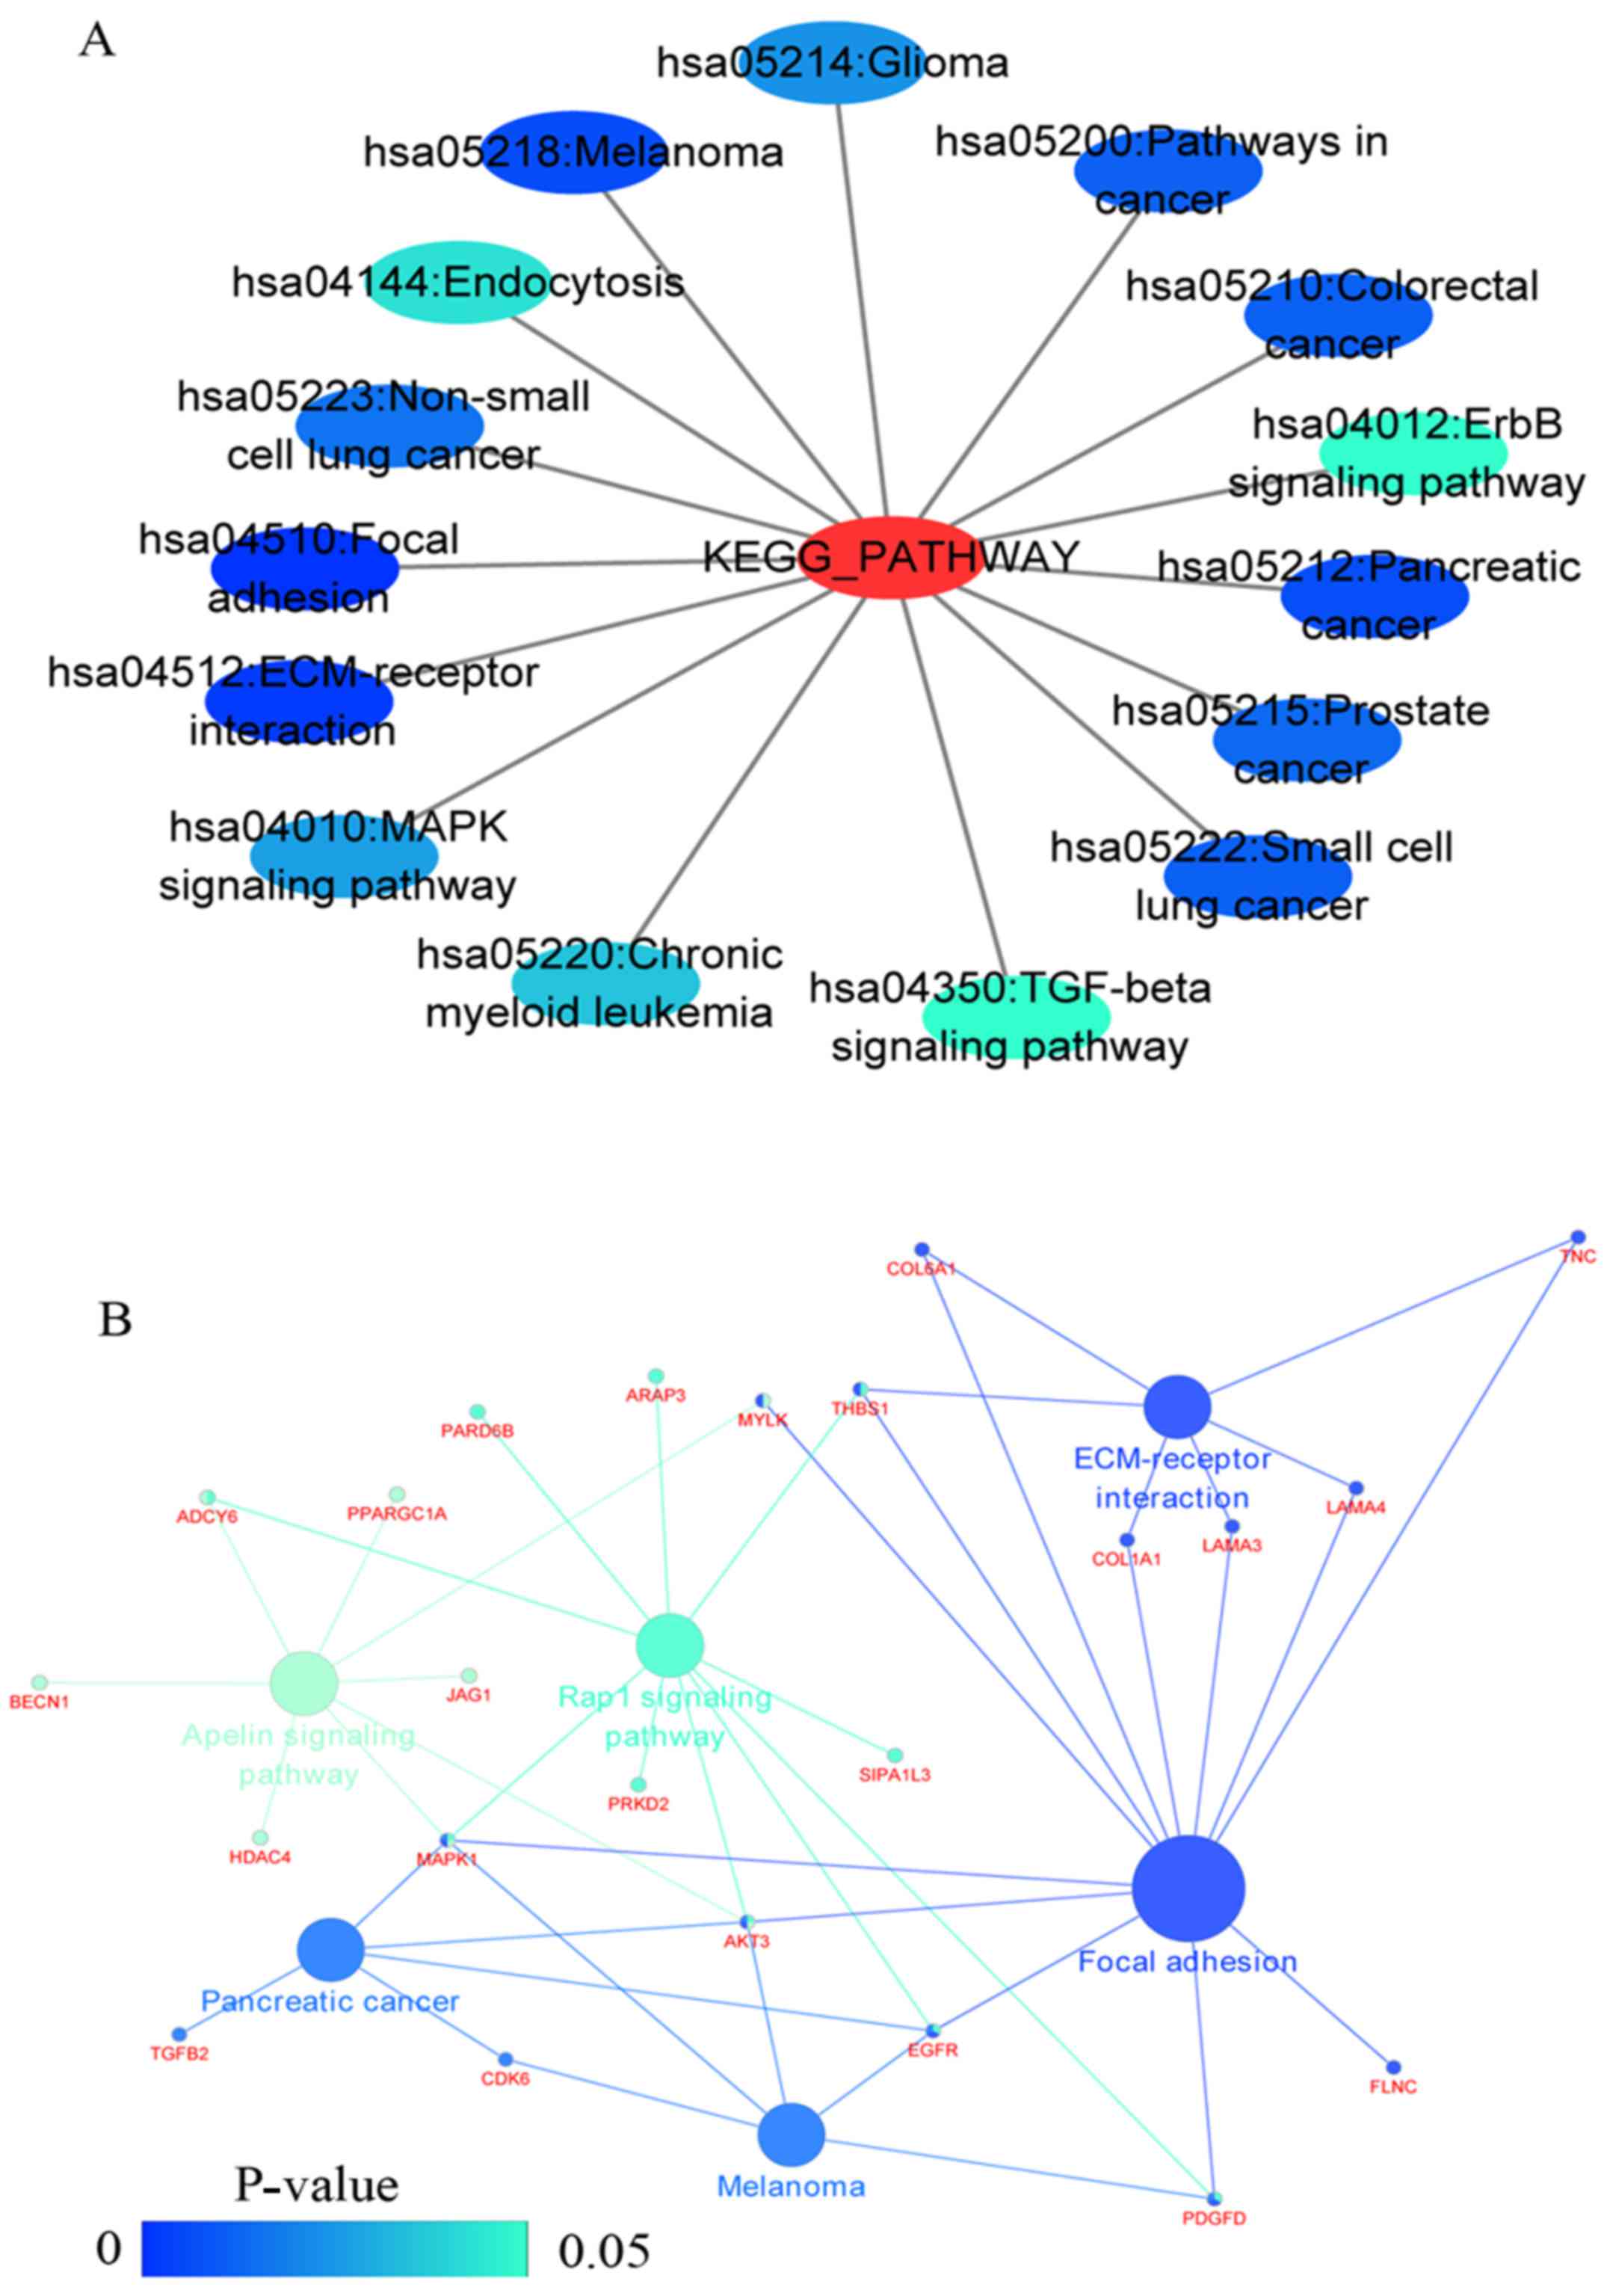
analyses suggested that HOXA3 may be involved in the
functional regulation of 22 signalling pathways in the NSCLC group.
The most important pathways were focal adhesion, pathways in
cancer, and the TGF-β signalling pathway (Figs. 7 and 8D, and Table IV). In addition, genes in the LUAD
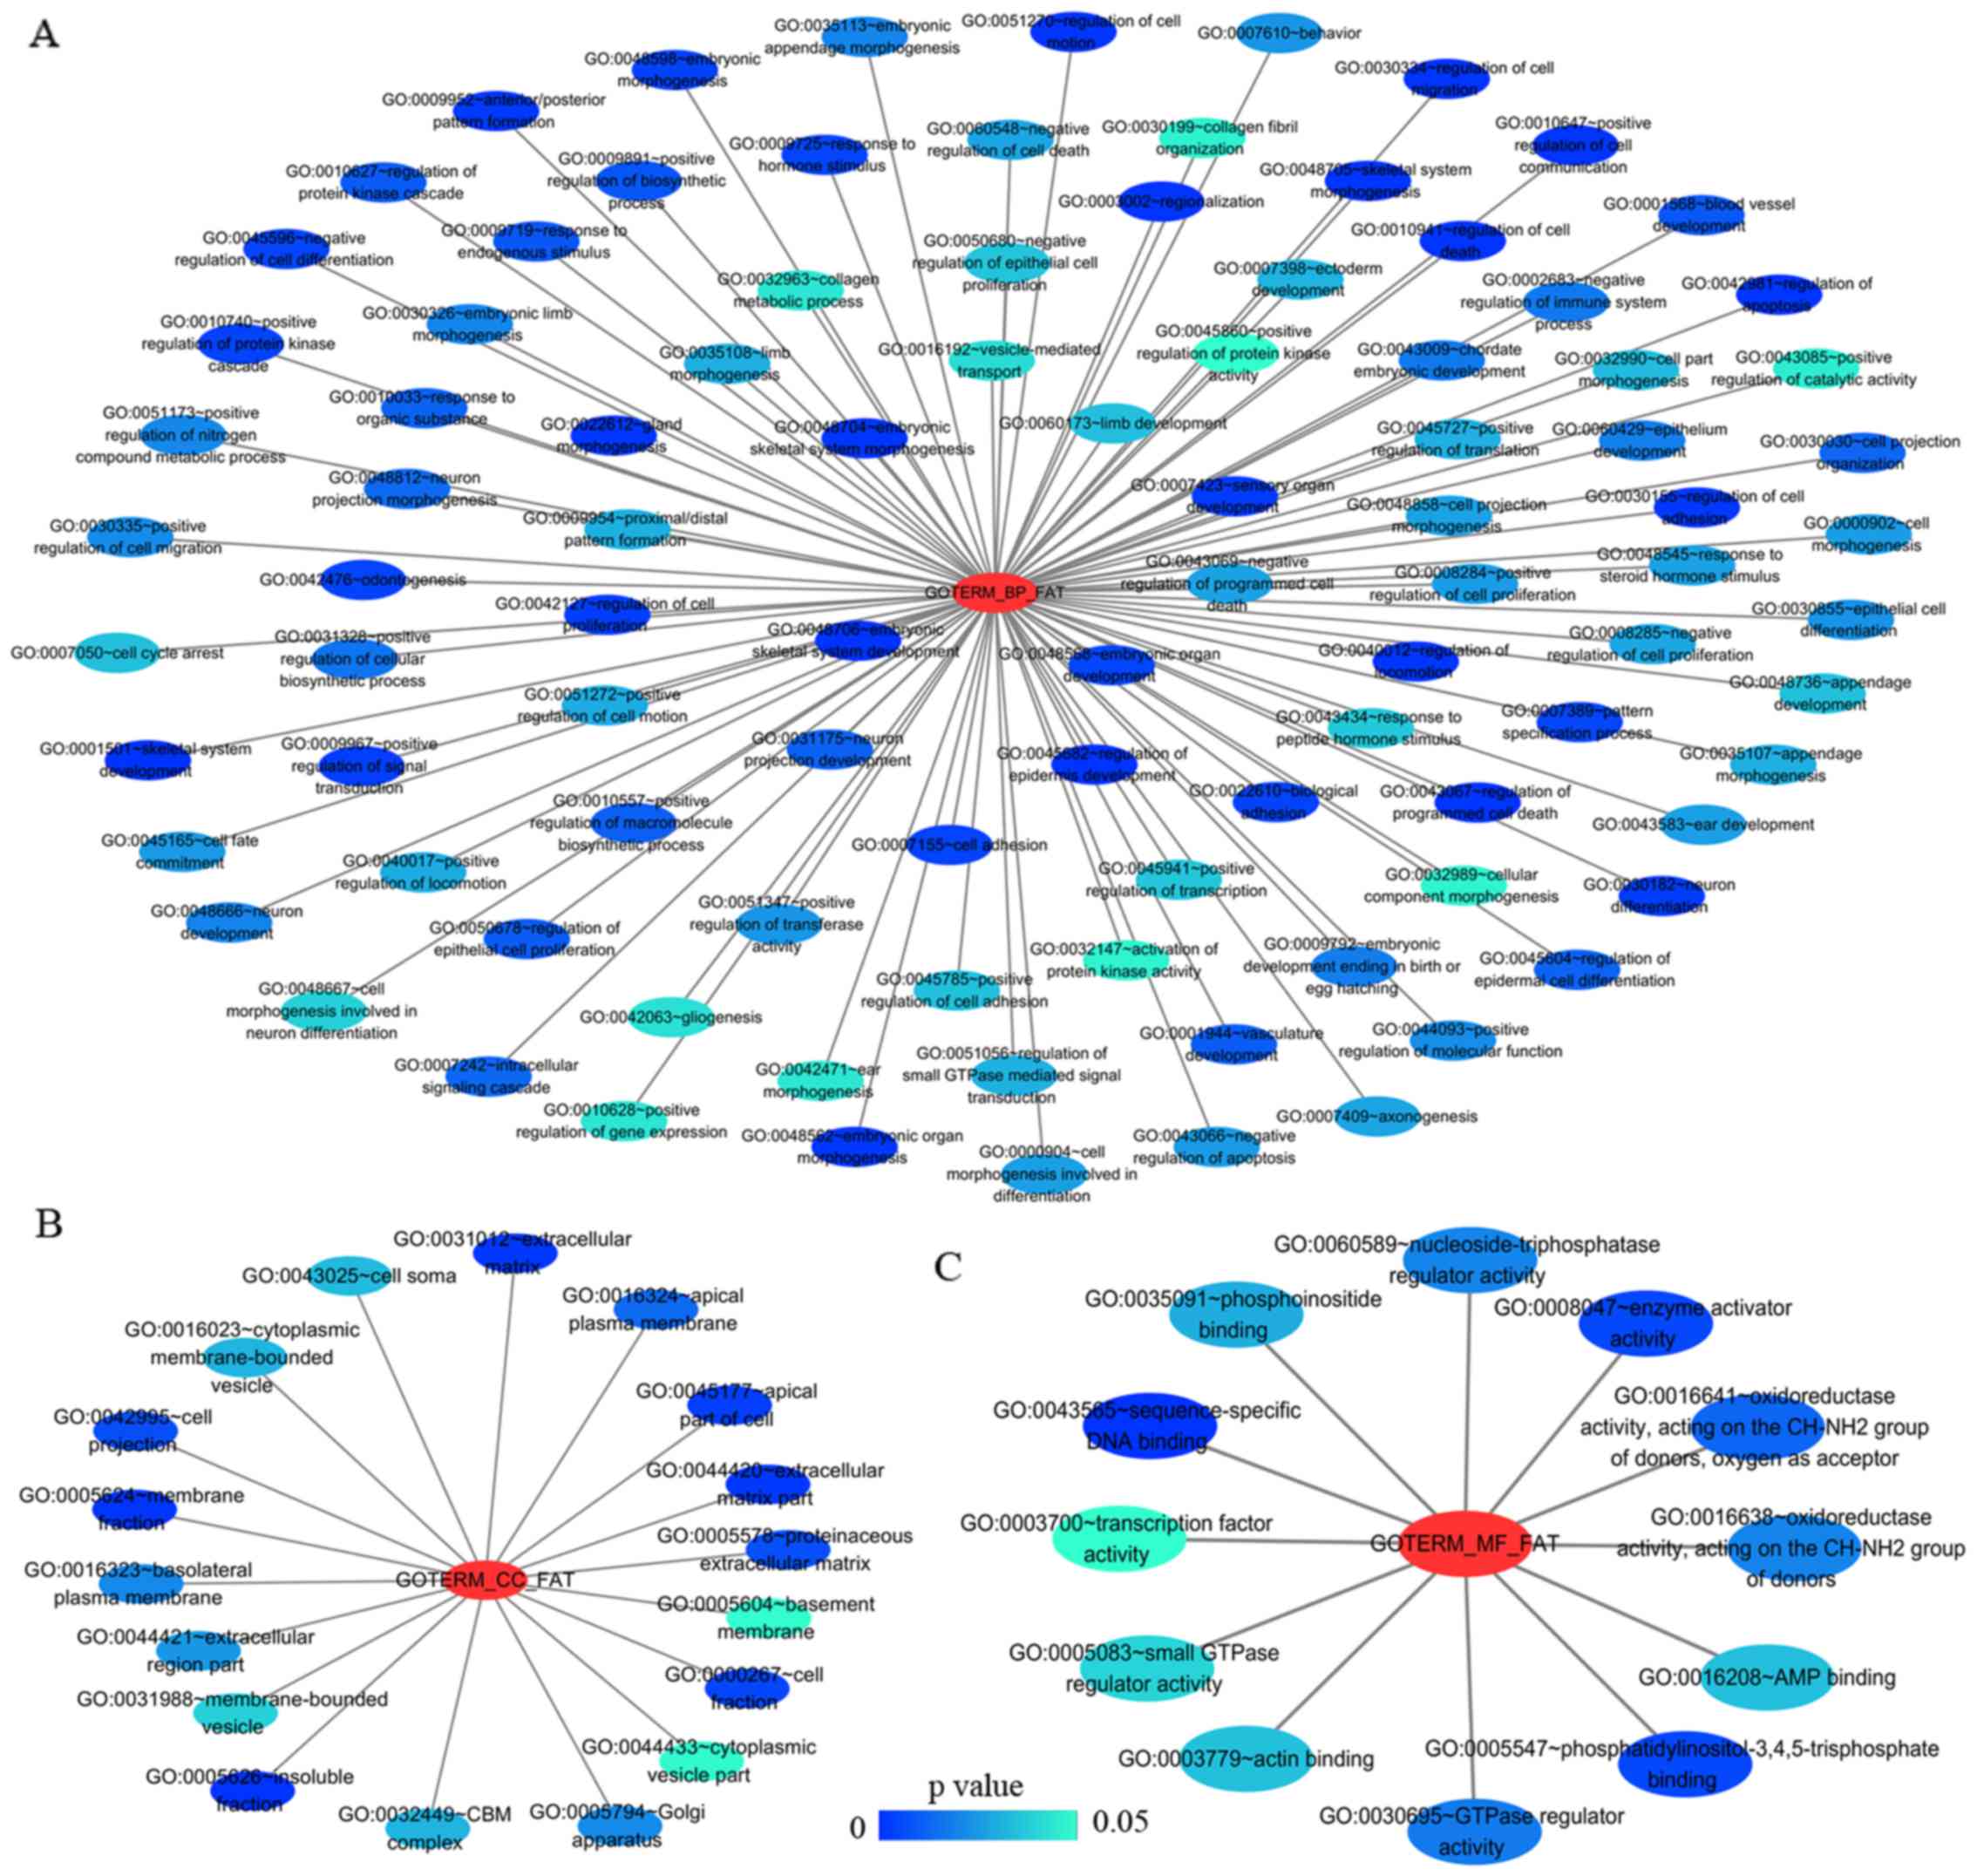
group mainly participated in biological processes, such as the
regulation of cell migration, regulation of apoptosis and the
regulation of programmed cell death. Significant enrichment also
occurred in cellular components and molecular functions; for
example, insoluble fraction and membrane fraction in cellular
components and sequence-specific DNA binding and enzyme activator
activity in molecular functions (Figs.
9 and 11A–C, and Table V). The analytical results in the
LUAD group suggested that HOXA3 may be involved in the
biological regulation of 15 signalling pathways. Of these pathways,
the most significant pathways were focal adhesion and ECM-receptor
interaction (Figs. 10 and
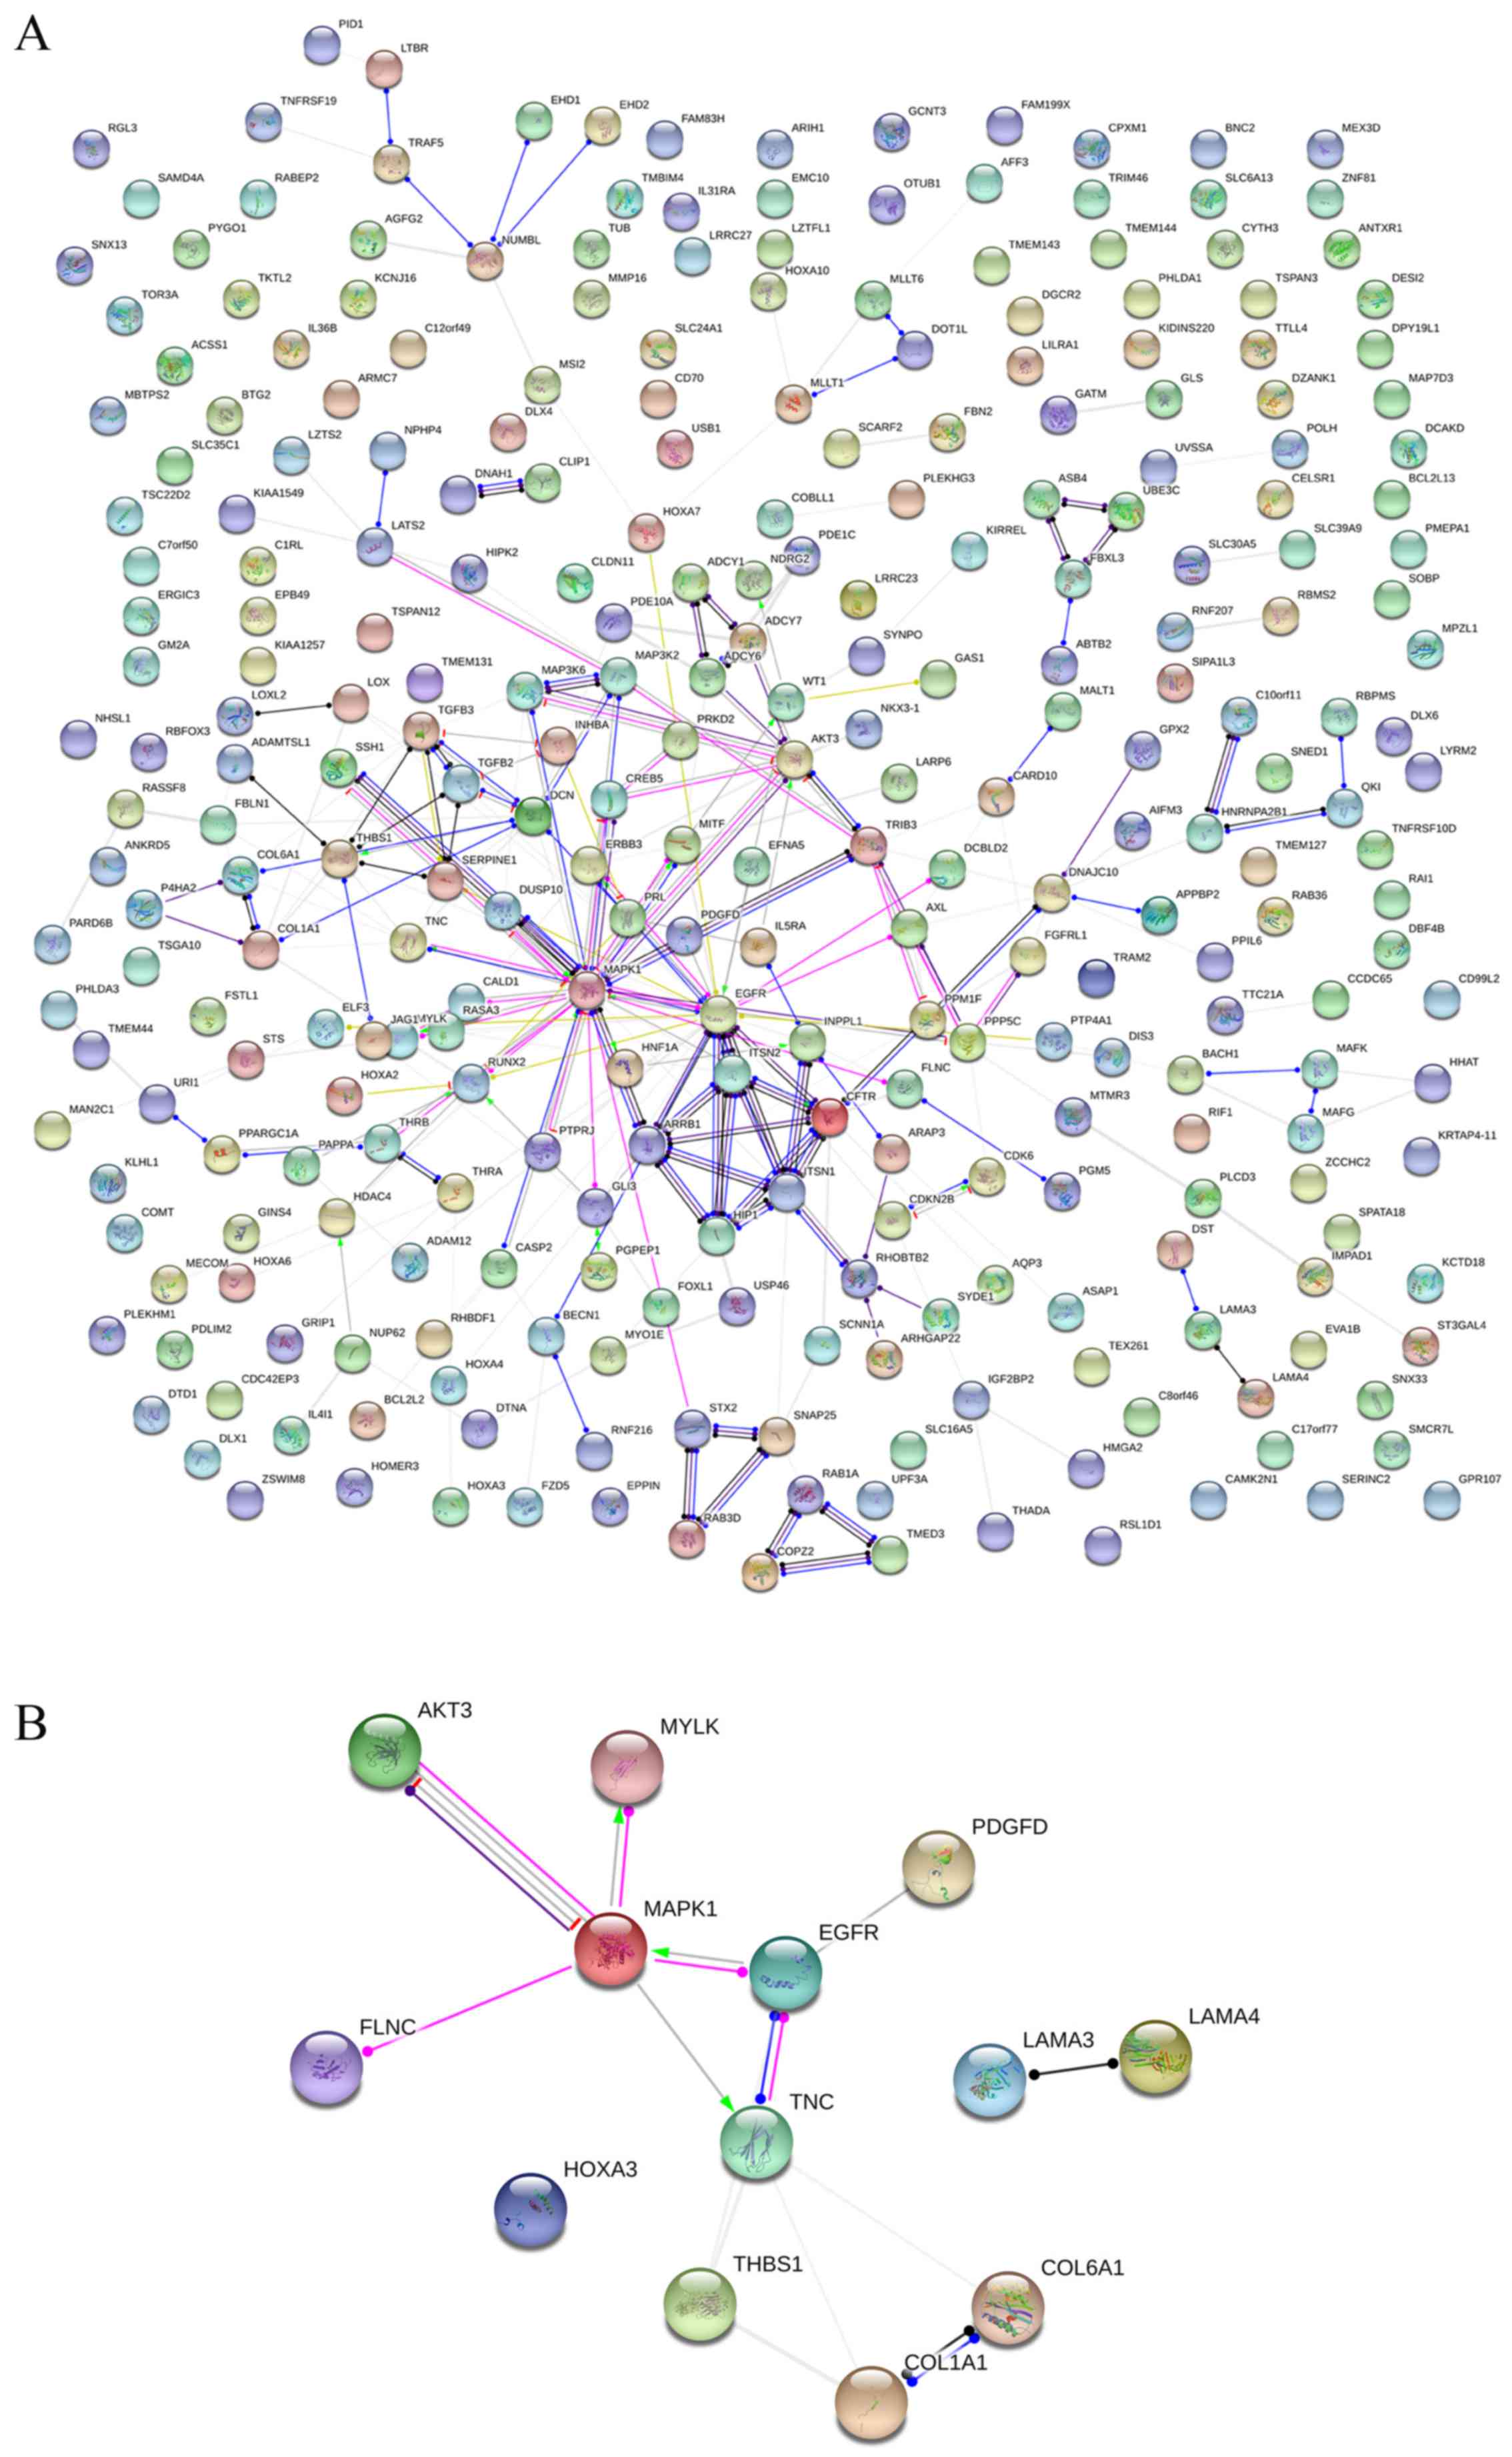
11D, and Table VI). In PPI analyses, 278
interaction nodes were obtained in the NSCLC group (Fig. 12A). The genes with the top 10
overall scores are presented in Table VII. The results of interaction
network analyses demonstrated that MAPK1, EGFR,
DCN and CFTR represented key genes in these networks.
In addition, genes enriched in 'Focal adhesion' were used for PPI
analyses, and a total of 13 interaction nodes were obtained
(Fig. 12B). The genes with the
top 10 overall score are presented in Table VIII. The results suggested that
MAPK1, EGFR, TNC and COL1A1 were key
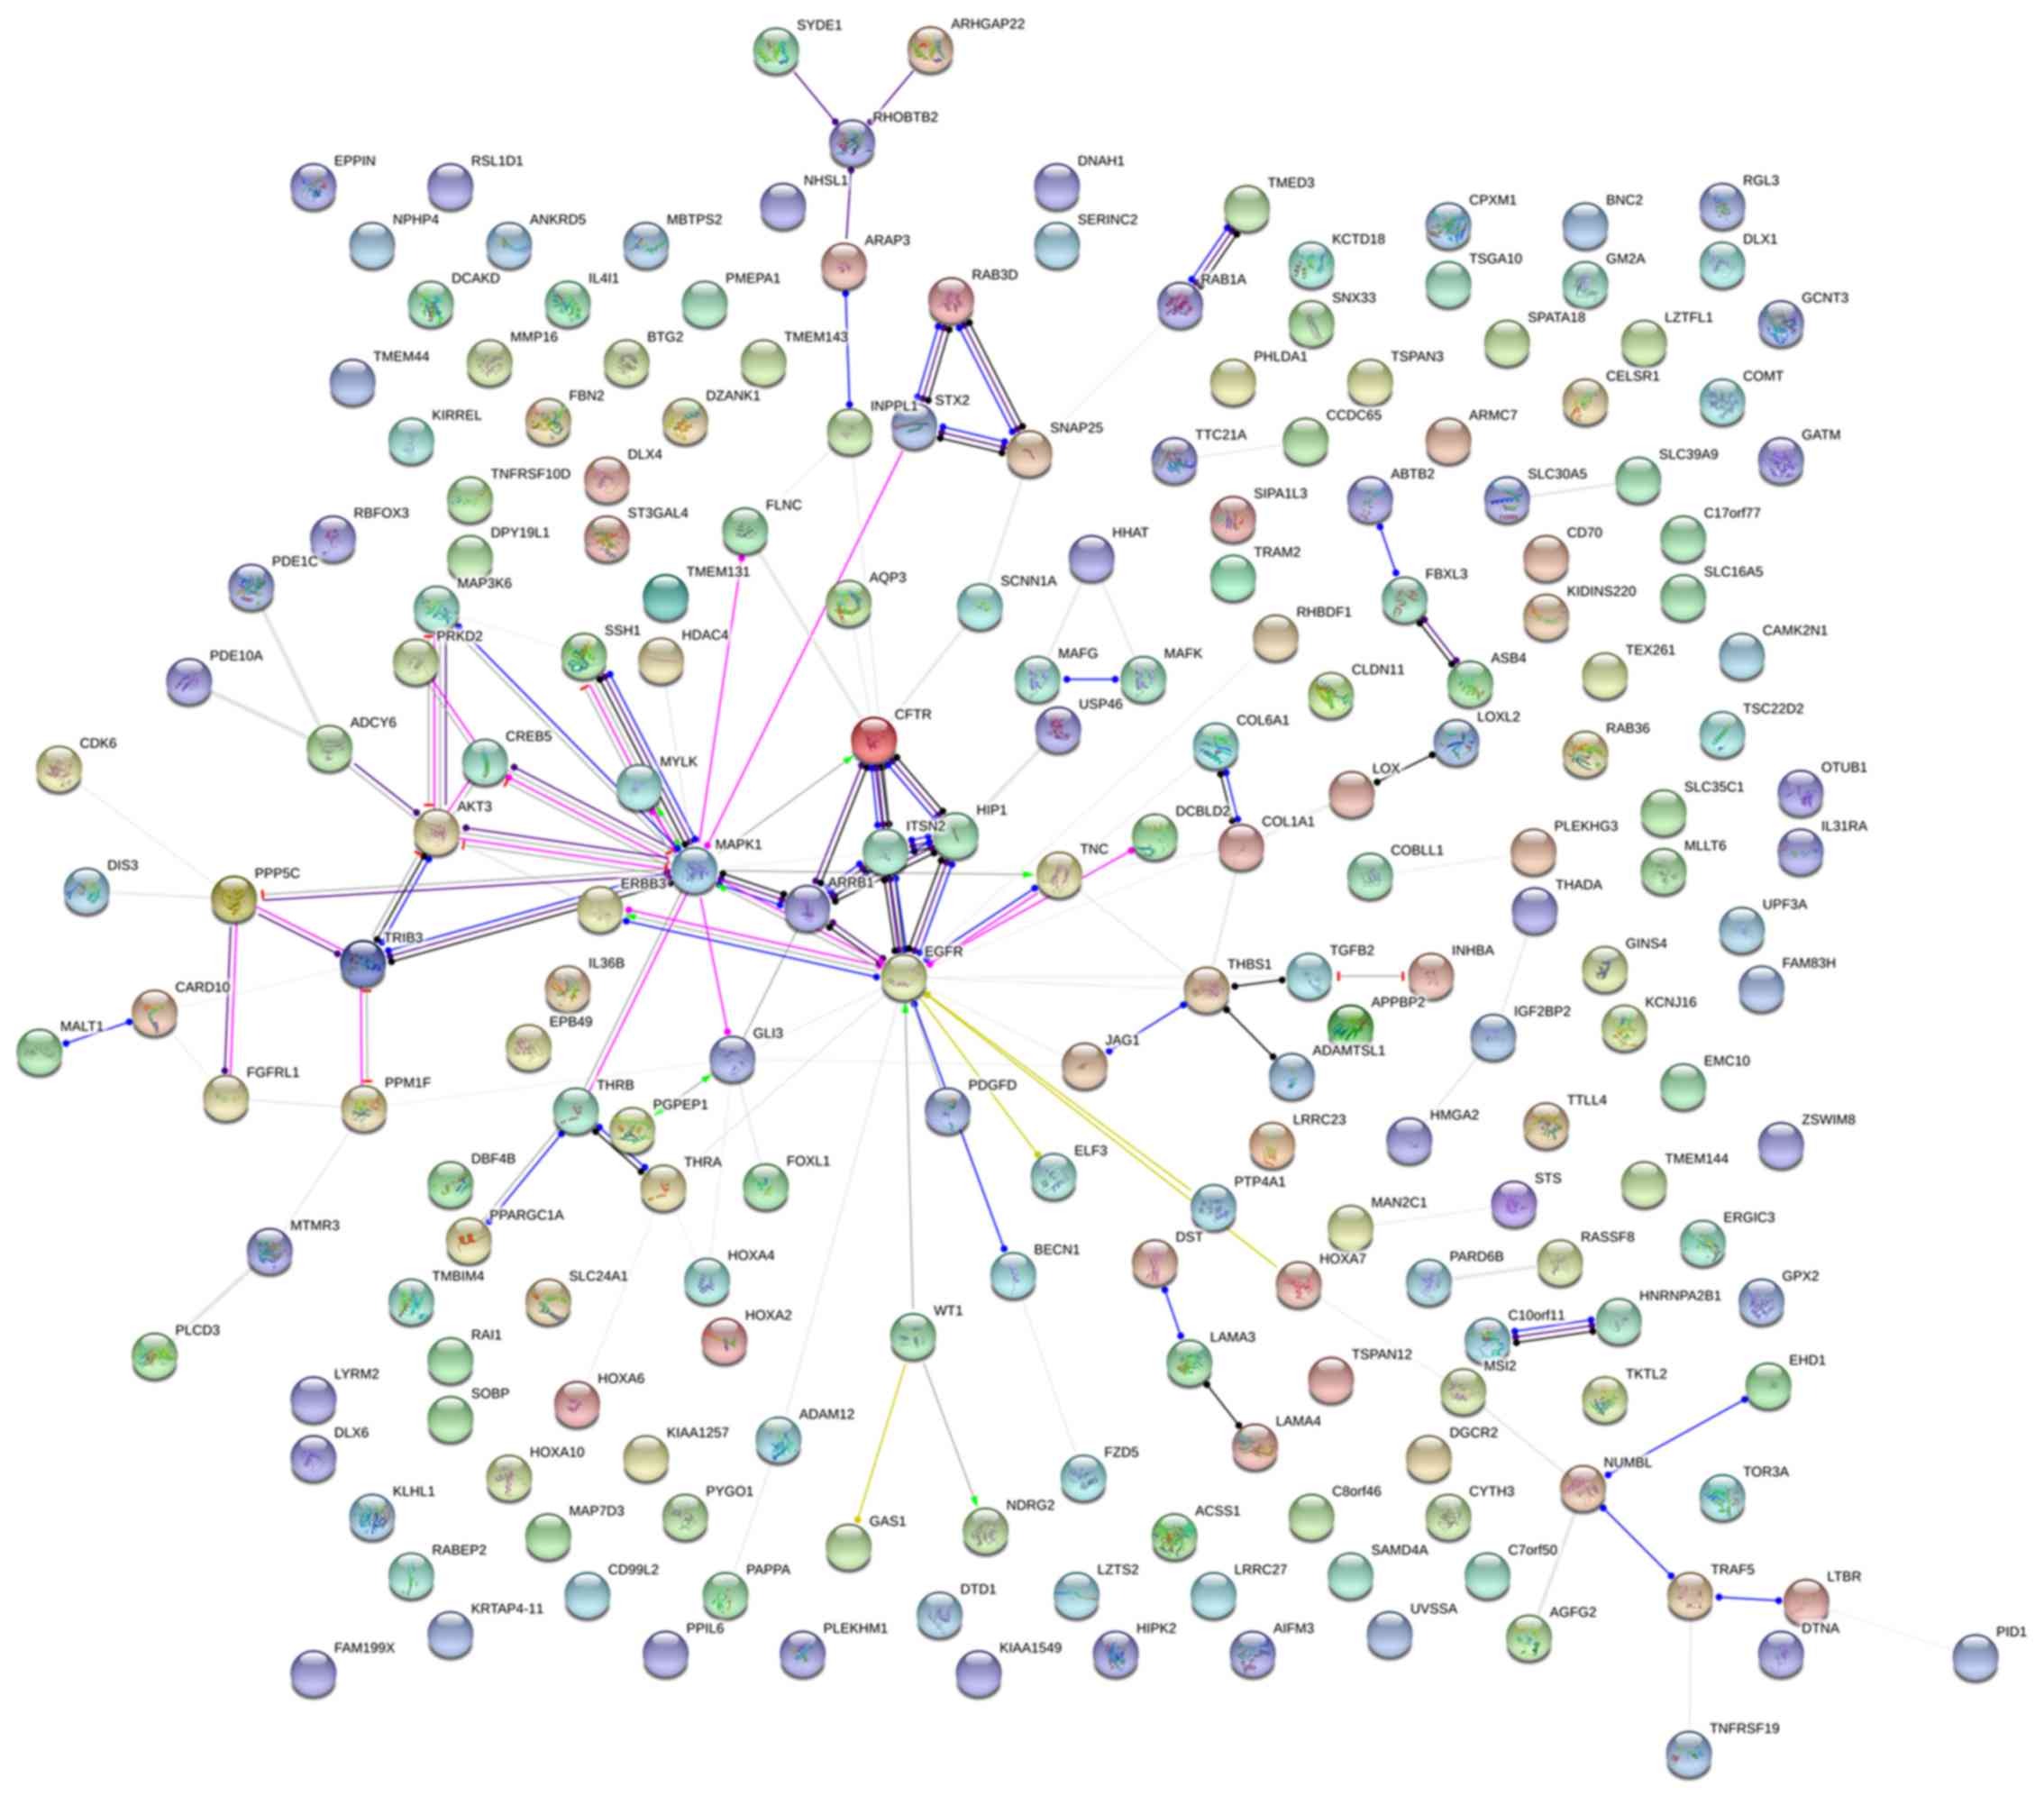
genes in this pathway. PPI analyses were also performed on genes in
the LUAD group, and the results generated 129 protein interaction
nodes (Fig. 13). The nodes with
the top 10 overall scores are presented in Table IX. The protein interaction network
suggested that MAPK1, EGFR, CFTR and
GLI3 were key nodes in these interaction networks. Genes in
the LUAD group that were enriched in 'Focal adhesion' were used for
PPI analyses, and 14 protein interaction network nodes were also
obtained. The result was the same as that for the NSCLC group.
MAPK1, EGFR, TNC and COLIA1 were key
genes in these pathways (refer to Fig. 12B and Table X). Analytic results revealed that
genes in the NSCLC and LUAD groups all participated in the
regulation of the 'Focal adhesion' pathway. MAPK1 and
EGFR played key roles in NSCLC and LUAD, whereas
MAPK1, EGFR, CFTR and GLI3 represented
key genes in the 'Focal adhesion' pathway. Therefore, these 4 genes
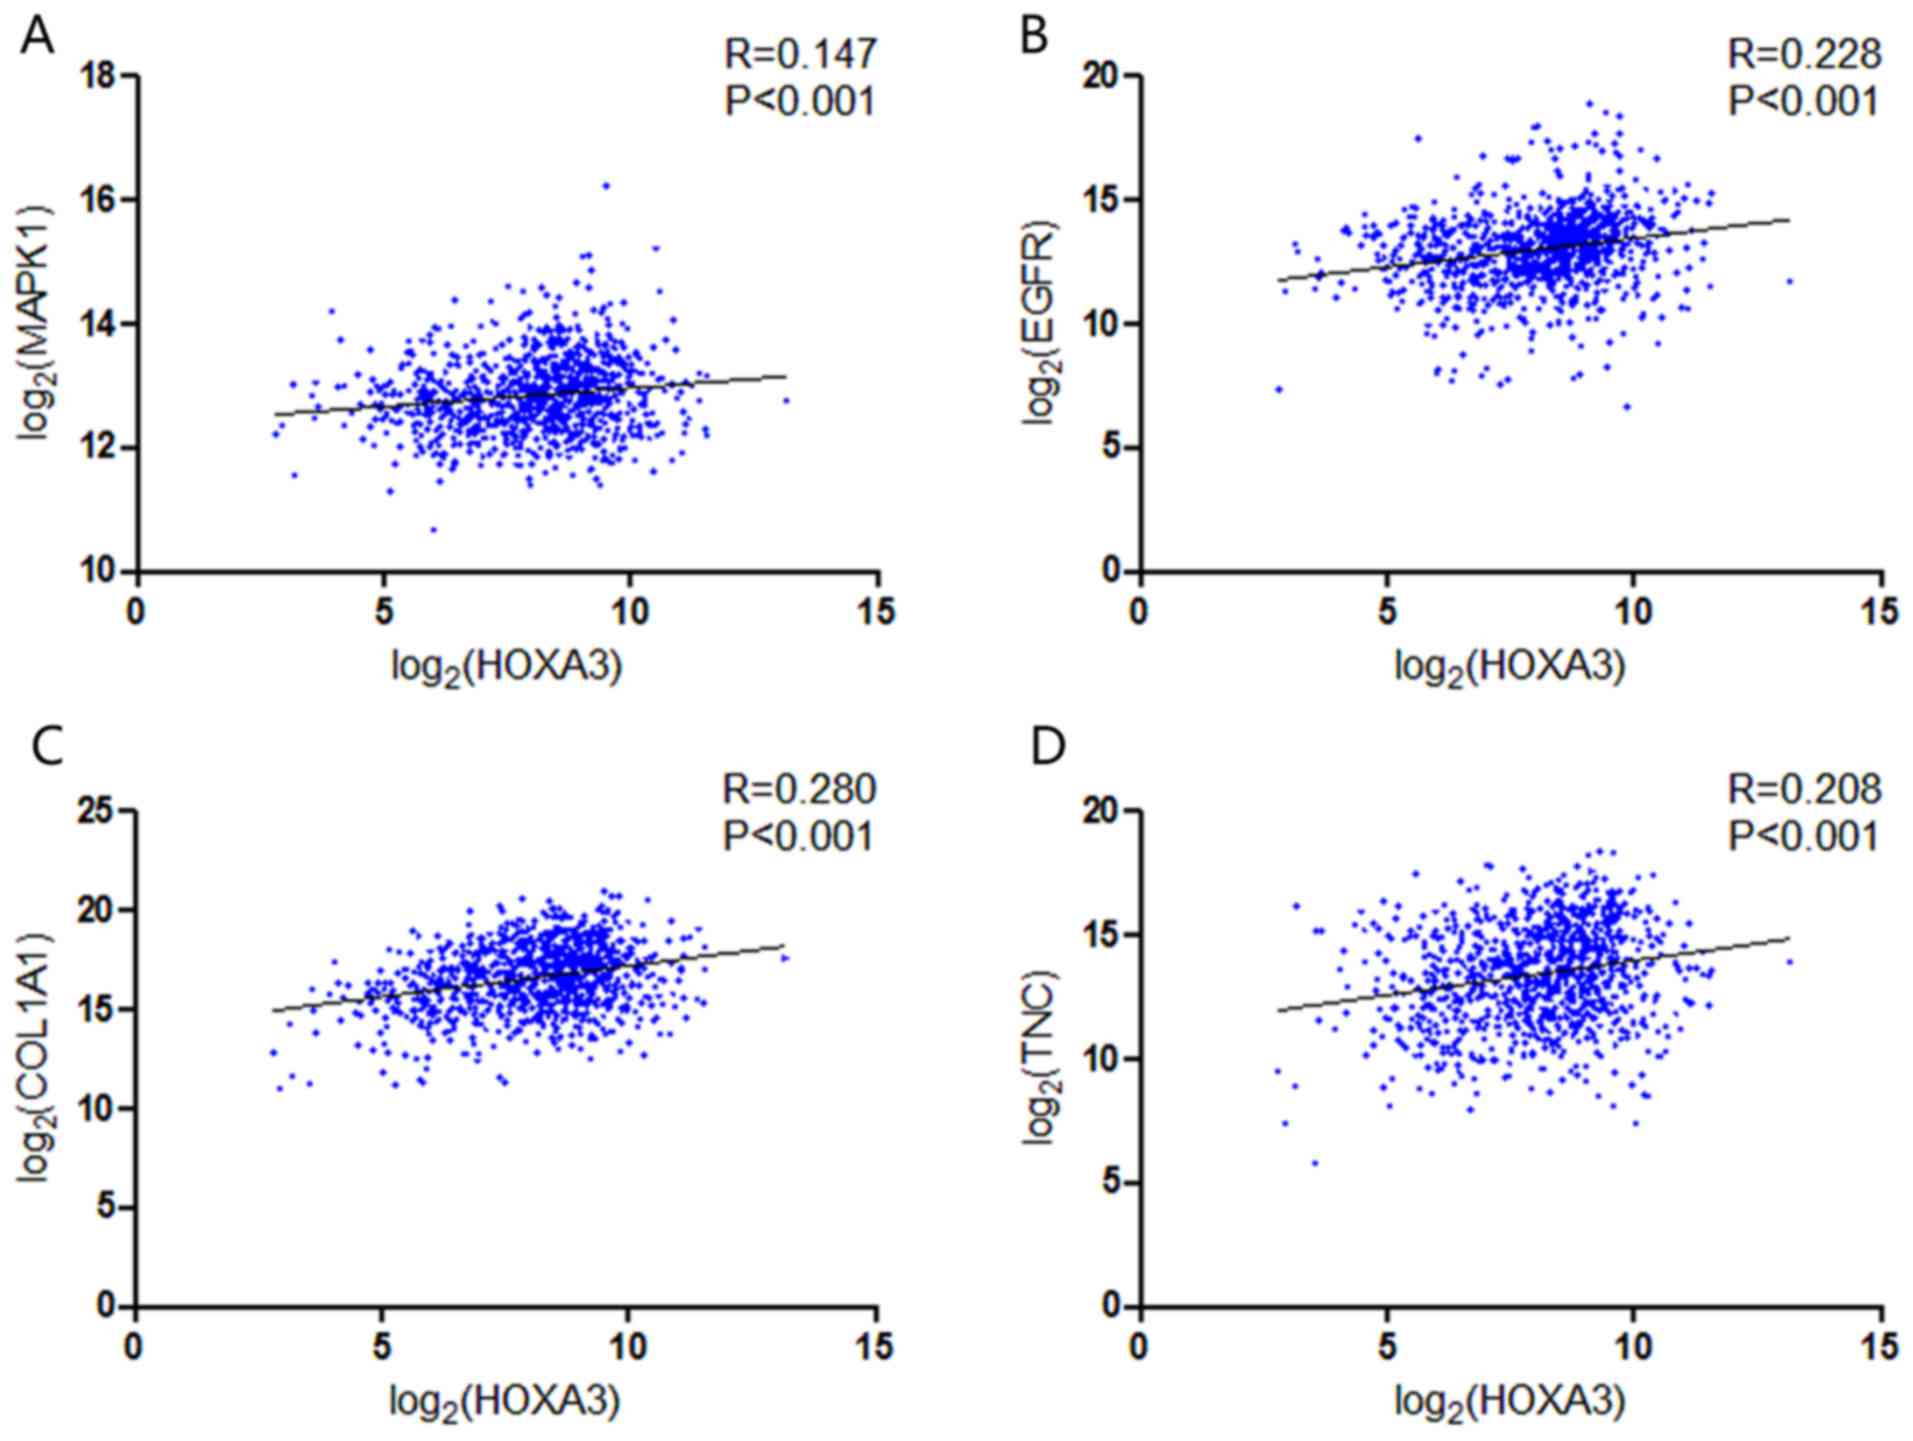
were analysed further. Based on TCGA data, the results of Pearson's
correlation analysis revealed that the 4 genes, EGFR,
MAPK1, COL1A1 and TNC, all exhibited a
potential positive correlation with HOXA3 expression in
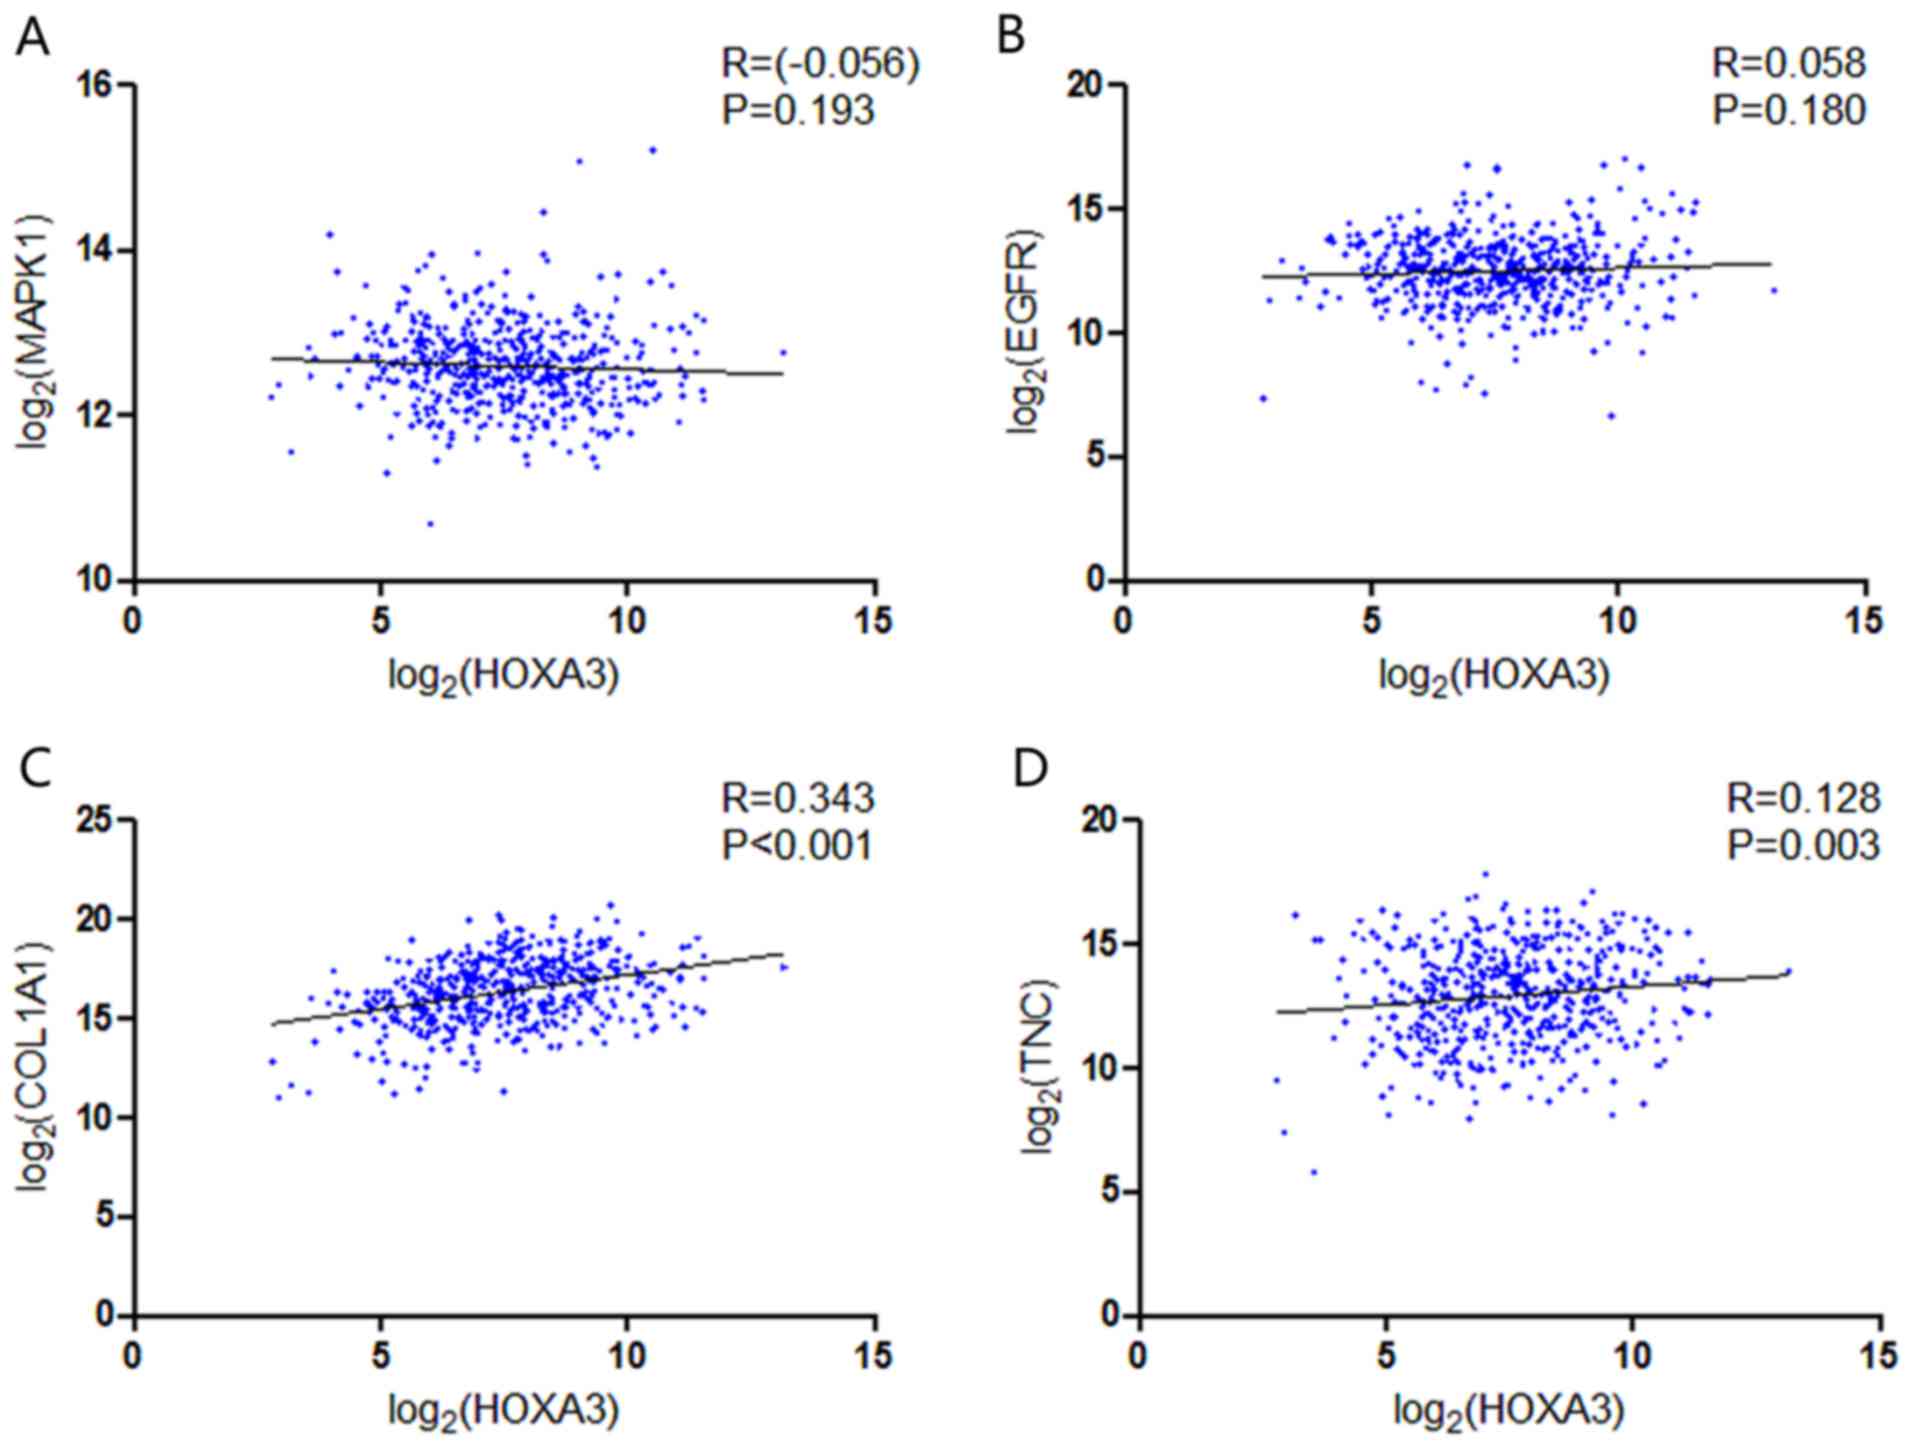
NSCLC (Fig. 14). In the LUAD
group, only COL1A1 and TNC exhibited a possible
positive correlation with HOXA3 (Fig. 15C and D).
| Table IIIThe top ten most significant items of
Gene Ontology (GO) terms of the co-expression genes of homeobox A3
(HOXA3) in non-small cell lung cancer. |
Table III
The top ten most significant items of
Gene Ontology (GO) terms of the co-expression genes of homeobox A3
(HOXA3) in non-small cell lung cancer.
| Category | Term | Count | P-value | FDR |
|---|
| Biological
processes | | | | |
| GOTERM_BP_FAT |
GO:0048706~embryonic skeletal system
development | 8 | 3.41E-05 | 0.06 |
| GOTERM_BP_FAT | GO:0001501~skeletal
system development | 14 | 1.07E-04 | 0.18 |
| GOTERM_BP_FAT |
GO:0045682~regulation of epidermis
development | 5 | 1.17E-04 | 0.19 |
| GOTERM_BP_FAT |
GO:0030334~regulation of cell
migration | 10 | 1.80E-04 | 0.30 |
| GOTERM_BP_FAT |
GO:0042981~regulation of apoptosis | 23 | 1.97E-04 | 0.33 |
| GOTERM_BP_FAT |
GO:0043067~regulation of programmed cell
death | 23 | 2.27E-04 | 0.38 |
| GOTERM_BP_FAT |
GO:0010941~regulation of cell death | 23 | 2.39E-04 | 0.40 |
| GOTERM_BP_FAT | GO:0048705~skeletal
system morphogenesis | 8 | 3.64E-04 | 0.60 |
| GOTERM_BP_FAT |
GO:0040012~regulation of locomotion | 10 | 4.64E-04 | 0.77 |
| GOTERM_BP_FAT |
GO:0051270~regulation of cell motion | 10 | 4.81E-04 | 0.80 |
| Cellular
components | | | | |
| GOTERM_CC_FAT |
GO:0005626~insoluble fraction | 22 | 0.000184 | 0.24 |
| GOTERM_CC_FAT | GO:0005624~membrane
fraction | 20 | 0.000837 | 1.07 |
| GOTERM_CC_FAT |
GO:0031012~extracellular matrix | 12 | 0.001071 | 1.37 |
| GOTERM_CC_FAT |
GO:0044420~extracellular matrix part | 7 | 0.001490 | 1.90 |
| GOTERM_CC_FAT | GO:0045177~apical
part of cell | 8 | 0.002892 | 3.66 |
| GOTERM_CC_FAT | GO:0000267~cell
fraction | 22 | 0.004675 | 5.86 |
| GOTERM_CC_FAT | GO:0042995~cell
projection | 16 | 0.006747 | 8.35 |
| GOTERM_CC_FAT |
GO:0005578~proteinaceous extracellular
matrix | 10 | 0.006859 | 8.48 |
| GOTERM_CC_FAT | GO:0016324~apical
plasma membrane | 6 | 0.013372 | 15.92 |
| GOTERM_CC_FAT |
GO:0016323~basolateral plasma
membrane | 7 | 0.020688 | 23.61 |
| Molecular
functional | | | | |
| GOTERM_MF_FAT |
GO:0043565~sequence-specific DNA
binding | 20 | 0.000041 | 0.06 |
| GOTERM_MF_FAT | GO:0008047~enzyme
activator activity | 11 | 0.004149 | 5.55 |
| GOTERM_MF_FAT |
GO:0005547~phosphatidylinositol-3,4,5-trisphosphate
binding | 3 | 0.004179 | 5.59 |
| GOTERM_MF_FAT |
GO:0016641~oxidoreductase activity, acting
on the CH-NH2 group of donors, oxygen as acceptor | 3 | 0.010187 | 13.11 |
| GOTERM_MF_FAT | GO:0030695~GTPase
regulator activity | 11 | 0.014540 | 18.21 |
| GOTERM_MF_FAT |
GO:0016638~oxidoreductase activity, acting
on the CH-NH2 group of donors | 3 | 0.016640 | 20.58 |
| GOTERM_MF_FAT |
GO:0060589~nucleoside-triphosphatase
regulator activity | 11 | 0.016712 | 20.66 |
| GOTERM_MF_FAT |
GO:0035091~phosphoinositide binding | 5 | 0.025094 | 29.45 |
| GOTERM_MF_FAT | GO:0016208~AMP
binding | 3 | 0.028747 | 33.00 |
| GOTERM_MF_FAT | GO:0003779~actin
binding | 9 | 0.028844 | 33.09 |
| Table IVKEGG pathways enriched by
co-expression genes of homeobox A3 (HOXA3) mRNA in non-small cell
lung cancer. |
Table IV
KEGG pathways enriched by
co-expression genes of homeobox A3 (HOXA3) mRNA in non-small cell
lung cancer.
| Category | Term | Count | P-value | FDR |
|---|
| KEGG_PATHWAY | hsa04510:Focal
adhesion | 12 | 0.001 | 0.76 |
| KEGG_PATHWAY | hsa05200:Pathways
in cancer | 15 | 0.001 | 1.67 |
| KEGG_PATHWAY | hsa04350:TGF-beta
signaling pathway | 7 | 0.004 | 4.34 |
| KEGG_PATHWAY | hsa04540:Gap
junction | 7 | 0.004 | 4.84 |
| KEGG_PATHWAY | hsa04010:MAPK
signaling pathway | 12 | 0.006 | 7.01 |
| KEGG_PATHWAY |
hsa05218:Melanoma | 6 | 0.008 | 8.33 |
| KEGG_PATHWAY | hsa05212:Pancreatic
cancer | 6 | 0.008 | 8.81 |
| KEGG_PATHWAY | hsa05220:Chronic
myeloid leukemia | 6 | 0.010 | 10.36 |
| KEGG_PATHWAY | hsa05222:Small cell
lung cancer | 6 | 0.015 | 15.93 |
| KEGG_PATHWAY | hsa05210:Colorectal
cancer | 6 | 0.015 | 15.93 |
| KEGG_PATHWAY |
hsa04512:ECM-receptor interaction | 6 | 0.015 | 15.93 |
| KEGG_PATHWAY | hsa05215:Prostate
cancer | 6 | 0.019 | 19.63 |
| KEGG_PATHWAY | hsa04912:GnRH
signaling pathway | 6 | 0.028 | 27.23 |
| KEGG_PATHWAY |
hsa04916:Melanogenesis | 6 | 0.029 | 28.15 |
| KEGG_PATHWAY |
hsa04060:Cytokine-cytokine receptor
interaction | 10 | 0.039 | 35.71 |
| Table VThe top 10 most significant items of
Gene Ontology (GO) terms of the co-expression genes of homeobox A3
(HOXA3) mRNA in lung adenocarcinoma. |
Table V
The top 10 most significant items of
Gene Ontology (GO) terms of the co-expression genes of homeobox A3
(HOXA3) mRNA in lung adenocarcinoma.
| Category | Term | Count | P-value | FDR |
|---|
| Biological
Processes | | | | |
| GOTERM_BP_FAT |
GO:0048706~embryonic skeletal system
development | 8 | 3.41E-05 | 0.056837 |
| GOTERM_BP_FAT | GO:0001501~skeletal
system development | 14 | 1.07E-04 | 0.178201 |
| GOTERM_BP_FAT |
GO:0045682~regulation of epidermis
development | 5 | 1.17E-04 | 0.194494 |
| GOTERM_BP_FAT |
GO:0030334~regulation of cell
migration | 10 | 1.80E-04 | 0.299680 |
| GOTERM_BP_FAT |
GO:0042981~regulation of apoptosis | 23 | 1.97E-04 | 0.328453 |
| GOTERM_BP_FAT |
GO:0043067~regulation of programmed cell
death | 23 | 2.27E-04 | 0.377505 |
| GOTERM_BP_FAT |
GO:0010941~regulation of cell death | 23 | 2.39E-04 | 0.397502 |
| GOTERM_BP_FAT | GO:0048705~skeletal
system morphogenesis | 8 | 3.64E-04 | 0.604848 |
| GOTERM_BP_FAT |
GO:0040012~regulation of locomotion | 10 | 4.64E-04 | 0.770756 |
| GOTERM_BP_FAT |
GO:0051270~regulation of cell motion | 10 | 4.81E-04 | 0.798787 |
| Cellular
ψomponents | | | | |
| GOTERM_CC_FAT |
GO:0005626~insoluble fraction | 22 | 0.000184 | 0.237025 |
| GOTERM_CC_FAT | GO:0005624~membrane
fraction | 20 | 0.000837 | 1.072817 |
| GOTERM_CC_FAT |
GO:0031012~extracellular matrix | 12 | 0.001071 | 1.370868 |
| GOTERM_CC_FAT |
GO:0044420~extracellular matrix part | 7 | 0.001490 | 1.902184 |
| GOTERM_CC_FAT | GO:0045177~apical
part of cell | 8 | 0.002892 | 3.662636 |
| GOTERM_CC_FAT | GO:0000267~cell
fraction | 22 | 0.004675 | 5.857488 |
| GOTERM_CC_FAT | GO:0042995~cell
projection | 16 | 0.006747 | 8.351548 |
| GOTERM_CC_FAT |
GO:0005578~proteinaceous extracellular
matrix | 10 | 0.006859 | 8.483923 |
| GOTERM_CC_FAT | GO:0016324~apical
plasma membrane | 6 | 0.013372 | 15.921503 |
| GOTERM_CC_FAT |
GO:0016323~basolateral plasma
membrane | 7 | 0.020688 | 23.607821 |
| Molecular
ϕunctional | | | | |
| GOTERM_MF_FAT |
GO:0043565~sequence-specific DNA
binding | 20 | 0.000041 | 0.056109 |
| GOTERM_MF_FAT | GO:0008047~enzyme
activator activity | 11 | 0.004149 | 5.548392 |
| GOTERM_MF_FAT |
GO:0005547~phosphatidylinositol-3,4,5-trisphosphate
binding | 3 | 0.004179 | 5.587211 |
| GOTERM_MF_FAT |
GO:0016641~oxidoreductase activity, acting
on the CH-NH2 group of donors, oxygen as acceptor | 3 | 0.010187 | 13.113973 |
| GOTERM_MF_FAT | GO:0030695~GTPase
regulator activity | 11 | 0.014540 | 18.214548 |
| GOTERM_MF_FAT |
GO:0016638~oxidoreductase activity, acting
on the CH-NH2 group of donors | 3 | 0.016640 | 20.575093 |
| GOTERM_MF_FAT |
GO:0060589~nucleoside-triphosphatase
regulator activity | 11 | 0.016712 | 20.655661 |
| GOTERM_MF_FAT |
GO:0035091~phosphoinositide binding | 5 | 0.025094 | 29.453780 |
| GOTERM_MF_FAT | GO:0016208~AMP
binding | 3 | 0.028747 | 32.997529 |
| GOTERM_MF_FAT | GO:0003779~actin
binding | 9 | 0.028844 | 33.089357 |
| Table VIKEGG pathway enriched by
co-expression genes of homeobox A3 (HOXA3) mRNA in lung
adenocarcinoma. |
Table VI
KEGG pathway enriched by
co-expression genes of homeobox A3 (HOXA3) mRNA in lung
adenocarcinoma.
| Category | Term | Count | P-value | FDR |
|---|
| KEGG_PATHWAY | hsa04510:Focal
adhesion | 12 | 3.84E-05 | 0.042706 |
| KEGG_PATHWAY |
hsa04512:ECM-receptor interaction | 6 | 0.004145 | 4.514261 |
| KEGG_PATHWAY |
hsa05218:Melanoma | 5 | 0.012451 | 13.009202 |
| KEGG_PATHWAY | hsa05212:Pancreatic
cancer | 5 | 0.013063 | 13.603250 |
| KEGG_PATHWAY | hsa05210:Colorectal
cancer | 5 | 0.021874 | 21.802852 |
| KEGG_PATHWAY | hsa05222:Small cell
lung cancer | 5 | 0.021874 | 21.802852 |
| KEGG_PATHWAY | hsa05200:Pathways
in cancer | 10 | 0.022490 | 22.349251 |
| KEGG_PATHWAY | hsa05215:Prostate
cancer | 5 | 0.026406 | 25.738703 |
| KEGG_PATHWAY | hsa05223:Non-small
cell lung cancer | 4 | 0.031134 | 29.652037 |
| KEGG_PATHWAY |
hsa05214:Glioma | 4 | 0.045993 | 40.760927 |
| KEGG_PATHWAY | hsa04010:MAPK
signaling pathway | 8 | 0.052597 | 45.164053 |
| KEGG_PATHWAY | hsa05220:Chronic
myeloid leukemia | 4 | 0.070302 | 55.541161 |
| KEGG_PATHWAY |
hsa04144:Endocytosis | 6 | 0.084942 | 62.734617 |
| KEGG_PATHWAY | hsa04350:TGF-beta
signaling pathway | 4 | 0.099275 | 68.735075 |
| KEGG_PATHWAY | hsa04012:ErbB
signaling pathway | 4 | 0.099275 | 68.735075 |
| Table VIITop 10 with combined co-expression
score that the protein-protein interaction (PPI) of homeobox A3
(HOXA3) co-expression genes in non-small cell lung cancer. |
Table VII
Top 10 with combined co-expression
score that the protein-protein interaction (PPI) of homeobox A3
(HOXA3) co-expression genes in non-small cell lung cancer.
| #Node1 | Node2 | Node1 STRING
internal ID | Homology | Co-expression | Experimentally
determined interaction | Automated text
mining | Combined score |
|---|
| STX2 | SNAP25 | 1858001 | 0 | 0.093 | 0.939 | 0.905 | 0.998 |
| CDKN2B | CDK6 | 1846519 | 0 | 0.054 | 0.432 | 0.763 | 0.985 |
| DUSP10 | MAPK1 | 1854467 | 0 | 0.053 | 0.498 | 0.705 | 0.984 |
| CALD1 | MYLK | 1854225 | 0 | 0.248 | 0 | 0.791 | 0.982 |
| MITF | MAPK1 | 1847592 | 0 | 0.048 | 0.395 | 0.733 | 0.982 |
| ARRB1 | MAPK1 | 1860799 | 0 | 0 | 0.43 | 0.658 | 0.978 |
| ITSN1 | ITSN2 | 1857363 | 0.965 | 0 | 0.702 | 0.726 | 0.969 |
| EGFR | MAPK1 | 1846445 | 0.632 | 0 | 0.503 | 0.932 | 0.965 |
| MALT1 | CARD10 | 1850132 | 0 | 0 | 0.115 | 0.63 | 0.964 |
| RUNX2 | MAPK1 | 1855482 | 0 | 0 | 0 | 0.639 | 0.962 |
| Table VIIITop 10 with combined co-expression
score that the protein-protein interaction (PPI) of homeobox A3
(HOXA3) co-expression gene intersection in non-small cell lung
cancer enriched in significant signalling pathways. |
Table VIII
Top 10 with combined co-expression
score that the protein-protein interaction (PPI) of homeobox A3
(HOXA3) co-expression gene intersection in non-small cell lung
cancer enriched in significant signalling pathways.
| #Node1 | Node2 | Node1 STRING
internal ID | Homology | Co-expression | Experimentally
determined interaction | Automated text
mining | Combined score |
|---|
| EGFR | MAPK1 | 1846445 | 0.632 | 0 | 0.503 | 0.932 | 0.965 |
| COL6A1 | COL1A1 | 1854318 | 0.617 | 0.504 | 0 | 0.49 | 0.957 |
| MYLK | MAPK1 | 1853981 | 0.636 | 0 | 0 | 0.711 | 0.925 |
| LAMA3 | LAMA4 | 1850649 | 0.804 | 0 | 0 | 0.115 | 0.901 |
| PDGFD | EGFR | 1858075 | 0 | 0 | 0 | 0.49 | 0.893 |
| EGFR | TNC | 1846445 | 0 | 0 | 0.36 | 0.72 | 0.813 |
| THBS1 | COL1A1 | 1844779 | 0 | 0.1 | 0.324 | 0.463 | 0.645 |
| TNC | MAPK1 | 1845696 | 0 | 0 | 0 | 0.576 | 0.576 |
| TNC | THBS1 | 1845696 | 0 | 0.052 | 0 | 0.533 | 0.538 |
| FLNC | MAPK1 | 1850897 | 0 | 0 | 0.066 | 0.475 | 0.49 |
| EGFR | MAPK1 | 1846445 | 0.632 | 0 | 0.503 | 0.932 | 0.965 |
| COL6A1 | COL1A1 | 1854318 | 0.617 | 0.504 | 0 | 0.49 | 0.957 |
| MYLK | MAPK1 | 1853981 | 0.636 | 0 | 0 | 0.711 | 0.925 |
| LAMA3 | LAMA4 | 1850649 | 0.804 | 0 | 0 | 0.115 | 0.901 |
| PDGFD | EGFR | 1858075 | 0 | 0 | 0 | 0.49 | 0.893 |
| Table IXTop 10 with combined score
co-expression correlation by STRING 10.5 of homeobox A3 (HOXA3)
co-expression genes in lung adenocarcinoma. |
Table IX
Top 10 with combined score
co-expression correlation by STRING 10.5 of homeobox A3 (HOXA3)
co-expression genes in lung adenocarcinoma.
| #Node1 | Node2 | Node1 STRING
internal ID | Homology | Co-expression | Experimentally
determined interaction | Automated text
mining | Combined score |
|---|
| STX2 | SNAP25 | 1858001 | 0 | 0.093 | 0.939 | 0.905 | 0.998 |
| ARRB1 | MAPK1 | 1860799 | 0 | 0 | 0.43 | 0.658 | 0.978 |
| EGFR | MAPK1 | 1846445 | 0.632 | 0 | 0.503 | 0.932 | 0.965 |
| MALT1 | CARD10 | 1850132 | 0 | 0 | 0.115 | 0.63 | 0.964 |
| COL6A1 | COL1A1 | 1854318 | 0.617 | 0.504 | 0 | 0.49 | 0.957 |
| PDE10A | ADCY6 | 1862089 | 0 | 0.207 | 0.169 | 0.384 | 0.954 |
| ARRB1 | EGFR | 1860799 | 0 | 0 | 0.165 | 0.416 | 0.947 |
| EGFR | CFTR | 1846445 | 0 | 0 | 0 | 0.445 | 0.942 |
| EGFR | ERBB3 | 1846445 | 0.921 | 0.05 | 0.36 | 0.956 | 0.938 |
| TGFB2 | THBS1 | 1854475 | 0 | 0.046 | 0 | 0.364 | 0.934 |
| STX2 | SNAP25 | 1858001 | 0 | 0.093 | 0.939 | 0.905 | 0.998 |
| ARRB1 | MAPK1 | 1860799 | 0 | 0 | 0.43 | 0.658 | 0.978 |
| EGFR | MAPK1 | 1846445 | 0.632 | 0 | 0.503 | 0.932 | 0.965 |
| MALT1 | CARD10 | 1850132 | 0 | 0 | 0.115 | 0.63 | 0.964 |
| COL6A1 | COL1A1 | 1854318 | 0.617 | 0.504 | 0 | 0.49 | 0.957 |
| Table XTop 10 with combined co-expression
score that the protein-protein interaction (PPI) of homeobox A3
(HOXA3) co-expression gene intersection in lung adenocarcinoma
enriched in significant signalling pathways. |
Table X
Top 10 with combined co-expression
score that the protein-protein interaction (PPI) of homeobox A3
(HOXA3) co-expression gene intersection in lung adenocarcinoma
enriched in significant signalling pathways.
| #Node1 | Node2 | Node1 STRING
internal ID | Homology | Co-expression | Experimentally
determined interaction | Automated text
mining | Combined score |
|---|
| EGFR | MAPK1 | 1846445 | 0.632 | 0 | 0.503 | 0.932 | 0.965 |
| COL6A1 | COL1A1 | 1854318 | 0.617 | 0.504 | 0 | 0.49 | 0.957 |
| MYLK | MAPK1 | 1853981 | 0.636 | 0 | 0 | 0.711 | 0.925 |
| LAMA3 | LAMA4 | 1850649 | 0.804 | 0 | 0 | 0.115 | 0.901 |
| PDGFD | EGFR | 1858075 | 0 | 0 | 0 | 0.49 | 0.893 |
| EGFR | TNC | 1846445 | 0 | 0 | 0.36 | 0.72 | 0.813 |
| THBS1 | COL1A1 | 1844779 | 0 | 0.1 | 0.324 | 0.463 | 0.645 |
| TNC | MAPK1 | 1845696 | 0 | 0 | 0 | 0.576 | 0.576 |
| TNC | THBS1 | 1845696 | 0 | 0.052 | 0 | 0.533 | 0.538 |
| FLNC | MAPK1 | 1850897 | 0 | 0 | 0.066 | 0.475 | 0.49 |
| AKT3 | MAPK1 | 1845421 | 0.65 | 0.134 | 0.292 | 0.576 | 0.486 |
| EGFR | THBS1 | 1846445 | 0 | 0 | 0 | 0.457 | 0.457 |
| COL6A1 | TNC | 1854318 | 0 | 0.055 | 0 | 0.424 | 0.432 |
| TNC | COL1A1 | 1845696 | 0 | 0.1 | 0 | 0.369 | 0.408 |
| EGFR | MAPK1 | 1846445 | 0.632 | 0 | 0.503 | 0.932 | 0.965 |
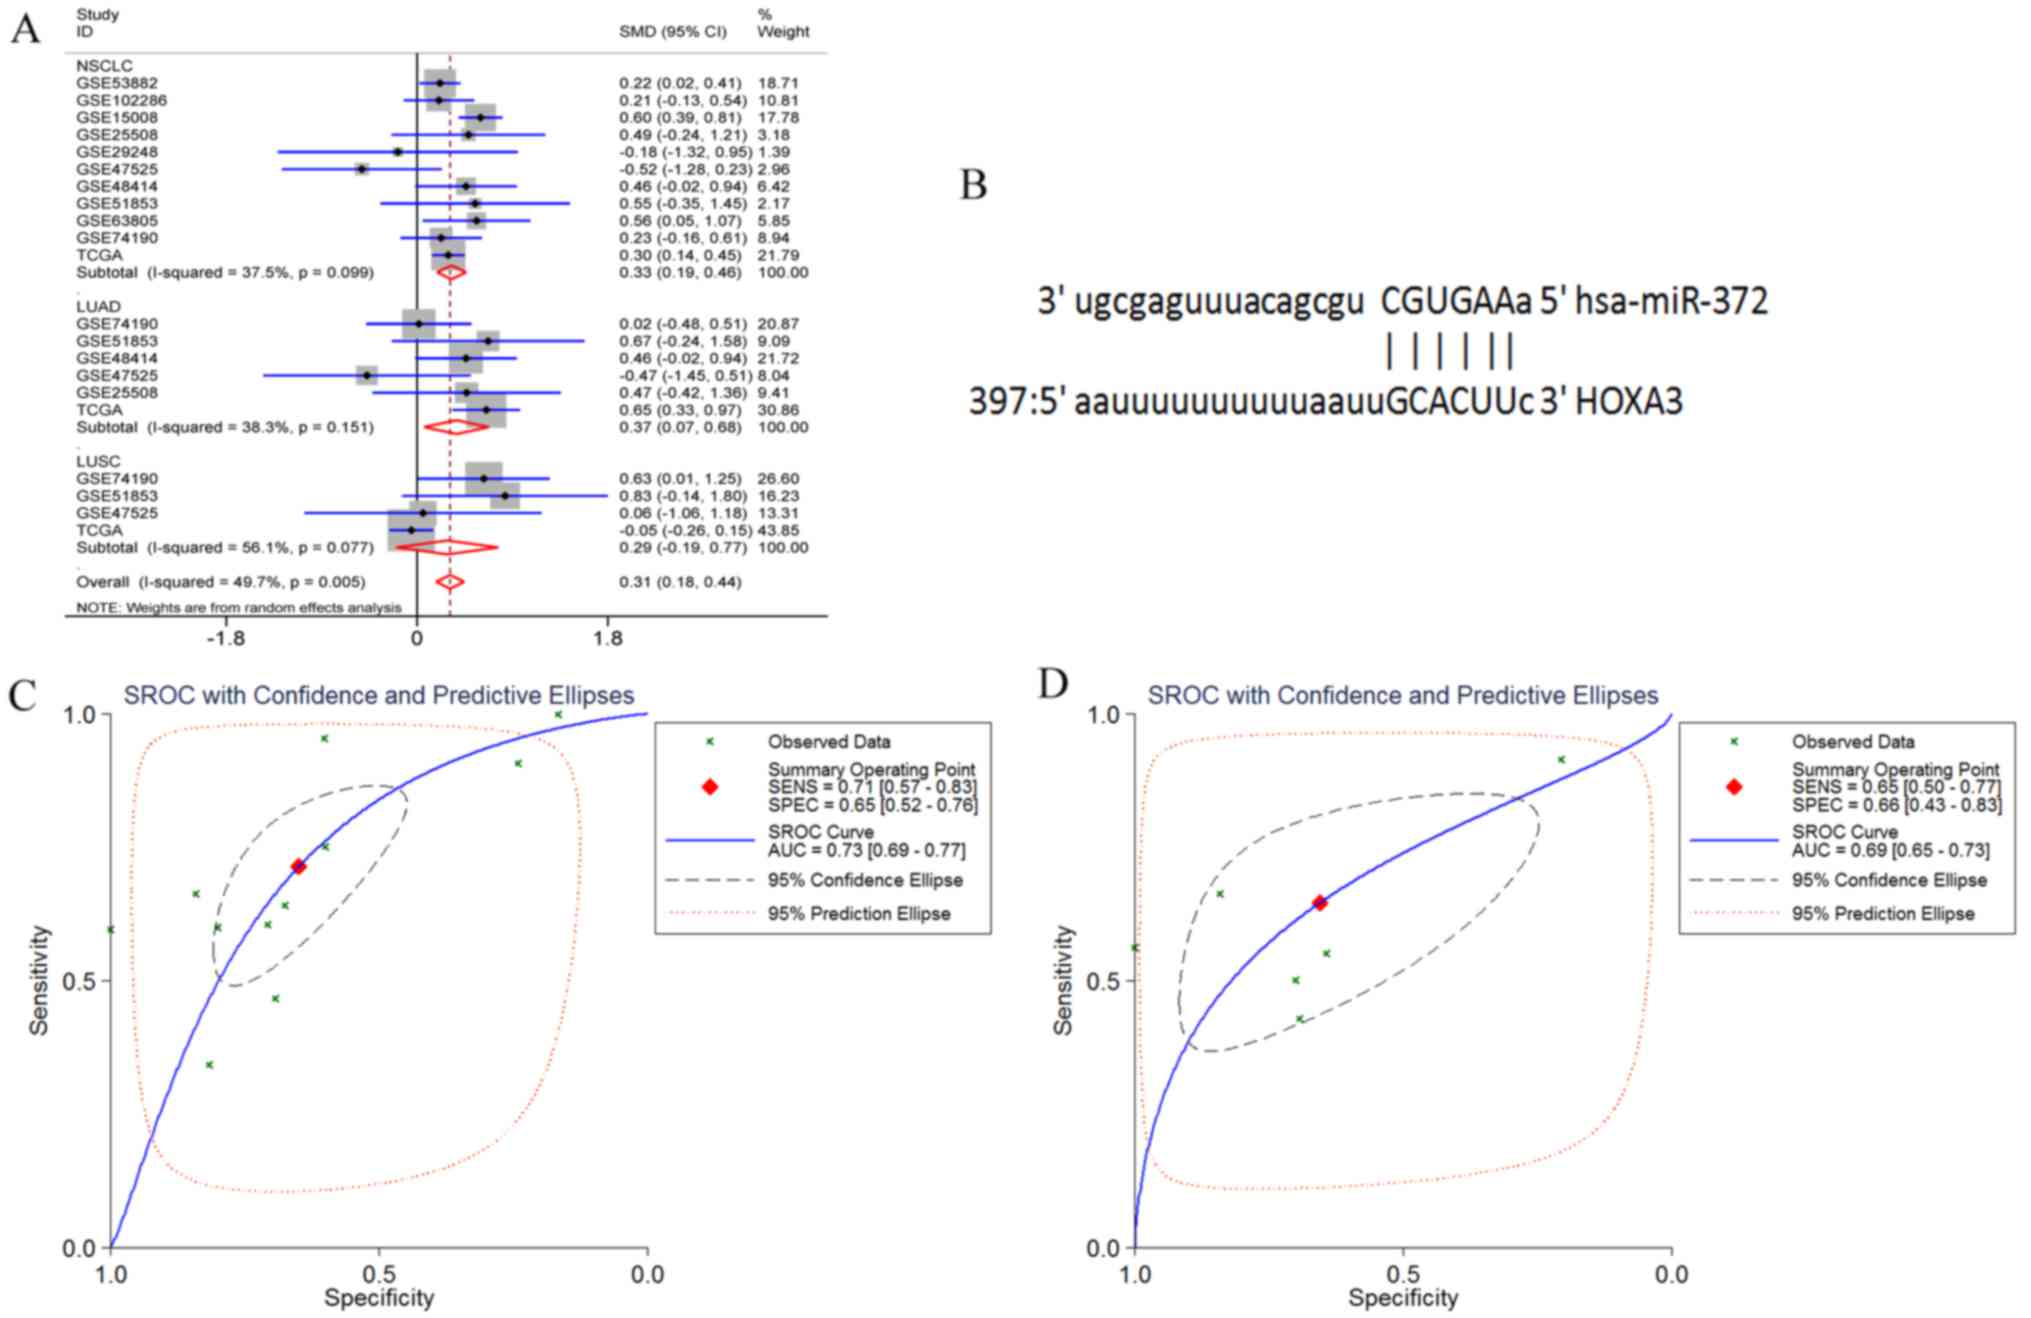
Prediction and preliminary validation of
HOXA3 target miRNAs
HOXA3 had 3 target miRNAs that passed the
target prediction. Based on GEO microarray search and TCGA
database, the random effects model was used for meta-analyses of
the expression of these 3 miRNAs in NSCLC tissues. The results
revealed that the expression of hsa-miR-372-3p was significantly
increased in the NSCLC and LUAD tissues, but only exhibited an
increasing trend in the LUSC tissues (NSCLC P<0.001, LUAD
P=0.017, and LUSC P=0.243) (Fig.
16A). In addition, hsa-miR-372-3p and HOX3A had 1 fragment of
complementary sequences of ′3′CGUGAA5′-3′ GCACUU-5″ (Fig. 16B). Furthermore, the sensitivity
and specificity of miR-372-3p expression in NSCLC were examined
using the sROC method. The results suggested that the optimal
sensitivity and specificity of a high miR-372-3p expression in the
NSCLC group were SENS, 0.71 (0.57, 0.83) and SPES, 0.65 (0.52,
0.76), respectively, and the AUC was 0.73 (95% CI: 0.69, 0.77). The
optimal sensitivity and specificity of the LUAD group were SENS,
0.65 (0.5, 0.77) and SPES, 0.66 (0.43, 0.83), respectively, and the
AUC was 0.69 (95% CI: 0.65, 0.73) (Fig. 16C and D).
Discussion
This study used qPCR detection and TCGA RNA-seq data
to confirm that HOXA3 expression was significantly
down-regulated in LUAD tissues. The downregulation of HOXA3
may be closely associated with a more favourable prognosis of LUAD.
In addition, the TCGA data indicated that HOXA3 harboured
genetic alterations in 11–55% of LUAD tissues, and the methylation
level of HOXA3 in LUAD tissues was significantly
upregulated. Combined with the TCGA data, the upregulation of the
HOXA3 level in LUSC was not significant. Therefore, we paid
more attention to the clinical significance and molecular
mechanisms of action of HOXA3 in LUAD. Through the
collection of co-expression genes and GO and KEGG analyses, the
preliminary results revealed that HOXA3 may play important
roles in LUAD through the regulation of focal adhesion and
ECM-receptor interaction signalling pathways. Furthermore, through
the prediction of HOXA3 target miRNAs and meta-analyses of
target miRNA expression based on the GEO microarray and TCGA data,
the results confirmed that the expression of miR-372-3p that had
complementary sequences with HOXA3 was significantly
increased in LUAD tissues.
There have been some studies of the association
between the HOXA3 level and tumours. For example, Zhang
et al (30) demonstrated
that HOXA3 exhibited a high expression in both colorectal
cancer tissues and cell lines. Shen et al (31) assessed the association between HOX
family genes and nasopharyngeal carcinoma and demonstrated that
HOXA3 expression was also upregulated. Kuasne et al
(32) suggested that HOXA3
exhibited a low expression in penile carcinoma. At least to the
best of our knowledge, only 1 methylation-related study on the
association between HOXA3 and LUAD has been reported
(19). This study, to the best of
our knowledge, was the first to detect HOXA3 mRNA expression
in LUAD. Combined with qPCR detection and TCGA data, we confirmed
that HOXA3 expression was downregulated in LUAD tissues, and
a low HOXA3 expression may play a important role in
LUAD.
The investigation of the association between
HOXA3 and tumour progression has demonstrated that a high
HOXA3 expression is associated with low survival rates in
colon cancer (33). In penile
carcinoma, a low HOXA3 expression was found to be associated
with a poor prognosis (32).
However, the association between HOXA3 and the progression
of nasopharyngeal carcinoma has not been studied in depth (31). Our analyses of HOXA3
expression in all pathological stages of LUAD did not exhibit an
obvious pattern. The survival analyses demonstrated that patients
LUAD with a low HOXA3 expression had a better OS. Therefore,
we hypothesized that the downregulation of HOXA3 expression
may be an independent protective factor in LUAD.
Furthermore, based on the microarray and RNA Seq
data in TCGA, we preliminarily revealed that HOXA3 harboured
a certain level of genetic alterations in LUAD tumour tissues.
Thus, we would like to acquire more information for further
validation. However, relevant studies are currently lacking, and
literature reports are not available, at least to the best of our
knowledge. As regards gene methylation, Kuasne et al
performed genome-wide methylation studies on penile carcinoma and
confirmed that 8 genes, including HOXA3, exhibited high
methylation levels (32). In a
validation study of epigenetic biomarkers in LUAD, Daugaard et
al (19) performed genome-wide
methylation microarray sequencing on 4 cases of LUAD tissues and
normal cancer-adjacent lung tissues to screen differentially
methylated genes in LUAD. They selected the 18 most significantly
differentially methylated genes, including HOXA3, for
validation in 52 samples. The methylation level of HOXA3
significantly increased (19).
This study acquired HOXA3 methylation data from the TCGA
database to perform analyses. The results suggested that the
HOXA3 methylation level was significantly increased in LUAD
tissues. This finding was consistent with the results in literature
reports. Combined with HOXA3 mRNA expression levels in LUAD,
the function of HOXA3 in LUAD may be associated with the
increase in the methylation level. In addition, the study by
Daugaard also demonstrated that the increase of HOXA3
methylation was even more evident in patients with tumour
metastasis; however, its association with the prognostic survival
rates in LUAD patients has not been elucidated (19). Despite the results of this study,
sufficient evidence is not yet available to confirm the association
between the methylation level of HOXA3 and LUAD progression.
Thus, further studies are required for confirmation. As regards
studies on the association between DNA methylation and mRNA
expression, Kuasne et al (32) performed qPCR detection to
demonstrate that genes with high methylation levels exhibited a low
expression in penile carcinoma. These results confirmed that the
methylation level and mRNA expression exhibited a negative
correlation (32). Zhang et
al performed cell experiments to confirm that a group of genes
(S100P, GDA, WISP2, LOXL1,
TIMP4, ICAM1, CLMP, HSP8, GAS1
and BMP2) exhibited a downregulated mRNA expression through
high methylation levels to induce drug resistance in NSCLC
(34). Jin et al
demonstrated that 19 genes mediated the downregulation of mRNA
expression through the increase in upstream methylation levels in
LUAD (35). This study confirmed
the low expression of HOXA3 in LUAD and the increase in the
methylation level. Based on these findings, we hypothesized that
HOXA3 methylation has a negative regulatory association with
mRNA expression and plays critical roles in tumour development and
progression.
To investigate the underlying molecular mechanisms,
GO and KEGG analyses were performed to compare the enrichment of
HOXA3 co-expression genes between the NSCLC group and the
LUAD group. The results demonstrated that the enrichment conditions
in biological processes, cellular components, and molecular
functions were basically the same. Some differences in the KEGG
signalling pathways were noted. The LUAD group was more
concentrated on the focal adhesion and ECM-receptor interaction
pathways. HOXA3 may carry out its regulatory functions in
LUAD through participation in these 2 signalling pathways. The
focal adhesion signalling pathway is a critical pathway to activate
focal adhesion kinase (FAK). Kinases activated by this pathway
mainly mediate a variety of cellular metabolic processes, including
cell metastasis, growth factor signal transduction, cell survival,
cell cycle progression, and cell movement, and are closely
associated with the development of malignant tumours (36–38).
Currently, there are literature reports on using FAK as a novel
potential biological target to investigate targeted therapy of
NSCLC (39,40). The ECM-receptor interaction
signalling pathway mediates the expression of enriched genes and
regulates functions of these genes to promote tumour cell
proliferation and migration and participate in tumour metastasis
and infiltration (41,42). In NSCLC unrelated to smoking, the
ECM-receptor interaction signalling pathway plays a critical role
(43). The above-mentioned 2
signalling pathways significantly influence the development and
progression of human malignant tumours and act as the bridge
between abnormal gene expression and malignant tumour
development.
Therefore, in this study, we performed PPI analyses
on genes enriched in the focal adhesion and ECM-receptor
interaction signalling pathways and demonstrated that MAPK1,
EGFR, TNC and COL1A1 served as core genes in
these 2 pathways. In addition, based on the TCGA data, Pearson's
correlation analyses demonstrated that only TNC and
COL1A1 exhibited significantly positive correlations with
HOXA3 expression in LUAD. One relevant study detected 72
cases of NSCLC tissues and normal lung tissues (44). TNC expression was
upregulated in NSCLC and was closely associated with TNM stage,
lymph node metastasis and tumour pleural invasion. Other studies
have also demonstrated that TNC upregulation is associated
with a poor prognosis in LUAD (45,46).
The study by Oleksiewicz et al (47) on 156 cases of NSCLC and normal lung
tissues revealed that COL1A1 was significantly overexpressed
in tumour tissues. That study also performed cell experiments to
confirm that COL1A1 was closely associated with hypoxia
responses in NSCLC (47). Combined
with bioinformatics analysis results, HOXA3 may collaborate
with co-expression genes, such as TNC and COL1A1, to
regulate focal adhesion and ECM-receptor interaction signalling
pathways, thus carrying out is functions in LUAD. However, more
functional studies are required for further validation.
In this study, we also performed meta-analyses to
confirm that the expression of the predicted miR-372-3p was
upregulated in LUAD. Complementary sequences were noted between
miR-372-3p and HOXA3. Combined with qPCR detection,
HOXA3 and miR-372-3p expression exhibited a negative
correlation trend in LUAD. The results of a literature search
demonstrated that miR-372-3p was highly expressed in both
testicular cancer and LUSC. miR-372-3p promotes cell growth and
migration in LUSC through the downregulation of the target gene
FGF9 (48,49). Therefore, based on results of this
study and those of studies in the literature, we hypothesized that
the downregulation of HOXA3 expression in LUAD tissues may
be associated with the increase in miR-372-3p expression and
HOXA3 may carry out its function through the targeted
upregulation of miR-372-3p. However, this hypothesis needs to be
validated using various experiments.
In conclusion, combined with the RT-qPCR detection
results and data from the TCGA and GEO databases, we confirmed that
HOXA3 expression was downregulated in LUAD tissues and
exhibited a certain level of genetic alteration. The functions of
downregulated HOXA3 in tumour progression and a poor
prognosis of patients with LUAD may be associated with increases in
the methylation level. Furthermore, HOXA3 may collaborate
with co-expression genes, such as TNC and COL1A1, to
regulate the focal adhesion and ECM-receptor interaction signalling
pathways together or upregulate miR-372-3p to promote its
carcinogenesis function. These study results provide true and
reliable experimental data and rigorous molecular theories for
further studies on the molecular mechanisms of HOXA3 in
LUAD.
Acknowledgments
The authors would like to thank all members of the
Molecular Oncology Group of the First Affiliated Hospital of
Guangxi Medical University (Nanning, Guangxi Zhuang Autonomous
Region 530021, China) for their professional suggestions.
Funding
No funding was received.
Availability of data and materials
The datasets used and/or analyzed during the
current study are available from the corresponding authors on
reasonable request.
Authors' contributions
BLG collected data from public datasets and
analyzed the data and performed the statistical analysis. RQH and
YZ collected the clinical samples and performed in-house RT-qPCR
experiments. RQH and GC participated in the conception and design
of the study and in language modification. BLG and RQH drafted the
manuscript and analyzed the GO and KEGG terms. DMW and XHH
conceived and designed the study and assisted in the drafting of
the manuscript. All authors have read and approved the final
manuscript.
Ethics approval and consent to
participate
This research programme was approved by the Ethics
Committee of the First Affiliated Hospital of Guangxi Medical
University. All participants signed informed consent forms.
Patient consent for publication
Not applicable.
Competing interests
The authors declare that they have no competing
interests.
References
|
1
|
Siegel RL, Miller KD and Jemal A: Cancer
Statistics, 2017. CA Cancer J Clin. 67:7–30. 2017. View Article : Google Scholar : PubMed/NCBI
|
|
2
|
Cancer UK: Lung cancer mortality
statistics. 2014
|
|
3
|
Chen W, Zheng R, Baade PD, Zhang S, Zeng
H, Bray F, Jemal A, Yu XQ and He J: Cancer statistics in China,
2015. CA Cancer J Clin. 66:115–132. 2016. View Article : Google Scholar : PubMed/NCBI
|
|
4
|
Miller KD, Siegel RL, Lin CC, Mariotto AB,
Kramer JL, Rowland JH, Stein KD, Alteri R and Jemal A: Cancer
treatment and survivorship statistics, 2016. CA Cancer J Clin.
66:271–289. 2016. View Article : Google Scholar : PubMed/NCBI
|
|
5
|
Govindan R, Page N, Morgensztern D, Read
W, Tierney R, Vlahiotis A, Spitznagel EL and Piccirillo J: Changing
epidemiology of small-cell lung cancer in the United States over
the last 30 years: Analysis of the surveillance, epidemiologic, and
end results database. J Clin Oncol. 24:4539–4544. 2006. View Article : Google Scholar : PubMed/NCBI
|
|
6
|
O'Brien TD, Jia P, Caporaso NE, Landi MT
and Zhao Z: Weak sharing of genetic association signals in three
lung cancer subtypes: Evidence at the SNP, gene, regulation, and
pathway levels. Genome Med. 10:162018. View Article : Google Scholar : PubMed/NCBI
|
|
7
|
Abraham C, Garsa A, Badiyan SN, Drzymala
R, Yang D, DeWees T, Tsien C, Dowling JL, Rich KM, Chicoine MR, et
al: Internal dose escalation is associated with increased local
control for non-small cell lung cancer (NSCLC) brain metastases
treated with stereotactic radiosurgery (SRS). Adv Radiat Oncol.
3:146–153. 2017. View Article : Google Scholar
|
|
8
|
Fernandes P, Lareiro S, Vouga L, Guerra M
and Miranda J: Uniportal video-assisted thorascoscopic surgery -
The new paradigm in the surgical treatment of lung cancer. Rev Port
Cir Cardiotorac Vasc. 24:1272017.
|
|
9
|
Jean F, Tomasini P and Barlesi F:
Atezolizumab: Feasible second-line therapy for patients with
non-small cell lung cancer? A review of efficacy, safety and place
in therapy. Ther Adv Med Oncol. 9:769–779. 2017. View Article : Google Scholar
|
|
10
|
Jiang Q, Xie M, He M, Yan F, Zhang X and
Yu S: Anti-PD-1/PD-L1 antibodies versus docetaxel in patients with
previously treated non-small-cell lung cancer. Oncotarget.
9:7672–7683. 2017.
|
|
11
|
Byrne M, Martinez P and Morris V:
Evolution of a pentameral body plan was not linked to translocation
of anterior Hox genes: The echinoderm HOX cluster revisited. Evol
Dev. 18:137–143. 2016. View Article : Google Scholar : PubMed/NCBI
|
|
12
|
Kim HS, Kim BM, Lee BY, Souissi S, Park HG
and Lee JS: Identification of Hox genes and rearrangements within
the single homeobox (Hox) cluster (192.8 kb) of the cyclopoid
copepod (Paracyclopina nana). J Exp Zoolog B Mol Dev Evol.
326:105–109. 2016. View Article : Google Scholar
|
|
13
|
Schiemann SM, Martín-Durán JM, Børve A,
Vellutini BC, Passamaneck YJ and Hejnol A: Clustered brachiopod Hox
genes are not expressed collinearly and are associated with
lophotrochozoan novelties. Proc Natl Acad Sci USA. 114:E1913–E1922.
2017. View Article : Google Scholar : PubMed/NCBI
|
|
14
|
Wang X, Bu J, Liu X, Wang W, Mai W, Lv B,
Zou J, Mo X, Li X, Wang J, et al: miR-133b suppresses metastasis by
targeting HOXA9 in human colorectal cancer. Oncotarget.
8:63935–63948. 2017.PubMed/NCBI
|
|
15
|
Wang K, Jin J, Ma T and Zhai H: MiR-139-5p
inhibits the tumorigenesis and progression of oral squamous
carcinoma cells by targeting HOXA9. J Cell Mol Med. 21:3730–3740.
2017. View Article : Google Scholar : PubMed/NCBI
|
|
16
|
Fu Z, Chen C, Zhou Q, Wang Y, Zhao Y, Zhao
X, Li W, Zheng S, Ye H, Wang L, et al: LncRNA HOTTIP modulates
cancer stem cell properties in human pancreatic cancer by
regulating HOXA9. Cancer Lett. 410:68–81. 2017. View Article : Google Scholar : PubMed/NCBI
|
|
17
|
Chen S, Yu J, Lv X and Zhang L: HOXA9 is
critical in the proliferation, differentiation, and malignancy of
leukaemia cells both in vitro and in vivo. Cell Biochem Funct.
35:433–440. 2017. View Article : Google Scholar : PubMed/NCBI
|
|
18
|
Sang Y, Zhou F, Wang D, Bi X, Liu X, Hao
Z, Li Q and Zhang W: Up-regulation of long non-coding HOTTIP
functions as an oncogene by regulating HOXA13 in non-small cell
lung cancer. Am J Transl Res. 8:2022–2032. 2016.PubMed/NCBI
|
|
19
|
Daugaard I, Dominguez D, Kjeldsen TE,
Kristensen LS, Hager H, Wojdacz TK and Hansen LL: Identification
and validation of candidate epigenetic biomarkers in lung
adenocarcinoma. Sci Rep. 6:358072016. View Article : Google Scholar : PubMed/NCBI
|
|
20
|
Zhang Y, Chen WJ, Gan TQ, Zhang XL, Xie
ZC, Ye ZH, Deng Y, Wang ZF, Cai KT, Li SK, et al: Clinical
significance and effect of lncRNA HOXA11-AS in NSCLC: A study based
on bioinformatics, in vitro and in vivo verification. Sci Rep.
7:55672017. View Article : Google Scholar : PubMed/NCBI
|
|
21
|
Tang RX, Chen WJ, He RQ, Zeng JH, Liang L,
Li SK, Ma J, Luo DZ and Chen G: Identification of a RNA-Seq based
prognostic signature with five lncRNAs for lung squamous cell
carcinoma. Oncotarget. 8:50761–50773. 2017.PubMed/NCBI
|
|
22
|
Li Z, Xie Y, Zhong T, Zhang X, Dang Y, Gan
T and Chen G: Expression and clinical contribution of MRGD mRNA in
non-small cell lung cancers. J BUON. 20:1101–1106. 2015.PubMed/NCBI
|
|
23
|
Muraoka T, Soh J, Toyooka S, Aoe K,
Fujimoto N, Hashida S, Maki Y, Tanaka N, Shien K, Furukawa M, et
al: The degree of microRNA-34b/c methylation in serum-circulating
DNA is associated with malignant pleural mesothelioma. Lung Cancer.
82:485–490. 2013. View Article : Google Scholar : PubMed/NCBI
|
|
24
|
Singh J, Batish VK and Grover S:
Simultaneous detection of Listeria monocytogenes and Salmonella
spp. in dairy products using real time PCR-melt curve analysis. J
Food Sci Technol. 49:234–239. 2012. View Article : Google Scholar
|
|
25
|
Xu D, Yang Z, Zhang D, Wu W, Guo Y, Chen
Q, Xu D and Cui W: Rapid detection of immunoglobulin heavy chain
gene rearrangement by PCR and melting curve analysis using combined
FR2 and FR3 primers. Diagn Pathol. 10:1402015. View Article : Google Scholar : PubMed/NCBI
|
|
26
|
Zaghloul H, El Morsi AA, Soweha HE,
Elsayed A, Seif S and El-Sharawy H: A simple real-time polymerase
chain reaction assay using SYBR Green for hepatitis C virus
genotyping. Arch Virol. 162:57–61. 2017. View Article : Google Scholar
|
|
27
|
Livak KJ and Schmittgen TD: Analysis of
relative gene expression data using real-time quantitative PCR and
the 2(-Delta Delta C(T)) method. Methods. 25:402–408. 2001.
View Article : Google Scholar
|
|
28
|
Tang R, Liang L, Luo D, Feng Z, Huang Q,
He R, Gan T, Yang L and Chen G: Downregulation of miR-30a is
associated with poor prognosis in lung cancer. Med Sci Monit.
21:2514–2520. 2015. View Article : Google Scholar : PubMed/NCBI
|
|
29
|
Ren F, Ding H, Huang S, Wang H, Wu M, Luo
D, Dang Y, Yang L and Chen G: Expression and clinicopathological
significance of miR-193a-3p and its potential target astrocyte
elevated gene-1 in non-small lung cancer tissues. Cancer Cell Int.
15:802015. View Article : Google Scholar : PubMed/NCBI
|
|
30
|
Zhang X, Liu G, Ding L, Jiang T, Shao S,
Gao Y and Lu Y: HOXA3 promotes tumor growth of human colon cancer
through activating EGFR/Ras/Raf/MEK/ERK signaling pathway. J Cell
Biochem. 119:2864–2874. 2018. View Article : Google Scholar
|
|
31
|
Shen ZH, Zhao KM and Du T: HOXA10 promotes
nasopharyngeal carcinoma cell proliferation and invasion via
inducing the expression of ZIC2. Eur Rev Med Pharmacol Sci.
21:945–952. 2017.PubMed/NCBI
|
|
32
|
Kuasne H, Cólus IM, Busso AF,
Hernandez-Vargas H, Barros-Filho MC, Marchi FA, Scapulatempo-Neto
C, Faria EF, Lopes A, Guimarães GC, et al: Genome-wide methylation
and transcriptome analysis in penile carcinoma: Uncovering new
molecular markers. Clin Epigenetics. 7:462015. View Article : Google Scholar : PubMed/NCBI
|
|
33
|
Zhang X, Liu G, Ding L, Jiang T, Shao S,
Gao Y and Lu Y: HOXA3 promotes tumor growth of human colon cancer
through activating EGFR/Ras/Raf/MEK/ERK signaling pathway. J Cell
Biochem. 119:2864–2874. 2018. View Article : Google Scholar
|
|
34
|
Zhang YW, Zheng Y, Wang JZ, Lu XX, Wang Z,
Chen LB, Guan XX and Tong JD: Integrated analysis of DNA
methylation and mRNA expression profiling reveals candidate genes
associated with cisplatin resistance in non-small cell lung cancer.
Epigenetics. 9:896–909. 2014. View Article : Google Scholar : PubMed/NCBI
|
|
35
|
Jin X, Liu X, Li X and Guan Y: Integrated
analysis of DNA methylation and mRNA expression profiles data to
identify key Genes in lung adenocarcinoma. Biomed Res Int.
2016:43694312016. View Article : Google Scholar : PubMed/NCBI
|
|
36
|
Tai YL, Chen LC and Shen TL: Emerging
roles of focal adhesion kinase in cancer. Biomed Res Int.
2015:6906902015. View Article : Google Scholar : PubMed/NCBI
|
|
37
|
Min A, Zhu C, Wang J, Peng S, Shuai C, Gao
S, Tang Z and Su T: Focal adhesion kinase knockdown in
carcinoma-associated fibroblasts inhibits oral squamous cell
carcinoma metastasis via downregulating MCP-1/CCL2 expression. J
Biochem Mol Toxicol. 29:70–76. 2015. View Article : Google Scholar
|
|
38
|
Eke I and Cordes N: Focal adhesion
signaling and therapy resistance in cancer. Semin Cancer Biol.
31:65–75. 2015. View Article : Google Scholar
|
|
39
|
Zhou B, Wang GZ, Wen ZS, Zhou YC, Huang
YC, Chen Y and Zhou GB: Somatic mutations and splicing variants of
focal adhesion kinase in non-small cell lung cancer. J Natl Cancer
Inst. 110:195–204. 2017. View Article : Google Scholar
|
|
40
|
Tang KJ, Constanzo JD, Venkateswaran N,
Melegari M, Ilcheva M, Morales JC, Skoulidis F, Heymach JV,
Boothman DA and Scaglioni PP: Focal adhesion kinase regulates the
DNA damage response and its inhibition radiosensitizes mutant KRAS
lung cancer. Clin Cancer Res. 22:5851–5863. 2016. View Article : Google Scholar : PubMed/NCBI
|
|
41
|
Zhang HJ, Tao J, Sheng L, Hu X, Rong RM,
Xu M and Zhu TY: Twist2 promotes kidney cancer cell proliferation
and invasion by regulating ITGA6 and CD44 expression in the
ECM-receptor interaction pathway. Onco Targets Ther. 9:1801–1812.
2016.PubMed/NCBI
|
|
42
|
Zhang H, Ye J, Weng X, Liu F, He L, Zhou D
and Liu Y: Comparative transcriptome analysis reveals that the
extracellular matrix receptor interaction contributes to the venous
metastases of hepatocellular carcinoma. Cancer Genet. 208:482–491.
2015. View Article : Google Scholar : PubMed/NCBI
|
|
43
|
Lv M and Wang L: Comprehensive analysis of
genes, pathways, and TFs in nonsmoking Taiwan females with lung
cancer. Exp Lung Res. 41:74–83. 2015. View Article : Google Scholar
|
|
44
|
GE ZH, Cheng QS, LI WM, Feng Z, Wen MM,
Wang WC and Zhang ZP: Expression of TNC in NSCLC and its clinical
significance. Xiandai Shengwu Yixue Jinzhan. 31:6103–6106. 2014.In
Chinese.
|
|
45
|
Gocheva V, Naba A, Bhutkar A, Guardia T,
Miller KM, Li CM, Dayton TL, Sanchez-Rivera FJ, Kim-Kiselak C,
Jailkhani N, et al: Quantitative proteomics identify Tenascin-C as
a promoter of lung cancer progression and contributor to a
signature prognostic of patient survival. Proc Natl Acad Sci USA.
114:E5625–E5634. 2017. View Article : Google Scholar : PubMed/NCBI
|
|
46
|
Edlund K, Lindskog C, Saito A, Berglund A,
Pontén F, Göransson-Kultima H, Isaksson A, Jirström K, Planck M,
Johansson L, et al: CD99 is a novel prognostic stromal marker in
non-small cell lung cancer. Int J Cancer. 131:2264–2273. 2012.
View Article : Google Scholar : PubMed/NCBI
|
|
47
|
Oleksiewicz U, Liloglou T, Tasopoulou KM,
Daskoulidou N, Gosney JR, Field JK and Xinarianos G: COL1A1,
PRPF40A, and UCP2 correlate with hypoxia markers in non-small cell
lung cancer. J Cancer Res Clin Oncol. 143:1133–1141. 2017.
View Article : Google Scholar : PubMed/NCBI
|
|
48
|
Wang Q, Liu S, Zhao X, Wang Y, Tian D and
Jiang W: MiR-372-3p promotes cell growth and metastasis by
targeting FGF9 in lung squamous cell carcinoma. Cancer Med.
6:1323–1330. 2017. View Article : Google Scholar : PubMed/NCBI
|
|
49
|
Syring I, Bartels J, Holdenrieder S,
Kristiansen G, Müller SC and Ellinger J: Circulating serum miRNA
(miR-367-3p, miR-371a-3p, miR-372-3p and miR-373-3p) as biomarkers
in patients with testicular germ cell cancer. J Urol. 193:331–337.
2015. View Article : Google Scholar
|