Introduction
Gastric cancer (GC) is ranked fifth in incidence and
third in mortality among all types of cancer worldwide (1). Although the incidence of GC in
developed areas has declined in recent decades, it ranks third in
incidence and mortality in developing countries, including China
(2).
Similar to other carcinomas, GC is a complex disease
with extremely high heterogeneity (3). First proposed in 1965, the Lauren
system has been widely used in GC classification for over half a
century, and is useful in evaluating the natural history of GC
carcinogenesis (4-6). Based on pathological morphology, the
Lauren system divides GC into intestinal (IT), diffuse (DF) and
mixed (MX) GC (4). IT GC is
characterized by the formation of gland-like structures of various
sizes, the majority of which are highly or moderately
differentiated. DF GC is characterized by cancer cell clusters
scattered in the gastric wall, without the formation of gland-like
structures. In cases where the two types of cancer cells are
equivalent in numbers, the cancer is characterized as MX GC
(7).
Compared with the World Health Organization (WHO)
classification of GC (8), the
Lauren system is simpler and easier to understand, and has a higher
reputability among pathologists (9). Therefore, to the best of our
knowledge, more molecular biological studies are based on the
Lauren classification system compared with other classification
systems, such as the WHO system (10-15).
Molecular characteristics at the gene expression level in DF and IT
GC have been well identified (11,12,14,16);
however, the gene regulatory networks that distinguish between DF
and IT GC remain incompletely characterized.
Previous systemic-level network analyses have been
widely applied to study disease, which have provided significant
insights (17-19). By incorporating numerous sources of
data to model biological processes, particularly transcription
factor (TF)-based gene regulatory networks, integrative analysis
has shown promise in elucidating underlying pathophysiological
mechanisms, as well as in the development of novel and precise
therapies (19,20).
Among these tools, Passing Attributes between
Networks for Data Assimilation (PANDA) exhibits higher performance
and accuracy. PANDA predicts TF-target regulatory relationships by
combining information from gene expression, protein-protein
interaction (PPI) and TF-sequence-motif data, in a message-passing
approach (21). PANDA has been
used in the study of several diseases, including chronic
obstructive pulmonary disease (22), ovarian cancer (23) and triple-negative breast cancer
(24).
In our previous study, it was demonstrated that
patients with DF and IT GC have differing molecular characteristics
at the gene expression level, and Frizzled-related protein,
epidermal growth factor-containing fibulin like extracellular
matrix protein 1 and keratin 23 were identified as subtype-
specific prognostic factors from the analyses of differentially
expressed genes (16). In the
present study, the molecular differences between DF and IT GC were
further evaluated at the TF-target regulatory level using the PANDA
algorithm. In addition, gene regulatory networks for the different
subtypes of GC were constructed, and the prognostic value of TFs
specifically activated in DF or IT GC was determined.
Materials and methods
Data source and preprocessing
The GSE62254 cDNA microarray dataset was downloaded
from the Gene Expression Omnibus website (https://www.ncbi.nlm.nih.gov/geo/). Corresponding
patient information, including Lauren classification and survival
data, was obtained from the supplementary materials of the original
article (25). The Robust
Multichip Average algorithm (26)
was applied for background correction, and qspline was applied for
normalization (27). Data were
perfect match-corrected and summarized using the Li-Wong method
(28). All probes were mapped to
Ensembl Gene Symbols in the R package ‘mygene’ (29).
TF-target network construction
Position weight matrix data of TF-binding motifs in
vertebrates were obtained from the JASPAR database (30). The methods and parameters of
binding site scanning used were previously described (31). PPI data were obtained from a
publicly available dataset (https://www.ncbi.nlm.nih.gov/pmc/articles/PMC2836267/
bin/NIHMS177825-supplement-03.xls) (32).
Networks were constructed using PANDA
software (http://sourceforge.net/projects/panda-net/) (21)
Networks of DF, MX and IT GC subtypes were
constructed by combining the corresponding gene expression, TF
motif and PPI data with an update parameter of α=0.25. Confident
TF-target edges were identified by a False Discovery Rate (FDR) of
<0.05.
Enrichment of subtype-specific TFs and
co-target analysis
AnaPANDA software (23) was used to further identify TFs
specifically activated in a certain subtype of GC, and the
probability cutoff was set to 0.8 to build sub-networks. The
hypergeometric distribution model was utilized to evaluate the
overlap between genes co-targeted by each two given TFs.
Survival analysis
Overall survival (OS) was the primary endpoint in
the present analysis, which was defined as the time from tumor
resection to death or last follow-up. The median mRNA expression
level of a given gene was chosen as the cutoff to divide patients
into two subgroups. Log-rank tests and Kaplan-Meier plots were used
to evaluate the difference in OS between subgroups. Cox
proportional hazard model was applied for multiple-variants
analysis, in which ‘backward LR’ stepwise logistic regression was
used for variable selection.
Cell culturing and siRNA
transfection
Human GC cell lines [MGC803 (the cell line used has
been authenticated by STR profiling) and SGC-7901] were purchased
from the Cancer Institute and Hospital, Chinese Academy of Medical
Sciences (Beijing, China). All cells were maintained in Dulbecco’s
modified Eagle’s medium (cat. no. 10-013-CVR; Corning, Inc.,
Corning, NY, USA) supplemented with 10% fetal bovine serum (cat.
no. 10270-106; Gibco; Thermo Fisher Scientific, Inc.) at 37°C in an
incubator containing 5% CO2. Approximately
5×10⁵ cells/well were cultured in a 6-well plate. After
24 h, cells were transfected with small interfering RNAs (siRNAs)
(sequences: si-NC, 5′-UUCUCCGAACGUGUCACGUTT-3′; si-NFYA,
5′-CAAACAAUACCACCGUAUUTT-3′) using RNA-mate (BioChain Institute,
Inc., Newark, CA, USA) (5 µg siRNA + 10 µl RNA-mate)
for 6 h at 37°C according to the manufacturer’s protocol. siRNAs
were purchased from Shanghai GenePharma Co., Ltd. (Shanghai,
China).
Western blot analysis
Nuclear transcription factor Y subunit α (NFYA)
antibody (cat. no. 12981-1-ap, 1:1,000) was purchased from Wuhan
Sanying Biotechnology (Wuhan, China). GAPDH antibody (cat. no.
A01020, 1:1,000) was purchased from ARP American Research Products,
Inc. (Waltham, MA, USA). Proteins were extracted from the cells
using lysis buffer (50 mM Tris-HCl, pH 7.4; 10 mM EDTA; 0.5% NP-40;
1% Triton X-100) and quantified using the bicinchoninic acid
method, after which they were separated (50 µg) by 10%
SDS-PAGE and transferred to PVDF membranes. The membranes were
blocked with 5% bovine serum albumin (cat. no. A1933;
Sigma-Aldrich; Merck KGaA, Darmstadt, Germany) for 1 h at 37°C, and
were then incubated with primary antibodies for 2 h at 37°C, washed
with PBS-1% Tween (PBST) five times (5 min/wash), and then
incubated with a secondary antibody (cat. no. 7074, 1:2,000; Cell
Signaling Technology, Inc.) for 30 min at 37°C. Subsequently, the
membranes were washed a further three times with PBST (5 min/wash)
and proteins were detected using an enhanced chemiluminescence kit
(cat. no. 34076; Thermo Fisher Scientific, Inc.).
Cell proliferation analysis and colony
formation assay
For the cell proliferation analysis, a total of 12 h
post-transfection, MGC803 and SGC-7901 cells were cultured in
96-well plates at a density of 2×10³ cells/well. Cell
viability was measured using a Cell Counting kit-8 (CCK-8; Dojindo
Molecular Technologies, Inc., Kumamoto, Japan), according to the
manufacturer’s protocol. For colony formation assay, MGC803 and
SGC-7901 cells were cultured in 6-well plates at a density of
1×10³ cells/well. After 14 days, colonies were fixed in
methanol, stained with 0.25% crystal violet for 10 min at room
temperature and counted. All assays were repeated three times
independently.
Statistical analysis and R package
usage
Categorical, baseline data were compared with
Pearson’s χ2 test or Fisher’s exact test, and continuous
baseline data were compared with one-way analysis of variance
followed by Student Nerman Keuls test in Table I. For comparisons of continuous
data, an unpaired Student’s t-test was conducted. Wald test was
performed to evaluate the overall multivariate Cox model. For all
statistical analyses, P<0.05 was considered to indicate a
statistically significant difference, and a cutoff value of
FDR<0.05 was used for multiple comparison corrections. All
statistical analyses were two-sided and performed using R Software
3.3.1 (www.r-project.org). R packages
‘VennDiagram’ and ‘ggplot2’ were used for data visualization;
Mygene was used for gene symbol mapping; MASS and survival were
used for survival analysis; q value was used for FDR analysis.
 | Table ICharacteristics of patients included
in the present study. |
Table I
Characteristics of patients included
in the present study.
| Variable | Diffuse
n=134 |
Intestinal
n=146 | Mixed
n=20 | P-value |
|---|
| Age at diagnosis
(years) | | | | <0.001 |
| Means ± SD | 58.44±12.53 | 64.41±9.61 | 67.35±7.90 | |
| Sex | | | | 0.001 |
| Male | 74 | 110 | 15 | |
| Female | 60 | 36 | 5 | |
| Tumor location | | | | 0.382 |
| Cardia | 17 | 12 | 3 | |
| Body | 54 | 54 | 5 | |
| Antrum | 63 | 80 | 12 | |
| MLH1
expressiona | | | | 0.083 |
| Positive | 112 | 109 | 13 | |
| Negative | 22 | 35 | 7 | |
| Recurrence | | | | 0.079 |
| Yes | 66 | 49 | 10 | |
| No | 62 | 86 | 9 | |
| Unknown | 6 | 11 | 1 | |
| Stagea | | | | <0.001 |
| I/II | 39 | 79 | 8 | |
| III | 49 | 37 | 9 | |
| IV | 46 | 28 | 3 | |
Results
Baseline characteristics in the three
groups
A total of 300 patients were included in the present
analysis. Patient characteristics are presented in Table I. In total, there were 134 patients
in the DF group, 146 in the IT group and 20 in the MX group. The
age in each group was 58.44±12.53, 64.41±9.61 and 67.35±7.90 years,
respectively. A larger proportion of patients were male (66.33%).
Patients in the DF, IT and MX groups were similar with regards to
tumor location, mutL homolog 1 expression and recurrence.
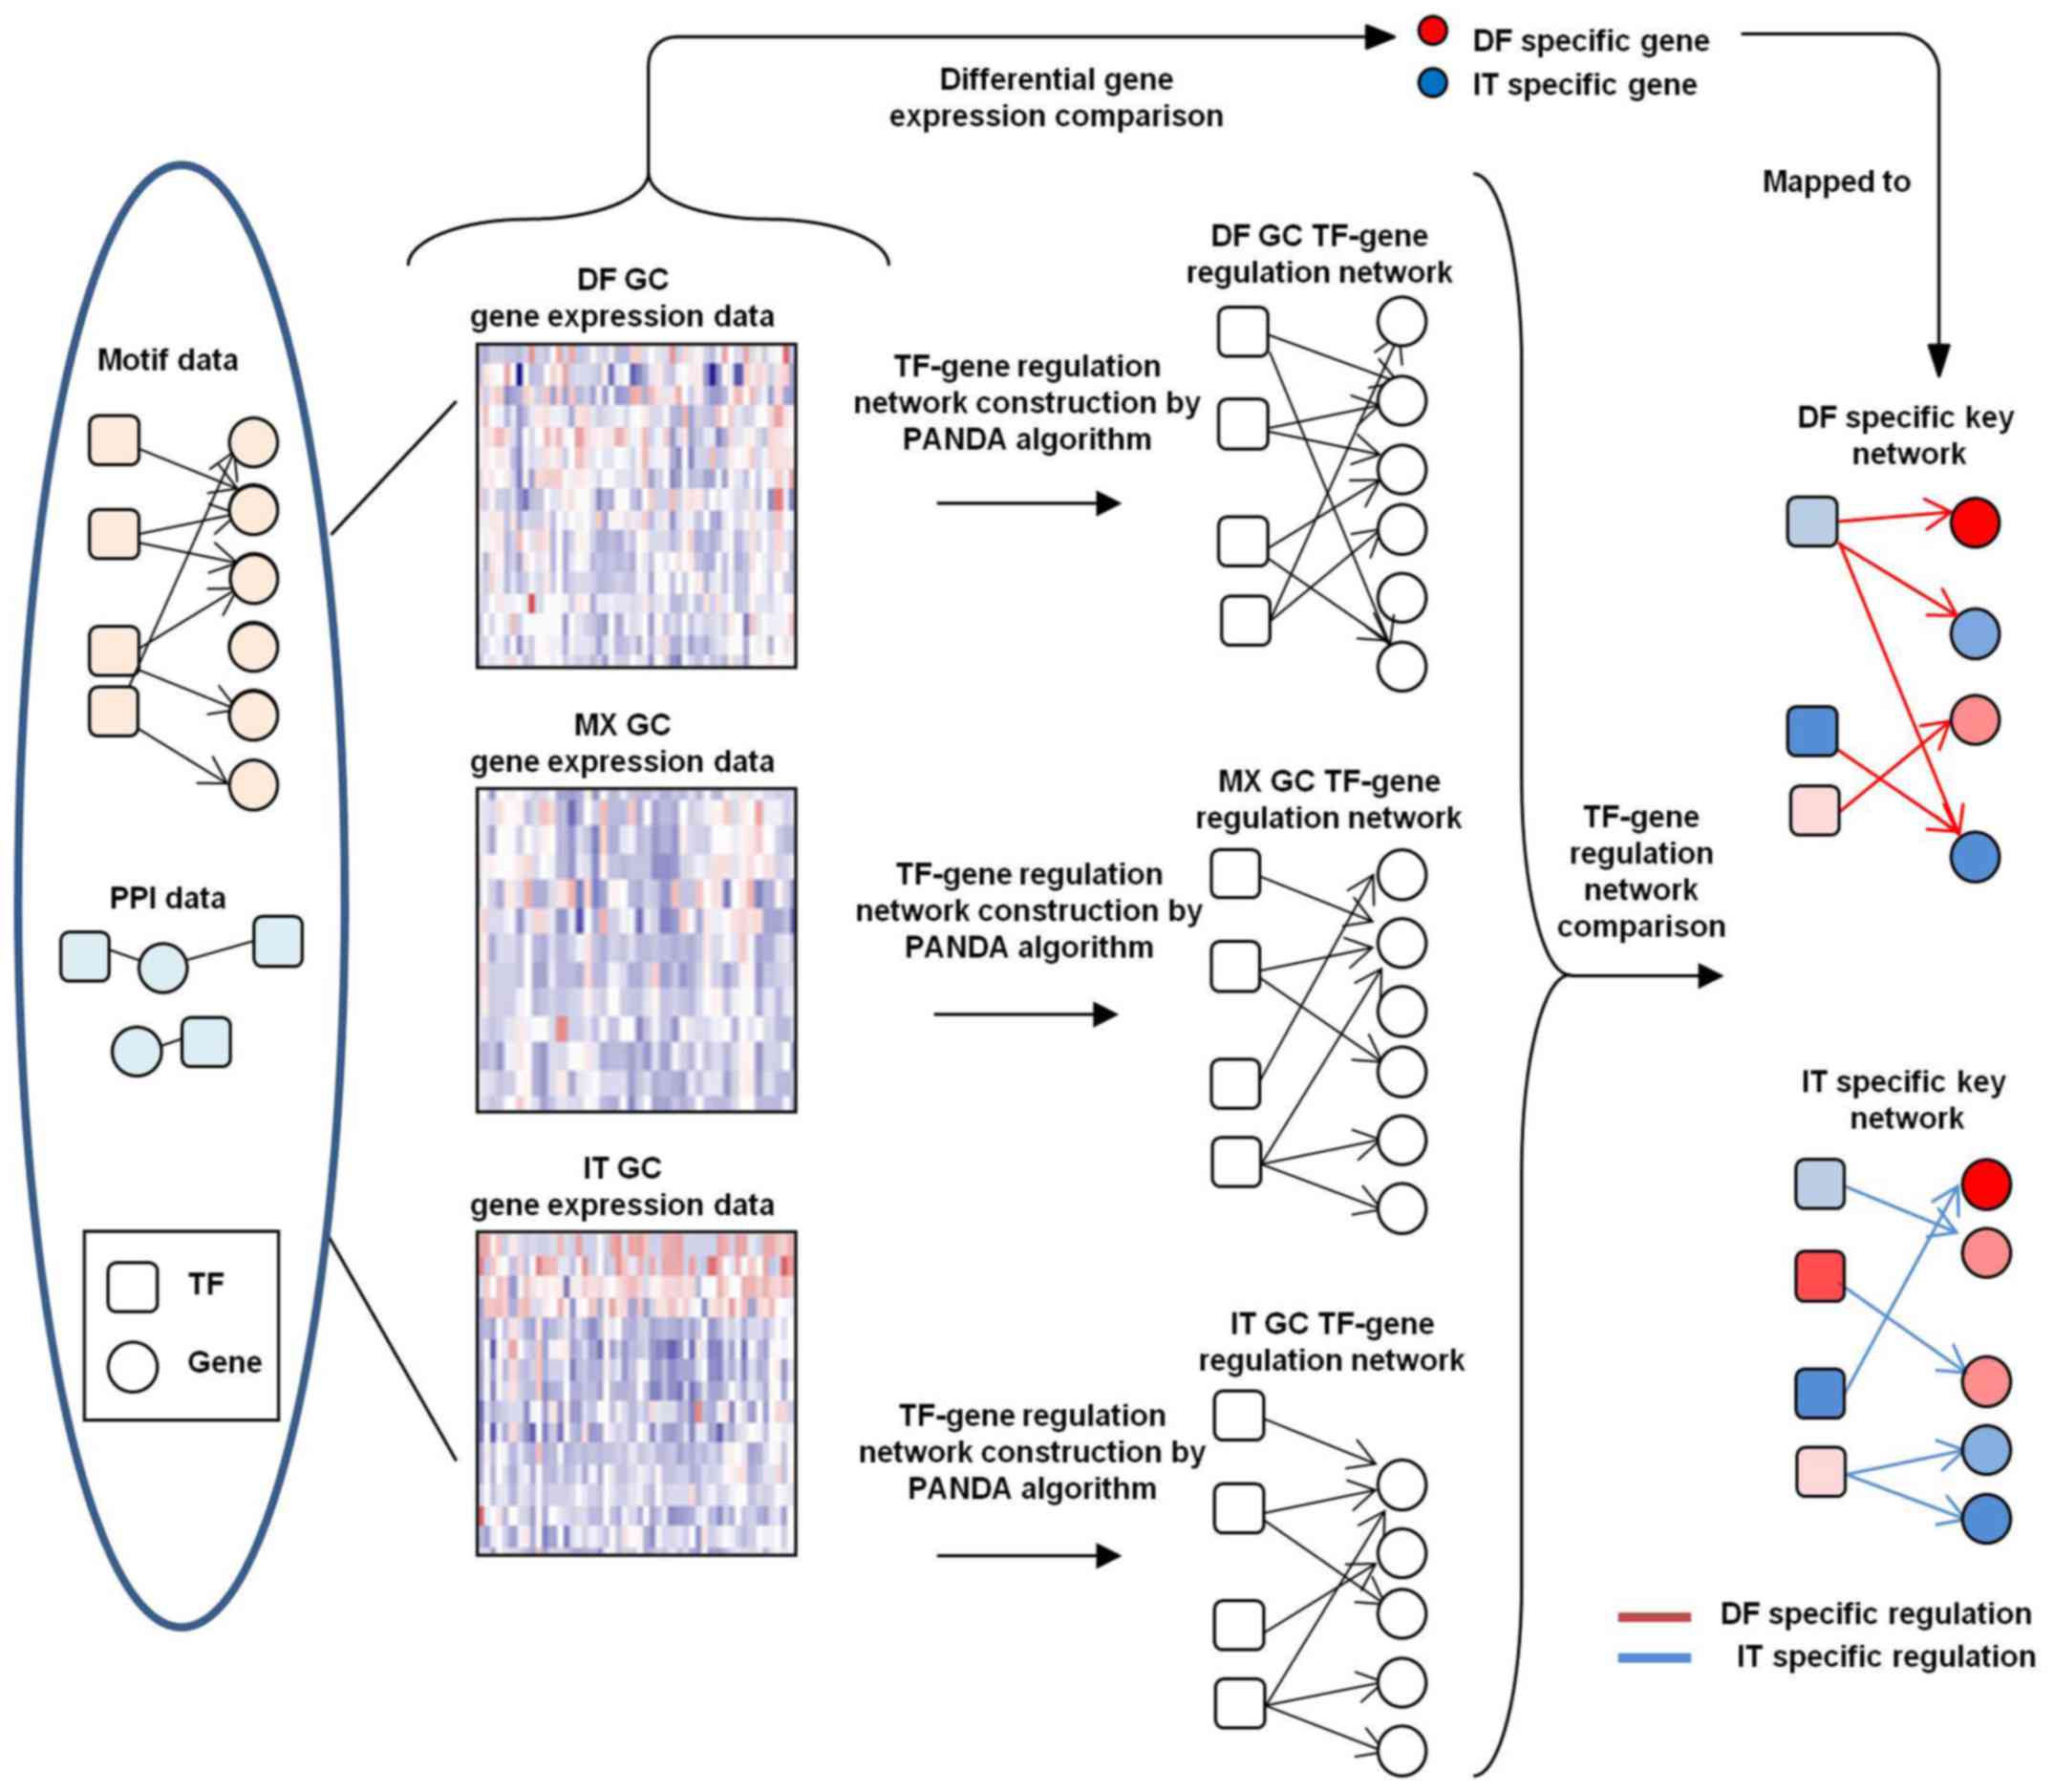
Building TF-target regulatory networks of
DF and IT GC subtypes
Expression data were extracted from 134 DF, 20 MX
and 146 IT GC samples from the GSE62254 dataset. Combining TF motif
and PPI data, TF-target regulatory networks for these three
subtypes of GC were generated using PANDA software (Fig. 1). For each TF-target edge in each
subtype, a Z-score was calculated based on the confidence level of
the potential regulatory relationship. Edge Z-score distributions
of the various subgroups of GC are presented in Fig. 2A. Different subgroups were assigned
different colors.
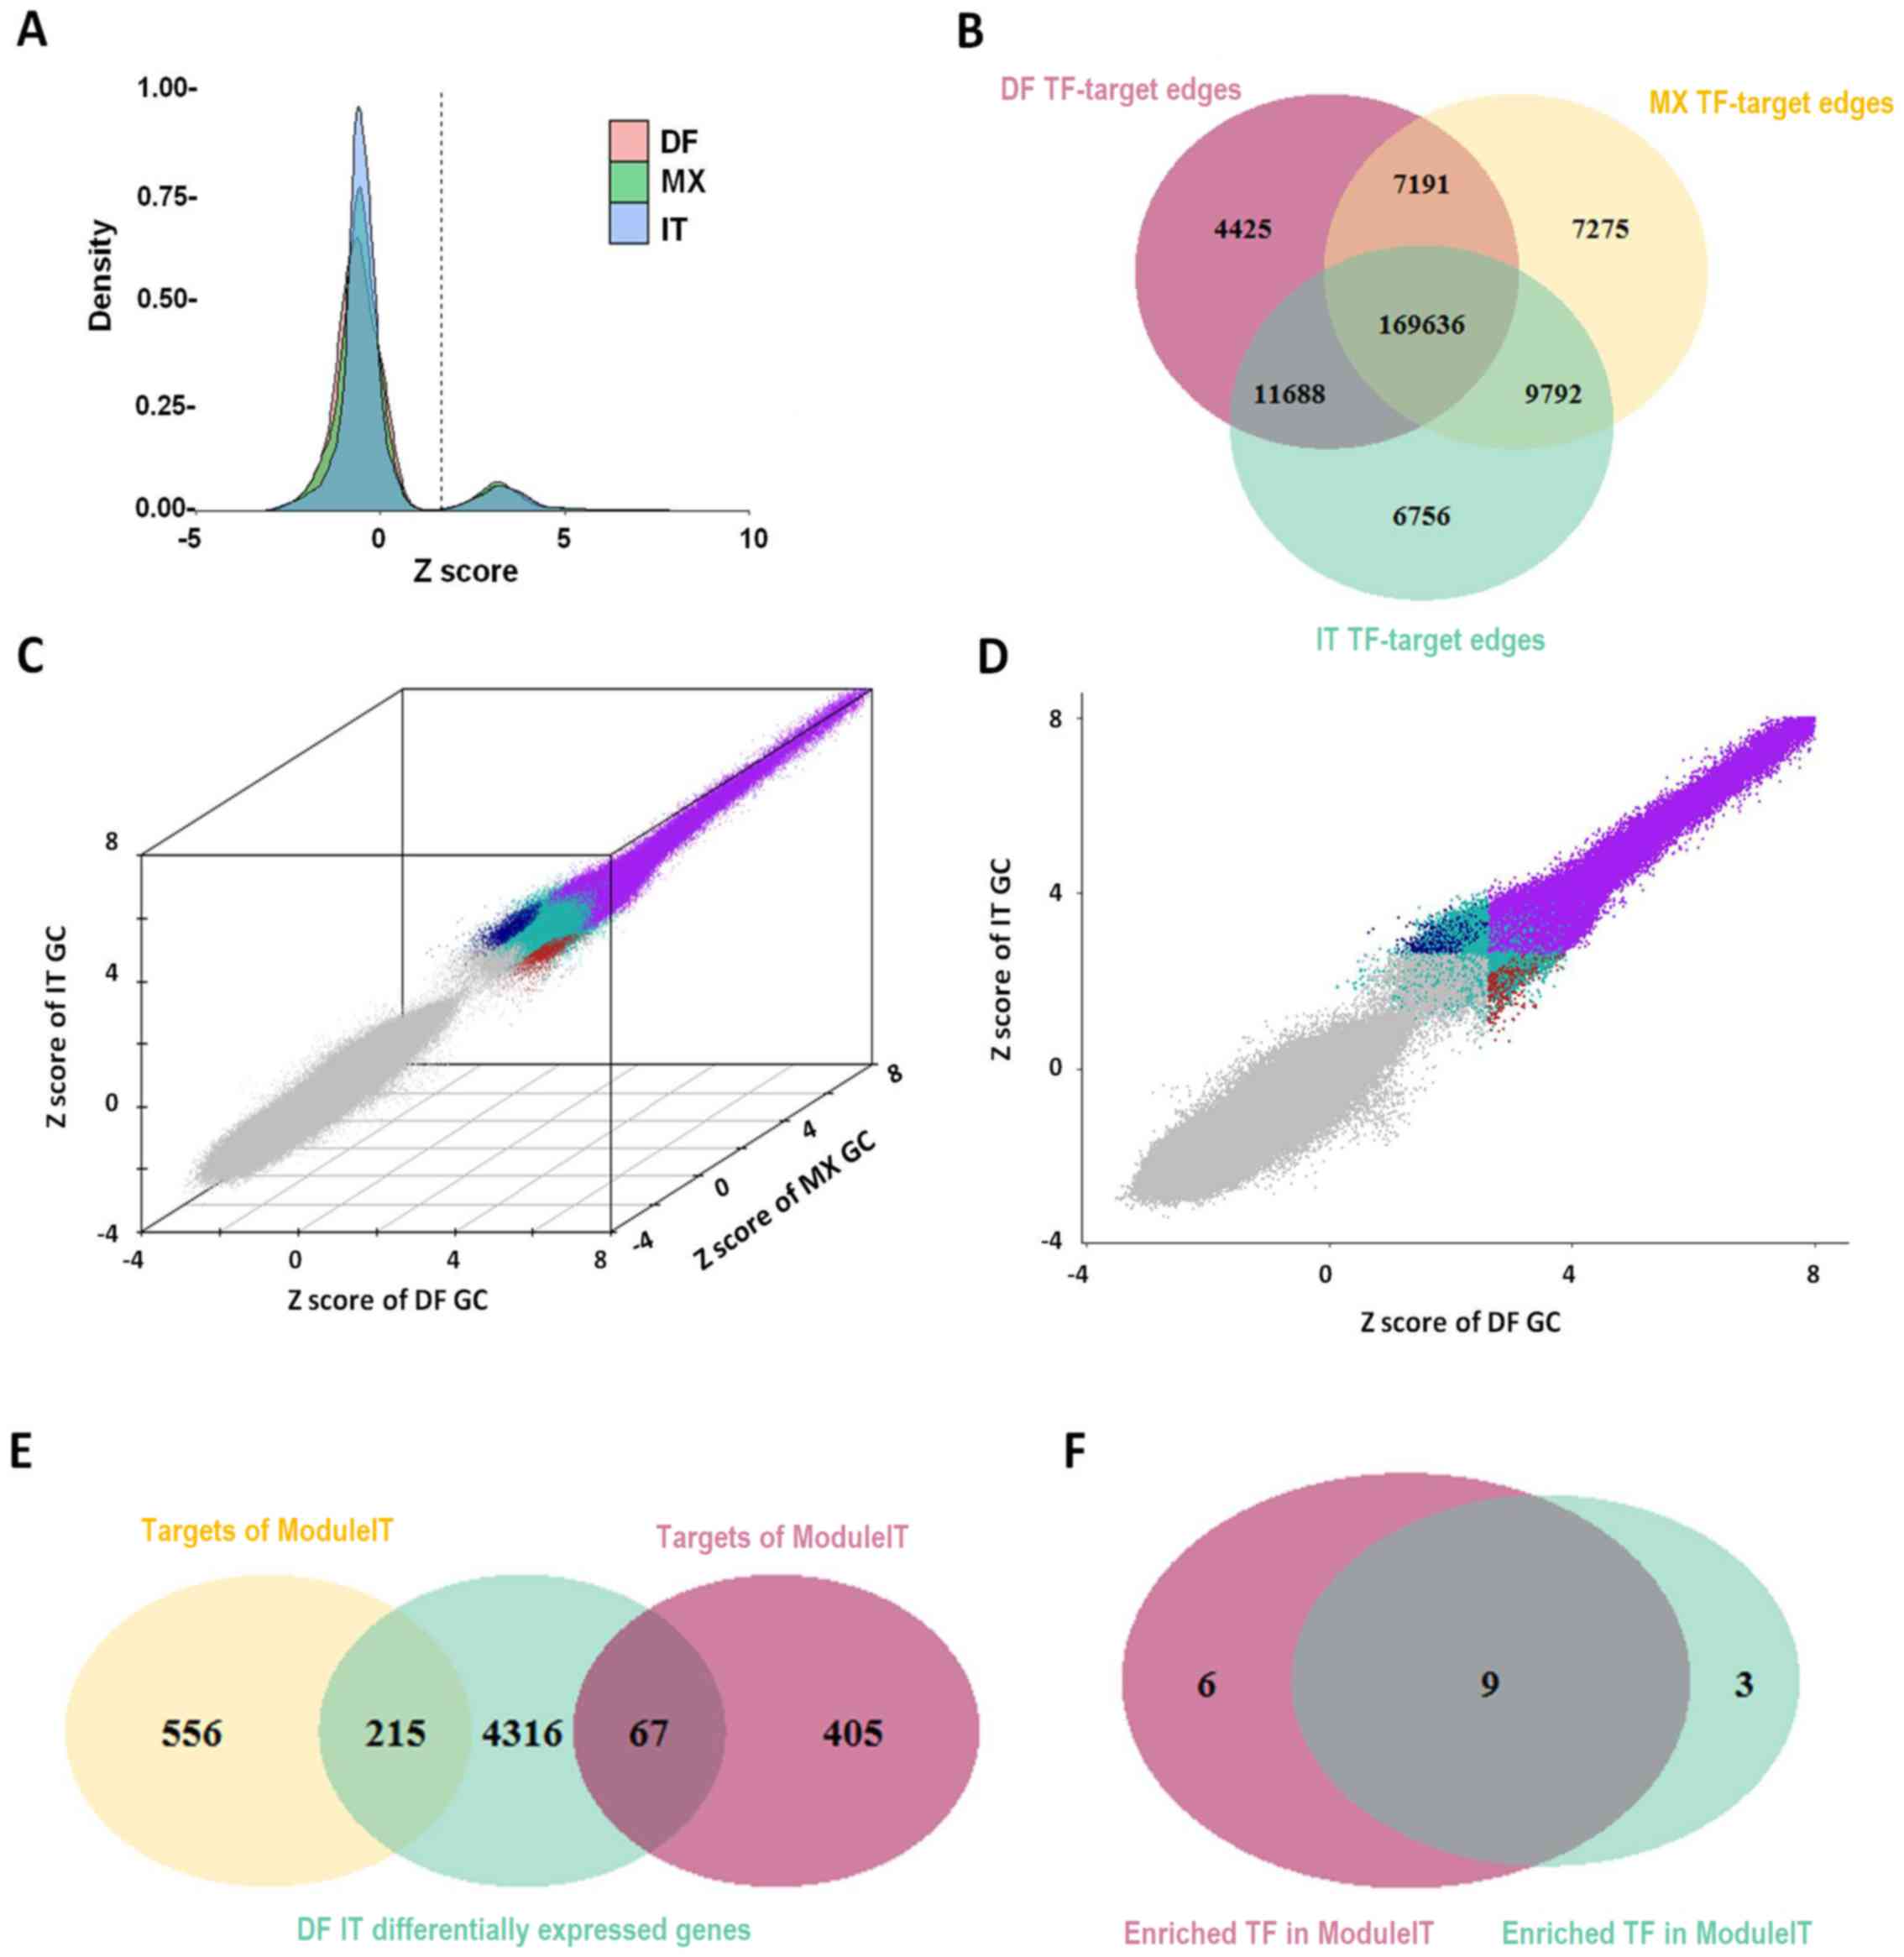 | Figure 2Gene regulatory network construction,
and DF- and IT-specific TF-target edge identification. (A) Edge
Z-score distribution in different subgroups of GC. (B) Overlap of
TF-target edges among the different subgroups of GC. (C)
Identification of DF- and IT-specific TF-target edges in a 3D
scatter plot, exhibiting Z scores of DF, MX and IT GC. Low
confidence edges were colored gray, conserved edges were colored
purple, DF-specific edges were colored red, IT-specific edges were
colored blue and other edges were colored green. (D) Projection of
3D view through the y-axis. (E) Overlap of target genes in
ModuleDF/ModuleIT and DF/IT differentially expressed genes. (F)
Overlap of TFs enriched in DF-specific TF-target edges with DF
differentially expressed genes (ModuleDF) and IT-specific TF-target
edges with IT differentially expressed genes (ModuleIT). DF,
diffuse; GC, gastric cancer; IT, intestinal; MX, mixed; TF,
transcription factor. |
Identification of DF- and IT-specific
TF-target regulatory edges
All edges with an FDR-adjusted P-value of <0.05
were considered confident. The overlap of confident edges among the
three subtypes of GC was displayed as a Venn diagram (Fig. 2B); >85% of TF-target edges were
shared among all three subtypes, indicating that the TF-target
relationship was strongly conserved. According to the definition of
DF-specific edges (ModuleDF), IT-specific edges (ModuleIT) and
commonly conserved edges, different edges were marked with
different colors in a 3D scatter plot, in which each axis
represented a Z-score of each subtype of GC (Fig. 2C). Fig. 2D exhibited the projection of this
3D plot through each axis. The overlap of differentially expressed
genes between DF and IT GC, as well as the target genes of ModuleDF
and ModuleIT were illustrated in a Venn diagram (Fig. 2E). By applying the hypergeometric
distribution model to the target genes of each TF, it was revealed
that most TFs with a high activity in ModuleDF also had a high
activity in ModuleIT (Fig.
2F).
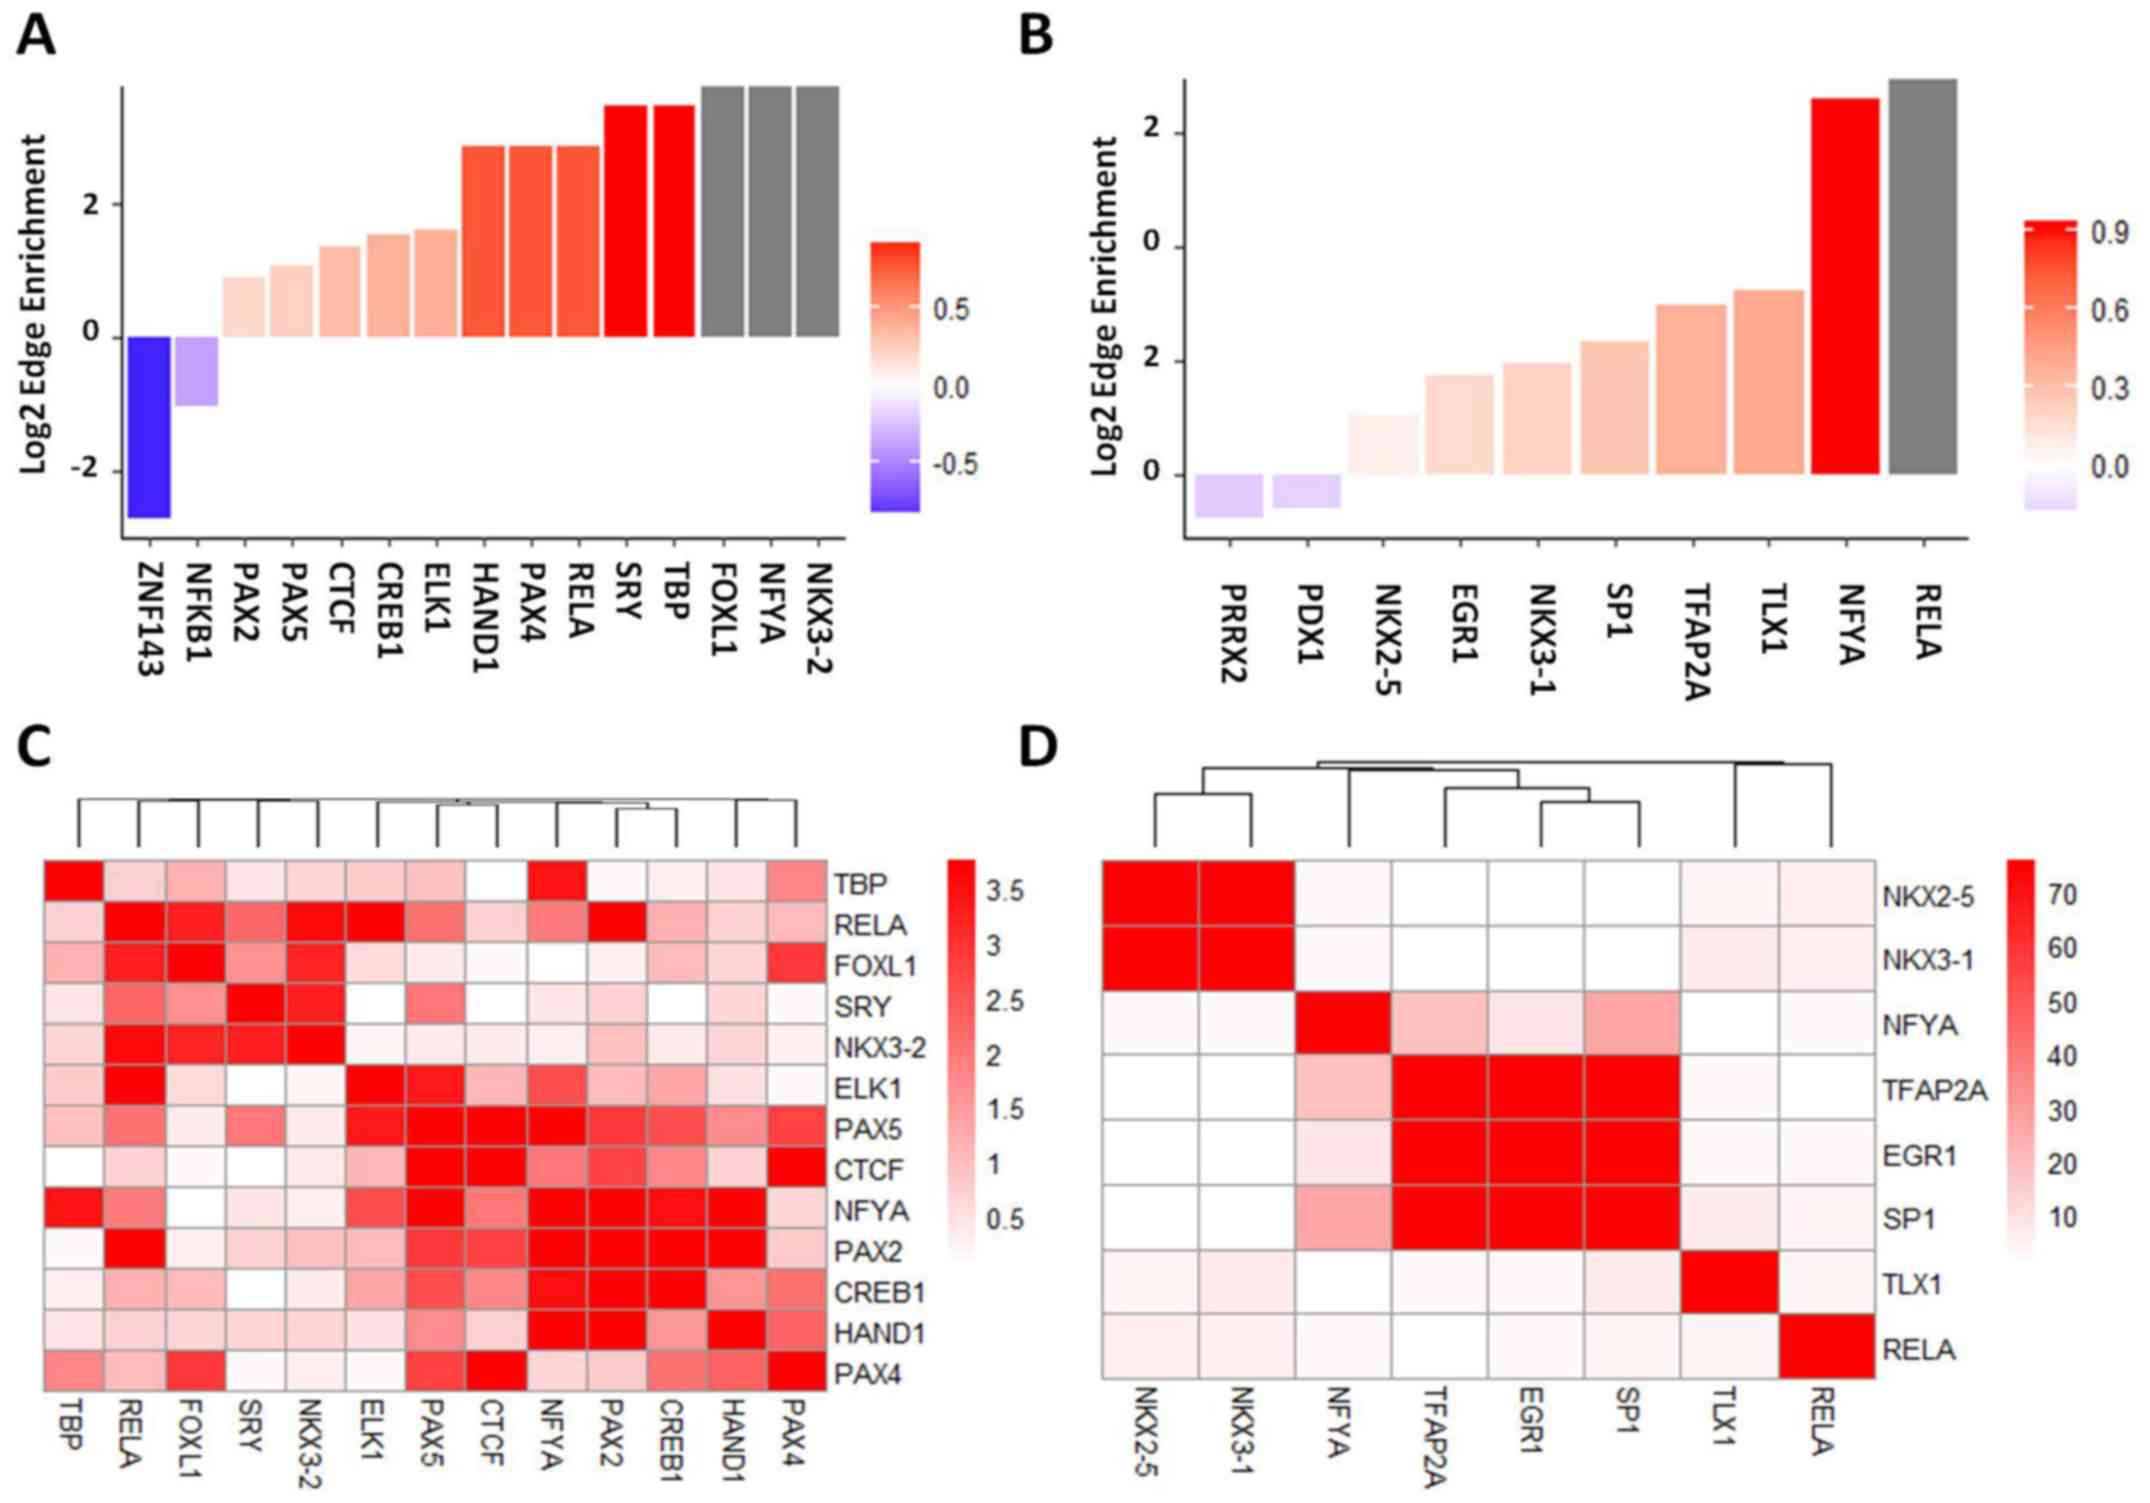
Enrichment of DF- and IT-specific TFs and
co-target analysis
Using the MX subtype as a control, the AnaPANDA
algorithm was applied to further identify TFs, which were
specifically activated in each subtype of GC. A total of 13 TFs
were activated in DF GC (Fig. 3A),
and 8 TFs were activated in IT GC (Fig. 3B). Additionally, Fisher’s exact
test was applied to evaluate the overlap between target genes
shared by different pairs of TFs. In DF GC, RELA proto-oncogene
(RELA) and forkhead box L1 (FOXL1), sex determining region Y (SRY)
and NK3 homeobox (NKX3)-2, NFYA, paired box 2 and cAMP responsive
element binding protein 1 (CREB1) were identified as co-targeted,
which suggested that those TFs had very similar target profiles
(Fig. 3C). In IT GC, NK2 homeobox
5 and NKX3-1, transcription factor AP-2α (TFAP2A), early growth
response 1 (EGR1) and Sp1 transcription factor (SP1) were also
identified as co-targeted (Fig.
3D).
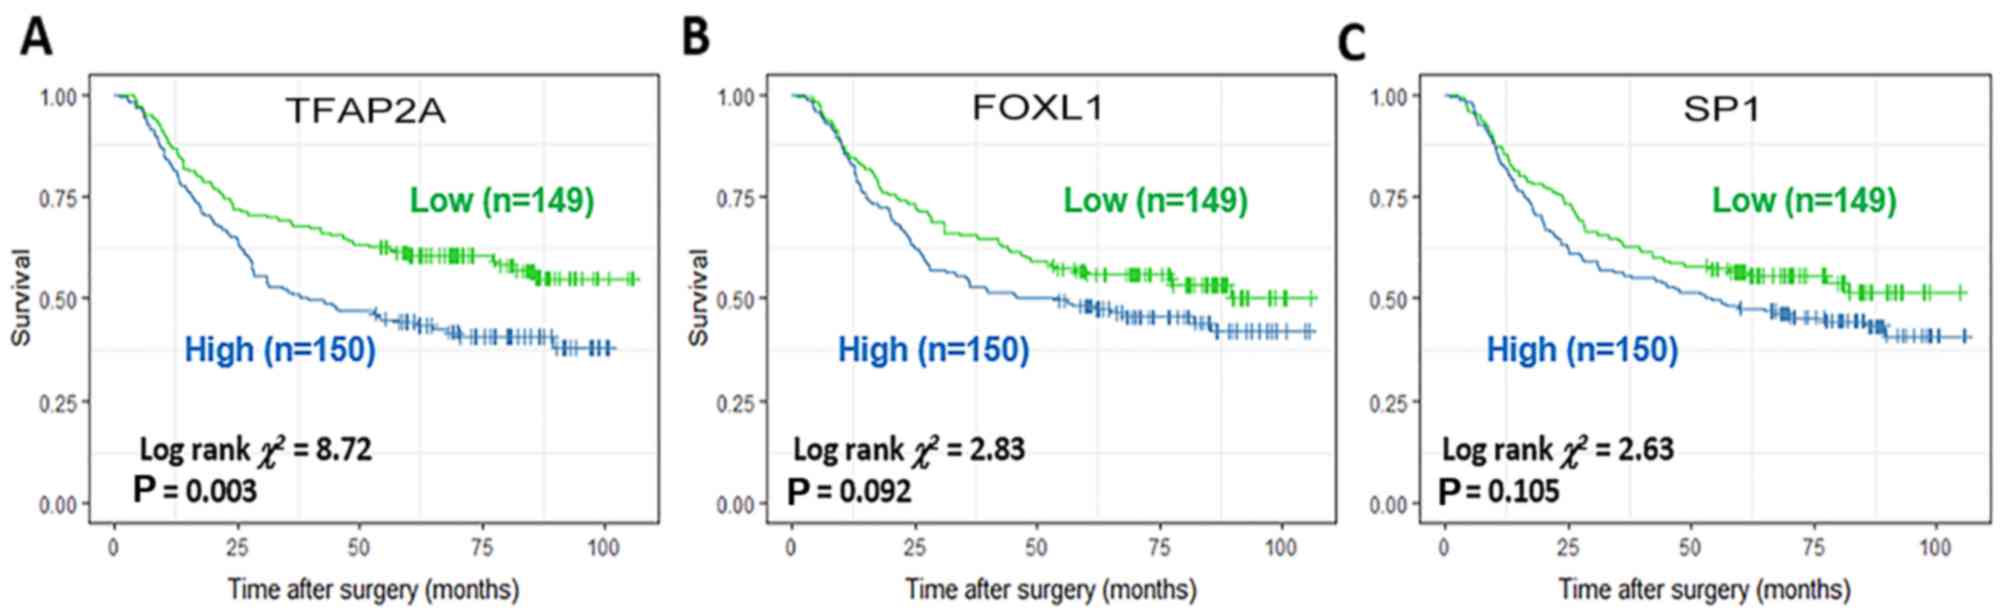
Application of enriched TFs as DF- or
IT-specific prognostic biomarkers
Among the TFs specifically activated in DF or IT
subtypes, TFAP2A, FOXL1 and SP1 were identified as potential
prognostic biomarkers in all GC (Fig.
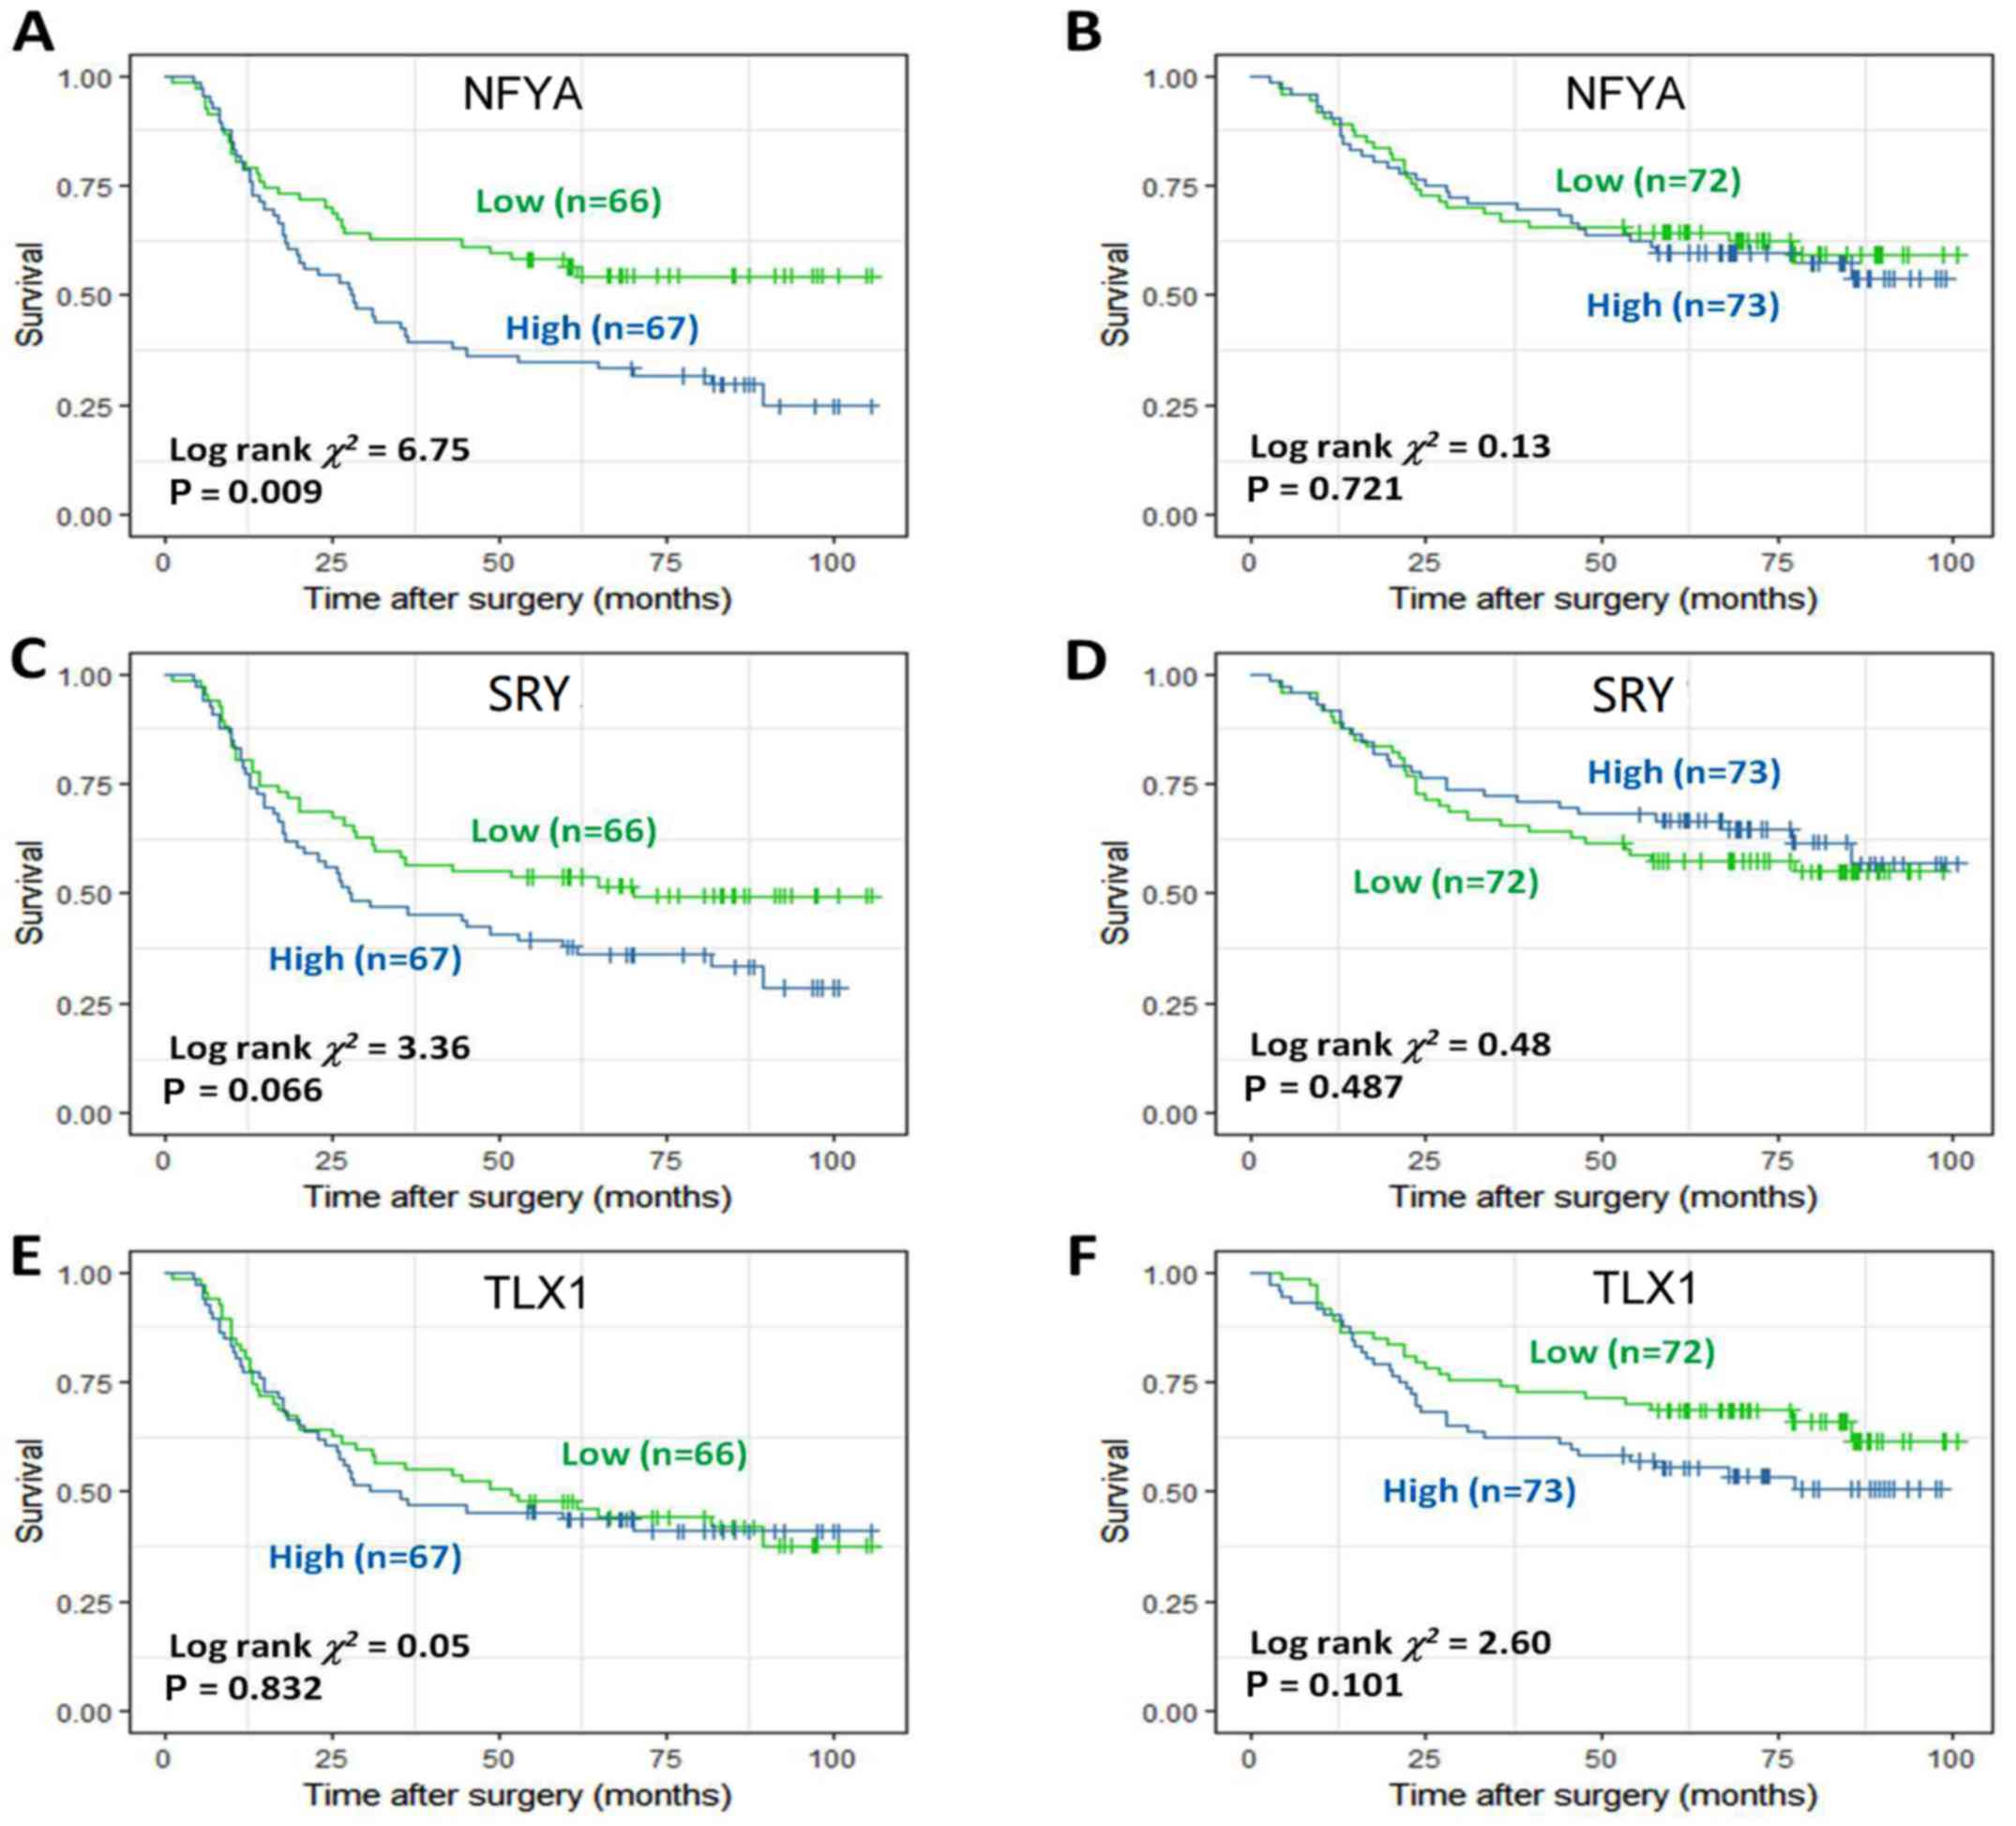
4A-C). NFYA and SRY were identified to be potential prognostic
factors in DF GC (Fig. 5A-D),
whereas T-cell leukemia homeobox 1 (TLX1) identified to have
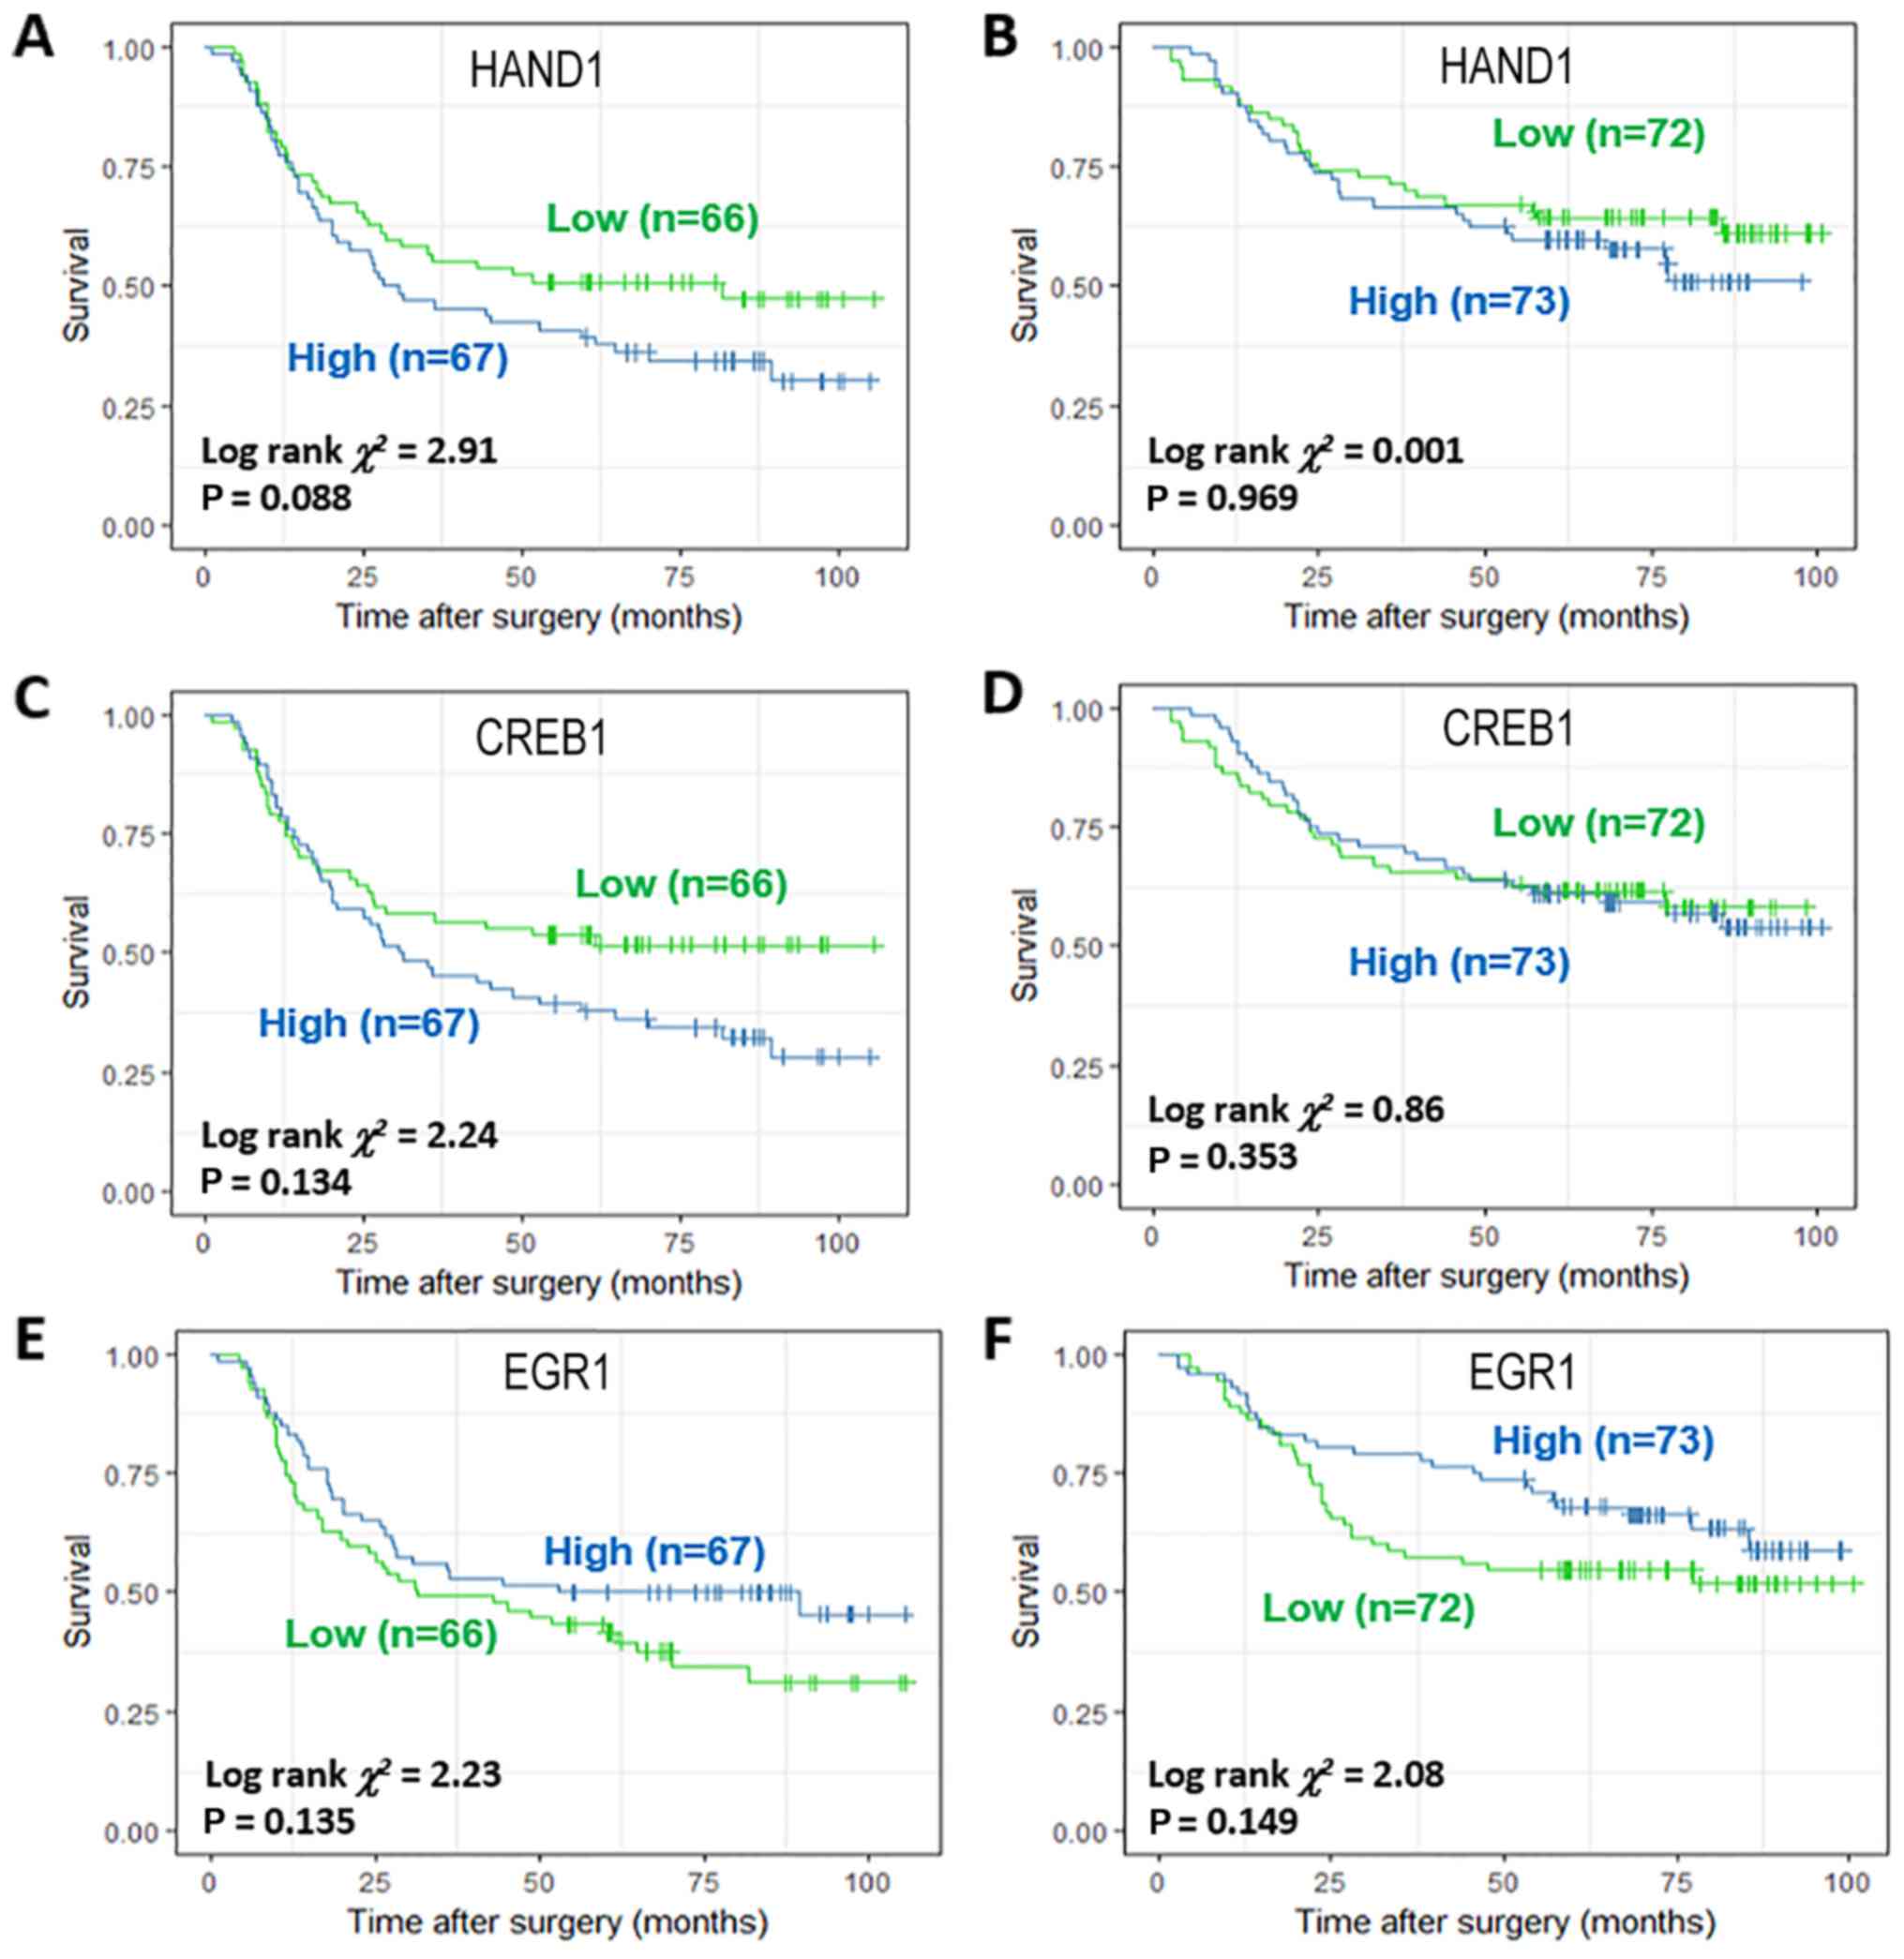
potential prognostic value in IT GC (Fig. 5E and F). Meanwhile, heart and
neural crest derivatives expressed 1 (HAND1) and CREB1 were also
identified to be potential prognostic factors in DF GC (Fig. 6A-D), whereas EGR1 was identified to
have potential prognostic value in IT GC (Fig. 6E and F).
Cox proportional hazards model was also applied and
respectively implemented for the aforementioned genes. NFYA [hazard
ratio (HR) (95% confidence interval, CI)=0.560 (0.349, 0.900),
P=0.017] and SRY [HR (95% CI)=0.603 (0.375, 0.969), P=0.037] were
identified as independent prognostic factors in DF GC (Tables II and III), whereas TLX1 [HR (95% CI)=0.547
(0.321, 0.9325), P=0.027] was identified as an independent
prognostic factor in IT GC (Table
IV). Conversely, EGR1 was not associated with prognosis in
either DF or IT GC (Table V).
| Table IIIndependent prognostic value of NFYA
in diffuse and intestinal gastric cancer. |
Table II
Independent prognostic value of NFYA
in diffuse and intestinal gastric cancer.
| Variable | Diffuse gastric
cancer
| Intestinal gastric
cancer
|
|---|
| HR (95% CI) | P-value | HR (95% CI) | P-value |
|---|
| NFYA (negative vs.
positive) | 0.560 (0.349,
0.900) | 0.017 | Variable
eliminated | |
| Sex (male vs.
female) | Variable
eliminated | | 2.088 (1.040,
4.191) | 0.038 |
| Age | 1.029 (1.009,
1.049) | 0.005 | 1.059 (1.023,
1.096) | 0.001 |
| Stage | | | | |
| Stage III vs.
I/II | 2.286 (1.086,
4.812) | 0.029 | Variable
eliminated | |
| Stage IV vs.
I/II | 13.002 (6.213,
27.210) | <0.001 | Variable
eliminated | |
| T (3 and 4 vs. 1
and 2) | Variable
eliminated | | 3.365 (1.956,
5.788) | <0.001 |
| N (positive vs.
negative) | Variable
eliminated | | 1.483 (1.093,
2.012) | 0.011 |
| M (positive vs.
negative) | Variable
eliminated | | 2.520 (0.851,
7.460) | 0.095 |
| Overall Cox
model | | <0.001 | | <0.001 |
| Table IIIIndependent prognostic value of SRY
in diffuse and intestinal gastric cancer. |
Table III
Independent prognostic value of SRY
in diffuse and intestinal gastric cancer.
| Variable | Diffuse gastric
cancer
| Intestinal gastric
canc0er
|
|---|
| HR (95% CI) | P-value | HR (95% CI) | P-value |
|---|
| SRY (negative vs.
positive) | 0.603 (0.375,
0.969) | 0.037 | Variable
eliminated | |
| Sex (male vs.
female) | Variable
eliminated | | 2.088 (1.040,
4.191) | 0.038 |
| Age | 1.021 (1.002,
1.040) | 0.029 | 1.059 (1.023,
1.096) | 0.001 |
| Stage | | | | |
| Stage III vs.
I/II | 1.867 (0.833,
4.186) | 0.129 | Variable
eliminated | |
| Stage IV vs.
I/II | 7.739 (2.923,
20.494) | <0.001 | Variable
eliminated | |
| T (3 and 4 vs. 1
and 2) | Variable
eliminated | | 3.365 (1.956,
5.788) | <0.001 |
| N (positive vs.
negative) | 1.421 (0.961,
2.100) | 0.078 | 1.483 (1.093,
2.012) | 0.011 |
| M (positive vs.
negative) | Variable
eliminated | | 2.520 (0.851,
7.460) | 0.095 |
| Overall Cox
model | | <0.001 | | |
| Table IVIndependent prognostic value of TLX1
in diffuse and intestinal gastric cancer. |
Table IV
Independent prognostic value of TLX1
in diffuse and intestinal gastric cancer.
| Variable | Diffuse gastric
cancer
| Intestinal gastric
cancer
|
|---|
| HR (95% CI) | P-value | HR (95% CI) | P-value |
|---|
| TLX1 (negative vs.
positive) | Variable
eliminated | | 0.547 (0.321,
0.9325) | 0.027 |
| Sex (male vs.
female) | Variable
eliminated | | 1.924 (0.964,
3.840) | 0.064 |
| Age | 1.023 (1.003,
1.042) | 0.020 | 1.069 (1.032,
1.107) | <0.001 |
| Stage | | | | |
| Stage III vs.
I/II | 2.190 (1.041,
4.610) | 0.039 | Variable
eliminated | |
| Stage IV vs.
I/II | 12.976 (6.214,
27.099) | <0.001 | Variable
eliminated | |
| T (3 and 4 vs. 1
and 2) | Variable
eliminated | | 3.194 (1.871,
5.453) | <0.001 |
| N (positive vs.
negative) | Variable
eliminated | | 1.645 (1.213,
2.231) | 0.001 |
| M (positive vs.
negative) | Variable
eliminated | | Variable
eliminated | |
| Overall Cox
model | | <0.001 | | |
| Table VIndependent prognostic value of EGR1
in diffuse and intestinal gastric cancer. |
Table V
Independent prognostic value of EGR1
in diffuse and intestinal gastric cancer.
| Variable | Diffuse gastric
cancer
| Intestinal gastric
cancer
|
|---|
| HR (95% CI) | P-value | HR (95% CI) | P-value |
|---|
| EGR1 (negative vs.
positive) | Variable
eliminated | | Variable
eliminated | |
| Sex (male vs.
female) | Variable
eliminated | | 2.088 (1.040,
4.191) | 0.038 |
| Age | 1.023 (1.003,
1.042) | 0.020 | 1.059 (1.023,
1.096) | <0.001 |
| Stage | | | | |
| Stage III vs.
I/II | 2.190 (1.041,
4.610) | 0.039 | Variable
eliminated | |
| Stage IV vs.
I/II | 12.976 (6.214,
27.099) | <0.001 | Variable
eliminated | |
| T (3 and 4 vs. 1
and 2) | Variable
eliminated | | 3.365 (1.956,
5.788) | <0.001 |
| N (positive vs.
negative) | Variable
eliminated | | 1.483 (1.093,
2.012) | 0.011 |
| M (positive vs.
negative) | Variable
eliminated | | 2.520 (0.851,
7.460) | 0.095 |
| Overall Cox
model | | <0.001 | | <0.001 |
Investigation of the role of NFYA in DF-
and IT-derived GC cells
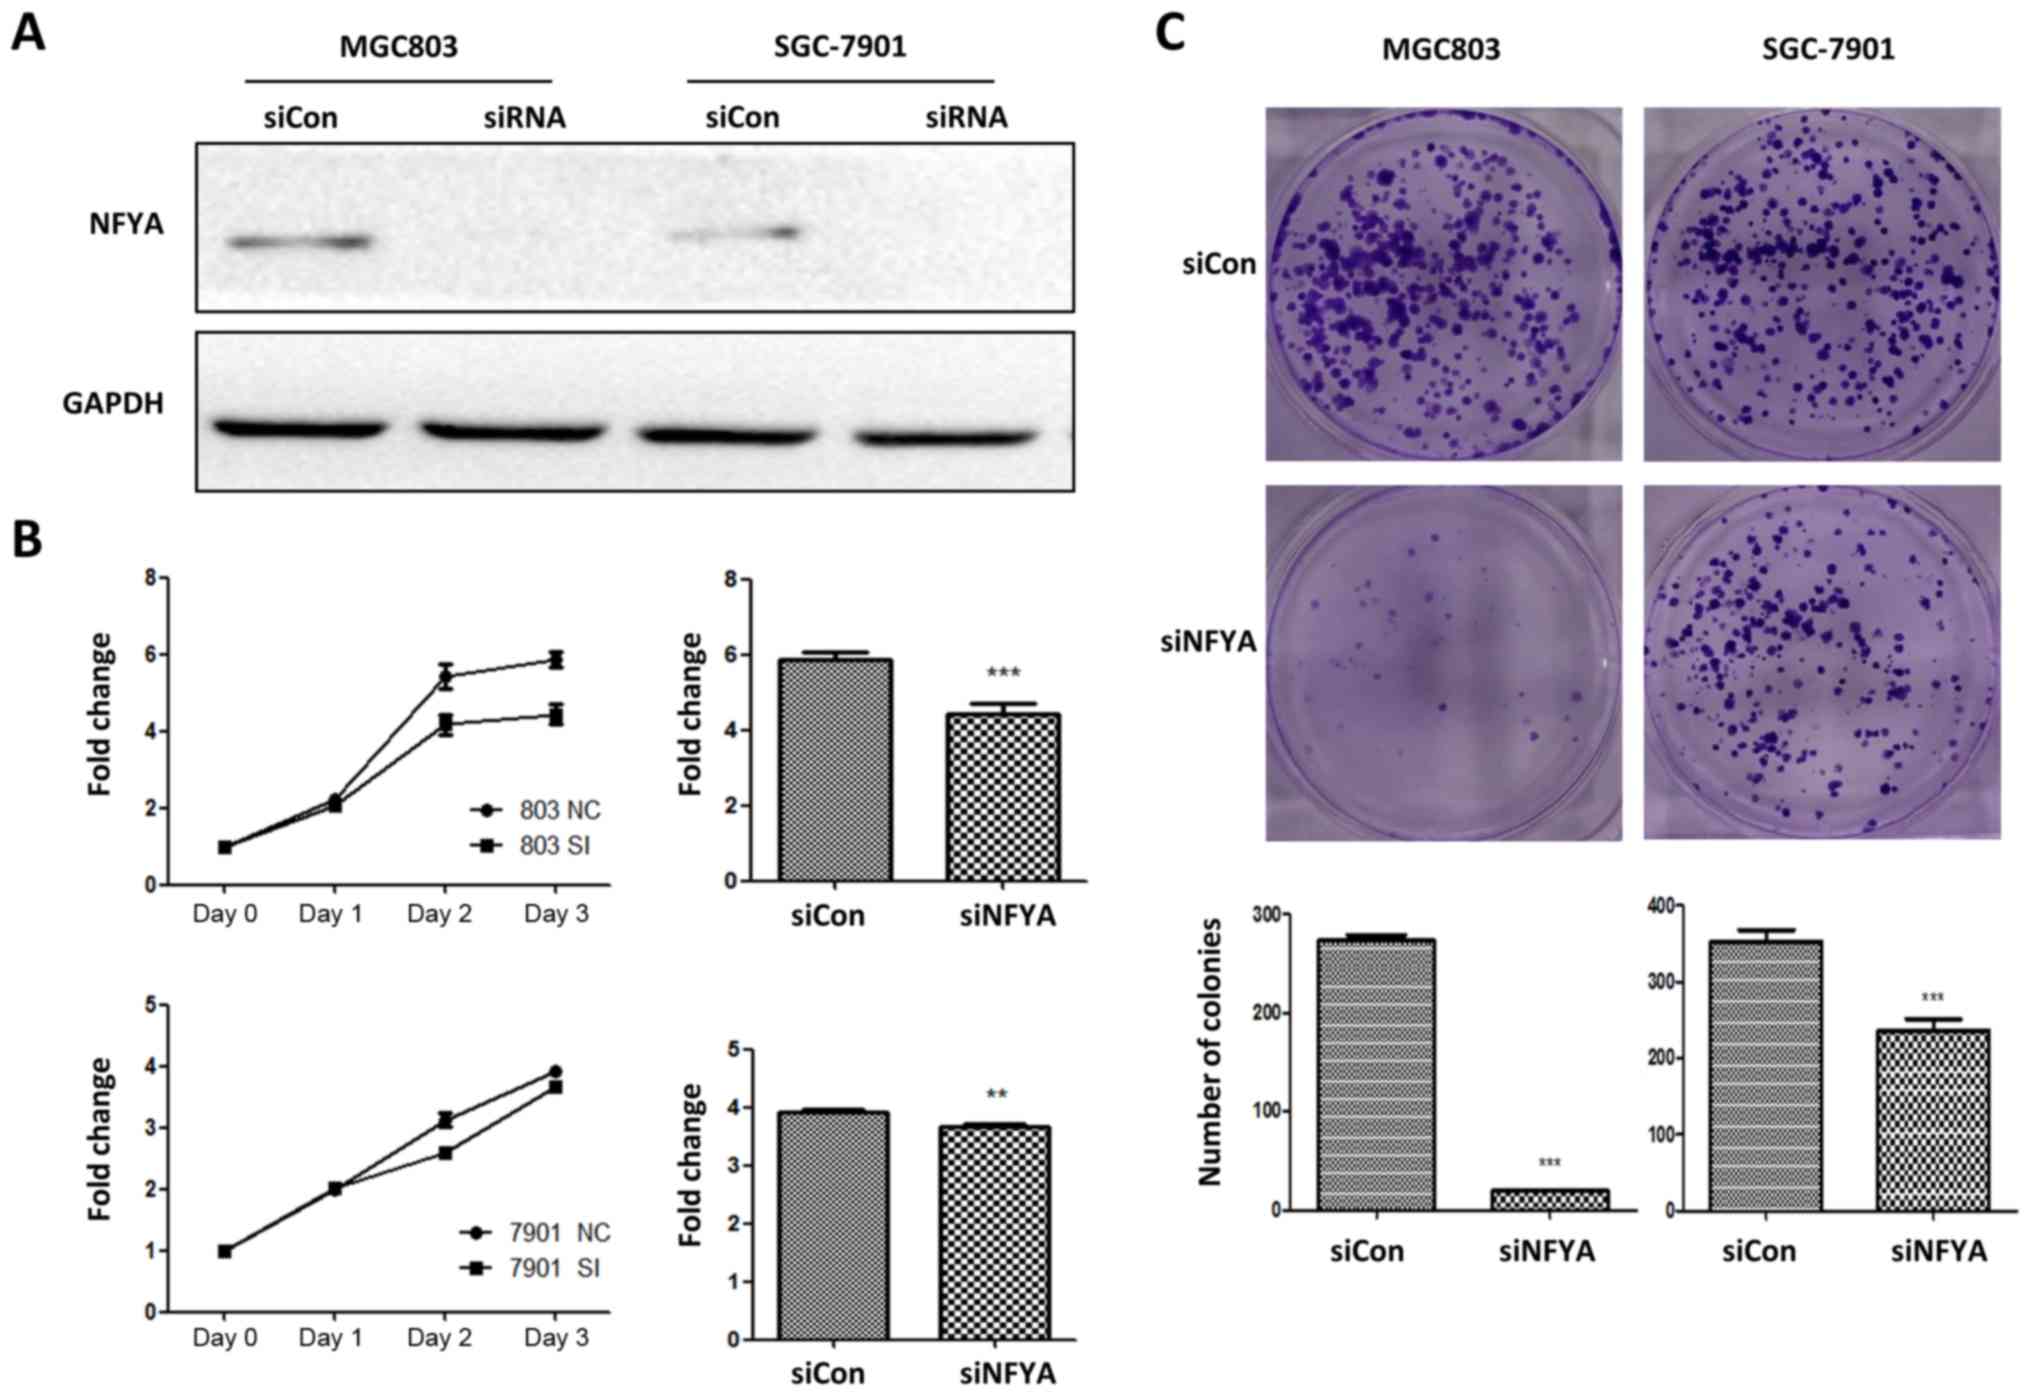
To confirm the biological function of NFYA in DF and
IT GC, NFYA expression was knocked down by siRNA in DF GC-derived
MGC803 cells and IT GC-derived SGC-7901 cells (Fig. 7A). CCK-8 assays indicated that
knockdown of NFYA expression markedly inhibited the rate of cell
growth in DF GC-derived MGC803 cells, and partially inhibited the
rate of cell growth in IT GC-derived SGC-7901 cells (Fig. 7B). Colony formation assays also
demonstrated that the colony formation abilities of DF GC-derived
MGC803 cells were nearly eliminated by NFYA siRNA (Fig. 7C). However, the colony formation
ability of IT GC-derived SGC-7901 cells was only partially
inhibited under the same conditions (Fig. 7C).
Discussion
The importance of the network construction approach
in the study of disease has been highlighted in various reports
(17,18). Gene networks have been demonstrated
to distinguish disease subtypes with more precision and accuracy,
compared with single gene biomarkers (19). Integrative methods incorporating
several sources of data to model biological processes, particularly
TF-target regulatory networks, have shown promise in providing
novel perspectives to understand the underlying pathophysiological
mechanisms in disease, as well as in the development of novel and
precise therapies (19,20). Numerous tools, including PANDA
(21), SEmi-supervised REgulatory
Network Discoverer (33),
ReMoDiscovery (34), context
likelihood of relatedness (35),
and C3Net (36), have been
developed to integrate data from different levels and construct
TF-target regulatory networks. Among all well-known methods, PANDA
has been demonstrated to have higher accuracy and performance in a
previous study (21).
Although the gene expression patterns of DF and IT
GC were investigated in our previous research (16), studies addressing the TF-target
regulatory spectrums of GC subtypes are required. In the present
study, based on a publicly available GC cohort (25), genome-wide, condition-specific
TF-target regulatory relationships of DF and IT GC were predicted
using PANDA, by integrating known PPI, gene expression and sequence
motif data of TFs. Furthermore, the biological function of NFYA in
DF GC-derived MGC803 cells and IT GC-derived SGC-7901 cells was
verified.
The results demonstrated that >85% of TF-target
regulatory relationships were shared among all DF, IT and MX
subtypes of GC, suggesting strong conservation. It is therefore
reasonable to suggest that TF-target edges were conserved,
considering these networks were constructed using the same motif
data. These results were also in accordance with previous studies
using PANDA software (22,24). Upon further investigation of the
target genes of DF-specific and IT-specific edges, there were
extremely small and limited overlaps with differentially expressed
genes, which were identified in our previous study (16). This finding suggested that
transcriptional alterations were predominantly caused by
differential TF expression, rather than these specific TF-target
regulatory relationships.
The majority of TFs enriched in DF-specific edges
were also enriched in IT-specific edges, based on a hypergeometric
distribution model. Therefore, to further reveal the differences in
TF activity, the AnaPANDA algorithm was applied. A total of 13 TFs,
including NFYA and FOXL1, were activated in DF GC, and eight TFs,
including RELA and TLX1, were activated in IT GC. By evaluating
these genes with survival analyses, four genes were identified as
DF subtype-specific biomarkers and two genes were identified as IT
subtype- specific biomarkers.
In the present study, NFYA, SRY, HAND1 and CREB1
were verified as DF-specific prognostic markers in GC. NFYA is one
subunit of a TF complex, which has been demonstrated to activate
metabolic pathways in cancer cells (37). SRY is a TF that initiates the
development of male sex; SRY may also participate in cancer cell
differentiation and the acquisition of cancer stem cell-like
properties (38). HAND1 has an
essential role in cardiac morphogenesis and has been confirmed as a
biomarker in medulloblastoma (39), although, to the best of our
knowledge, it has not been studied in other types of cancer. CREB1
may negatively regulate carbonic anhydrase IX in GC (40). In the present study, TLX1 and EGR1
were identified as IT-specific prognostic markers in GC. TLX1
participates in normal development of the spleen during
embryogenesis. Dadi et al (41) reported that TLX1 is involved in
tumor immunology processes, including T-cell maturation arrest in
T-cell acute lymphoblastic leukaemia. EGR1 is a differentiation and
mitogenesis-associated TF. In GC, EGR1 has been demonstrated to be
important in tumor invasion, metastasis and heparanase
transcription (42). Most of these
TFs have not previously been considered as prognostic markers in
GC. Therefore, the present findings provided novel insights into
the discovery of specific biomarkers in certain subtypes of GC.
Specifically, NFYA was selected for validation of biological
function in DF GC-derived MGC803 cells and IT GC-derived SGC-7901
cells. Both CCK-8 and colony formation assays confirmed that
knockdown of NFYA resulted in more marked effects on cell growth
and colony formation in DF GC-derived cells, compared with IT
GC-derived cells. This in vitro experiment further confirmed
that NFYA was a specific independent prognostic factor in DF GC,
but not in IT GC.
In conclusion, by combining network topologies and
gene expression data, TF-target regulatory networks for DF, IT and
MX GCs were constructed. It was demonstrated that different
subtypes of GC contained different gene regulatory networks and TF
activation patterns. Additionally, it was revealed that the same
TFs had different biological effects in distinct GC subtypes.
Specifically, NFYA was suggested as a DF subtype- specific
independent prognostic factor in GC.
Funding
The present study was supported by the National
Natural Science Foundation of China (grant nos. 81702314,
81670474).
Availability of data and materials
The datasets generated and analyzed during the
current study are available in the Gene Expression Omnibus website
(www.ncbi.nlm.nih.gov/geo/). Data
regarding the biological function of NFYA in DF and IT GC analyzed
during the current study are available from the corresponding
author on reasonable request.
Authors’ contributions
BC and LM performed the bioinformatics analysis. YZ
carried out the cell line experiments. LM, SZhu and SZhang
conceived and designed the study. YZ, HL, SG and JX helped to
collect and reformat the primary data. XQ and ZZ helped to analyze
the data and revised the manuscript. BC and LM drafted the
manuscript. All authors read and approved the final manuscript.
Ethics approval and consent to
participate
Not applicable.
Patient consent for publication
Not applicable.
Competing interests
The authors declare that they have no competing
interests.
Abbreviations:
|
GC
|
gastric cancer
|
|
PANDA
|
Passing Attributes between Networks
for Data Assimilation
|
|
TF
|
transcription factor
|
|
DF
|
diffuse
|
|
MX
|
mixed
|
|
PPI
|
protein-protein interaction
|
|
OS
|
overall survival
|
|
NFYA
|
nuclear transcription factor Y subunit
α
|
|
RELA
|
RELA proto-oncogene
|
|
FOXL1
|
forkhead box L1
|
|
SRY
|
sex determining region Y
|
|
NKX3
|
NK3 homeobox
|
|
CREB1
|
cAMP responsive element binding
protein 1
|
|
TFAP2A
|
transcription factor AP-2α
|
|
EGR1
|
early growth response 1
|
|
SP1
|
Sp1 transcription factor
|
|
HAND1
|
heart and neural crest derivatives
expressed 1
|
|
TLX1
|
T-cell leukemia homeobox 1
|
Acknowledgments
The authors would like to thank the Gene Expression
Omnibus data repository for public access to the database.
References
|
1
|
Torre LA, Bray F, Siegel RL, Ferlay J,
Lortet-Tieulent J and Jemal A; Global cancer statistics: 2012.CA
Cancer J Clin. 65:87–108. 2015. View Article : Google Scholar
|
|
2
|
Chen W, Zheng R, Baade PD, Zhang S, Zeng
H, Bray F, Jemal A, Yu XQ and He J; Cancer statistics in China:
2015.CA Cancer J Clin. 66:115–132. 2016. View Article : Google Scholar
|
|
3
|
Wong SS, Kim KM, Ting JC, Yu K, Fu J, Liu
S, Cristescu R, Nebozhyn M, Gong L, Yue YG, et al: Genomic
landscape and genetic heterogeneity in gastric adenocarcinoma
revealed by whole-genome sequencing. Nat Commun. 5:54772014.
View Article : Google Scholar : PubMed/NCBI
|
|
4
|
Lauren T: The two histological main types
of gastric carcinoma, an attempt at a histoclinical classification.
Acta Pathol Microbiol Scand. 64:191965. View Article : Google Scholar
|
|
5
|
Hartgrink HH, Jansen EP, van Grieken NC
and van de Velde CJ: Gastric cancer. Lancet. 374:477–490. 2009.
View Article : Google Scholar : PubMed/NCBI
|
|
6
|
He Z and Li B: Recent progress in genetic
and epigenetic profile of diffuse gastric cancer. Cancer Transl
Med. 1:80–93. 2015. View Article : Google Scholar
|
|
7
|
Shah MA, Khanin R, Tang L, Janjigian YY,
Klimstra DS, Gerdes H and Kelsen DP: Molecular classification of
gastric cancer: A new paradigm. Clin Cancer Res. 17:2693–2701.
2011. View Article : Google Scholar : PubMed/NCBI
|
|
8
|
Fléjou JF: WHO Classification of digestive
tumors: The fourth edition. Ann Pathol. 31(Suppl 5): pp. S27–S31.
2011, (In French). View Article : Google Scholar
|
|
9
|
Palli D, Bianchi S, Cipriani F, Duca P,
Amorosi A, Avellini C, Russo A, Saragoni A, Todde P and Valdes E:
Reproducibility of histologic classification of gastric cancer. Br
J Cancer. 63:765–768. 1991. View Article : Google Scholar : PubMed/NCBI
|
|
10
|
Jinawath N, Furukawa Y, Hasegawa S, Li M,
Tsunoda T, Satoh S, Yamaguchi T, Imamura H, Inoue M, Shiozaki H, et
al: Comparison of gene-expression profiles between diffuse- and
intestinal-type gastric cancers using a genome-wide cDNA
microarray. Oncogene. 23:6830–6844. 2004. View Article : Google Scholar : PubMed/NCBI
|
|
11
|
Lee YS, Cho YS, Lee GK, Lee S, Kim YW, Jho
S, Kim HM, Hong SH, Hwang JA, Kim SY, et al: Genomic profile
analysis of diffuse-type gastric cancers. Genome Biol. 15:R552014.
View Article : Google Scholar : PubMed/NCBI
|
|
12
|
Tanabe S, Aoyagi K, Yokozaki H and Sasaki
H: Gene expression signatures for identifying diffuse-type gastric
cancer associated with epithelial-mesenchymal transition. Int J
Oncol. 44:1955–1970. 2014. View Article : Google Scholar : PubMed/NCBI
|
|
13
|
Förster S, Gretschel S, Jöns T, Yashiro M
and Kemmner W: THBS4, a novel stromal molecule of diffuse-type
gastric adenocarcinomas, identified by transcriptome-wide
expression profiling. Mod Pathol. 24:1390–1403. 2011. View Article : Google Scholar : PubMed/NCBI
|
|
14
|
Kim B, Bang S, Lee S, Kim S, Jung Y, Lee
C, Choi K, Lee SG, Lee K, Lee Y, et al: Expression profiling and
subtype-specific expression of stomach cancer. Cancer Res.
63:8248–8255. 2003.PubMed/NCBI
|
|
15
|
Yoon C, Cho SJ, Aksoy BA, Park DJ, Schultz
N, Ryeom S and Yoon SS: Chemotherapy resistance in diffuse type
gastric adenocarcinoma is mediated by RhoA activation in cancer
stem-like cells. Clin Cancer Res. 22:971–983. 2016. View Article : Google Scholar :
|
|
16
|
Min L, Zhao Y, Zhu S, Qiu X, Cheng R, Xing
J, Shao L, Guo S and Zhang S: Integrated analysis identifies
molecular signatures and specific prognostic factors for different
gastric cancer subtypes. Transl Oncol. 10:99–107. 2017. View Article : Google Scholar :
|
|
17
|
Ritchie MD, Holzinger ER, Li R,
Pendergrass SA and Kim D: Methods of integrating data to uncover
genotype-phenotype interactions. Nat Rev Genet. 16:85–97. 2015.
View Article : Google Scholar : PubMed/NCBI
|
|
18
|
Vaquerizas JM, Kummerfeld SK, Teichmann SA
and Luscombe NM: A census of human transcription factors: Function,
expression and evolution. Nat Rev Genet. 10:252–263. 2009.
View Article : Google Scholar : PubMed/NCBI
|
|
19
|
Buckingham M and Rigby PW: Gene regulatory
networks and transcriptional mechanisms that control myogenesis.
Dev Cell. 28:225–238. 2014. View Article : Google Scholar : PubMed/NCBI
|
|
20
|
Banks CA, Lee ZT, Boanca G,
Lakshminarasimhan M, Groppe BD, Wen Z, Hattem GL, Seidel CW,
Florens L and Washburn MP: Controlling for gene expression changes
in transcription factor protein networks. Mol Cell Proteomics.
13:1510–1522. 2014. View Article : Google Scholar : PubMed/NCBI
|
|
21
|
Glass K, Huttenhower C, Quackenbush J and
Yuan GC: Passing messages between biological networks to refine
predicted interactions. PLoS One. 8:pp. e648322013, View Article : Google Scholar : PubMed/NCBI
|
|
22
|
Lao T, Glass K, Qiu W, Polverino F, Gupta
K, Morrow J, Mancini JD, Vuong L, Perrella MA, Hersh CP, et al:
Haploinsufficiency of Hedgehog interacting protein causes increased
emphysema induced by cigarette smoke through network rewiring.
Genome Med. 7:122015. View Article : Google Scholar : PubMed/NCBI
|
|
23
|
Glass K, Quackenbush J, Spentzos D,
Haibe-Kains B and Yuan GC: A network model for angiogenesis in
ovarian cancer. BMC Bioinformatics. 16:1152015. View Article : Google Scholar : PubMed/NCBI
|
|
24
|
Min L, Zhang C, Qu L, Huang J, Jiang L,
Liu J, Pinello L, Yuan GC and Shou C: Gene regulatory pattern
analysis reveals essential role of core transcriptional factors’
activation in triple- negative breast cancer. Oncotarget.
8:21938–21953. 2017. View Article : Google Scholar : PubMed/NCBI
|
|
25
|
Cristescu R, Lee J, Nebozhyn M, Kim K-M,
Ting JC, Wong SS, Liu J, Yue YG, Wang J, Yu K, et al: Molecular
analysis of gastric cancer identifies subtypes associated with
distinct clinical outcomes. Nat Med. 21:449–456. 2015. View Article : Google Scholar : PubMed/NCBI
|
|
26
|
Irizarry RA, Hobbs B, Collin F,
Beazer-Barclay YD, Antonellis KJ, Scherf U and Speed TP:
Exploration, normalization, and summaries of high density
oligonucleotide array probe level data. Biostatistics. 4:249–264.
2003. View Article : Google Scholar : PubMed/NCBI
|
|
27
|
Workman C, Jensen LJ, Jarmer H, Berka R,
Gautier L, et al: A new non-linear normalization method for
reducing variability in DNA microarray experiments. Genome Biol:
Aug. 30:pp. 2002Epub ahead of print.
|
|
28
|
Li C and Wong WH: Model-based analysis of
oligonucleotide arrays: Expression index computation and outlier
detection. Proc Natl Acad Sci USA. 98:31–36. 2001. View Article : Google Scholar : PubMed/NCBI
|
|
29
|
Wu C, Macleod I and Su AI: BioGPS and
MyGene.info: Organizing online, gene-centric information. Nucleic
Acids Res. 41:D561–D565. 2013. View Article : Google Scholar :
|
|
30
|
Mathelier A, Fornes O, Arenillas DJ, Chen
CY, Denay G, Lee J, Shi W, Shyr C, Tan G, Worsley-Hunt R, et al:
JASPAR 2016: A major expansion and update of the open-access
database of transcription factor binding profiles. Nucleic Acids
Res. 44:D110–D115. 2016. View Article : Google Scholar :
|
|
31
|
Zhao Y, Min L, Xu C, Shao L, Guo S, Cheng
R, Xing J, Zhu S and Zhang S: Construction of disease-specific
transcriptional regulatory networks identifies co-activation of
four gene in esophageal squamous cell carcinoma. Oncol Rep.
38:411–417. 2017. View Article : Google Scholar : PubMed/NCBI
|
|
32
|
Ravasi T, Suzuki H, Cannistraci CV,
Katayama S, Bajic VB, Tan K, Akalin A, Schmeier S,
Kanamori-Katayama M, Bertin N, et al: An atlas of combinatorial
transcriptional regulation in mouse and man. Cell. 140:744–752.
2010. View Article : Google Scholar : PubMed/NCBI
|
|
33
|
Ernst J, Beg QK, Kay KA, Balázsi G, Oltvai
ZN and Bar-Joseph Z: A semi-supervised method for predicting
transcription factor- gene interactions in Escherichia coli. PLoS
Comput Biol. 4:pp. e10000442008, View Article : Google Scholar
|
|
34
|
Lemmens K, Dhollander T, De Bie T,
Monsieurs P, Engelen K, Smets B, Winderickx J, De Moor B and
Marchal K: Inferring transcriptional modules from ChIP-chip, motif
and microarray data. Genome Biol. 7:R372006. View Article : Google Scholar : PubMed/NCBI
|
|
35
|
Faith JJ, Hayete B, Thaden JT, Mogno I,
Wierzbowski J, Cottarel G, Kasif S, Collins JJ and Gardner TS:
Large-scale mapping and validation of Escherichia coli
transcriptional regulation from a compendium of expression
profiles. PLoS Biol. 5:e82007. View Article : Google Scholar : PubMed/NCBI
|
|
36
|
Altay G and Emmert-Streib F: Structural
influence of gene networks on their inference: Analysis of C3NET.
Biol Direct. 6:312011. View Article : Google Scholar : PubMed/NCBI
|
|
37
|
Benatti P, Chiaramonte ML, Lorenzo M,
Hartley JA, Hochhauser D, Gnesutta N, Mantovani R, Imbriano C and
Dolfini D: NF-Y activates genes of metabolic pathways altered in
cancer cells. Oncotarget. 7:1633–1650. 2016. View Article : Google Scholar :
|
|
38
|
Murakami S, Ninomiya W, Sakamoto E,
Shibata T, Akiyama H and Tashiro F: SRY and OCT4 are required for
the acquisition of cancer stem cell-like properties and are
potential differentiation therapy targets. Stem Cells.
33:2652–2663. 2015. View Article : Google Scholar : PubMed/NCBI
|
|
39
|
Asuthkar S, Gogineni VR, Rao JS and
Velpula KK: Nuclear translocation of Hand-1 acts as a molecular
switch to regulate vascular radiosensitivity in medulloblastoma
tumors: The protein uPAR is a cytoplasmic sequestration factor for
Hand-1. Mol Cancer Ther. 13:1309–1322. 2014. View Article : Google Scholar : PubMed/NCBI
|
|
40
|
Wang G, Cheng Z, Liu F, Zhang H, Li J and
Li F: CREB is a key negative regulator of carbonic anhydrase IX
(CA9) in gastric cancer. Cell Signal. 27:1369–1379. 2015.
View Article : Google Scholar
|
|
41
|
Dadi S, Le Noir S, Payet-Bornet D,
Lhermitte L, Zacarias- Cabeza J, Bergeron J, Villarèse P, Vachez E,
Dik WA, Millien C, et al: TLX homeodomain oncogenes mediate T cell
maturation arrest in T-ALL via interaction with ETS1 and
suppression of TCRα gene expression. Cancer Cell. 21:563–576. 2012.
View Article : Google Scholar : PubMed/NCBI
|
|
42
|
Zheng L, Pu J, Jiang G, Weng M, He J, Mei
H, Hou X and Tong Q: Abnormal expression of early growth response 1
in gastric cancer: Association with tumor invasion, metastasis and
heparanase transcription. Pathol Int. 60:268–277. 2010. View Article : Google Scholar : PubMed/NCBI
|