Introduction
Head and neck cancer is the seventh most common type
of cancer worldwide, and oral squamous cell carcinoma (OSCC)
accounts for >90% of these cases (1,2).
OSCC is usually aggressive and highly invasive and is associated
with a high recurrence rate, as well as with metastasis of the
lymph nodes (3). As a result, the
vast majority of patients with OSCC have a poor prognosis, and,
despite advances in the understanding of the molecular and genetic
mechanisms driving OSCC malignancy, the 5-year-survival rate has
not shown any significant improvement (3,4).
Previous studies have demonstrated that OSCC,
similar to other solid malignant tumours, has a small subpopulation
of cells designated as cancer stem cells (CSCs). These cells are
characterised by the ability to self-renew indefinitely, in
addition to giving rise to transient and differentiated cells which
comprise the bulk of the tumour (5-7).
CSCs are therefore associated with recurrence and therapeutic
resistance, and participate in OSCC metastasis due to their
capability to undergo epithelial to mesenchymal transition (EMT)
(8-10).
CSCs in OSCC were first identified and isolated by
Prince et al based on their high expression levels of CD44,
a cell surface glycoprotein that acts as a receptor for hyaluronic
acid (5). Upon binding to its
ligand, CD44 can activate different signalling pathways which
regulate a wide variety of cellular processes, including adhesion,
proliferation, motility, apoptosis, survival and resistance to
therapy (11). Subsequently,
additional CSC markers were identified and used alone or in
combination with CD44, including CD133 (12), epidermal growth factor receptor
(EGFR) (13), ESA (14), CD24 (15) and aldehyde dehydrogenase 1 (ALDH1)
(16). Most importantly, recent
studies on CSC plasticity have demonstrated that this subpopulation
exists in more than one phenotype; the association of CD44 with
different markers has permitted the identification of distinct
subtypes of CSCs. Biddle et al (2011) demonstrated that
cells expressing high levels of CD44 (CD44high) cells
can be separated, based on epithelial-cell adhesion molecule
(EpCAM)/ESA levels, into two cellular phenotypes. These phenotypes
present significant differences in proliferation rates, cell
motility and morphology in addition to colony- and sphere-forming
ability (14).
CD44high/ESAhigh cells exhibit an epithelial
morphology and an increased proliferative ability, while
CD44high/ESAlow cells are migratory and
undergo EMT.
Signalling pathways that control stem cell
self-renewal and differentiation are aberrantly activated in CSCs
and include the Notch, Sonic Hedgehog (SHH) and Wnt pathways. All
these pathways frequently interact with other cellular signalling
pathways closely related to tumour development and progression,
such as nuclear factor (NF)-κB, mitogen-activated protein kinase
(MAPK), phosphoinositide 3-kinase (PI3K) and epidermal growth
factor (EGF) (17). Thus, the
identification of the crucial pathways necessary for CSC
maintenance represents an important therapeutic target with may be
used to block CSC proliferation and self-renewal and, consequently,
tumour progression.
In this context, the SHH/Patched/Gli (SHH/PTCH/GLI)
pathway, involved in the patterning, growth, differentiation and
survival of normal stem cells also plays an important role in CSCs;
it provides proliferative cues that enable the cells to accumulate
oncogenic mutations that drive self-renewal, metastasis and
therapeutic resistance (17,18).
This signalling pathway initiates with the binding of Hedgehog
proteins (Sonic, Desert and Indian HH) to the transmembrane
receptor, PTCH. This receptor, in the absence of the Hedgehog
ligands, inhibits signal transduction by repressing the Smoothened
(SMO) transmembrane receptor (18,19),
which acts as a potent pathway activator. Following HH binding,
PTCH is internalised and degraded, thus allowing SMO to become
phosphorylated and activated (19); this in turn triggers an
intracellular signalling cascade that promotes the recruitment and
activation of GLI family transcription factors (20,21).
There are three GLI proteins in mammalian cells that
act in a specific manner to regulate tissue patterning, cell
proliferation and survival via positive and negative feedback
mechanisms depending on the context and cell-type (22,23).
GLI proteins can act as activators or repressors, depending on the
ratio of said proteins (24).
GLI1 is a transcriptional activator. GLI2 and
GLI3 genes function as either positive or negative
regulators according to their post-transcriptional and
post-translational modifications, e.g., via phosphorylation or
acetylation (25,26).
In the absence of a Shh ligand, GLI3 is cleaved from
its larger activated cytoplasmic form to a truncated repressor
nuclear form, which inhibits the signalling pathway (27). In adult haematopoiesis, a
progressive decrease in the Shh pathway is associated with
increased hematopoietic cellular fate and the transition from an
embryonic to a hematopoietic stem cell. In this context, GLI3 plays
a crucial role in mediating Shh pathway inhibition (28).
In cancer, SHH deregulated activation was
first described in nevoid basal cell carcinoma syndrome, where the
inherited loss-of-function mutations of the PTCH1 gene was
associated with tumour development (29,30).
Abnormal Shh signalling is now associated with the progression and
maintenance of several malignant tumours, e.g., glioblastomas, lung
cancer, prostate cancer and gastric cancer (24,31-34).
Additionally, it can participate in tumour development via somatic
mutations in upstream pathway proteins (SMO and PTC1),
overexpression of GLI transcription factors or in a
ligand-dependent manner (25).
In different cell types, HH/GLI activation
leads to the transcription of genes critical to tumour initiation
and maintenance. This pathway is associated with an increase in the
quantity of cell cycle proteins which are responsible for G1/S and
G2/M progression, mainly D-type cyclins and anti-apoptotic proteins
(35-37). Additionally, it participates in the
regulation of EMT by inhibiting E-cadherin and inducing N-cadherin
expression (37,38). Furthermore, GLI2
overexpression is associated with a decrease in E-cadherin
expression and an increase in SNAIL gene expression, as well
as with an increase in matrix metalloproteinase (MMP)2 and
integrin-beta-1-binding proteins (ICAP-1); all of which favour cell
invasion and metastasis (39).
Some studies have demonstrated that the Shh
signalling pathway is upregulated in CSCs. The activation of these
pathways in breast CSCs increases GLI expression and leads
to an enhanced SOX2 and OCT4 expression, favouring
CSC maintenance (40). In gastric
cancer cell lines and tissues, CSCs identified by the
CD44+CD24+ phenotype have demonstrated an
overexpression of the SHH, PTCH1 and GLI3
genes (41). Zhang et al
demonstrated that in liver cancer, CD90+ CSCs with
GLI1 or GLI3 knockdown, exhibited low proliferation
rates, and decreased migratory ability and sphere formation
capacity, as well as a decrease in tumour formation in vivo;
indicating that both genes are relevant to the maintenance of the
stem cell properties observed in CD90+ cancer cells
(42).
In oral cancer, the increased expression of
GLI1, PTC1, SMO and SHH has been
observed in OSCC samples when compared to non-tumour oral mucosa
(43,44). Moreover, both SHH and
GLI1 have been shown to be associated with lymph node
metastasis, but only GLI1 expression has been shown to be
associated with tumour recurrence, clinical stage and lower 5-year
survival rates (39). Schneider
et al also observed the overexpression of all Hh signalling
pathway proteins in OSCC and found that a high Shh expression was
also associated with a poor overall survival (45). Concordant with this, an in
vitro study demonstrated that the inhibition of SHH was
associated with a significant decrease in tumour growth, as well as
in angiogenesis and osteoclastic activity in a mouse model of OSCC
bone invasion (46). GLI1
or GLI2 loss of function increases apoptosis and DNA
fragmentation and also promotes keratin 17 upregulation, which in
turn promotes cell growth (47).
The current study investigated, in vitro, the
differential expression of genes involved in stem cell signalling
pathways in OSCC CSC-like cells (CSCLCs), as well as the effects of
GLI3 knockdown on cellular proliferation, invasion and
stemness. Furthermore, GLI3 protein expression was also evaluated
in OSCC and non-tumour tissues and its association with the patient
clinicopathological parameters and overall survival was examined.
To the best of our knowledge, this is the first study to
investigate the role of GLI3 in OSCC.
Materials and methods
Cell lines
SCC4 (CRL-1624™) and SCC9 (CRL-1629™) human tongue
squamous cell carcinoma cell lines were obtained from the American
Type Culture Collection (ATCC, Manassas, VA, USA). The cells were
cultivated in DMEM/F12 (Invitrogen; Thermo Fisher Scientific, Inc.,
Waltham, MA, USA) and supplemented with 10% fetal bovine serum
(FBS), 400 ng/ml hydrocortisone (Sigma-Aldrich; Merck KGaA,
Darmstadt, Germany), 100 μg/ml penicillin and 100
μg/ml streptomycin with 5% CO2 at 37°C.
Flow cytometry
Fluorescent-activated cell sorting (FACS) was
performed using a FACSAria II flow cytometer (BD Biosciences, San
Jose, CA, USA) and analysed using FACSDiva software (Diva version
6.1.1). Initially, the SCC4 and SCC9 cells were detached from the
cultures using Accutase™ cell detachment solution (SCR005;
MilliporeSigma, Burlington, MA, USA) at 37°C and stained with
anti-CD44 antibody (anti-CD44-FITC, clone G44-26, 1:100, 555478; BD
Biosciences) for 30 min in the dark. DAPI nuclear dye
(Sigma-Aldrich; Merck KGaA) was used at 200 ng/ml to exclude dead
cells and IgG2ak-FITC was used as an isotype control. The whole
population was fractioned into CD44high (CSCLC),
representing the top 5% of CD44-expressing cells, and
CD44low, corresponding to the bottom 5% of
differentiating cells. FACS-sorted CD44high and
CD44low subpopulations were then submitted to colony and
sphere formation, as well as gene expression assays for
stemness-related signalling pathways (PCR array) and markers
(qPCR).
Subsequently, the cells were co-stained with
anti-CD44 and anti-ESA antibodies (anti-ESA-PE, clone EBA-1, 1:100,
347198; BD Biosciences), for 30 min at room temperature, washed
with PBS, incubated with DAPI and analysed using a FACSCanto II
Flow cytometer (Diva software version 6.1.1; BD Biosciences) to
evaluate the CSCLC fractions representing both EMT-CSCLC
(CD44high/ESAlow) and non-EMT-CSCLC
(CD44high/ESAhigh).
Colony and sphere formation assays
To examine the clonogenic abilities of the SCC4 and
SCC9 subfractions (CD44high and CD44low), the
cells were plated at clonal density (100 cells/ml) in each well of
6-well plates and cultured for 14 days. Following fixation in 4%
paraformaldehyde, the cells were stained for 5 min at room
temperature with crystal violet (0.04% in 1% ethanol) and colonies
measuring at least 2 mm in diameter were counted visually.
To assess the capacity of the SCC4 and SCC9
subfractions for growth as tumour spheres in suspension,
1×10⁴ cells/ml were seeded in 24-well ultra-low
attachment plates per well (#3473; Corning, New York, NY, USA).
After 2 weeks, the number of tumour spheres >5 μm was
counted under a microscope at ×200 magnification (Carl Zeiss
Micro-Imaging GmbH, Jena, Germany).
PCR array
To assess the expression of genes related to
different stem cell signalling pathways in the CD44high
and CD44low cells from the SCC4 and SCC9 cells, we used
the commercially available Human Stem Cell Signalling
RT2 Profiler PCR Array (330231; Qiagen, Germantown, MD,
USA). Immediately after FACS, sorted cells were submitted to RNA
extraction using the RNeasy Mini kit following the manufacturer's
instructions (74104; Qiagen). cDNA was synthesized using 500 ng of
RNA with the aid of the RT2 First Strand kit (330401;
Qiagen). A list of genes on this PCR array is available at
https://www.qiagen.com/us/shop/pcr/primer-sets/rt2-profiler-pcr-arrays/?catno=PAHS-047Z#orderinginformation.
The relative expression level of the target gene in the
CD44high cells to that in the CD44low cells
was evaluated using the 2−ΔΔCq method (48) using the software RT2
Profiler PCR Array Data Analysis version 3.5 (Qiagen). This
software classifies the average threshold cycle of the gene as
follows: 'A' [relatively high (>30) in either the control or the
test sample, and is reasonably low in the other sample (<30)];
'B' [relatively high (>30), meaning that its relative expression
level is low, in both the control and test samples, and the P-value
for the fold change is either unavailable or relatively high
(P>0.05)]; 'C' [either not determined or greater than the
defined cut-off value (default 35), in both samples meaning that
its expression was undetected, making this fold change result
erroneous and uninterpretable] and 'OKAY'. Only genes classified as
'A' or 'OKAY' by the software and with a fold change >2 were
considered as overexpressed.
GLI3 knockdown
A total of 3×10⁵ SCC9 cells were
transfected with 4 shRNA-GLI3 sequences (Origene TG301348)
or shRNA-scrambled (Origene, Rockville, MD, USA) using
Lipofectamine 2000 (Invitrogen; Thermo Fisher Scientific, Inc.),
following the manufacturer's instructions. This cell line was
selected as we have previously observed that the SCC9 cell line, as
well as the CD44high and CD44low fractions
are able to form tumours in vivo (49). Transfected cells were selected in a
medium with 0.5 μg/ml of puromycin (Invitrogen; Thermo
Fisher Scientific, Inc.) for 21 days. The transfection efficiency
of the shRNA-GLI3 sequences was assessed by reverse
transcription-quantitative PCR (RT-qPCR) and western blot analysis
for GLI3. The sequence with the highest inhibition level of GLI3
protein was selected for further experiments. The SCC9 cells
transfected with shRNA-scrambled (control) and shRNA-GLI3 were
cultured further and subjected to colony and sphere formation, flow
cytometry, proliferation, invasion and apoptosis assays, as well as
to RT-qPCR for stemness-related genes. According to the
Constraint-based Multiple Alignment Tool (NCBI) there is 51%
homology between the GLI3 (NM_000168.5) and GLI2
(NM_005270.4) genes, 32% homology between the GLI3 and
GLI1 (NM_001160045.1) genes and 39% homology between the
GLI and GLI2 genes. OriGene guarantees that the
sequences in the shRNA expression cassettes are verified to
correspond to the target gene with 100% identity.
RNA extraction, cDNA synthesis and
RT-qPCR
RNA was extracted using the RNeasy® micro kit
(Qiagen) followed by the reverse transcription of 500 ng of total
RNA with the High Capacity cDNA Archive kit, according to the
manufacturer's instructions. qPCR was performed on an ABI 7500
real-time PCR system using SYBR®-Green mix (all from Applied
Biosystems, Foster City, CA, USA) and primers for CD44,
BMI1, POU5F1 (OCT4), CD133,
NANOG, Involucrin (IVL), S100A9
(Calgranulin B), SNAI2 (SLUG) and GAPDH
gene amplification, which was used for normalization of the target
gene. The qPCR cycling conditions were as follows: 95°C for 10 min,
(95°C for 15 sec, 60–62°C for 60 sec) (40 cycles), followed by
dissociation curve analysis. Positive samples used to generate a
standard curve included SCC9 (for CD44, BMI1 and
POU5F1 genes) and embryonic stem cells (for CD133 and
NANOG genes). Primer sequences were designed using the
GeneTool software (BioTools Inc., Edmonton, AB, Canada) and are
described in detail in Table I.
Gene expression was calculated by the 2−ΔΔCq method
(48) and the fold change values
were calculated by the ratio CD44high/CD44low
cells, as well as by the ratio SCC9-shRNA GLI3/SCC9 Control
for each gene.
 | Table IGenes evaluated by RT-qPCR, according
to GenBank access, primer sequence, melting temperature and product
size. |
Table I
Genes evaluated by RT-qPCR, according
to GenBank access, primer sequence, melting temperature and product
size.
| Gene | GenBank | Primers 5′→3′ | Temperature
(°C) | Product size
(bp) |
|---|
| POU5F1 | NM_001173531.1 | F:
acttcactgcactgtactcctc | 62 | 159 |
| | R:
aggttctctttccctagctcctc | | |
| NANOG | NM_024865.2 | F:
catcctgaacctcagctacaaaca | 62 | 99 |
| | R:
ttgctattcttcggccagttgt | | |
| CD133 | NM_001145848 | F:
ggcccagtacaacactacc | 62 | 71 |
| | R:
cgcctcctagcactgaatt | | |
| CD44 | NM_000610.3 | F:
caaccgttggaaacataacc | 60 | 226 |
| | R:
caagtgggaactggaacgat | | |
| BMI1 | NM_005180.8 | F:
gctgccaatggctctaatgaa | 60 | 189 |
| | R:
tgctgggcatcgtaagtatctt | | |
| SNAI1 | NM_003068.4 | F:
caaggaatacctcagcctgg | | |
| | R:
catctgagtgggtctggagg | 60 | 218 |
| S100A9 | NM_002965.3 | F:
aaagagctggtgcgaaaaga | | |
| | R:
gtgtccaggtcctccatgat | 60 | 92 |
| IVL | NM_005547.3 | F:
caagacattcaaccagccct | | |
| | R:
tagcggacccgaaataagtg | 60 | 185 |
| GAPDH | NM_001256799 | F:
gcatcctgggctacactga | | |
| | R:
ccaccaccctgttgctgta | 60 | 162 |
Western blot analysis
The cells were washed with cold PBS and lysed in
RIPA buffer (R0278; Sigma-Aldrich; Merck KGaA). Following
centrifugation at 20,800 x g at 4°C, protein concentrations were
measured using a protein assay according to the manufacturer's
instructions (BCA Protein kit; Pierce Biotechnology, Rockford, IL,
USA). A total of 30 μg of total protein per sample were
resolved by 8 or 10% sodium dodecyl sulphate polyacrylamide gel
electrophoresis (SDS-PAGE) under reducing conditions and
transferred onto nitrocellulose membranes. The membranes were
blocked for 1 h with 10% non-fat dry milk in TBS (20 mM Tris-HCl,
150 mM NaCl) containing 0.1% Tween-20, rinsed in the same buffer,
and incubated overnight with anti-GLI3 (1:500, ab6050; Abcam,
Cambridge, MA, USA) and anti-β-actin (1:10,000, A2228;
Sigma-Aldrich; Merck KGaA) antibodies. After washing, the membranes
were incubated for 1 h at room temperature with anti-rabbit IgG-HRP
(1:1,000, sc-2357) for GLI3 and with the anti-mouse m-IgGκ BP-HRP
(1:1,000, sc-516102) (both from Santa Cruz Biotechnology, Dallas,
TX, USA) for β-actin. The reactions were revealed using a
chemiluminescent western blot system (Enhanced Chemiluminescent
Western blot kit; GE Healthcare, Vienna, Austria).
Cell proliferation assays
The SCC9 control cells and SCC9 cells in which
GLI3 was knocked down (1×10³) were initially
plated in 24 well-plates and counted daily in a Neubauer chamber
(Celeromics, Cambridge, UK) for 5 days (24, 48, 72, 96 and 120 h).
Independent experiments were performed in triplicate and the mean
value, standard deviation and statistical analyses were calculated.
The bromodeoxyuridine (BrdU) labelling index was performed as
previously described by Rodrigues et al (50). In summary, the SCC9 control cells
and SCC9 in which GLI3 was knocked down were plated on
chamber slides and serum-starved for 48 h. After this period, cell
culture medium with 10% FBS was added and the cells were cultivated
for an additional 24 h. The cells were then incubated with BrdU
(1:100) for 2 h at 37°C and the reactions were revealed using the
BrdU Staining kit (both from Invitrogen; Thermo Fisher Scientific,
Inc.), according to the manufacturer's instructions. The
BrdU-positive cells were determined by counting 1,000 cells in 3
independent reactions using the Kontron 400 image analysis system
(Zeiss Axio Imager A1; Zeiss, Dublin, CA, USA).
Cell invasion assay
To analyse cell invasion, cell culture inserts with
an 8 -μm PET membrane coated with Matrigel (#354480,
Corning® BioCoat™ Matrigel® Invasion Chambers; Corning) were used.
The cells (1×10⁵) were suspended in serum-free DMEM/F12
and seeded onto the upper compartment of the Transwell chamber.
DMEM/F12 containing 5% FBS was used in the lower chamber as a
chemoattractant. Following 24 h of incubation, cells in the upper
chamber were removed and the inserts were fixed in 4%
paraformaldehyde followed by 20 min in methanol 100%. The cells on
the lower surface were stained for 5 min at room temperature with
crystal violet (0.04% in 1% ethanol; Sigma-Aldrich; Merck KGaA). A
cotton swab was used to mechanically removed cells that did not
migrate through the pores. Five random areas from each membrane
were photographed under ×400 magnification using a light microscope
(Axioplan 2; Zeiss, Oberkochen, Germany) and the mean number of
cells was calculated.
Cell apoptosis assay
The SCC9 control and SCC9 shRNA-GLI3 were
triple-stained for 30 min at room temperature with Annexin V-FITC
(Invitrogen; Thermo Fisher Scientific, Inc.), DAPI, or
anti-CD44-APC (BD Pharmingen). Samples were examined on a FACSCanto
II Flow cytometer and analysed with the FACSDiva version 6.1.1
(both from BD Biosciences) software.
Immunohistochemistry
Forty-five tongue OSCC samples were obtained by
surgical resection from patients (male, ≥40 years of age) admitted
for diagnosis and treatment at the Hospital of the University of
São Paulo, School of Medicine (Brazil) from January, 2011 to
November, 2014. Samples and clinical data collection, and
histopathological analysis were performed with the informed consent
of each patient by the GENCAPO (Head and Neck Genome Project)
Consortium. OSCC diagnosis was performed following the WHO
Classification of Tumors. Clinicopathological TNM staging was
established according to the classification determined by the Union
for International Cancer Control (UICC) (51). This study was approved by the
Brazilian National Ethics Committee (Process #16491) and meets the
requirements of the Declaration of Helsinki.
Immunohistochemical analysis of GLI3 was performed
in 45 OSCC samples and in 10 non-tumour margins. Tissue sections
(4-μm-thick) were cut and, following dewaxing and hydration
in graded alcohol solutions, the sections were incubated with 3%
H2O2 for 45 min. After washing in PBS,
antigen recovery was performed by treatment with a 100 mM citrate
buffer target retrieval solution, pH 6.0 at 95°C, in a water bath
for 20 min. The sections were incubated with protein block (X0909;
Dako, Carpenteria, CA, USA) for 10 min followed by overnight
incubation with monoclonal anti-GLI3 antibody (ab6050; Abcam)
diluted at 1:300 in Antibody Diluent with Background Reducing
components (S3022; Dako). The sections were then incubated with the
Envision+Dual Link visualization system (K4061) and
3,3′-diaminobenzidine tetrahydrochloride (DAB, K3468) (both from
Dako) was used as a chromogen. The negative control consisted of
the omission of the primary antibody. A human kidney was used as
the positive control. Immunostaining evaluations were performed by
two independent pathologists who had no knowledge of the
clinicopathological parameters. GLI3 immunoexpression was scored as
0 (<5%), 1 (5-30%), 2 (30-60%) and 3 (60-100%), as previously
described by Schneider et al (52). For the final analyses, scores were
dichotomised according to protein expression as low expression
(scores 0 and 1) and high expression (scores of 2 and 3). The
immunoexpression pattern was determined independently by two
investigators (M. F. S. D. R. and L. M.) and its association with
clinicopathological parameters such as mean age, tumour location,
tumour size-pT, nodal metastasis-pN, lymphatic, vascular or
perineural invasion, as well as overall survival was examined.
Statistical analysis
All assays were independently repeated at least 3
times and the significance of the differences was calculated using
unpaired t-tests with the Welch correction. A value of P<0.05
was considered to indicate a statistically significant difference.
Error bars represent the standard error of the mean (SEM). Fisher's
exact test was used to estimate the statistically significant
differences between protein expression and the clinicopathological
parameters. The Kaplan-Meier product-limit estimation with the
log-rank test (P<0.05) was used for survival analysis from
lifetime data according to GLI3 protein expression (high vs. low).
Overall survival was defined as the time from surgery to the day of
death or the last follow-up. Statistical package GraphPad Prism 5
software (GraphPad Software, Inc., La Jolla, CA, USA) was used for
statistical analysis and P-value <0.05 were considered to
indicate statistically significant differences.
Results
Characterization of the SCC4 and SCC9
CD44high and CD44low cell fractions
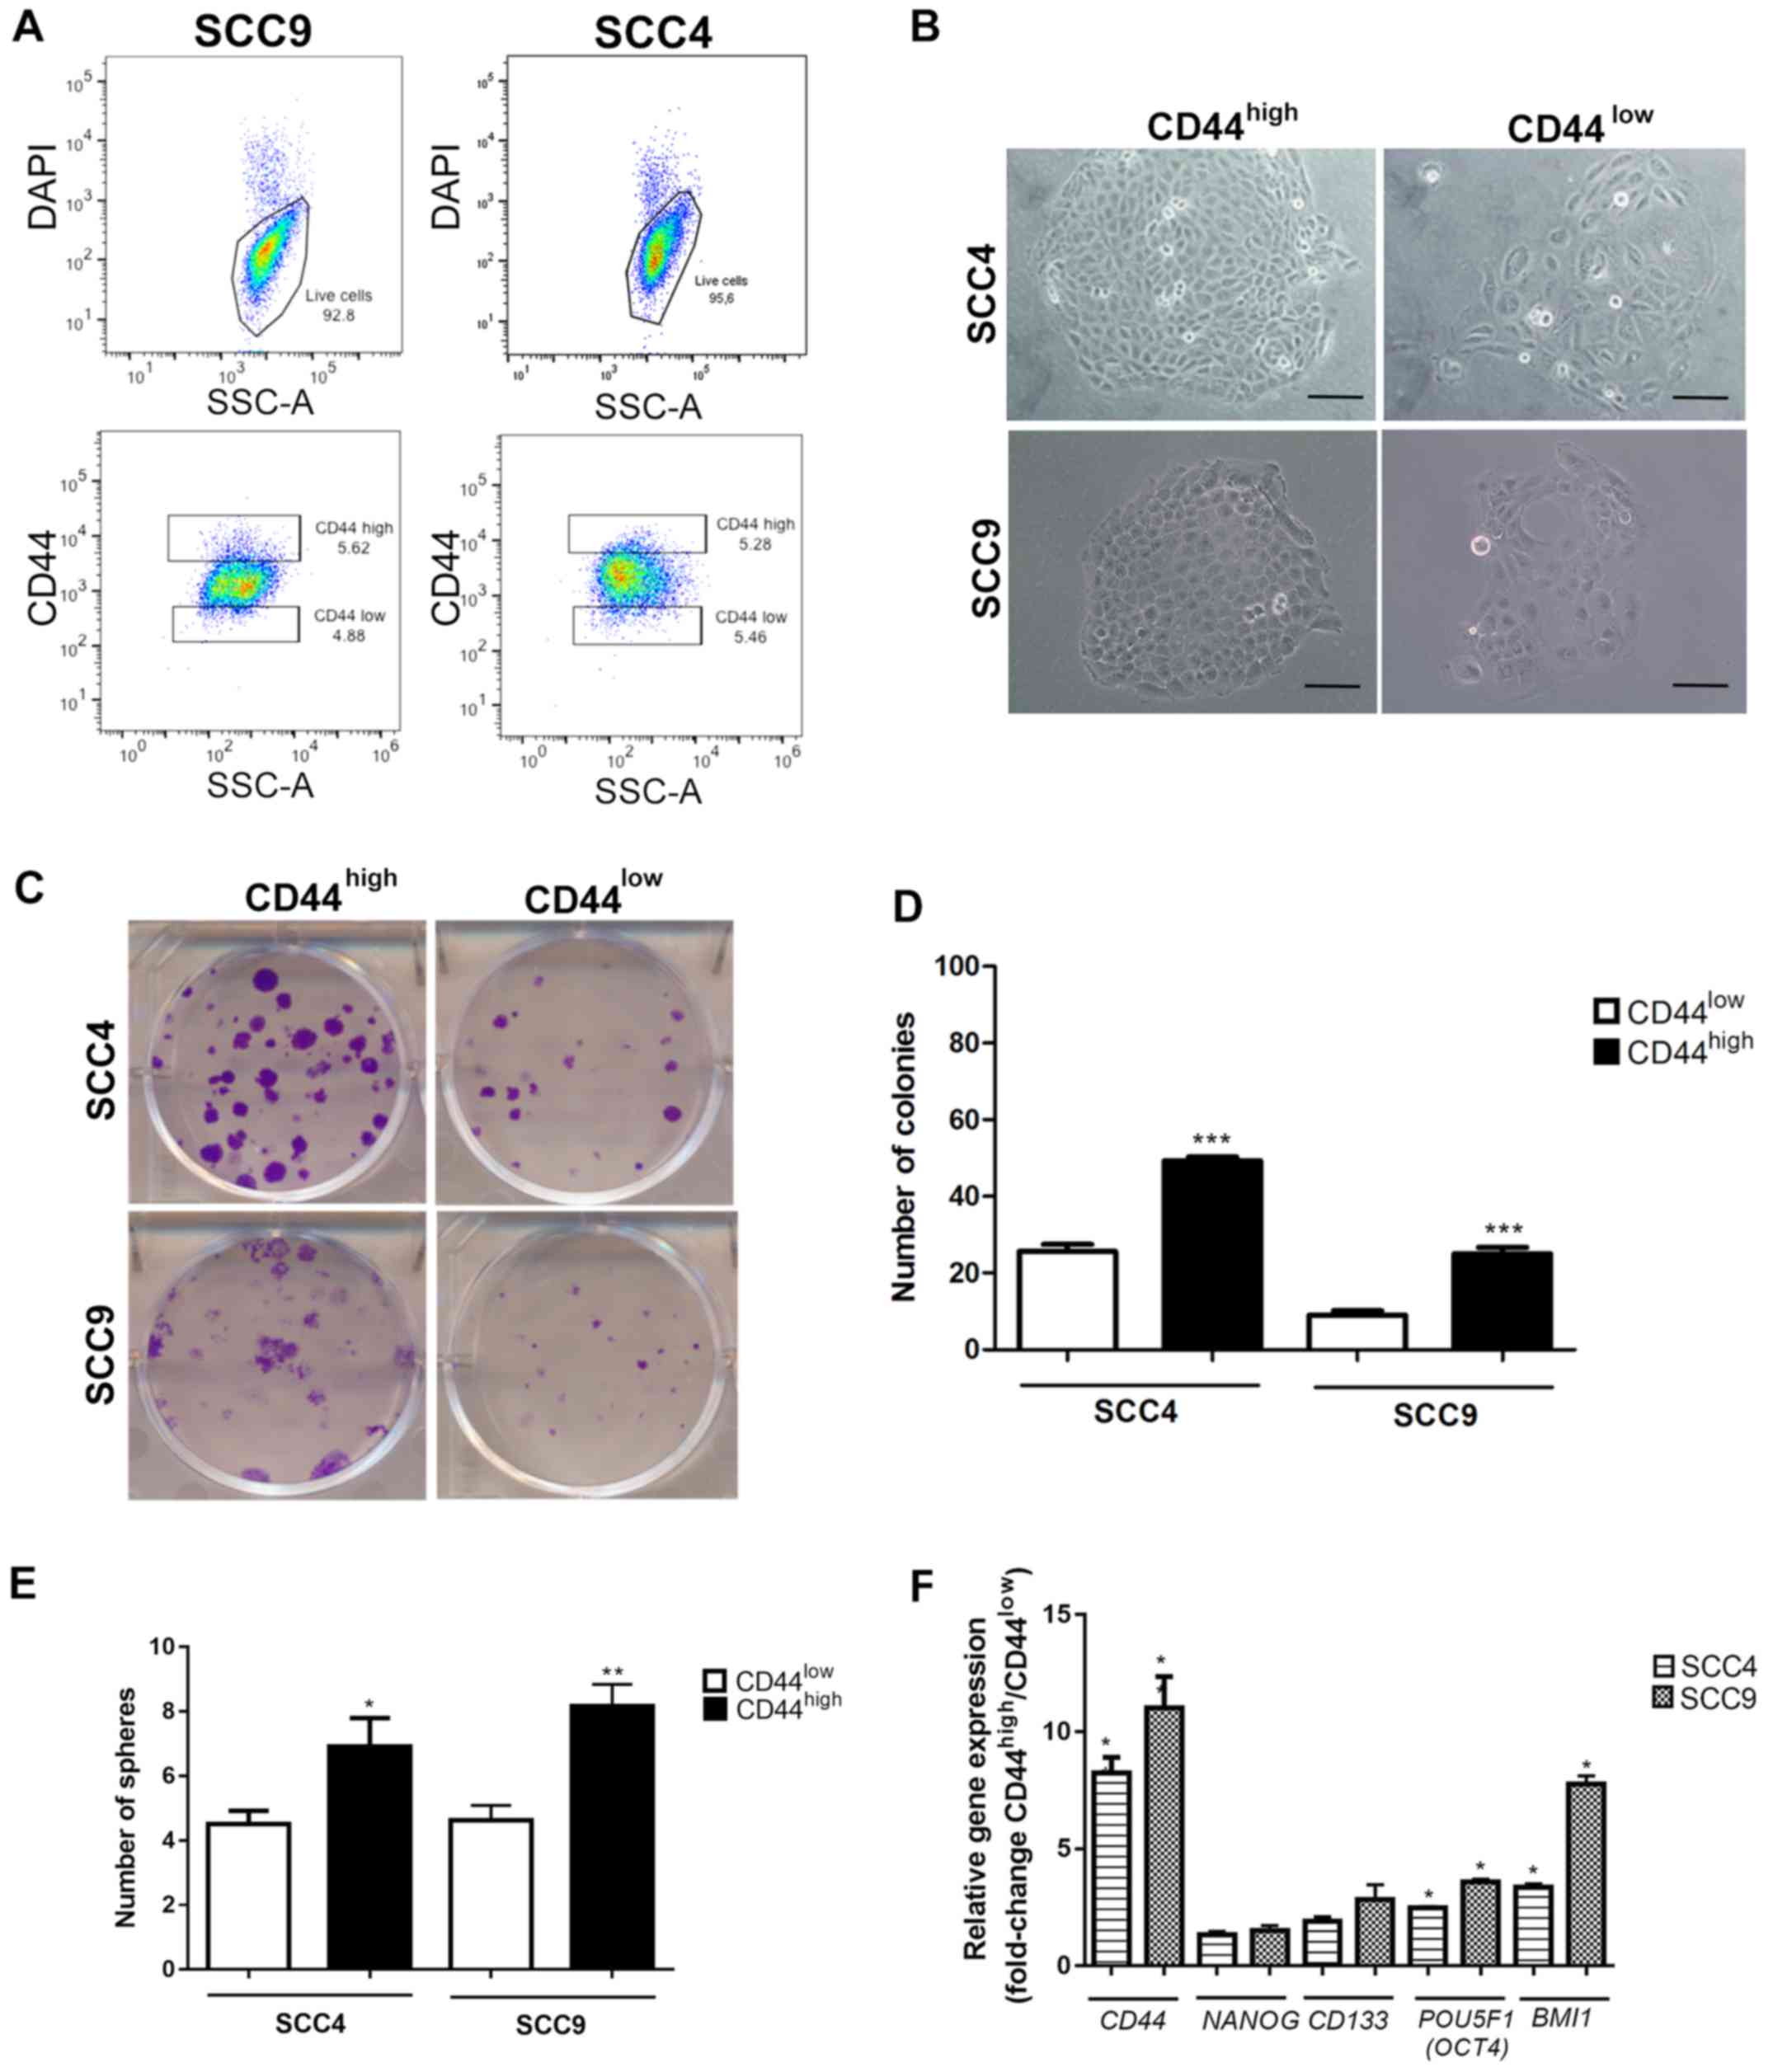
The FACS-sorted CD44high and
CD44low fractions from SCC4 and SCC9 (Fig. 1A) were immediately plated for
clonogenic (Fig. 1B–D) and sphere
formation assays (Fig. 1E) in
order to investigate the CSC properties. As expected, the
CD44high cells exhibited a significantly higher number
of colonies with holoclone morphology (P<0.001, Fig. 1C and D) and spheres (Fig. 1E) in relation to the
CD44low cells from the both SCC4 and SCC9 cell lines.
Additionally, gene expression evaluation revealed increased mRNA
expression levels of CD44, POU5F1 (OCT4) and
BMI1 (P<0.05) in the CD44high cells in
relation to the CD44low cells (Fig. 1F).
Expression of genes related to stem cell
signalling pathways in SCC4 and SCC9 CD44high and
CD44low cell fractions
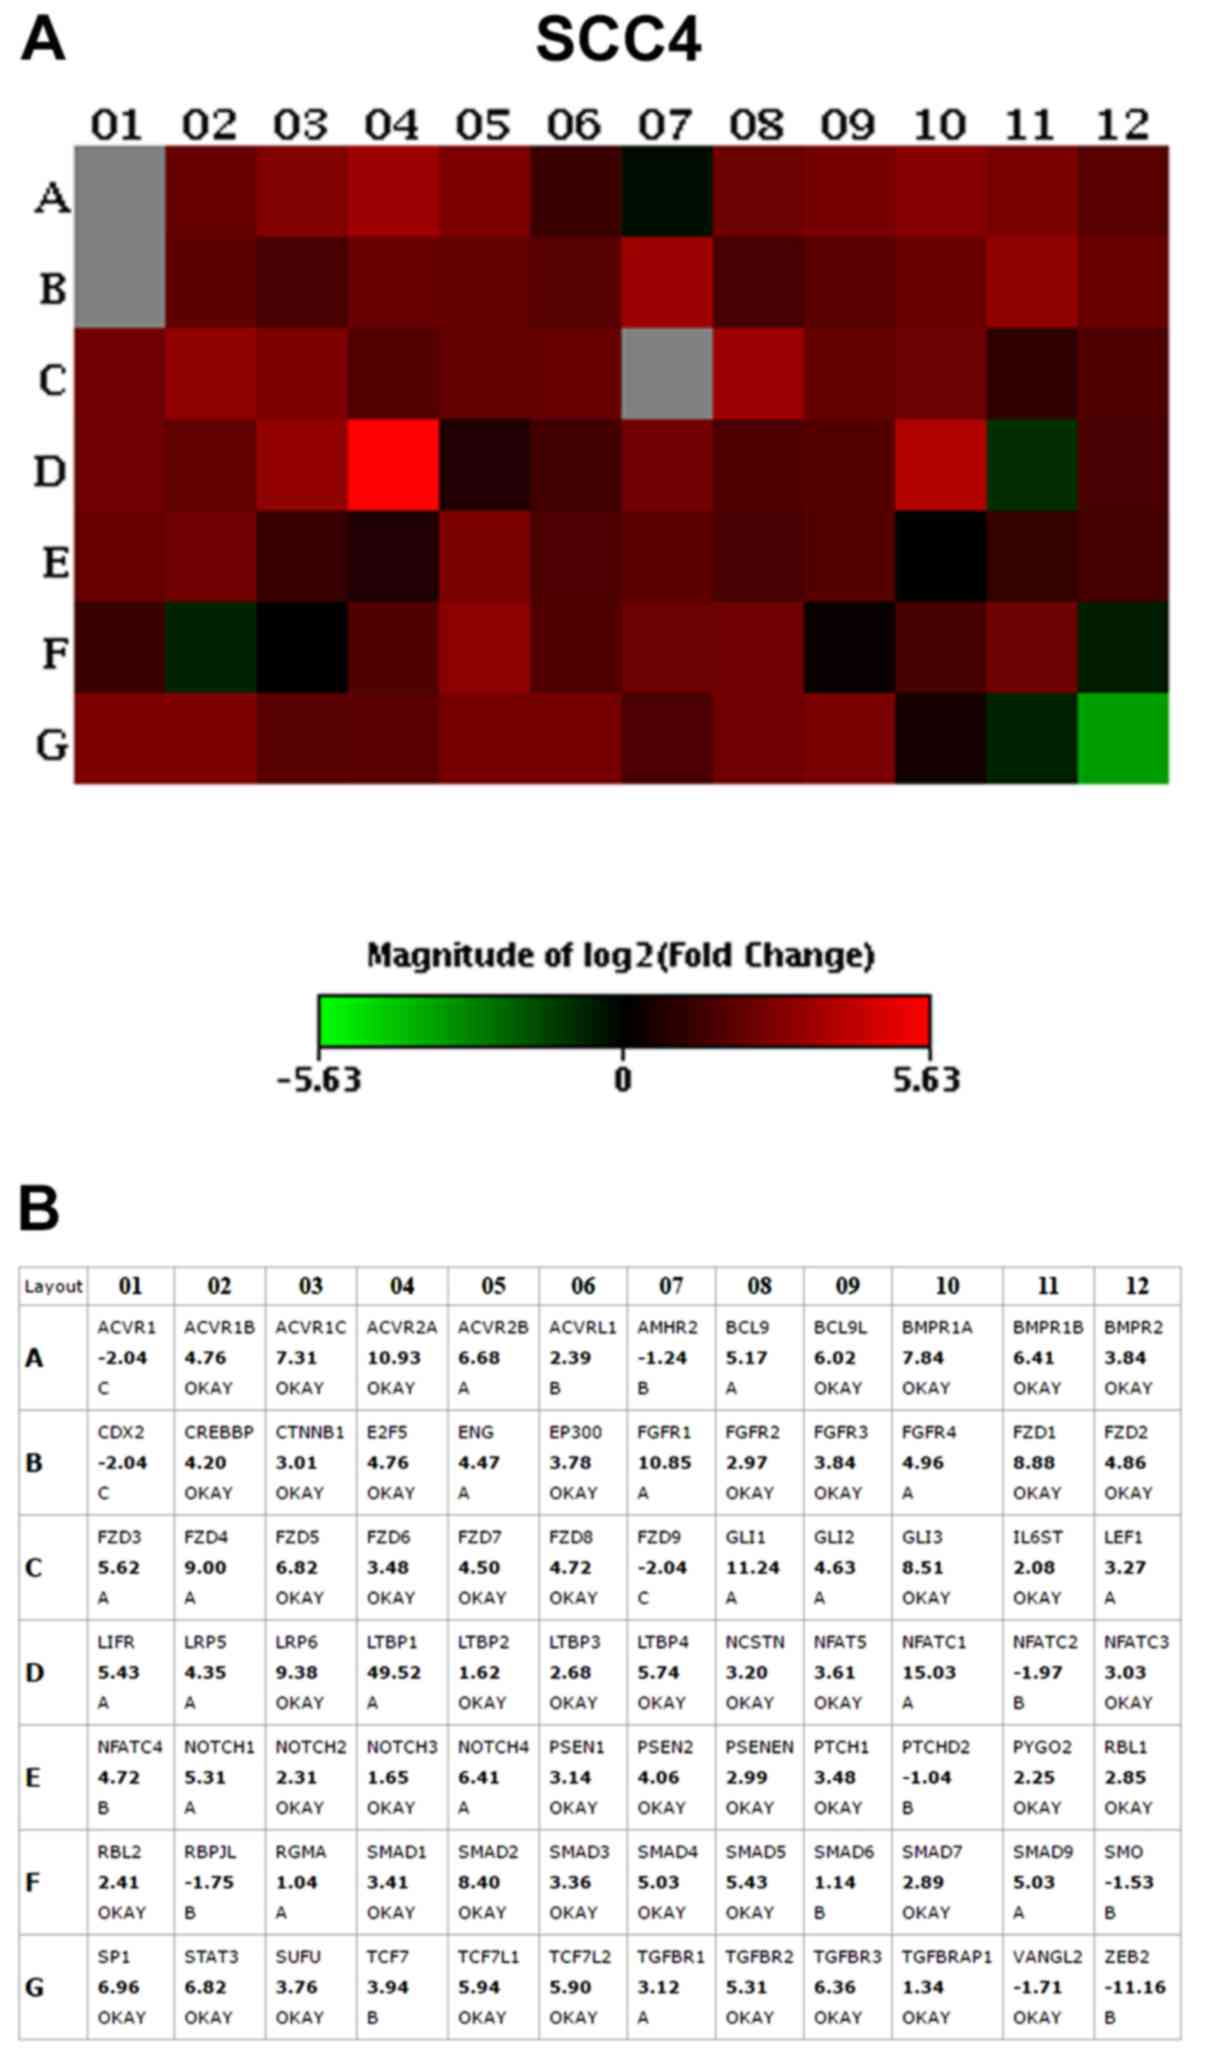
The results of the PCR array assay revealed that the
vast majority of the genes were overexpressed in the
CD44high cells when compared to the CD44low
cells, including genes related to the Notch, transforming growth
factor (TGF)β, fibroblast growth factor (FGF), Hedgehog, Wnt and
pluripotency maintenance pathways. The top 10 upregulated genes
with the highest fold change (>2.0) in CD44high in
relation to the CD44low fractions, in both the SCC4 and
SCC9 cell lines, are presented in Table II and Figs. 2 and 3.
| Table IIList of the top 10 differentially
expressed genes (fold change >2.0) in CD44high sorted
cells in relation to CD44low in SCC4 and SCC9 cell
lines. |
Table II
List of the top 10 differentially
expressed genes (fold change >2.0) in CD44high sorted
cells in relation to CD44low in SCC4 and SCC9 cell
lines.
| Transcript | Gene
description | Signalling
pathway | Fold change |
|---|
| SCC4 cells | | | |
| ACVR2A | Activin A receptor
type 2A | TGFβ | 10.93 |
| LRP6 | LDL receptor
related protein 6 | Wnt | 9.38 |
|
FZD1 | Frizzled class
receptor 1 | Wnt | 8.88 |
| GLI3 | GLI family zinc
finger 3 | HH | 8.51 |
| SMAD2 | SMAD family member
2 | TGFβ | 8.40 |
| BMPR1A | Bone morphogenetic
protein receptor type 1A | TGFβ | 7.84 |
| ACVR1C | Activin A receptor
type 1C | TGFβ | 7.31 |
| SP1 | Sp1 transcription
factor | TGFβ | 6.96 |
| FZD5 | Frizzled class
receptor 5 | Wnt | 6.82 |
|
STAT3 | Signal
transducer and activator of transcription 3 |
Pluripotency | 6.82 |
| SCC9 cells | | | |
| NOTCH2 | Notch2 | NOTCH | 12.30 |
| FZD2 | Frizzled class
receptor 2 | Wnt | 11.39 |
| STAT3 | Signal transducer
and activator of transcription 3 |
Pluripotency | 8.51 |
| FZD7 | Frizzled class
receptor 7 | Wnt | 8.22 |
| SMAD3 | SMAD family member
3 | TGFβ | 8.22 |
| CREBBP | CREB binding
protein | TGFβ | 7.94 |
| EP300 | E1A binding protein
p300 | TGFβ | 7.78 |
| GLI3 | GLI family zinc
finger 3 | HH | 6.92 |
| RBL2 | RB transcriptional
corepressor like 2 | TGFβ | 6.82 |
| FZD1 | Frizzled class
receptor 1 | Wnt | 6.23 |
The Frizzled-1 (FZD1; Wnt pathway),
signal transducer and activator of transcription 3
(STAT3; pluripotency pathways) and GLI3 (Shh pathway)
genes were >6-fold upregulated in the SCC4 CD44high
and SCC9 CD44high cells in relation to the
CD44low cells. Thus, we then selected to knockout the
GLI3 gene in order to investigate the role of this
transcription factor in stemness, as well as in cell proliferation,
invasion and apoptosis.
GLI3 knockdown decreases clonogenicity,
as well as the epithelial and mesenchymal CSCLC fractions in the
SCC9 cell line
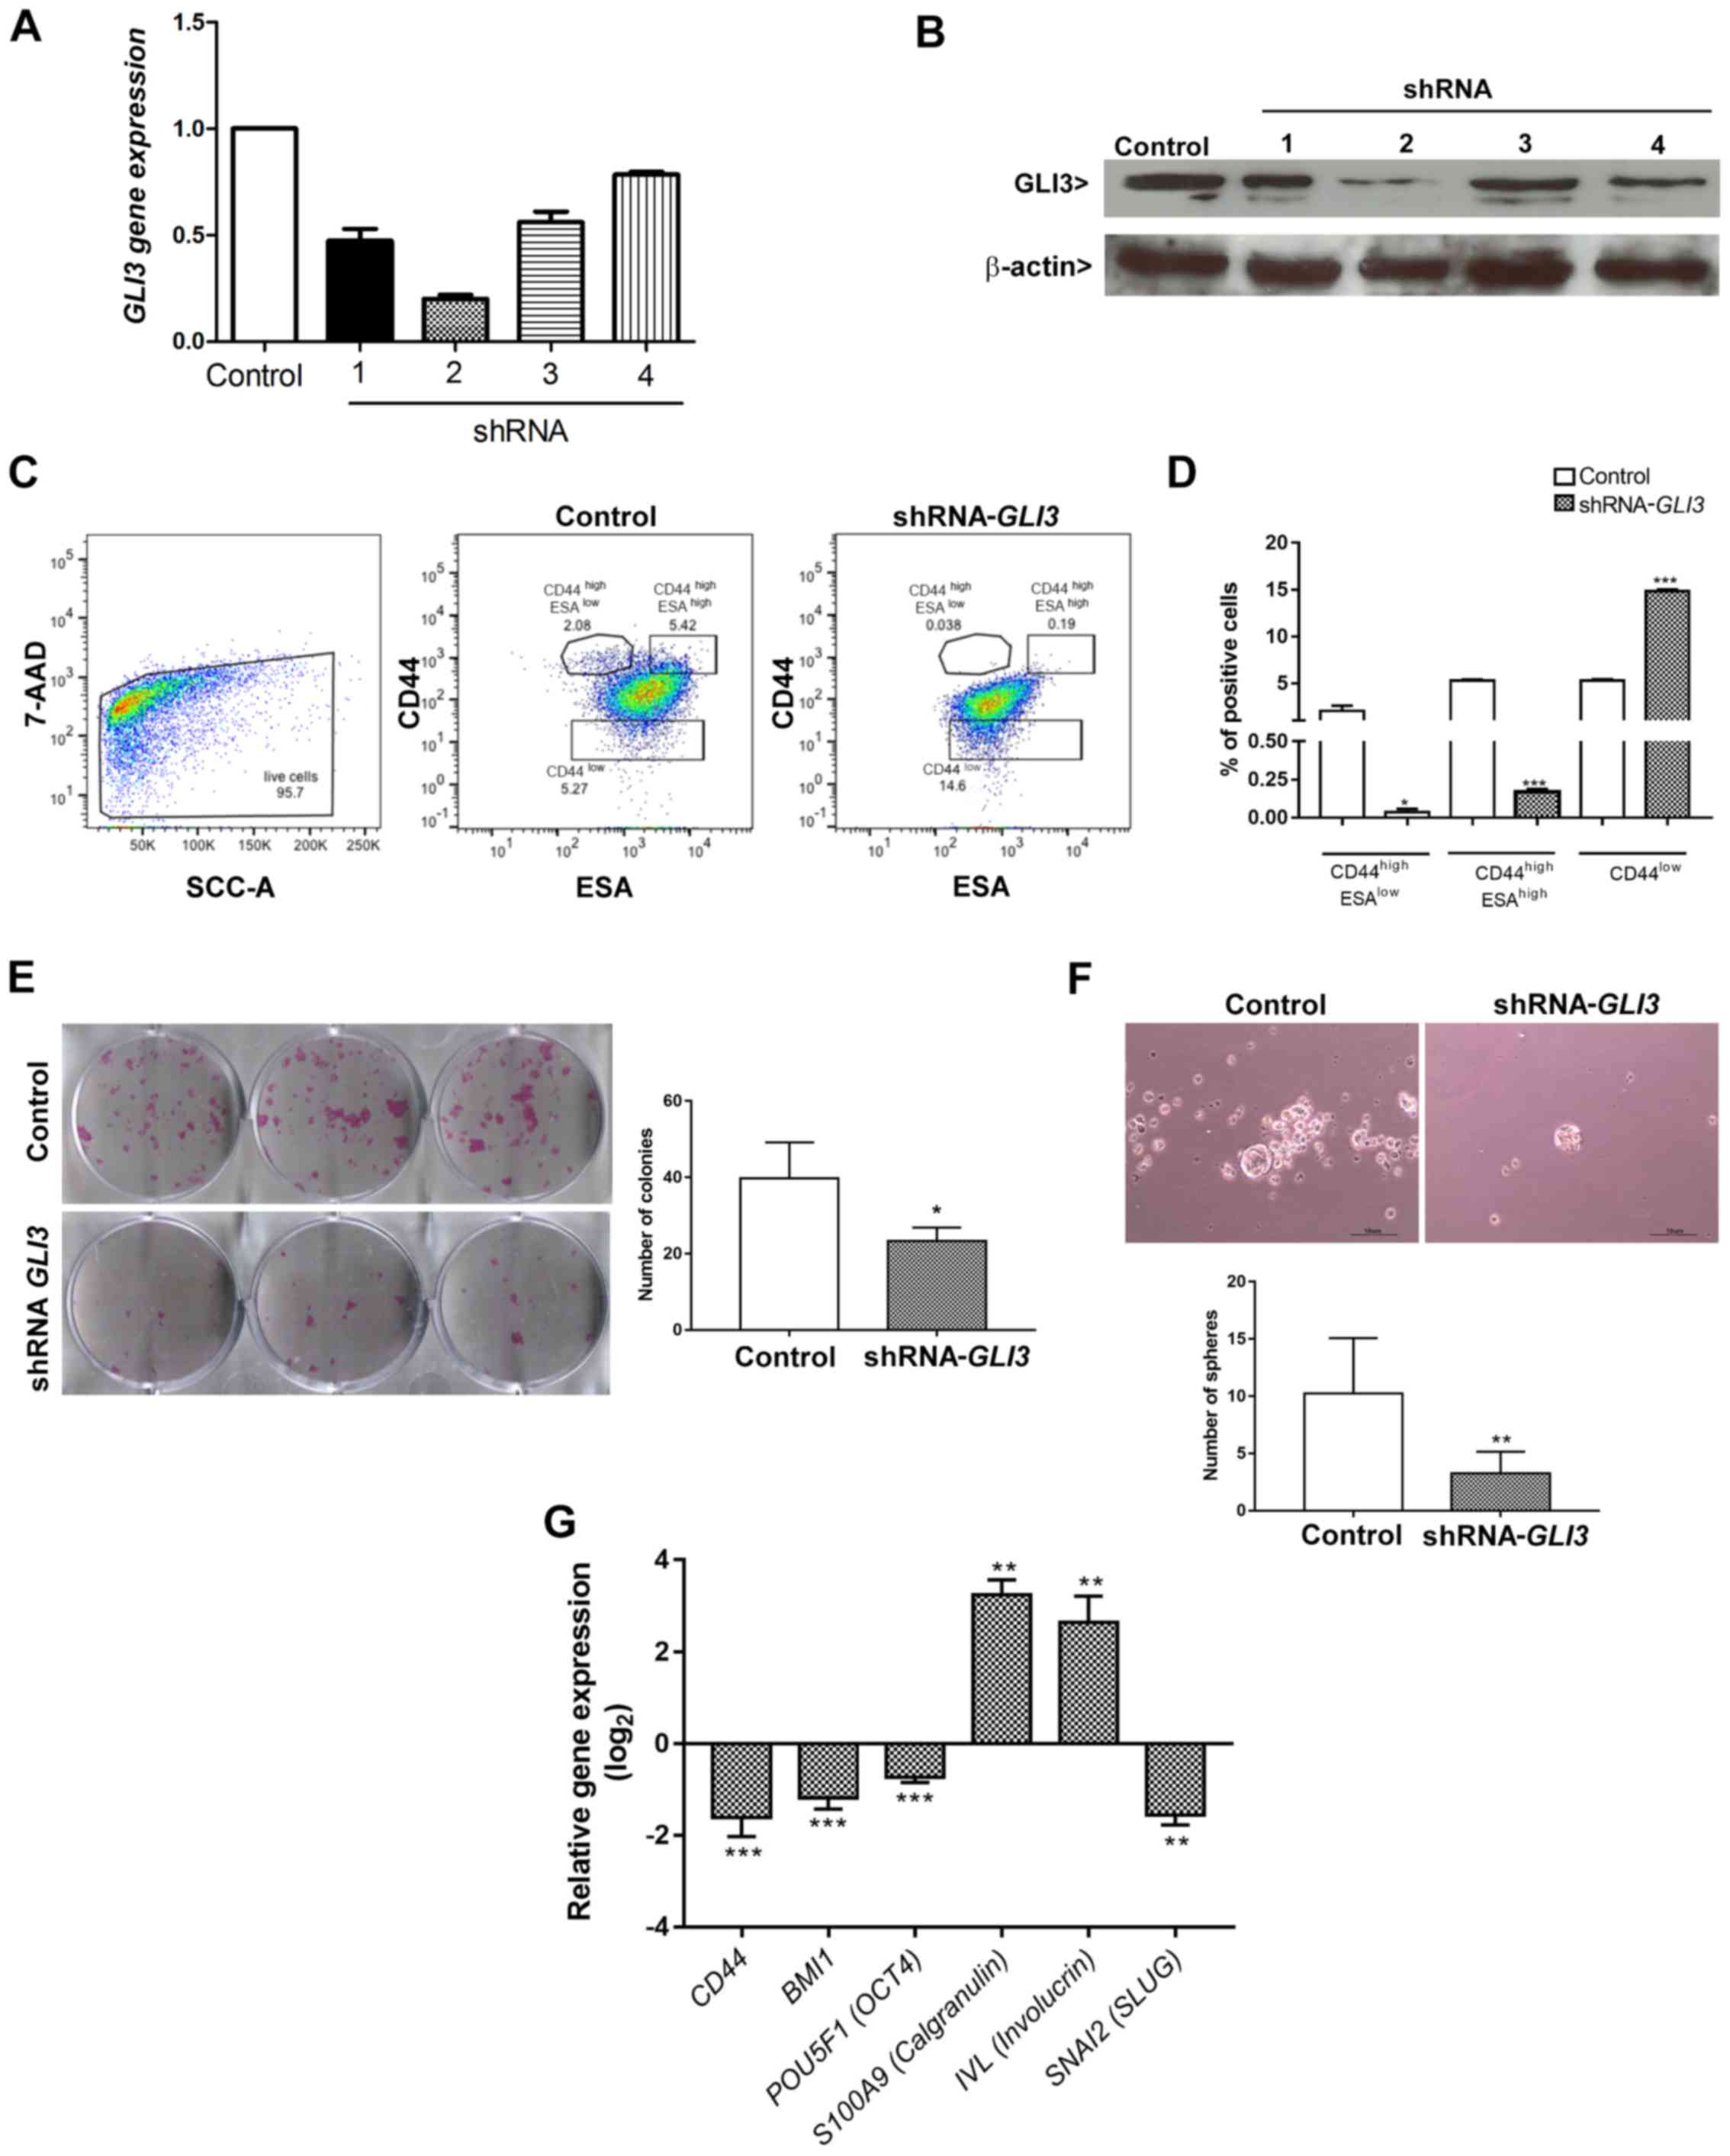
The SCC9 cell line transfected with the shRNA
(sequence 2) for GLI3 gene silencing exhibited a decrease in
the expression of GLI3 of approximately 80% at both the mRNA
(Fig. 4A) and protein (Fig. 4B) level. To assess the effects of
GLI3 gene silencing on CSCLC fractions previously identified
in OSCC (14), the cells
transfected with shRNA-GLI3 and the control cells were
stained for CD44 and ESA and analysed by flow cytometry in 3
different subpopulations: The CD44high/ESAlow
(EMT-CSCLC), CD44high/ESAhigh (EPI-CSCLC) and
CD44low (NON-CSCLC) populations. GLI3 knockdown
significantly decreased the percentage of
CD44high/ESAlow (P=0.02) and
CD44high/ESAhigh (P<0.0001) cells and
consistently increased the percentage of CD44low cells
(P<0.0001) (Fig. 4C and D).
To determine whether the decrease in the
CD44high/ESAlow (EMT-CSCLC) and
CD44high/ESAhigh (EPI-CSCLC) cell populations
was associated with a functional decrease in stemness, the cells
transfected with shRNA-GLI3 and the control cells were
plated to determine their clonogenicity and sphere formation
ability. As shown in Fig. 4E and
F, GLI3 knockdown was associated with significantly
lower numbers of colonies and spheres formed (P=0.03 and P=0.004,
respectively).
We also examined whether the decrease in stemness
in the shRNA-GLI3-transfected cells was associated with the
decreased expression of stem cell- and EMT-related genes. As
expected, GLI3 gene silencing resulted in a significant
decrease in CD44 (P<0.0001), BMI1 (P<0.0001),
POU5F1 (OCT4) (P<0.0001) and SNAI2
(SLUG) (P<0.001) gene expression in relation to the
control cells. Additionally, the shRNA-GLI3-transfected
cells exhibited an increased gene expression of the epithelial
differentiation markers, IVL and S100A9
(Calgranulin B) in relation to the control cells, indicating
a shift towards differentiation (Fig.
4G).
Downregulation of GLI3 reduces cell
proliferation and invasion
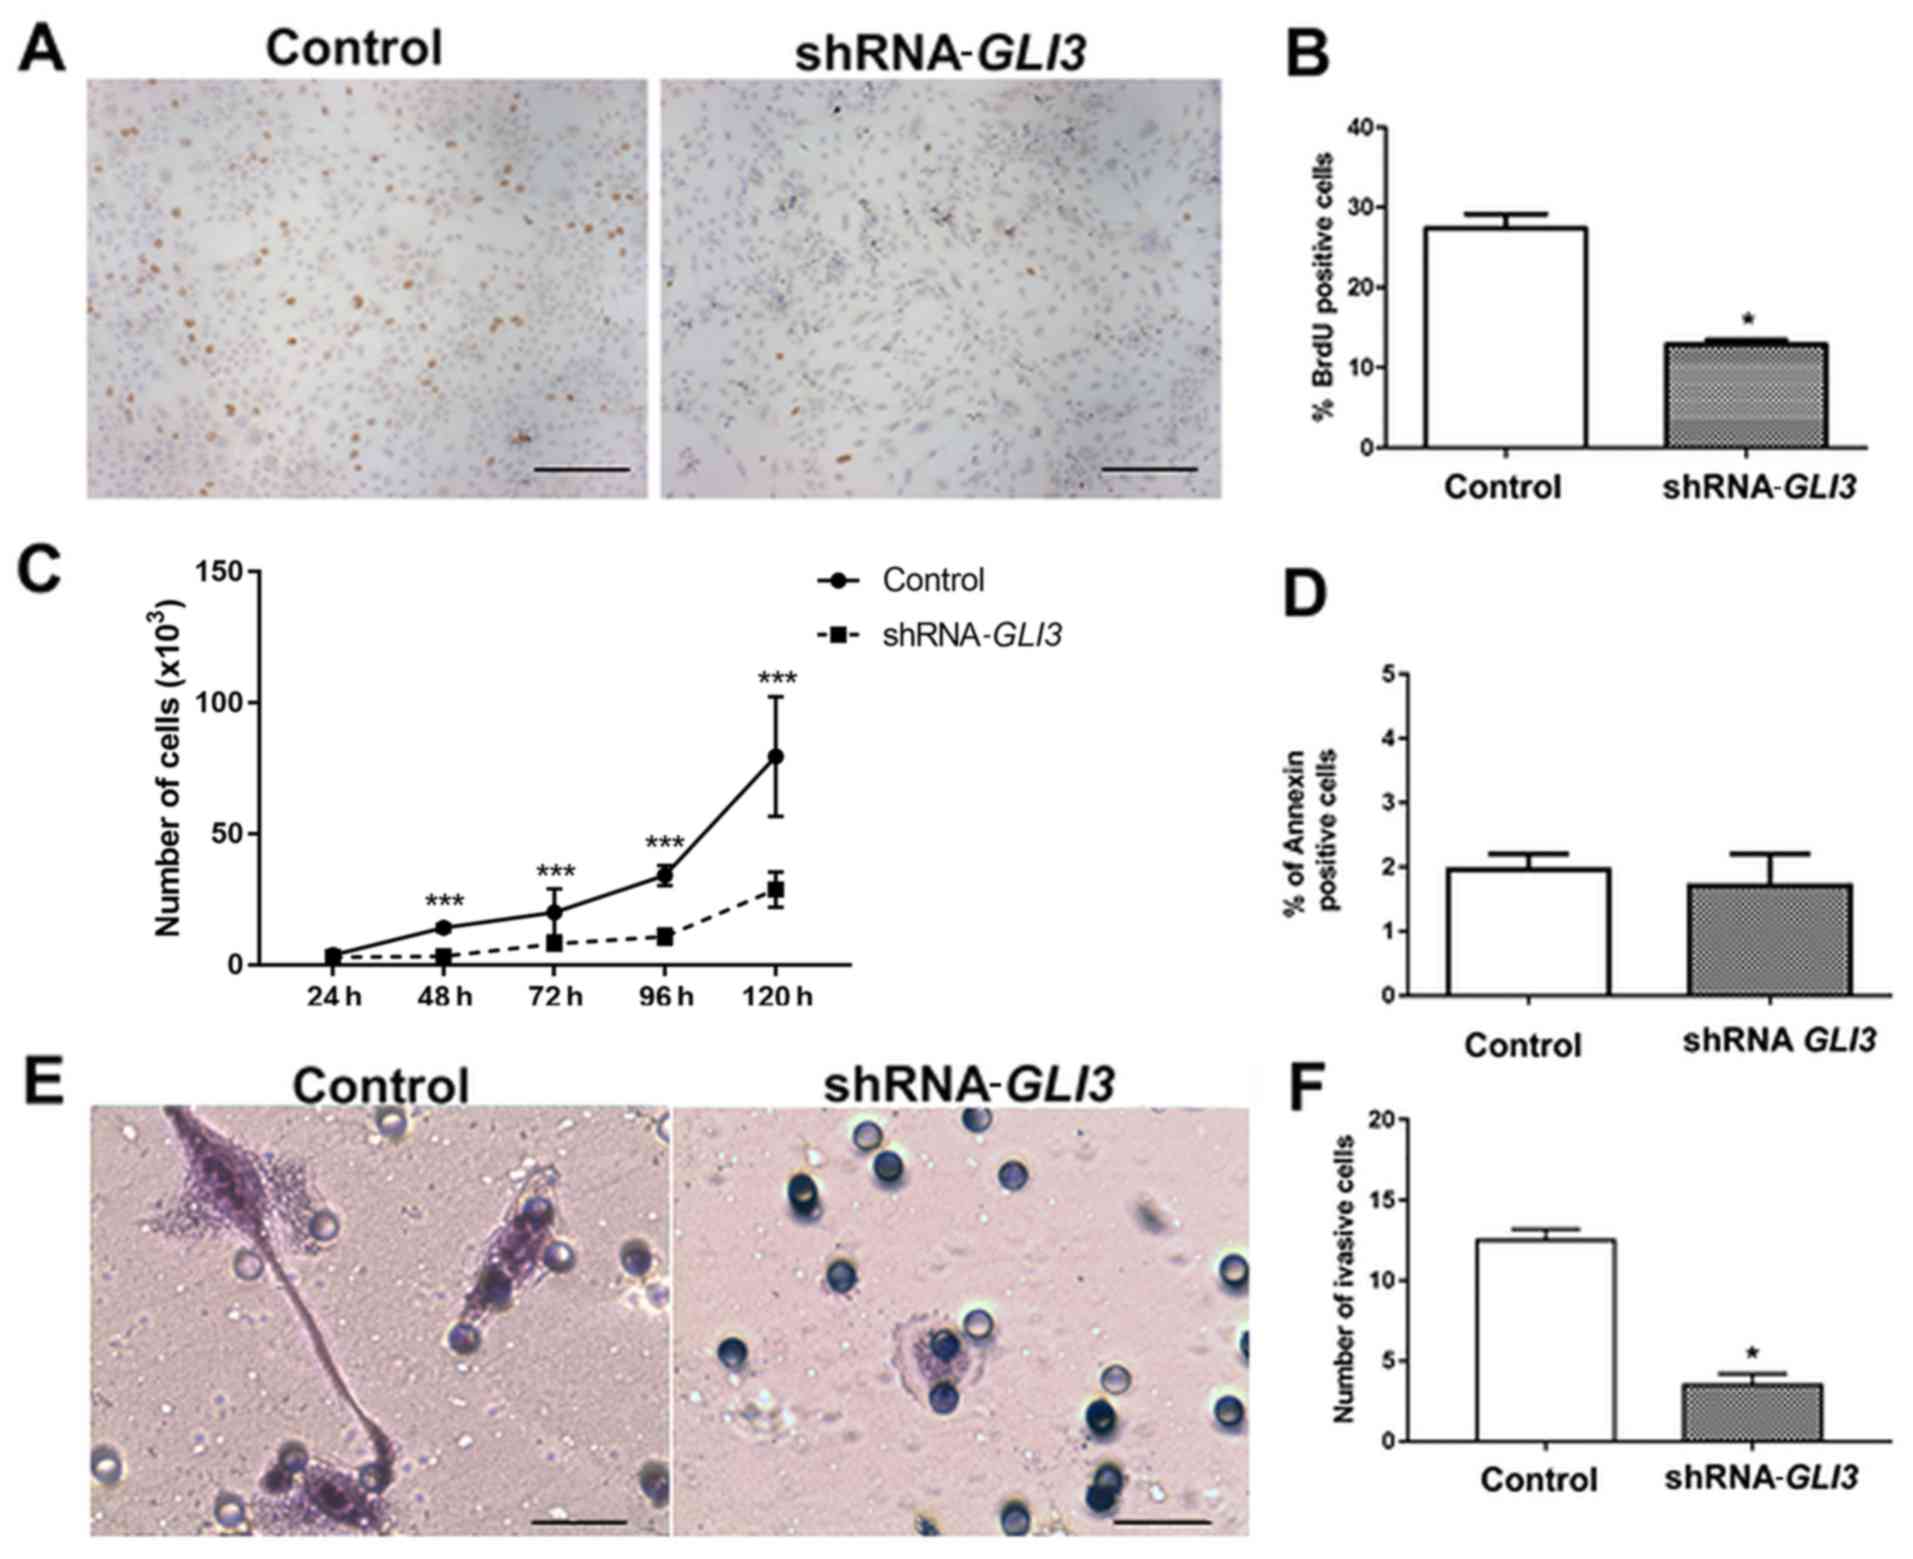
Subsequently, we performed BrdU and proliferation
curve assays to address the effects of GLI3 knockdown on the
proliferation rates of the SCC9 cells. As demonstrated in Fig. 5A and B, the
SCC9-shRNA-GLI3-transfected cells exhibited a significant
decrease in the number of BrdU-positive cells (P=0.01) in relation
to the control cells. Moreover, there was a significant decrease in
the number of shRNA-GLI3-transfected cells after 48
(P=0.001), 72 (P= 0.0079), 96 (P= 0.0068) and 120 h (P= 0.001) when
compared to the control cells (Fig.
5C). No differences in the number of Annexin V-positive cells
were observed between the control and shRNA-GLI3-transfected
cells (Fig. 5D). Invasion assay
revealed significantly lower numbers of invasive
shRNA-GLI3-transfected cells in relation to the control cells
(P=0.03) (Fig. 5E and F).
GLI3 protein expression in OSCC samples
and its association with patient clinicopathological
characteristics
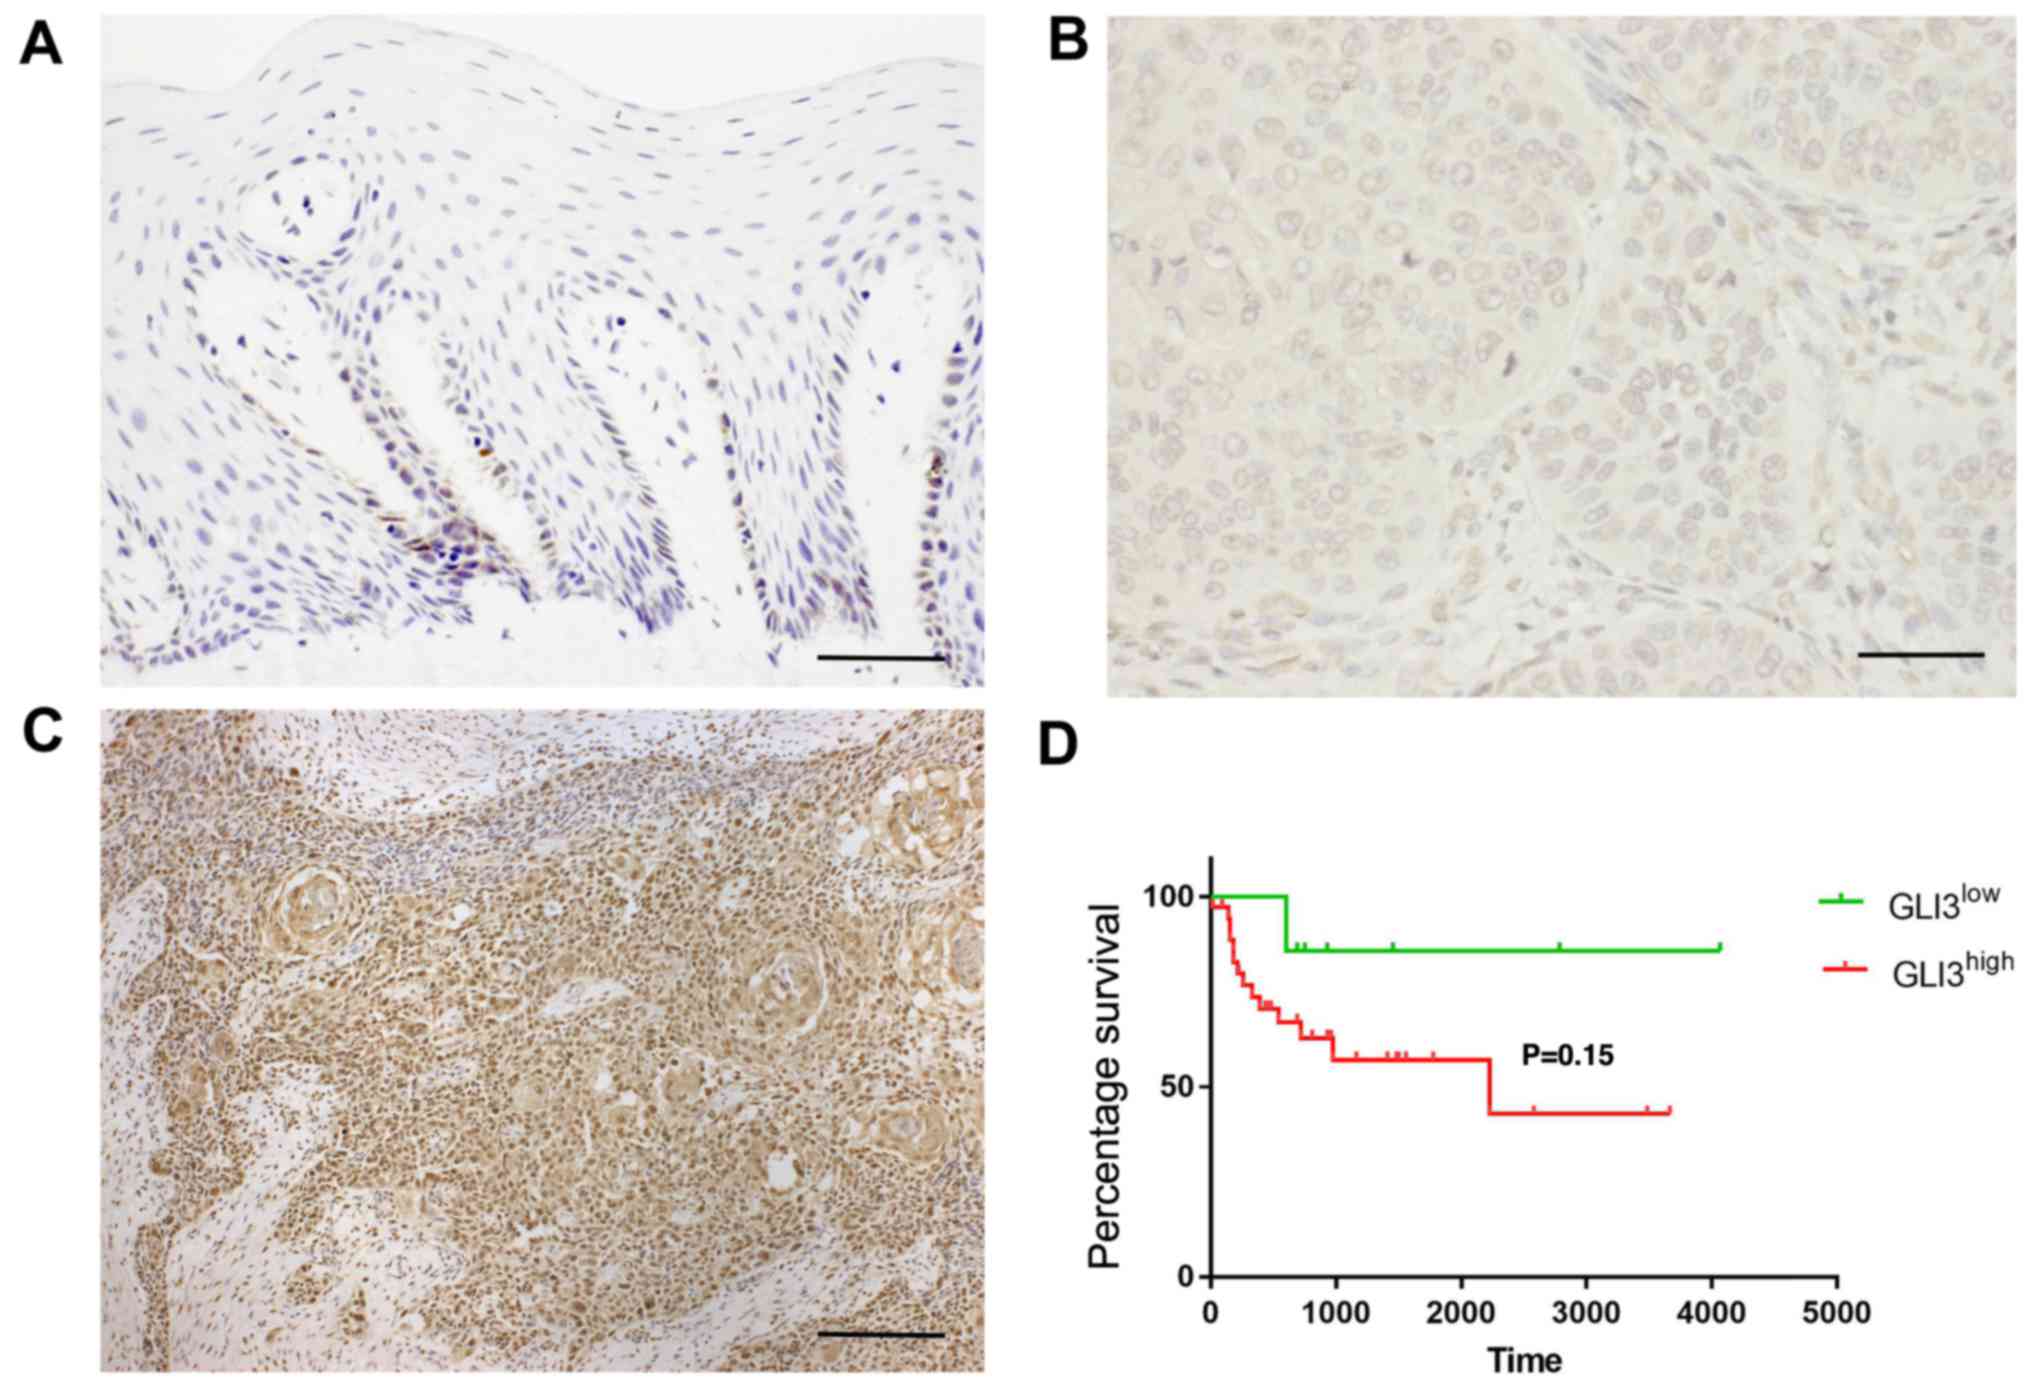
GLI3 protein expression was detected in the
cytoplasm and nucleus of normal and malignant epithelial cells. In
non-tumour margins, GLI3 expression was observed mainly in the
basal and suprabasal cells (Fig.
6A). In the OSCC samples, GLI3 was highly expressed in the
tumour islands, as well as in isolated neoplastic cells. GLI3 was
considered to have a low expression (Fig. 6B) in 22/45 OSCC samples (48,88%)
and a high expression (Fig. 6C) in
23/45 samples (51,12%). Invasive OSCC areas were highly positive
for GLI3.
The association between GLI3 expression and the
patient clinicopathological characteristics, as well as survival
was evaluated and is described in Table III and Fig. 6D. There were no significant
associations between GLI3 protein expression and metastasis (pN),
or blood, lymphatic and/or perineural invasion. However, a
GLI3high expression was associated with tumour size
T3/T4 (P=0.03). To determine the prognostic significance of GLI3 in
patients with OSCC, Kaplan-Meier survival analysis was performed.
There were no significant differences observed in the 5-year
survival rate of patients with a GLI3high expression
when compared to those with a GLI3low expression
(P=0.15) (Fig. 6D).
| Table IIIAssociation of GLI3 protein
expression with the clinicopathological characteristics of patients
with oral squamous cell carcinoma. |
Table III
Association of GLI3 protein
expression with the clinicopathological characteristics of patients
with oral squamous cell carcinoma.
| Clinicopathological
characteristics | Number of
cases | GLI3 expression
| P-value |
|---|
| Low | High |
|---|
| Age (years) | | | | |
| >60 | 17 | 9 | 8 | 0.76 |
| <60 | 28 | 13 | 15 | |
| pT
classification | | | | |
| T1/T2 | 27 | 17 | 10 | 0.03 |
| T3/T4 | 18 | 5 | 13 | |
| pN
classification | | | | |
| N+ | 29 | 13 | 16 | 0.54 |
| N− | 16 | 9 | 7 | |
| Blood invasion
(BI)a | | | | |
|
BI+ | 7 | 2 | 5 | 0.40 |
|
BI− | 35 | 19 | 16 | |
| Lymphatic invasion
(LI)a | | | | |
|
LI+ | 18 | 6 | 12 | 0.12 |
|
LI− | 25 | 15 | 10 | |
| Perineural invasion
(PI) | | | | |
|
PI+ | 19 | 9 | 10 | 1.00 |
|
PI− | 26 | 13 | 13 | |
Discussion
The primary aim of this study was to evaluate the
differential expression of genes related to stem cell signalling
pathways in CD44high in relation to CD44low
cells. The upregulation of receptors and transcription factors
belonging to the Wnt, TGFβ, Notch, SHH and pluripotency maintenance
of the stem cells was observed in the CD44high cells.
This observation demonstrates that in OSCC, the aberrant and
constitutive activation of developmental signalling pathways in
CSCLC may favor the acquisition and maintenance of malignant
behavior. Secondly, we explored the role of GLI3 in OSCC
stemness, proliferation and invasion, speculating that this gene,
among others that were overexpressed in both cell lines, could be
important to oral CSCLC. The clonogenic ability, sphere formation
and number of CSCLCs with epithelial and mesenchymal phenotypes,
identified by the surface markers,
CD44high/ESAhigh and
CD44high/ESAlow, respectively, were
significantly reduced in the cells in which GLI3 was knocked
own. Of note, the downregulation of the stemness genes,
BMI1, POU5F1 (OCT4) and the EMT gene
SNAI2 (SLUG), was observed, as well as an increase in
the expression of the epithelial differentiation markers,
S100A9 (Calgranulin B) and IVL. Taken
together, these results indicate that GLI3 is a
transcription factor that may play an important role to play in the
maintenance of CSCLCs in OSCC and may thus be considered a
potential target for the eradication of CSC fractions in OSCC.
CSCs play an important role in OSCC development and
progression; different cell surface markers have been used to
identify and characterise these cells (5,13,14).
In this study, we used the CD44 marker to isolate the
CD44high (CSCLC) and the CD44low (NON-CSCLC)
populations, the first being associated with an increased ability
to form spheres and colonies with holoclone morphology and the
upregulation of the stem cell-related genes, POU5F1
(OCT4) and BMI1. CD44 is the most frequently observed
CSC marker. It was used by Prince et al to identify the CSC
population in OSCC, which exhibited a high BMI1 gene
expression, as well as an exclusive ability to form tumours in
immunodeficient mice and to recreate tumour heterogeneity (5). We have previously demonstrated that
SCC9 CD44high cells are able to produce a tumour in
immunodeficient mice, even at lower concentrations, and that the
derived tumours exhibit a high expression of CD44, cytokeratin19,
β-catenin and E-cadherin (51),
demonstrating that this cell line and CD44 are suitable for the
investigation of CSCLCs in OSCC.
CD44 is a glycoprotein receptor that binds to
hyaluronan (HA) and can vary in size due to post-translational
modifications and alternative splicing (11). This receptor actively interacts
with the extracellular matrix (HA, collagen and fibronectin) and
activates intracellular events that promote resistance to
apoptosis, EMT, migration and metastatic colonization (11,53).
CD44 also plays an important role in the crosstalk between CSCs and
their niche, including the activation and recruitment of resident
cells to form CSC niches and pre-metastatic niches (54).
In cancer, to sustain their stem cell properties,
CSCs upregulate several signalling pathways that control normal
stem cells, including the Notch, Wnt, Hedgehog and the pluripotency
pathways mediated by interleukin (IL)6/STAT3 (17). In this study, we observed that the
vast majority of receptors, co-receptors and transcriptional
factors belonging to these pathways were upregulated in the
CD44high cells in relation to the CD44low
cells in OSCC and may thus contribute to the maintenance of
stemness in this malignancy.
Notch signalling, a key regulator of stem cell
fate, is frequently overexpressed in various types of cancer and
contributes to angiogenesis and drug resistance via interaction
with oncogenic pathways (17,55).
In this study, we observed an upregulation in the expression of
NOTCH2, PSEN1, PSEN2 and PSENEM in the
CD44high cells. Zhao et al (2016) observed that
pharmacological Notch1 inhibition was associated with a reduction
in OSCC CSC fractions and self-renewal capacity, as well as with an
increase in the response to conventional therapy (56), bringing with it the promise of an
OSCC therapy. In addition, Notch-mediated signalling is associated
with the induction of EMT under hypoxic conditions in OSCC
(57). It is also associated with
high mortality and T classification in OSCC, as well as with an
increase in cell migration and invasion (58,59).
Wnt signalling plays an important role during
embryogenesis and in the determination of cell fate during
development (60). The activation
of the canonical Wnt pathway begins when the ligand binds with the
Frizzled receptors and co-receptors [low-density lipoprotein
receptor-related protein (LRP)] which then leads to β-catenin
stabilization and translocation to the nucleus. This results in the
transcriptional activation of tumour-promoting genes, including
CCND1, MYC, MMP7 and CD44 (61). In this study, a large number of
genes related to the Wnt pathway, such as FZD receptors
(FZD1 and FDZ2), co-receptors (LRP6), and
transcription factors (BCL9L, CTNNB1, NFAT5,
NFATC3 and TCF7L1), were overexpressed in the CSCLC
fraction. This result infers that this pathway may play an
important role in the maintenance of these cells in OSCC. In fact,
it was previously demonstrated that CSCs in head and neck squamous
cell carcinoma isolated based on Hoechst dye exclusion exhibited an
aberrant activation of the Wnt/beta-catenin pathway (62). Many of the surface markers used to
identify CSCs are targets of this pathway, including CD44, CD24 and
ESA, which can contribute to the enrichment of this population
(63). Additionally, this pathway
plays an important role in the induction of the EMT, in which cells
necessarily acquire CSCs traits and exhibit an upregulation of
SNAIL, ZEB1 and ZEB2 (61,63).
One of the mechanisms used by the SHH pathway,
which can contribute to cancer development, is the upregulation of
the transcription factors, GLI1, GLI2 and GLI3
(19). The majority of the studies
in the literature have investigated the role of GLI1 in
cancer, as it acts as a transcription activator in cancer. However,
GLI proteins are highly dynamic and function in a contextual and
combinatorial manner (64). For
example, GLI3 can function as either a transcription activator or
inhibitor, depending on the presence or lack of SHH ligands
(19,28). In the absence of ligands, the GLI
protein function is turned off, GLI1 is not transcribed and
GLI2/GLI3 are processed in a truncated repressor protein form that
binds to the GLI sites in the SHH promoters, leading
to the inhibition of target genes (19,28).
On the other hand, with the presence of SHH ligands (canonical
activation), GLI2/GLI3 in its activated form (full-length) is
produced and positively regulates genes which control cell
proliferation (CCND1, MYC), cell death (BCL2),
EMT (e.g. SNAIL), angiogenesis (e.g., ANG1/2) and
stemness (SOX2, NANOG) (65,66).
In addition, GLI1 is a direct target of GLI2/GLI3 and
favours malignant behavior (63).
Some studies have implicated the SHH pathway in CSC
regulation and maintenance in addition to participating in
metastatic progression and the acquisition of the EMT phenotype
(38,67). Its inhibition results in a decrease
in stem cell propagation and cell renewal (68). For these reasons, natural and
synthetic antagonists of SMO and GLI proteins are being tested to
evaluate their efficacy alone or in combination to target the CSC
in a wide range of malignant tumours (28). For example, the combined target
therapy of PI3K/Akt/mTOR therapy and SMO inhibitor was associated
with a decrease in CSC self-renewal by inhibiting the NANOG,
POU5F1 (OCT4), SOX2, MYC and GLI
transcription factors in pancreatic cancer (69). In non-small cell lung cancer
(NSCLC), GLI1 inhibition abrogated the CSC population and
cooperated with EGFR inhibitors to impair the viability of
malignant cells (70).
Biddle et al (2011) have demonstrated that
CSC in OSCC can switch between two different phenotypes. One of the
said phenotypes is preferentially epithelial and proliferative,
characterised by the phenotype
CD44high/ESAhigh (EPI-CSC); the other is
preferentially migratory, with the
CD44high/ESAlow (EMT-CSC) phenotype (14). In this study, we observed that GLI3
gene silencing was able to decrease the percentage of
CD44high/ESAhigh and the
CD44high/ESAlow cells, which was then
followed by an increase in CD44low cells. Moreover, the
clonogenic ability, primarily a property of the
CD44high/ESAhigh cells, was strongly
inhibited in the cells transfected with shRNA-GLI3. This
supports the concept that these cell subpopulations are lost
through cell differentiation. This was further confirmed by the
upregulation of the epithelial differentiation markers,
S100A9 (Calgranulin B) and IVL in the
shRNA-GLI3-transfected cells. Prince et al (5) observed that in tumours derived from
CD44high cells, well differentiated areas negative for
CD44 exhibited a strong expression of IVL. The loss of
clonogenicity, increase in CD44low fraction and increase
in the mRNA expression of the differentiation markers described
above indicates that the SHH signalling pathway may function as a
form of 'differentiation therapy' in OSCC (71,72)
and may potentiate the effects of therapeutic agents such as
cisplatin. However, additional studies are warranted to support
this concept.
We also observed that the levels of
stemness-related genes, BMI1 and POU5F1
(OCT4), were downregulated following GLI3 knockdown.
BMI1 is a member of the polycomb repressive complex 1 and plays an
important role in CSC self-renewal, tumour initiation,
undifferentiated state maintenance and therapeutic resistance in
OSCC (73). Nör et al
(74) demonstrated that OSCC
treatment with cisplatin promoted enrichment of the CSC fraction.
It was also shown that the BMI1 gene actively participated
in the acquisition of resistance, which was influenced by IL6
(74). POU5F1 (OCT4)
also plays an important role in CSC and its overexpression,
increases the capacity for tumour initiation, tumour sphere
formation, invasion and the acquisition of the EMT phenotype in
OSCC cells lines (75,76).
Of note, sphere formation assay, normally used to
investigate the 'functional' state of
CD44high/ESAlow fractions, has also been
shown to be reduced in cells transfected with shRNA-GLI3. In
addition, in this study, we observed a significant decrease in the
mRNA expression of SNAI2 (SLUG), a transcription
factor that participates in the EMT process. The EMT-CSC fraction
in OSCC exhibits significant resistance to radiation and various
chemotherapeutic agents (6,10).
As it is responsible for tumour invasion and metastasis, therapies
that can reduce or eradicate this cell fraction are greatly needed
(77). Considering our results as
a whole, they highlight the important role that GLI3 plays
in controlling CSC self-renewal, its distinct phenotypes in OSCC
and its involvement with genes involved in the maintenance of these
subpopulations.
Also of note, a significant decrease in both
cellular proliferation and invasion was observed following
GLI3 gene silencing. To the best of our knowledge, this is
the first study to demonstrate that GLI3 participates in the
regulatioin of both processes in OSCC. Multiple oncogenic pathways
can also increase GLI function (non-canonical activation),
including K-ras, PI3K/Akt and TGFβ (78-80),
contributing to tumour development and formation. It should be
noted that the increase in cyclin-D2 observed after SHH activation
depends on GLI3 activity (18). Thus, it can be speculated that the
inhibition in cell proliferation observed in GLI3 knockdown
cells may be the result of the modulation of different target
genes, including cyclins and the GLI1 protein, which in turn
activate pro-proliferative genes. Shih et al recently
demonstrated that GLI1 expression was induced by the oncogene,
ROS1, leading to an increase in cellular proliferation but not in
cell migration and invasion (81).
Nevertheless, additional studies are required in order to elucidate
the molecular targets of GLI3 which control cell proliferation.
In this study, GLI3 inhibition decreased
cellular invasion in OSCC. We can speculate that the reduction in
the CSCLC-EMT fraction may have contributed, possibly via
SLUG downregulation. The EMT process is associated with an
enhancement in motility and cellular invasion (82), contributing actively to tumour
progression. Yan et al (2011) have observed that the
pharmacological inhibition of Shh/Gli pathway leads not only to the
inhibition of cellular proliferation by the downregulation of
GLI1, GLI2, CCND1 and BCL2 and
upregulation of caspase-3, but also to a significant decrease in
cell migration (83).
In this study, non-tumoural margins exhibited a
weak GLI3 expression, mainly located in the basal cell layer, where
the normal epithelial stem cells reside. GLI3 expression was
correlated with tumour size, although no association with lymph
node metastasis or overall survival was found. There seems to be
only one study in the literature evaluating GLI3 expression in
OSCC; the authors found that GLI3 is weakly/moderately expressed in
OSCC. They did not find any correlation to survival in a cohort of
60 patients (52). We believe that
additional studies are required to investigate the prognostic value
of GLI3 in OSCC.
Taken together, the findings of this study
demonstrate that the signalling pathways which control normal stem
cells are aberrantly upregulated in CSCLC, isolated based on CD44
expression in OSCC. Moreover, GLI3 inhibition leads to a
significant decrease in the number and function of the
CD44high/ESAhigh (EPI-CSCLC) and
CD44high/ESAlow (EMT-CSCLC) cell fractions
and an increase in the CD44low subpopulation. These
results indicate the relevant role this gene plays in CSC
self-renewal, maintenance and differentiation. In addition to its
effects on stemness, GLI3 also inhibits cell proliferation
and invasion, both processes which are necessary for tumour
progression. This study highlights that GLI3 is a possible
target to be investigated in the future, either isolated or in
combination with other drugs, for therapies based on CSCs in
OSCC.
Acknowledgments
Not applicable.
Funding
This study was financially supported by the São
Paulo Research Foundation (FAPESP grant nos. 2011/21395-8 and
2012/00786-1).
Availability of data and materials
The datasets used and/or analyzed during the
current study are available from the corresponding author on
reasonable request.
Authors' contributions
MFSDR was the major contributor to the
conceptualization and design of the project, acquisition,
interpretation and analysis of all data and writing, revising and
formatting of the manuscript. LM contributed with acquisition,
interpretation and analysis of the majority of the data with cell
culture and immunohistochemistry, also collaborated with writing
and formatting the manuscript. NPdA provided and analysed flow
cytometry data. DH contributed to the acquisition of the cell
culture data. COR contributed to the FACS analysis, and to the
writing, drafting and critical revision of the manuscript. RAM,
TNT, RRG and EET provided the clinical data and samples for
immunohistochemical analysis. FDN oversaw the study
conceptualization and design, writing, drafting and critical
revision of the manuscript. All authors have read and approved the
publication of this version.
Ethics approval and consent to
participate
The study was performed with approval from the
Brazilian National Ethics Committee (Process #16491) and in
accordance with the Declaration of Helsinki. The collection of
samples, clinical data, and histopathological analysis was
performed after acquisition of a signed informed consent form from
each patient.
Patient consent for publication
Not applicable.
Competing interests
All authors declare that there are no competing
interests.
References
|
1
|
Ferlay J, Soerjomataram I, Dikshit R, Eser
S, Mathers C, Rebelo M, Parkin DM, Forman D and Bray F: Cancer
incidence and mortality worldwide: Sources methods and major
patterns in GLOBOCAN 2012. Int J Cancer. 136:E359–E386. 2015.
View Article : Google Scholar
|
|
2
|
Jemal A, Bray F, Center MM, Ferlay J, Ward
E and Forman D: Global cancer statistics. CA Cancer J Clin.
61:69–90. 2011. View Article : Google Scholar : PubMed/NCBI
|
|
3
|
Ausoni S, Boscolo-Rizzo P, Singh B, Da
Mosto MC, Spinato G, Tirelli G, Spinato R and Azzarello G:
Targeting cellular and molecular drivers of head and neck squamous
cell carcinoma: Current options and emerging perspectives. Cancer
Metastasis Rev. 35:413–426. 2016. View Article : Google Scholar : PubMed/NCBI
|
|
4
|
Baxi S, Fury M, Ganly I, Rao S and Pfister
DG: Ten years of progress in head and neck cancers. J Natl Compr
Canc Netw. 10:806–810. 2012. View Article : Google Scholar : PubMed/NCBI
|
|
5
|
Prince ME, Sivanandan R, Kaczorowski A,
Wolf GT, Kaplan MJ, Dalerba P, Weissman IL, Clarke MF and Ailles
LE: Identification of a subpopulation of cells with cancer stem
cell properties in head and neck squamous cell carcinoma. Proc Natl
Acad Sci USA. 104:973–978. 2007. View Article : Google Scholar : PubMed/NCBI
|
|
6
|
Biddle A, Gammon L, Liang X, Costea DE and
Mackenzie IC: Phenotypic plasticity determines cancer stem cell
therapeutic resistance in oral squamous cell carcinoma.
EBioMedicine. 4:138–145. 2016. View Article : Google Scholar : PubMed/NCBI
|
|
7
|
Zhang Z, Filho MS and Nör JE: The biology
of head and neck cancer stem cells. Oral Oncol. 48:1–9. 2012.
View Article : Google Scholar :
|
|
8
|
Johansson AC, La Fleur L, Melissaridou S
and Roberg K: The relationship between EMT, CD44high/EGFRlow
phenotype, and treatment response in head and neck cancer cell
lines. J Oral Pathol Med. 45:640–646. 2016. View Article : Google Scholar : PubMed/NCBI
|
|
9
|
Naik PP, Das DN, Panda PK, Mukhopadhyay S,
Sinha N, Praharaj PP, Agarwal R and Bhutia SK: Implications of
cancer stem cells in developing therapeutic resistance in oral
cancer. Oral Oncol. 62:122–135. 2016. View Article : Google Scholar : PubMed/NCBI
|
|
10
|
Gemenetzidis E, Gammon L, Biddle A, Emich
H and Mackenzie IC: Invasive oral cancer stem cells display
resistance to ionising radiation. Oncotarget. 6:43964–43977. 2015.
View Article : Google Scholar : PubMed/NCBI
|
|
11
|
Bourguignon LY, Shiina M and Li JJ:
Hyaluronan-CD44 interaction promotes oncogenic signaling, microRNA
functions, chemoresistance, and radiation resistance in cancer stem
cells leading to tumor progression. Adv Cancer Res. 123:255–275.
2014. View Article : Google Scholar : PubMed/NCBI
|
|
12
|
Zhang Q, Shi S, Yen Y, Brown J, Ta JQ and
Le AD: A subpopulation of CD133(+) cancer stem-like cells
characterized in human oral squamous cell carcinoma confer
resistance to chemotherapy. Cancer Lett. 289:151–160. 2010.
View Article : Google Scholar
|
|
13
|
La Fleur L, Johansson AC and Roberg K: A
CD44high/EGFRlow subpopulation within head and neck cancer cell
lines shows an epithelial-mesenchymal transition phenotype and
resistance to treatment. PLoS One. 7:e440712012. View Article : Google Scholar : PubMed/NCBI
|
|
14
|
Biddle A, Liang X, Gammon L, Fazil B,
Harper LJ, Emich H, Costea DE and Mackenzie IC: Cancer stem cells
in squamous cell carcinoma switch between two distinct phenotypes
that are preferentially migratory or proliferative. Cancer Res.
71:5317–5326. 2011. View Article : Google Scholar : PubMed/NCBI
|
|
15
|
Ghuwalewala S, Ghatak D, Das P, Dey S,
Sarkar S, Alam N, Panda CK and Roychoudhury S: CD44(high)CD24(low)
molecular signature determines the cancer stem cell and EMT
phenotype in oral squamous cell carcinoma. Stem Cell Res (Amst).
16:405–417. 2016. View Article : Google Scholar
|
|
16
|
Seino S, Shigeishi H, Hashikata M,
Higashikawa K, Tobiume K, Uetsuki R, Ishida Y, Sasaki K, Naruse T,
Rahman MZ, et al: CD44(high)/ALDH1(high) head and neck squamous
cell carcinoma cells exhibit mesenchymal characteristics and
GSK3β-dependent cancer stem cell properties. J Oral Pathol Med.
45:180–188. 2016. View Article : Google Scholar
|
|
17
|
Takebe N, Miele L, Harris PJ, Jeong W,
Bando H, Kahn M, Yang SX and Ivy SP: Targeting Notch, Hedgehog, and
Wnt pathways in cancer stem cells: Clinical update. Nat Rev Clin
Oncol. 12:445–464. 2015. View Article : Google Scholar : PubMed/NCBI
|
|
18
|
Kasper M, Schnidar H, Neill GW, Hanneder
M, Klingler S, Blaas L, Schmid C, Hauser-Kronberger C, Regl G,
Philpott MP, et al: Selective modulation of Hedgehog/GLI target
gene expression by epidermal growth factor signaling in human
keratinocytes. Mol Cell Biol. 26:6283–6298. 2006. View Article : Google Scholar : PubMed/NCBI
|
|
19
|
Pak E and Segal RA: Hedgehog signal
transduction: Key players, oncogenic drivers, and cancer therapy.
Dev Cell. 38:333–344. 2016. View Article : Google Scholar : PubMed/NCBI
|
|
20
|
Liu J, Zeng H and Liu A: The loss of Hh
responsiveness by a non-ciliary Gli2 variant. Development.
142:1651–1660. 2015. View Article : Google Scholar : PubMed/NCBI
|
|
21
|
Shi X, Zhang Z, Zhan X, Cao M, Satoh T,
Akira S, Shpargel K, Magnuson T, Li Q, Wang R, et al: An epigenetic
switch induced by Shh signalling regulates gene activation during
development and medulloblastoma growth. Nat Commun. 5:54252014.
View Article : Google Scholar : PubMed/NCBI
|
|
22
|
Junker JP, Peterson KA, Nishi Y, Mao J,
McMahon AP and van Oudenaarden A: A predictive model of
bifunctional transcription factor signaling during embryonic tissue
patterning. Dev Cell. 31:448–460. 2014. View Article : Google Scholar : PubMed/NCBI
|
|
23
|
Peterson KA, Nishi Y, Ma W, Vedenko A,
Shokri L, Zhang X, McFarlane M, Baizabal JM, Junker JP, van
Oudenaarden A, et al: Neural-specific Sox2 input and differential
Gli-binding affinity provide context and positional information in
Shh-directed neural patterning. Genes Dev. 26:2802–2816. 2012.
View Article : Google Scholar : PubMed/NCBI
|
|
24
|
Li H, Yue D, Jin JQ, Woodard GA, Tolani B,
Luh TM, Giroux-Leprieur E, Mo M, Chen Z, Che J, et al: Gli promotes
epithelial-mesenchymal transition in human lung adenocarcinomas.
Oncotarget. 7:80415–80425. 2016.PubMed/NCBI
|
|
25
|
Yauch RL, Gould SE, Scales SJ, Tang T,
Tian H, Ahn CP, Marshall D, Fu L, Januario T, Kallop D, et al: A
paracrine requirement for hedgehog signalling in cancer. Nature.
455:406–410. 2008. View Article : Google Scholar : PubMed/NCBI
|
|
26
|
Wang B, Fallon JF and Beachy PA:
Hedgehog-regulated processing of Gli3 produces an
anterior/posterior repressor gradient in the developing vertebrate
limb. Cell. 100:423–434. 2000. View Article : Google Scholar : PubMed/NCBI
|
|
27
|
McIntyre BAS, Ramos-Mejia V, Rampalli S,
Mechae R, Lee JH, Alev C, Sheng G and Bhatia M: Gli3-mediated
hedgehog inhibition in human pluripotent stem cells initiates and
augments developmental programming of adult hematopoiesis. Blood.
121:1543–1552. PubMed/NCBI
|
|
28
|
Rimkus TK, Carpenter RL, Qasem S, Chan M
and Lo HW: Targeting the sonic Hedgehog signaling pathway: Review
of Smoothened and GLI inhibitors. Cancers (Basel). 8. pp. E222016,
View Article : Google Scholar
|
|
29
|
Hahn H, Wicking C, Zaphiropoulous PG,
Gailani MR, Shanley S, Chidambaram A, Vorechovsky I, Holmberg E,
Unden AB, Gillies S, et al: Mutations of the human homolog of
Drosophila patched in the nevoid basal cell carcinoma syndrome.
Cell. 85:841–851. 1996. View Article : Google Scholar : PubMed/NCBI
|
|
30
|
Johnson RL, Rothman AL, Xie J, Goodrich
LV, Bare JW, Bonifas JM, Quinn AG, Myers RM, Cox DR, Epstein EH Jr,
et al: Human homolog of patched, a candidate gene for the basal
cell nevus syndrome. Science. 272:1668–1671. 1996. View Article : Google Scholar : PubMed/NCBI
|
|
31
|
Bar EE, Chaudhry A, Lin A, Fan X, Schreck
K, Matsui W, Piccirillo S, Vescovi AL, DiMeco F, Olivi A, et al:
Cyclopamine-mediated hedgehog pathway inhibition depletes stem-like
cancer cells in glioblastoma. Stem Cells. 25:2524–2533. 2007.
View Article : Google Scholar : PubMed/NCBI
|
|
32
|
Carpenter RL, Paw I, Zhu H, Sirkisoon S,
Xing F, Watabe K, Debinski W and Lo HW: The gain-of-function GLI1
transcription factor TGLI1 enhances expression of VEGF-C and TEM7
to promote glioblastoma angiogenesis. Oncotarget. 6:22653–22665.
2015. View Article : Google Scholar : PubMed/NCBI
|
|
33
|
Suzman DL and Antonarakis ES: Clinical
implications of Hedgehog pathway signaling in prostate cancer.
Cancers (Basel). 7:1983–1993. 2015. View Article : Google Scholar
|
|
34
|
Abdel-Rahman O: Hedgehog pathway
aberrations and gastric cancer; evaluation of prognostic impact and
exploration of therapeutic potentials. Tumour Biol. 36:1367–1374.
2015. View Article : Google Scholar : PubMed/NCBI
|
|
35
|
Kenney AM and Rowitch DH: Sonic hedgehog
promotes G(1) cyclin expression and sustained cell cycle
progression in mammalian neuronal precursors. Mol Cell Biol.
20:9055–9067. 2000. View Article : Google Scholar : PubMed/NCBI
|
|
36
|
Bigelow RL, Jen EY, Delehedde M, Chari NS
and McDonnell TJ: Sonic hedgehog induces epidermal growth factor
dependent matrix infiltration in HaCaT keratinocytes. J Invest
Dermatol. 124:457–465. 2005. View Article : Google Scholar : PubMed/NCBI
|
|
37
|
Yoo YA, Kang MH, Lee HJ, Kim BH, Park JK,
Kim HK, Kim JS and Oh SC: Sonic hedgehog pathway promotes
metastasis and lymphangiogenesis via activation of Akt, EMT, and
MMP-9 pathway in gastric cancer. Cancer Res. 71:7061–7070. 2011.
View Article : Google Scholar : PubMed/NCBI
|
|
38
|
Katoh Y, Katoh M and Yoo YA: Hedgehog
signaling, epithelial-to-mesenchymal transition and miRNA (Review).
Int J Mol Med. 22:271–275. 2008.PubMed/NCBI
|
|
39
|
Pantazi E, Gemenetzidis E, Teh MT, Reddy
SV, Warnes G, Evagora C, Trigiante G and Philpott MP: GLI2 is a
regulator of β-catenin and is associated with loss of E-Cadherin,
cell invasiveness, and long-term epidermal regeneration. J Invest
Dermatol. 137:1719–1730. 2017. View Article : Google Scholar : PubMed/NCBI
|
|
40
|
Zhou M, Hou Y, Yang G, Zhang H, Tu G, Du
YE, Wen S, Xu L, Tang X, Tang S, et al: LncRNA-Hh strengthen cancer
stem cells generation in twist-positive breast cancer via
activation of Hedgehog signaling pathway. Stem Cells. 34:55–66.
2016. View Article : Google Scholar
|
|
41
|
Zhang C, Li C, He F, Cai Y and Yang H:
Identification of CD44+CD24+ gastric cancer
stem cells. J Cancer Res Clin Oncol. 137:1679–1686. 2011.
View Article : Google Scholar : PubMed/NCBI
|
|
42
|
Zhang K, Che S, Pan C, Su Z, Zheng S, Yang
S, Zhang H, Li W, Wang W and Liu J: The SHH/Gli axis regulates
CD90-mediated liver cancer stem cell function by activating the
IL6/JAK2 pathway. J Cell Mol Med. 22:3679–3690. 2018. View Article : Google Scholar : PubMed/NCBI
|
|
43
|
Cavicchioli Buim ME, Gurgel CA, Gonçalves
Ramos EA, Lourenço SV and Soares FA: Activation of sonic hedgehog
signaling in oral squamous cell carcinomas: A preliminary study.
Hum Pathol. 42:1484–1490. 2011. View Article : Google Scholar : PubMed/NCBI
|
|
44
|
Fan HX, Wang S, Zhao H, Liu N, Chen D, Sun
M and Zheng JH: Sonic hedgehog signaling may promote invasion and
metastasis of oral squamous cell carcinoma by activating MMP-9 and
E-cadherin expression. Med Oncol. 31:412014. View Article : Google Scholar : PubMed/NCBI
|
|
45
|
Schneider FT, Schänzer A, Czupalla CJ,
Thom S, Engels K, Schmidt MH, Plate KH and Liebner S: Sonic
hedgehog acts as a negative regulator of {beta}-catenin signaling
in the adult tongue epithelium. Am J Pathol. 177:404–414. 2010.
View Article : Google Scholar : PubMed/NCBI
|
|
46
|
Honami T, Shimo T, Okui T, Kurio N, Hassan
NM, Iwamoto M and Sasaki A: Sonic hedgehog signaling promotes
growth of oral squamous cell carcinoma cells associated with bone
destruction. Oral Oncol. 48:49–55. 2012. View Article : Google Scholar
|
|
47
|
Mikami Y, Fujii S, Nagata K, Wada H,
Hasegawa K, Abe M, Yoshimoto RU, Kawano S, Nakamura S and Kiyoshima
T: GLI-mediated Keratin 17 expression promotes tumor cell growth
through the anti-apoptotic function in oral squamous cell
carcinomas. J Cancer Res Clin Oncol. 143:1381–1393. 2017.
View Article : Google Scholar : PubMed/NCBI
|
|
48
|
Livak KJ and Schmittgen TD: Analysis of
relative gene expression data using real-time quantitative PCR and
the 2(-ΔΔC(T)) method. Methods. 25:402–408. 2001. View Article : Google Scholar
|
|
49
|
de Andrade NP, Rodrigues MF, Rodini CO and
Nunes FD: Cancer stem cell, cytokeratins and epithelial to
mesenchymal transition markers expression in oral squamous cell
carcinoma derived from ortothopic xenoimplantation of CD44high
cells. Pathol Res Pract. 213:235–244. 2017. View Article : Google Scholar : PubMed/NCBI
|
|
50
|
Rodrigues MF, de Oliveira Rodini C, de
Aquino Xavier FC, Paiva KB, Severino P, Moyses RA, López RM,
DeCicco R, Rocha LA, Carvalho MB, et al: PROX1 gene is
differentially expressed in oral cancer and reduces cellular
proliferation. Medicine (Baltimore). 93:e1922014. View Article : Google Scholar
|
|
51
|
Brierley JD, Gospodarowicz MK and
Wittekind C: TNM classification of malignant tumours. Wiley
Blackwell; Oxford: pp. 17–21. 2017
|
|
52
|
Schneider S, Thurnher D, Kloimstein P,
Leitner V, Petzelbauer P, Pammer J, Brunner M and Erovic BM:
Expression of the Sonic hedgehog pathway in squamous cell carcinoma
of the skin and the mucosa of the head and neck. Head Neck.
33:244–250. 2011. View Article : Google Scholar
|
|
53
|
Zöller M: CD44: Can a cancer-initiating
cell profit from an abundantly expressed molecule? Nat Rev Cancer.
11:254–267. 2011. View Article : Google Scholar : PubMed/NCBI
|
|
54
|
Williams K, Motiani K, Giridhar PV and
Kasper S: CD44 integrates signaling in normal stem cell, cancer
stem cell and (pre) metastatic niches. Exp Biol Med (Maywood).
238:324–338. 2013. View Article : Google Scholar
|
|
55
|
Ridgway J, Zhang G, Wu Y, Stawicki S,
Liang WC, Chanthery Y, Kowalski J, Watts RJ, Callahan C, Kasman I,
et al: Inhibition of Dll4 signalling inhibits tumour growth by
deregulating angiogenesis. Nature. 444:1083–1087. 2006. View Article : Google Scholar : PubMed/NCBI
|
|
56
|
Zhao ZL, Zhang L, Huang CF, Ma SR, Bu LL,
Liu JF, Yu GT, Liu B, Gutkind JS, Kulkarni AB, et al: NOTCH1
inhibition enhances the efficacy of conventional chemotherapeutic
agents by targeting head neck cancer stem cell. Sci Rep.
6:247042016. View Article : Google Scholar : PubMed/NCBI
|
|
57
|
Ishida T, Hijioka H, Kume K, Miyawaki A
and Nakamura N: Notch signaling induces EMT in OSCC cell lines in a
hypoxic environment. Oncol Lett. 6:1201–1206. 2013. View Article : Google Scholar : PubMed/NCBI
|
|
58
|
Yoshida R, Nagata M, Nakayama H,
Niimori-Kita K, Hassan W, Tanaka T, Shinohara M and Ito T: The
pathological significance of Notch1 in oral squamous cell
carcinoma. Lab Invest. 93:1068–1081. 2013. View Article : Google Scholar : PubMed/NCBI
|
|
59
|
Weaver AN, Burch MB, Cooper TS, Della
Manna DL, Wei S, Ojesina AI, Rosenthal EL and Yang ES: Notch
signaling activation is associated with patient mortality and
increased FGF1-mediated invasion in squamous cell carcinoma of the
oral cavity. Mol Cancer Res. 14:883–891. 2016. View Article : Google Scholar : PubMed/NCBI
|
|
60
|
Grigoryan T, Wend P, Klaus A and
Birchmeier W: Deciphering the function of canonical Wnt signals in
development and disease: Conditional loss- and gain-of-function
mutations of beta-catenin in mice. Genes Dev. 22:2308–2341. 2008.
View Article : Google Scholar : PubMed/NCBI
|
|
61
|
Holland JD, Klaus A, Garratt AN and
Birchmeier W: Wnt signaling in stem and cancer stem cells. Curr
Opin Cell Biol. 25:254–264. 2013. View Article : Google Scholar : PubMed/NCBI
|
|
62
|
Song J, Chang I, Chen Z, Kang M and Wang
CY: Characterization of side populations in HNSCC: Highly invasive,
chemoresistant and abnormal Wnt signaling. PLoS One. 5:e114562010.
View Article : Google Scholar : PubMed/NCBI
|
|
63
|
Yang K, Wang X, Zhang H, Wang Z, Nan G, Li
Y, Zhang F, Mohammed MK, Haydon RC, Luu HH, et al: The evolving
roles of canonical WNT signaling in stem cells and tumorigenesis:
Implications in targeted cancer therapies. Lab Invest. 96:116–136.
2016. View Article : Google Scholar :
|
|
64
|
Aberger F: Context-dependent signal
integration by the GLI code: The oncogenic load, pathways,
modifiers and implications for cancer therapy. Semin Cell Dev Biol.
33:93–104. 2014. View Article : Google Scholar : PubMed/NCBI
|
|
65
|
Scales SJ and de Sauvage FJ: Mechanisms of
Hedgehog pathway activation in cancer and implications for therapy.
Trends Pharmacol Sci. 30:303–312. 2009. View Article : Google Scholar : PubMed/NCBI
|
|
66
|
Stecca B: Context-dependent regulation of
the GLI code in cancer by HEDGEHOG and non-HEDGEHOG signals. J Mol
Cell Biol. 2:84–95. 2010. View Article : Google Scholar : PubMed/NCBI
|
|
67
|
Varnat F, Duquet A, Malerba M, Zbinden M,
Mas C, Gervaz P and Ruiz i Altaba A: Human colon cancer epithelial
cells harbour active HEDGEHOG-GLI signalling that is essential for
tumour growth, recurrence, metastasis and stem cell survival and
expansion. EMBO Mol Med. 1:338–351. 2009. View Article : Google Scholar
|
|
68
|
Yang N, Zhou TC, Lei XX, Wang C, Yan M,
Wang ZF, Liu W, Wang J, Ming KH, Wang BC, et al: Inhibition of
Sonic Hedgehog signaling pathway by thiazole antibiotic
thiostrepton attenuates the CD44+/CD24-stem-like
population and sphere-forming capacity in triple-negative breast
cancer. Cell Physiol Biochem. 38:1157–1170. 2016. View Article : Google Scholar
|
|
69
|
Sharma N, Nanta R, Sharma J, Gunewardena
S, Singh KP, Shankar S and Srivastava RK: PI3K/AKT/mTOR and sonic
hedgehog pathways cooperate together to inhibit human pancreatic
cancer stem cell characteristics and tumor growth. Oncotarget.
6:32039–32060. 2015. View Article : Google Scholar : PubMed/NCBI
|
|
70
|
Bora-Singhal N, Perumal D, Nguyen J and
Chellappan S: Gli1-mediated regulation of Sox2 facilitates
self-renewal of stem-like cells and confers resistance to EGFR
inhibitors in non-small cell lung cancer. Neoplasia. 17:538–551.
2015. View Article : Google Scholar : PubMed/NCBI
|
|
71
|
Sell S: Cancer stem cells and
differentiation therapy. Tumour Biol. 27:59–70. 2006. View Article : Google Scholar : PubMed/NCBI
|
|
72
|
Pattabiraman DR and Weinberg RA: Targeting
the epithelial-to-mesenchymal transition: The case for
differentiation-based therapy. Cold Spring Harb Symp Quant Biol.
81:11–19. 2016. View Article : Google Scholar
|
|
73
|
Cao L, Bombard J, Cintron K, Sheedy J,
Weetall ML and Davis TW: BMI1 as a novel target for drug discovery
in cancer. J Cell Biochem. 112:2729–2741. 2011. View Article : Google Scholar : PubMed/NCBI
|
|
74
|
Nör C, Zhang Z, Warner KA, Bernardi L,
Visioli F, Helman JI, Roesler R and Nör JE: Cisplatin induces Bmi-1
and enhances the stem cell fraction in head and neck cancer.
Neoplasia. 16:137–146. 2014. View Article : Google Scholar : PubMed/NCBI
|
|
75
|
Tsai LL, Hu FW, Lee SS, Yu CH, Yu CC and
Chang YC: Oct4 mediates tumor initiating properties in oral
squamous cell carcinomas through the regulation of
epithelial-mesenchymal transition. PLoS One. 9:e872072014.
View Article : Google Scholar : PubMed/NCBI
|
|
76
|
Cai J, He B, Li X, Sun M, Lam AK, Qiao B
and Qiu W: Regulation of tumorigenesis in oral epithelial cells by
defined reprogramming factors Oct4 and Sox2. Oncol Rep. 36:651–658.
2016. View Article : Google Scholar : PubMed/NCBI
|
|
77
|
Chaffer CL, San Juan BP, Lim E and
Weinberg RA: EMT, cell plasticity and metastasis. Cancer Metastasis
Rev. 35:645–654. 2016. View Article : Google Scholar : PubMed/NCBI
|
|
78
|
Ke Z, Caiping S, Qing Z and Xiaojing W:
Sonic hedgehog-Gli1 signals promote epithelial-mesenchymal
transition in ovarian cancer by mediating PI3K/AKT pathway. Med
Oncol. 32:3682015. View Article : Google Scholar
|
|
79
|
Rajurkar M, De Jesus-Monge WE, Driscoll
DR, Appleman VA, Huang H, Cotton JL, Klimstra DS, Zhu LJ, Simin K,
Xu L, et al: The activity of Gli transcription factors is essential
for Kras-induced pancreatic tumorigenesis. Proc Natl Acad Sci USA.
109:E1038–E1047. 2012. View Article : Google Scholar : PubMed/NCBI
|
|
80
|
Ramaswamy B, Lu Y, Teng KY, Nuovo G, Li X,
Shapiro CL and Majumder S: Hedgehog signaling is a novel
therapeutic target in tamoxifen-resistant breast cancer aberrantly
activated by PI3K/AKT pathway. Cancer Res. 72:5048–5059. 2012.
View Article : Google Scholar : PubMed/NCBI
|
|
81
|
Shih CH, Chang YJ, Huang WC, Jang TH, Kung
HJ, Wang WC, Yang MH, Lin MC, Huang SF, Chou SW, et al:
EZH2-mediated upregulation of ROS1 oncogene promotes oral cancer
metastasis. Oncogene. 36:6542–6554. 2017. View Article : Google Scholar : PubMed/NCBI
|
|
82
|
Shibue T and Weinberg RA: EMT, CSCs, and
drug resistance: The mechanistic link and clinical implications.
Nat Rev Clin Oncol. 14:611–629. 2017. View Article : Google Scholar : PubMed/NCBI
|
|
83
|
Yan M, Wang L, Zuo H, Zhang Z, Chen W, Mao
L and Zhang P: HH/GLI signalling as a new therapeutic target for
patients with oral squamous cell carcinoma. Oral Oncol. 47:504–509.
2011. View Article : Google Scholar : PubMed/NCBI
|