Introduction
Colorectal cancer (CRC) is the third most common
cause of cancer-associated mortality worldwide (1). A number of studies have revealed that
CRC is heterogeneous, manifesting with variegated cellular
morphologies, histopathology and chemoresistant capacity; these
biological characteristics of CRC have contributed to the failure
of conventional therapeutics (2–4). In
order to improve the prognosis of patients with CRC, preclinical
tumor models are essential for simulating primary tumors,
exploiting novel therapeutic approaches and predicting drug
responses in vivo (5). Even
though preclinical models have been widely used, their advantages
and limitations remain largely unknown.
It has been suggested that cancer stem cells (CSCs)
may be responsible for tumor heterogeneity (6). In CRC, it has been revealed that the
tumor bulk exhibits cellular hierarchy with CSCs at the apex,
possessing self-renewal abilities, multi-differentiation potential
and an inherent chemoresistant capacity (7). In addition, tumor recurrence in
patients with CRC is closely associated with the presence of CSCs
in tumors (8). These findings
indicate that CSCs may be promising therapeutic targets. Therefore,
the long-term maintenance of stem cell-like properties in
preclinical models is critical for capturing the real primary tumor
conditions.
Three dimensional (3D) cultures, such as sphere
formation assays and organoid culture, can be used as platforms
that support the long-term expansion of primary tumor cells
(9). However, whether these 3D
models can preserve the original properties of parental tumors
remains unclear. Sphere formation assays, for instance, have been
reported to expand CSCs during serial passages, and thus they are
not a suitable platform for investigating drug activity (10). Organoid culture, on the other hand,
has been exploited for predicting drug efficacy in vivo
(11–14). However, it is still unclear whether
the stem cell-like properties would be maintained long-term in
organoid culture.
The present study generated sphere and organoid
cultures side by side using individual CRC specimens and
demonstrated that: i) The sphere formation assay was enriched for
CSCs, while the organoid culture only maintained CSCs; and ii) the
frequency of chemoresistant CRC cells in each of the generations
during the serial organoid passages were almost same; however, the
serial sphere formation assay increased the frequency of
chemoresistant cells.
Materials and methods
Collection of CRC specimens and
preparation of the single cell suspension
Surgical human colorectal adenocarcinoma samples
were obtained with written informed consent and approval from the
Institutional Review Board of Tongji Hospital, Tongji Medical
College, Huazhong University of Science and Technology (Wuhan,
China; IRB ID: 20141106); the experiments were conducted according
to the principles of the Declaration of Helsinki. In total, 20
tumor specimens from CRC patients were included in the present
study, and the patients were assigned case numbers CRC1-20. The
patient clinical characteristics are listed in Table SI. The CRC
specimens were disassociated into single primary CRC cells as
described previously (15).
Briefly, fresh specimens were minced into small sections with
scissors. The completely minced pieces were then incubated in
serum-free Dulbecco's modified Eagle's medium (DMEM)/F12 (Thermo
Fisher Scientific, Inc., Waltham, MA, USA) containing 1.5 mg/ml
collagenase IV (Gibco; Thermo Fisher Scientific, Inc.), 20
µg/ml hyaluronidase (Sigma-Aldrich; Merck KGaA, Darmstadt,
Germany) and 1% penicillin/streptomycin (Thermo Fisher Scientific,
Inc.) at 37°C for 1 to 2 h. To eliminate red blood cells, the cells
were incubated in red blood cell lysis buffer (eBioscience; Thermo
Fisher Scientific, Inc.) on ice for 10 min, then washed twice with
PBS. The single primary CRC cells were then resuspended in PBS for
use in subsequent organoid culture, sphere forming assay and animal
studies.
Organoid culture
Organoid culture was processed as previously
described (15,16), with several modifications. For
culture establishment, single primary CRC cells were embedded in
Matrigel (growth factor reduced; phenol free; BD Biosciences,
Franklin Lakes, NJ, USA) and seeded into 24-well culture plates at
the indicated dosage (1,000 cells/30 µl Matrigel/well).
Following Matrigel polymerization, the cells were overlaid with
human colorectal cancer organoid culture medium and incubated at
37°C in humidified air containing 5% CO2. The
composition of the human colorectal cancer organoid culture medium
was as follows: DMEM/F12 (Invitrogen; Thermo Fisher Scientific,
Inc.) supplemented with 1X B27 (Invitrogen; Thermo Fisher
Scientific, Inc.), 50 ng/ml recombinant human EGF (Sigma-Aldrich;
Merck KGaA), 10 nM Gastrin (Sigma-Aldrich; Merck KGaA) and 500 nM
A83-01 (Tocris Bioscience, Bristol, UK) (16). The medium was changed every 3 days.
To calculate the forming efficiency, following 7 days
post-embedding, organoids with diameters >100 µm were
scored under an inverted microscope (Leica Microsystems, Wetzlar,
Germany). The forming efficiency (%) = scored organoid number /
total embedding CRC cells. For serial passages, following 7 days
post-embedding, whole organoids were trypsinized using 0.025%
trypsin/EDTA at 37°C for 15–20 min. Single organoid-derived cells
were then resuspended with PBS and employed for a new round of
organoid culture in Matrigel.
Sphere formation assay
The sphere formation assay was conducted as
previously described (17,18). Single primary CRC cells were
resuspended in standard stem cell medium (SCM), which consisted of
the following: DMEM/F12 (Invitrogen; Thermo Fisher Scientific,
Inc.) supplemented with 1X B27 (Invitrogen; Thermo Fisher
Scientific, Inc.), 20 ng/ml human recombinant epidermal growth
factor (Sigma-Aldrich; Merck KGaA) and 20 ng/ml basic fibroblast
growth factor (Sigma-Aldrich; Merck KGaA) (17). The spheres were cultured at 37°C in
humidified air containing 5% CO2. To calculate the
forming efficiency, following 7 days post-plating, spheres with
diameters >50 µm were scored under an inverted microscope
(Leica Microsystems). The forming efficiency (%) = scored sphere
number / total plating CRC cells. For serial passage experiments,
at 7 days post-plating, spheres were trypsinized as aforementioned.
Single sphere-derived cells were then replated in SCM for a new
round of sphere forming assay.
Animal experiments
Female, 4- to 6-week-old NOD/SCID mice (n=135) were
purchased from Beijing HFK Bioscience Co., Ltd. (Beijing, China)
and were maintained according to protocols approved by the
Institutional Animal Care and Use Committee, Huazhong University of
Science and Technology (Hubei, China; IACUC ID: 2014S652). During
experimentation, all mice were kept in the animal center of the
Tongji Medical college, Huazhong University of Science and
Technology under specific pathogen-free (SPF) conditions (License
Number: SYXK#2016-0057). For maintenance of mice, a stable breeding
environment was provided: a 12-h/12-h light/dark, a temperature of
21°C and a relative humidity 50% and allowed access to water and
food ad libitum. For the establishment of patient-derived
xenografts (termed PDXs), n=40 mice were used, and the detailed
information of PDX generation is presented in Table SI. For
transplantation assays (n=5 mice were used), the single cells
derived from CRC6 specimens and the corresponding organoids and
spheres generating form them were resuspended in a PBS/Matrigel (BD
Biosciences) mixture (1:1 volume) (15,17).
The cells were then injected into the subcutaneous tissue of mouse
flanks using 27-gauge needles at at dose of 125,000 cells/point.
For histopathological analyses, the xenografts derived from primary
cells (termed PDX, 1 mice), organoid cells (termed ODX, 2 mice) and
sphere cells (termed SDX, 2 mice) were harvested on day 30
post-implantation. The mice were anesthetized and sacrificed
according to the AVMA guidelines, and hematoxylin and eosin
(H&E) staining was performed as previously described (15). For limited dilution assays (n=90
mice were used), 10,000, 1,000 and 100 single cells derived from
organoids at 1st - 3rd generation, or 1,000, 100 and 10 single
cells derived from spheres at 1st - 3rd generation were implanted
per injection (5 mice for each dose at each group). For the limited
dilution assays, the tumor volumes were examined every 3 days, and
the mice with excessive weight loss (humane endpoint)
post-injection were excluded from the study and euthanized (n=7),
and these included: 1 mouse injected with organoid cells at 1st
generation; 2 mice injected with organoid cells at 2nd generation;
4 mice injected with organoid cells at 3rd generation. Following
sacrifice, tumors were removed from the mice and weighed to
evaluate tumor development. The frequency of tumor-initiating cells
and statistical significance were examined using the Extreme
Limiting Dilution Analysis software (bioinf.wehi.edu.au/software/elda/index.html).
Immunofluorescence
The immunofluorescence procedures for organoids and
spheres were performed as previously described (19). Prior to staining, organoids or
spheres were fixed in 4% PFA at 4°C for 20 min. For
immunofluorescence staining, the following antibodies were used to
detect antigens: Mouse-anti-human cluster of differentiation
(CD)-133 (1:100; cat. no. 66666-1-lg; ProteinTech Group, Inc.,
Chicago, IL, USA) and rabbit-anti-human cytokeratin (CK)-20 (1:100;
cat. no. 13063; Cell Signaling Technology, Inc., Danvers, MA, USA).
Briefly, the sections were blocked with 5% (w/v) bovine serum
albumin (Invitrogen; Thermo Fisher Scientific, Inc.) in PBS, then
incubated with the primary antibodies at 4°C overnight, followed by
staining with secondary antibodies conjugated to Streptavidin-Cy3
(1:100; cat. no. SA1010; Thermo Fisher Scientific, Inc.) or Alexa
Flour 488 (1:100; cat. no. 705-546-147; Jackson ImmunoResearch
Laboratories, Inc., West Grove, PA, USA) at room temperature for 2
h. Finally, nuclei were stained with 4′,6-diamidino-2-phenylindole
(DAPI, Sigma-Aldrich Merck KGaA) at room temperature for 10 min.
Images of organoids and spheres were captured under a fluorescence
microscope (TRRFM; Olympus Corp., Tokyo, Japan) or a confocal
microscope (FV1000; Olympus Corp.).
Reverse transcription-quantitative
polymerase chain reaction (RT-qPCR)
Total RNA was extracted using RNAiso Plus (Takara
Bio, Inc., Otsu, Japan), and then cDNA was synthesized using the
Mixima First Strand cDNA Synthesis kit (Thermo Fisher Scientific,
Inc.). RT-qPCR analysis was conducted using an ABI PRISM 7300
Sequence Detection System instrument with Maxima SYBR-Green/ROX
qPCR Master Mix (Thermo Fisher Scientific, Inc.) according to the
manufacturer's instructions. The thermocycling conditions for
RT-qPCR were: step1: 50°C for 2 min; step 2: 95°C for 2 min; step 3
(×40 cycles): 95°C for 15 sec and 60̊C for 1 min. The
Glyceraldehyde-3-phosphate dehydrogenase (GAPDH) was used as an
internal control, and the gene expression was normalized to the
GAPDH to calculate relative expression level using the
2−ΔΔCq method (20).
The sequences of the primers were as follows: GAPDH forward,
5′-TCGTGGA AGGACTCATGACC-3′ and reverse, 5′-TCCACCACCCTGTT
GCTGTA-3′; CD44 forward, 5′-AGCAACCAAGAGGCAAG AAA-3′ and reverse,
5′-GTGTGGTTGAAATGGTGCTG-3′; CD133 forward,
5′-TTCTTGACCGACTGAGACCCA-3′ and reverse,
5′-TCATGTTCTCCAACGCCTCTT-3′; ABCG2 forward,
5′-TCCATATCGTGGAATGCTGA-3′ and reverse,
5′-TTTCAGCCGTGGAACTCTTT-3.
Lentiviral reporter assays
The TCF/LEF reporter, which drives the expression of
GFP (TOP-GFP) lentivirus, was purchased from SBO Medical
Biotechnology Co. (Shanghai, China) (18). Primary cancer cells were infected
as previously described (21).
Primary cells were infected with TOP-GFP lentivirus at an MOI of 25
for 72 h. To separate the GFP+/GFP- cells, the top
(GFP+) and bottom (GFP-) 5–10% cells were purified out
by flow cytometry. To evaluate Wnt activity, the intensity and
frequency of GFP+ cells were detected using a
fluorescence microscope (TRRFM; Olympus Corp.) or flow cytometry
according to the manufacturer's instructions of a FACS Aria II Cell
Sorter (BD Biosciences) (18).
Flow cytometric analysis and purification
of CD133+/CD133− cells
Fluorescence-activated cell sorting (FACS) was
performed according to the manufacturer's instructions using a FACS
Aria II Cell Sorter (BD Biosciences) (18). To measure CD133 expression in the
organoids and spheres, the cells were stained with phycoerythrin
(PE)-conjugated mouse anti-human CD133 (1:11; cat. no. 130-090-756;
Miltenyi Biotec GmbH, Bergisch Gladbach, Germany), then analyzed
using a BD FACS Aria II flow cytometer (18). To separate
CD133+/CD133− cells in primary CRC,
tumor specimens were processed into single cells as described above
(15). The cells were then stained
with PE-conjugated mouse anti-human CD133 at 4°C for 15 min. For
purification, only the top (CD133+) and bottom
(CD133−/lo) 10–20% cells were purified
out (18).
Cell death analysis
The cell death of organoid- and sphere-derived cells
was assessed using the Cell Counting kit-8 (CCK-8; Dojindo
Molecular Technologies, Inc. Rockville, MD, USA), as well as with
5-fluorouracil (5-Fu) and oxaliplatin (OXA) treatment, which were
purchased from Sigma-Aldrich (Merck KGaA). Briefly, the cells were
seeded in complete medium at 30,000 cells/well in 96-well plates.
Following 12 h, the cells were treated with either 5-Fu (1
µM) or OXA (1 µM). After 72 h, 10 µl CCK-8
solution was added to each well. The plates were then incubated at
37°C for 1 h, and cell viability was determined by scanning with a
microplate reader (Thermo Fisher Scientific, Inc.) at 450 nm.
Statistical analysis
Statistical significance was calculated with SPSS
Statistics 18.0 software (IBM Corp., Armonk, NY, USA). All
measurement data are presented as the means ± standard deviation of
at least 3 independent experiments. The measurement data were
analyzed using the Student's t-test or one-way analysis of variance
followed by a Tukey's post hoc test to determine the significant
differences of means in two or multiple groups (n>2)
comparisons. The enumeration data were analyzed using the Fisher's
exact test to determine the significant differences of rates in two
categories comparisons. P<0.05 was considered to indicate a
statistically significant difference.
Results
Organoids effectively simulate the tumor
heterogeneity of CRC tumors in vitro
Sphere formation assay (22) and organoid culture (23) are 3D models that support the
long-term expansion of primary tumor cells in vitro. In this
study, to investigate whether these 3D models accurately simulate
the tumor heterogeneity of CRC tumors, we generated spheres and
organoids side by side using freshly surgical CRC specimens.
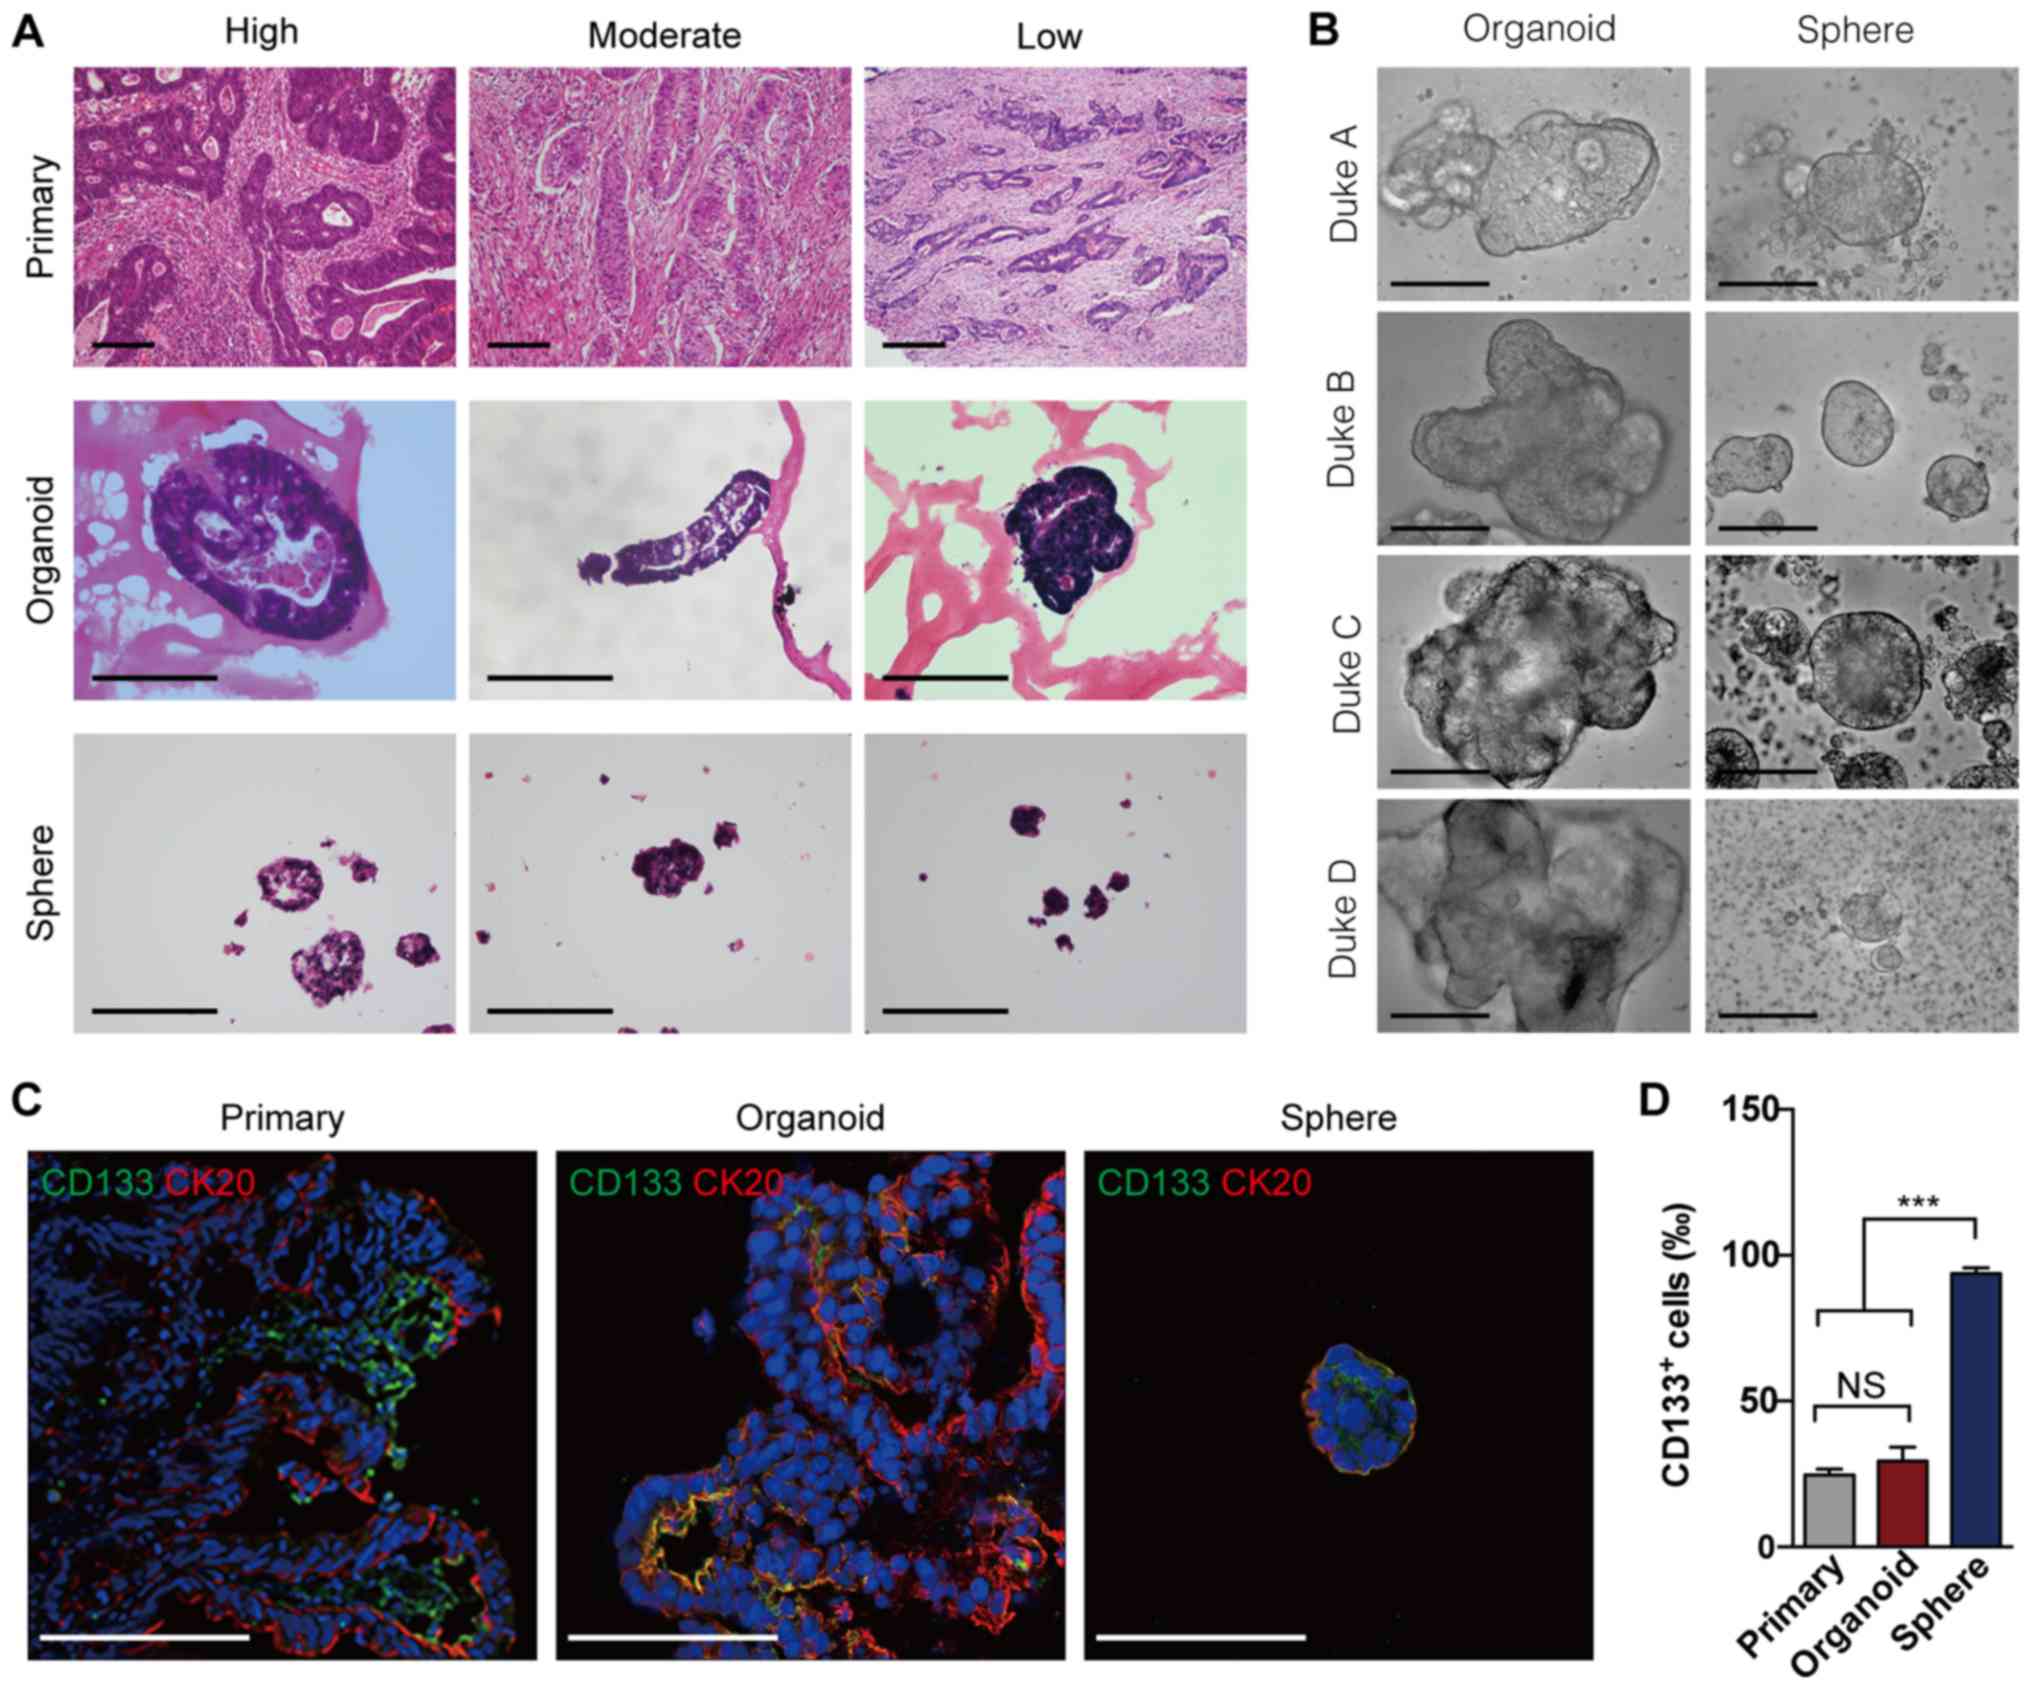
H&E staining revealed that the organoids harbored parental
tumor-like budding structures, while the spheres were observed as
solid globes (Fig. 1A). Notably,
the organoids formed more complex structures in the cells derived
from high-grade tumors (such as Dukes' C and D), whereas the
spheres retained similar global shapes (Fig. 1B). Since cells expressing CD133
have been reported to enrich for CSCs in CRCs (24) and cytokeratin 20 (CK20) is a
differentiated cell marker (25),
the present study conducted further CD133 and CK20 staining for
spheres and organoids derived from primary CRCs. The results
revealed that the expression of CD133 and CK20 more closely
resembled that of primary tumors in the organoids than in the
spheres (Fig. 1C). Quantitative
analysis demonstrated that the organoids harbored similar
percentages of CD133+ cells when compared with the
corresponding primary tumors; however, sphere-forming assays
significantly increased the percentage of CD133+ cells
(Fig. 1D), implying that organoid
culture may maintain the cellular heterogeneity of parental CRCs.
These results demonstrate that, compared with the sphere-forming
assay, organoid culture may more effectively simulated the tumor
heterogeneity of primary CRCs in vitro.
Organoid culture more effectively
simulates primary colorectal tumors than sphere-forming assays
In general, tumor cells are able to generate
xenografts in immuno-compromised mice subcutaneously, and the PDXs
can recapitulate original tumor heterogeneity (5). In order to explore the tumor
heterogeneity of CRC tumors, it is also crucial to establish
successful cell culture in vitro (5,26,27).
However, whether cells cultured in 3D models preserve the ability
to generate parental tumor-like xenografts (i.e., PDXs) remains
unclear. Consistent with the findings of previous studies (5,7,25),
the results of the present study demonstrated that primary CRC
cells and their corresponding organoids and spheres were all
capable of generating tumor xenografts in NOD/SCID mice (Fig. 2A). To determine whether ODXs and
SDXs exhibit the same tumor heterogeneity of primary CRCs, the
present study performed CK20 (25)
staining for primary CRC tumors, PDX, ODX and SDX. As shown in
Fig. 2B, the present study
revealed that the expression pattern of CK20 in ODX more closely
resembled primary tumors and the corresponding PDX than SDX
(Fig. 2B), suggesting that
organoid culture more accurately reproduced the tumor heterogeneity
of primary tumors than the sphere formation assay. In order to
examine the efficiency of generating organoids or spheres from
primary CRC tumors, the present study performed side-by-side
organoid culture and sphere-forming assays for CRC specimens (Table
S1). The results revealed that organoids in 15 of the 20 CRC
specimens were successfully generated (success rate, 75%), whereas
spheres were only generated for 5 of the 16 CRC specimens (success
rate 31%; Tables I and S1).
Notably, the primary CRC cells formed more organoids than spheres
when the same cell dosage was applied (Fig. 2C and D). Taken together, these
results demonstrate that organoid culture possesses a higher
success rate and better efficiency to simulate primary colorectal
tumors than sphere-forming assay.
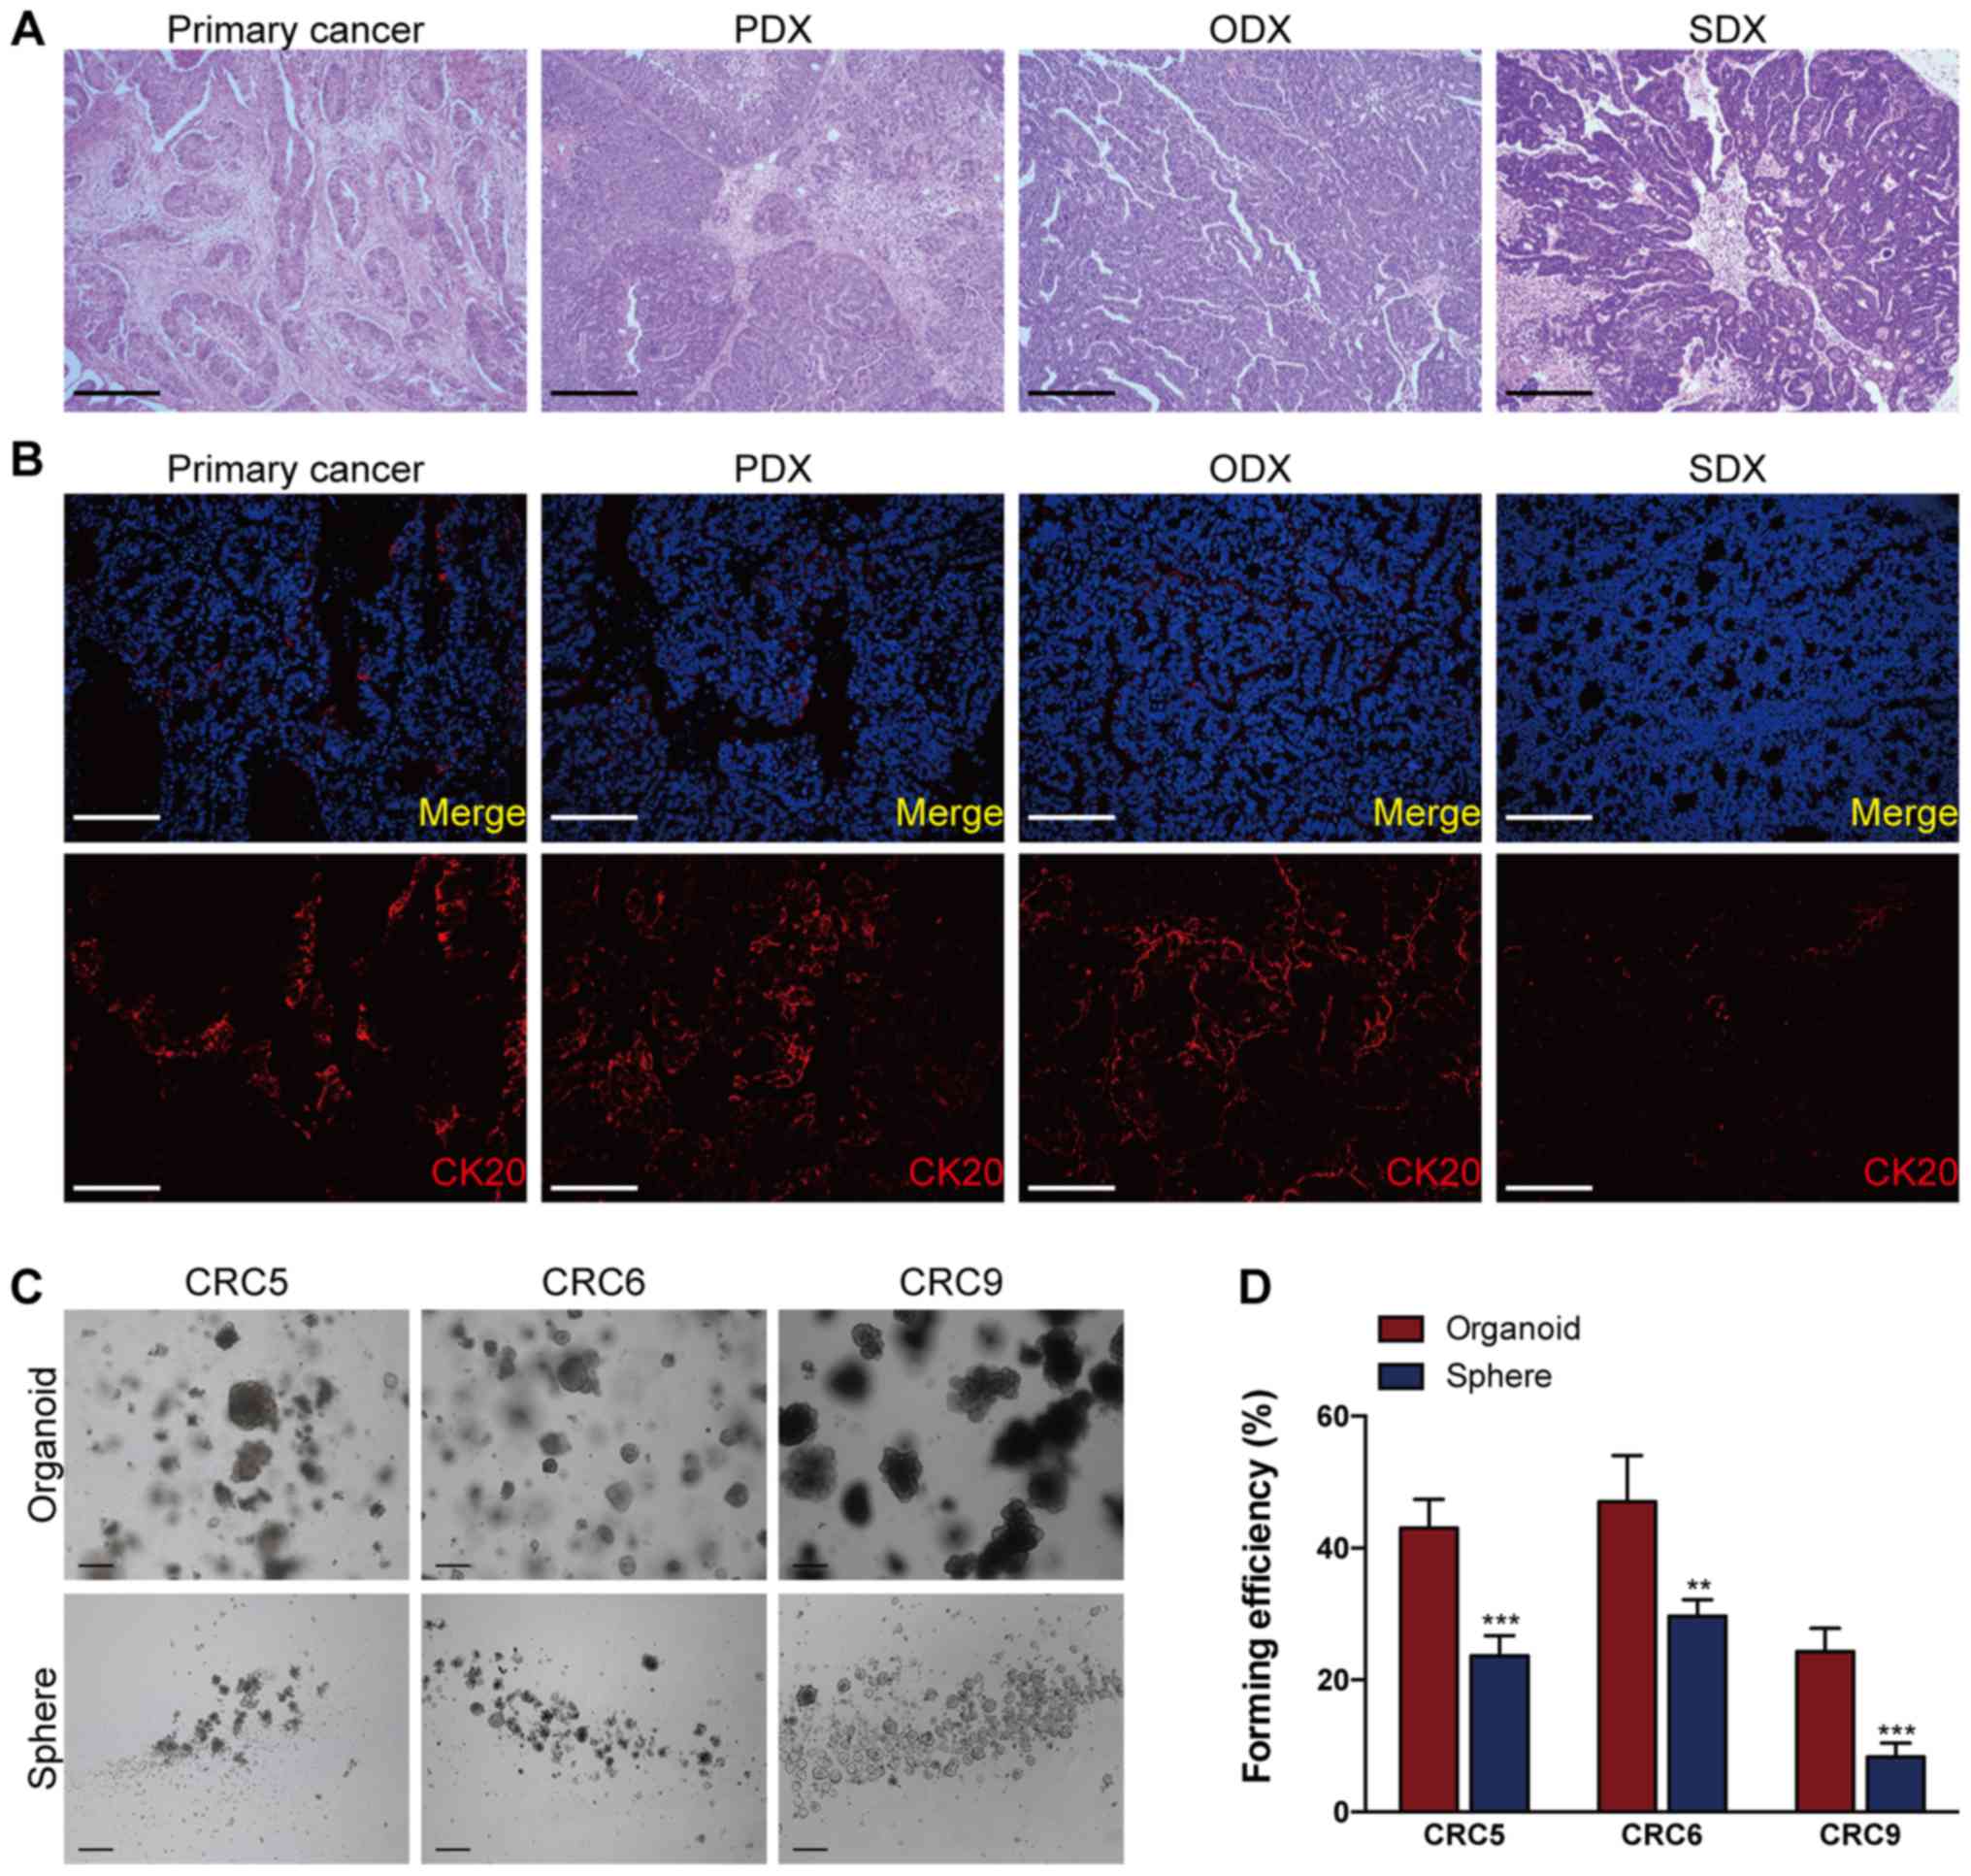 | Figure 2Organoid culture possesses a better
efficiency to reproduce primary colorectal tumors than
sphere-forming assay. (A) Representative hematoxylin and eosin
images of xenografts generated from primary CRC cells (PDX),
organoid-derived cells (ODX), sphere-derived cells (SDX) and their
parental tumor (primary cancer). Scale bars, 100 µm. (B)
Immunofluorescence staining of CK20 in a primary CRC tumor and its
corresponding PDX, ODX and SDX. Scale bars, 200 µm. The
nuclei of CRC cells were counterstained with DAPI, and the 'Merge'
in top panel of (B) indicates the merging of DAPI (in blue) for
nuclei and CK20 (in red) for differentiated CRC cells. The cells
used in (A and B) were derived from CRC6. (C) Representative images
of organoids and spheres derived from primary CRCs (CRC5, CRC6, and
CRC9). (D) A total of 1,000 single purified primary CRC cells per
well were respectively processed for the sphere-forming assay and
organoid culture; 7 days later, the organoids or spheres were
photographed in (C). Then, the organoid- or sphere-forming
efficiency of primary CRCs were quantified. **P<0.01
and ***P<0.001. CRC, colorectal cancer; PDX,
xenografts of primary CRC cells; ODX, xenografts of
organoid-derived cells; SDX, xenografts of sphere-derived cells;
CK20, cytokeratin 20. |
 | Table ISuccess rates of organoid culture
model, sphere culture model and PDX model in culturing primary CRC
cells. |
Table I
Success rates of organoid culture
model, sphere culture model and PDX model in culturing primary CRC
cells.
| Success | Failure | Success rate
(%) |
|---|
| Organoid model | 15 | 5 | 75 |
| Sphere model | 5 | 11 | 31.25 |
| PDX model | 4 | 12 | 25 |
| P-value organoid
vs. sphere | 0.008588 |
| P-value organoid
vs. PDX | 0.003182 |
Organoid culture maintains the number of
CSCs during serial passages
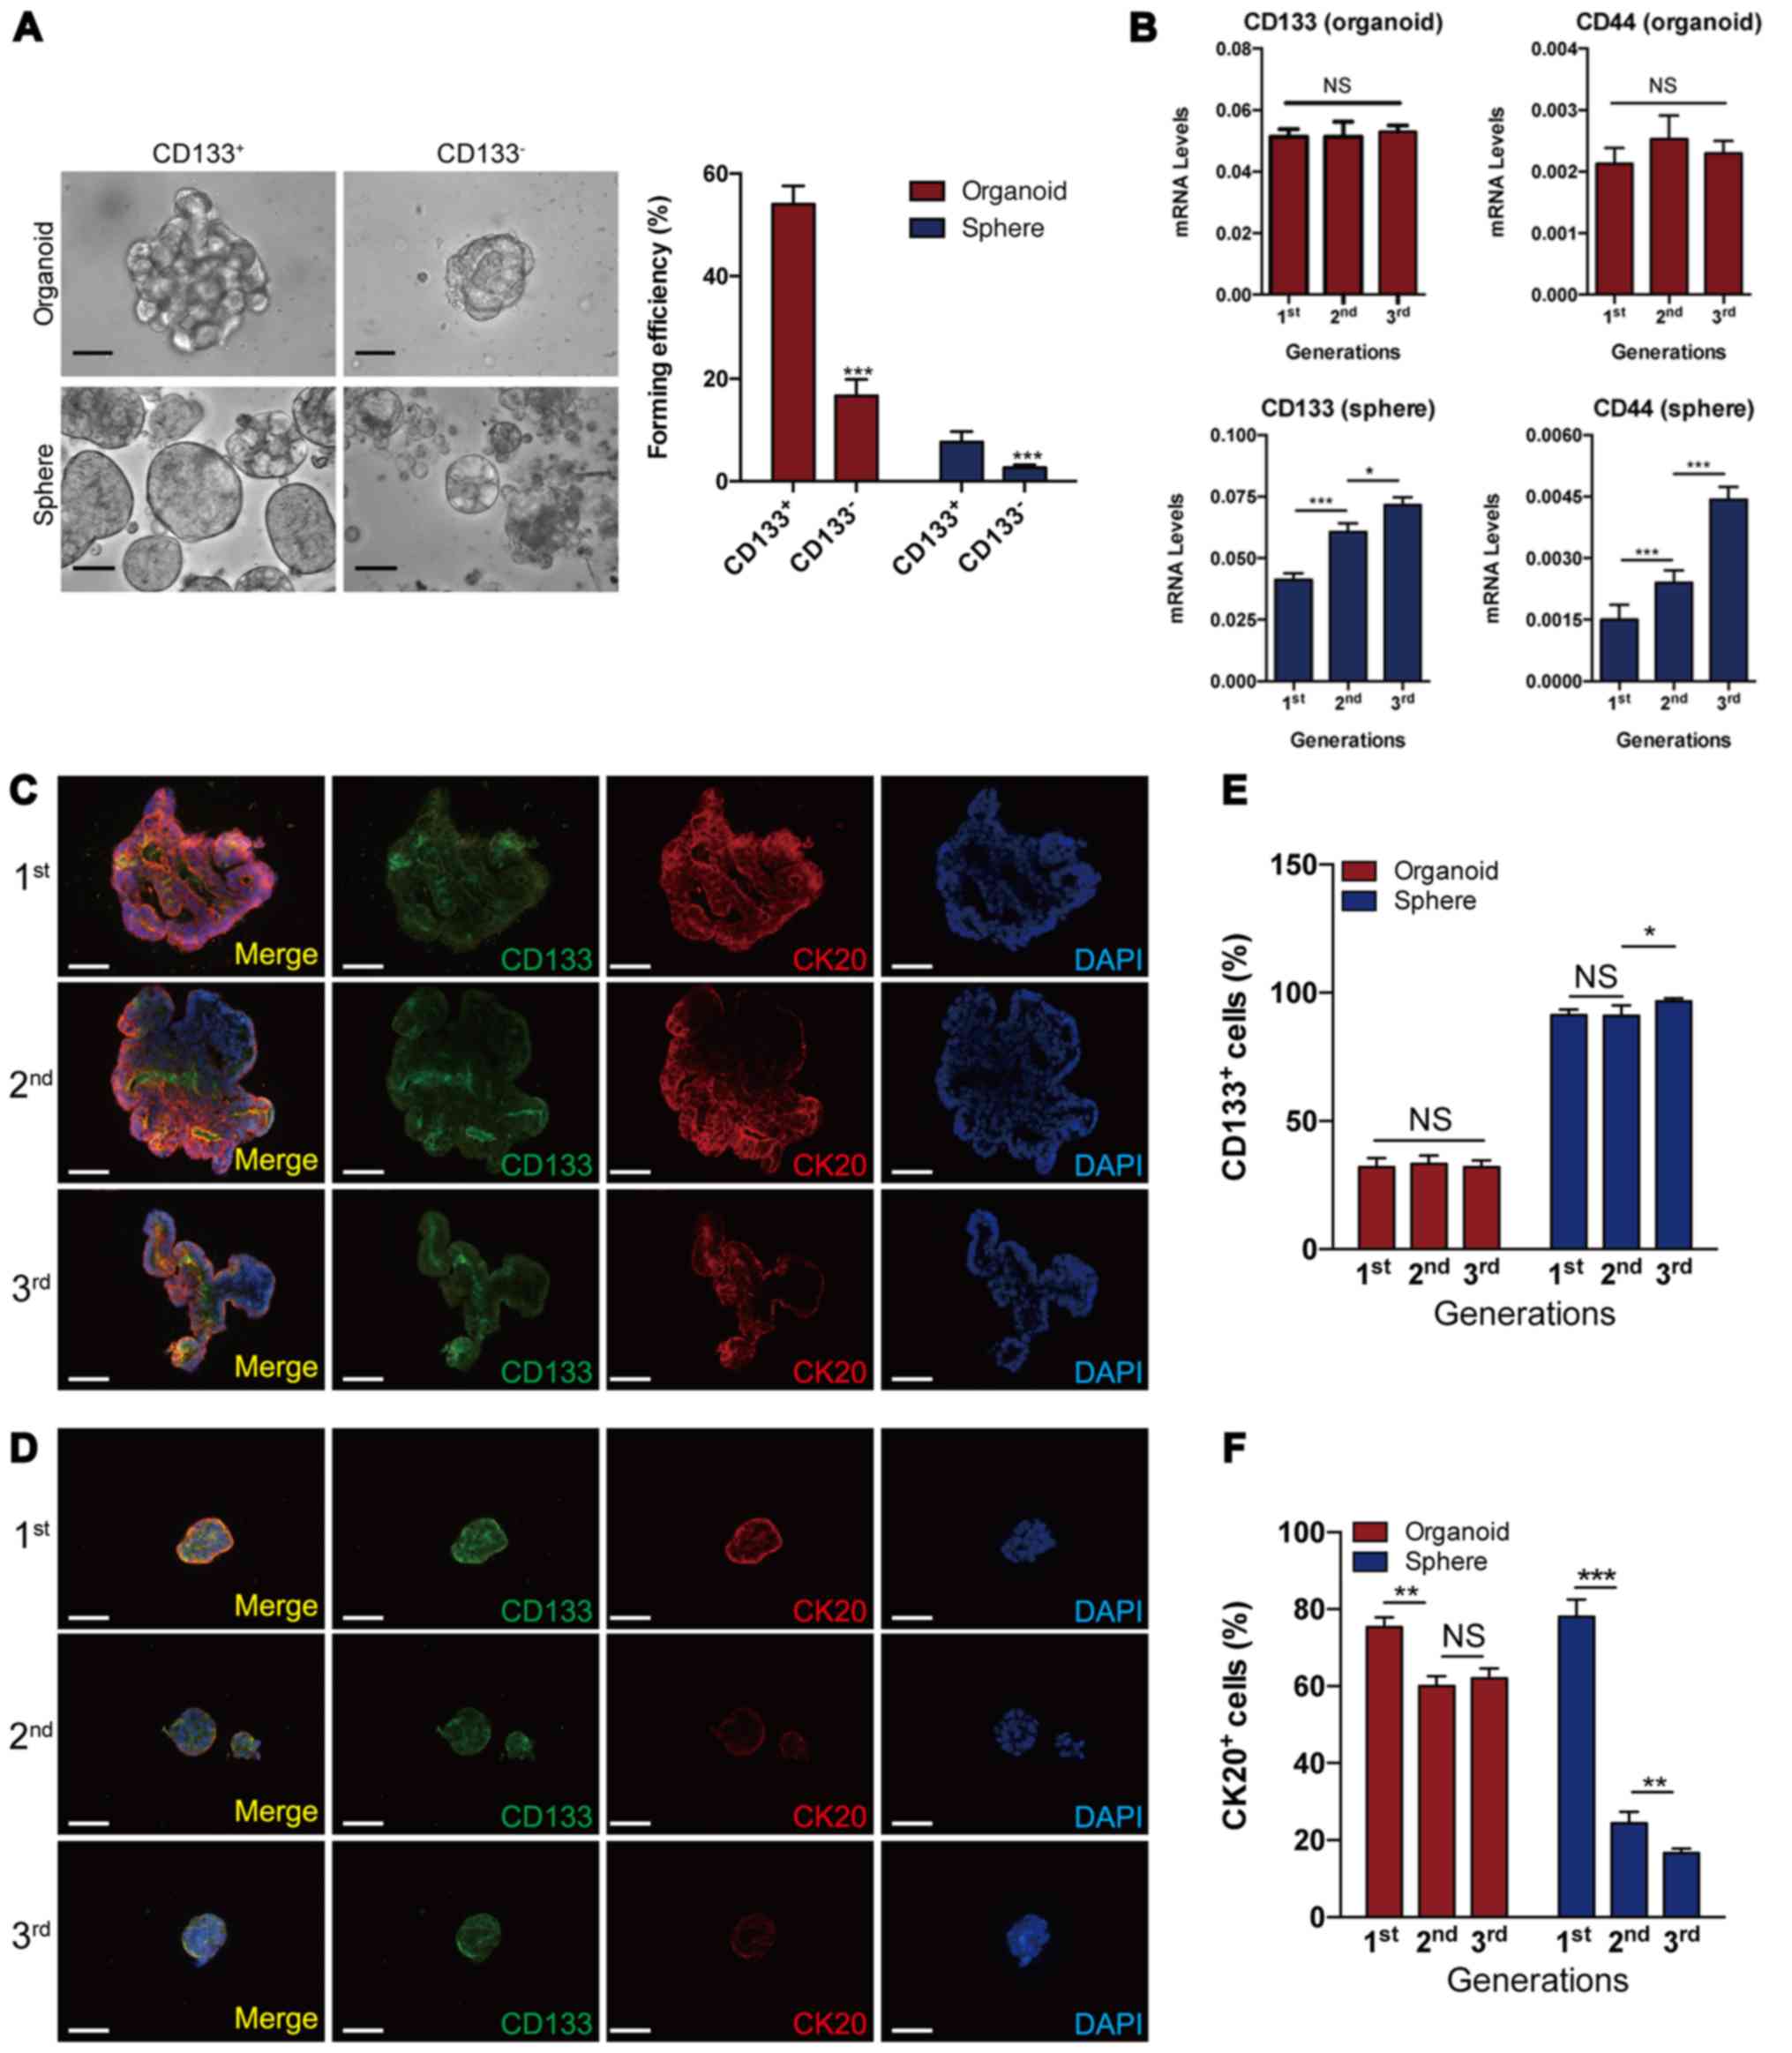
The cell surface marker, CD133, is widely used to
enrich CSCs in CRCs (16,23). In the present experimental system,
using FACS, CRC cells expressing high levels of CD133
(CD133+) and those expressing little or no CD133
(CD133−) were assessed and sorted.
CD133+ CRC cells were found to produce more spheres and
organoids than CD133− cells, implying that
sphere- and organoid-forming cells were enriched for CSCs (Fig. 3A). Serial sphere formation assays
are generally applied to enrich and expand CSCs (27). However, the dynamics of CSCs in
serial organoid cultures remain unclear. The results of the present
study revealed that the levels of CD133 and CD44, the two cell
surface markers widely used to enrich CSCs in CRCs (24,29),
remained constant in serial organoid cultures, while they
significantly and gradually increased in serial sphere formation
assays, indicating that the dynamics of CSCs may differ between
organoid culture and sphere-forming assays during serial passages
(Fig. 3B). To visualize CSCs and
differentiated cells within individual organoids and spheres during
serial passages, the present study performed CD133 and CK20
immunofluorescence staining for organoids and spheres (Fig. 3C and D). Quantification analysis
revealed that the proportion of CD133+ and
CK20+ cells remained relatively constant in organoids
during serial passages; however, there were increased levels of
CD133+ cells and decreased levels of CK20+
cells in spheres during serial passages (Fig. 3E and F). Taken together, these
results demonstrate that organoid culture produces steady ratios of
CSC subsets in long-term cultures, whereas sphere-forming assays
may enrich CSCs.
Organoid culture retains the frequency of
tumor-initiating cells (TICs), while sphere-forming assays enrich
TICs during serial transplantations
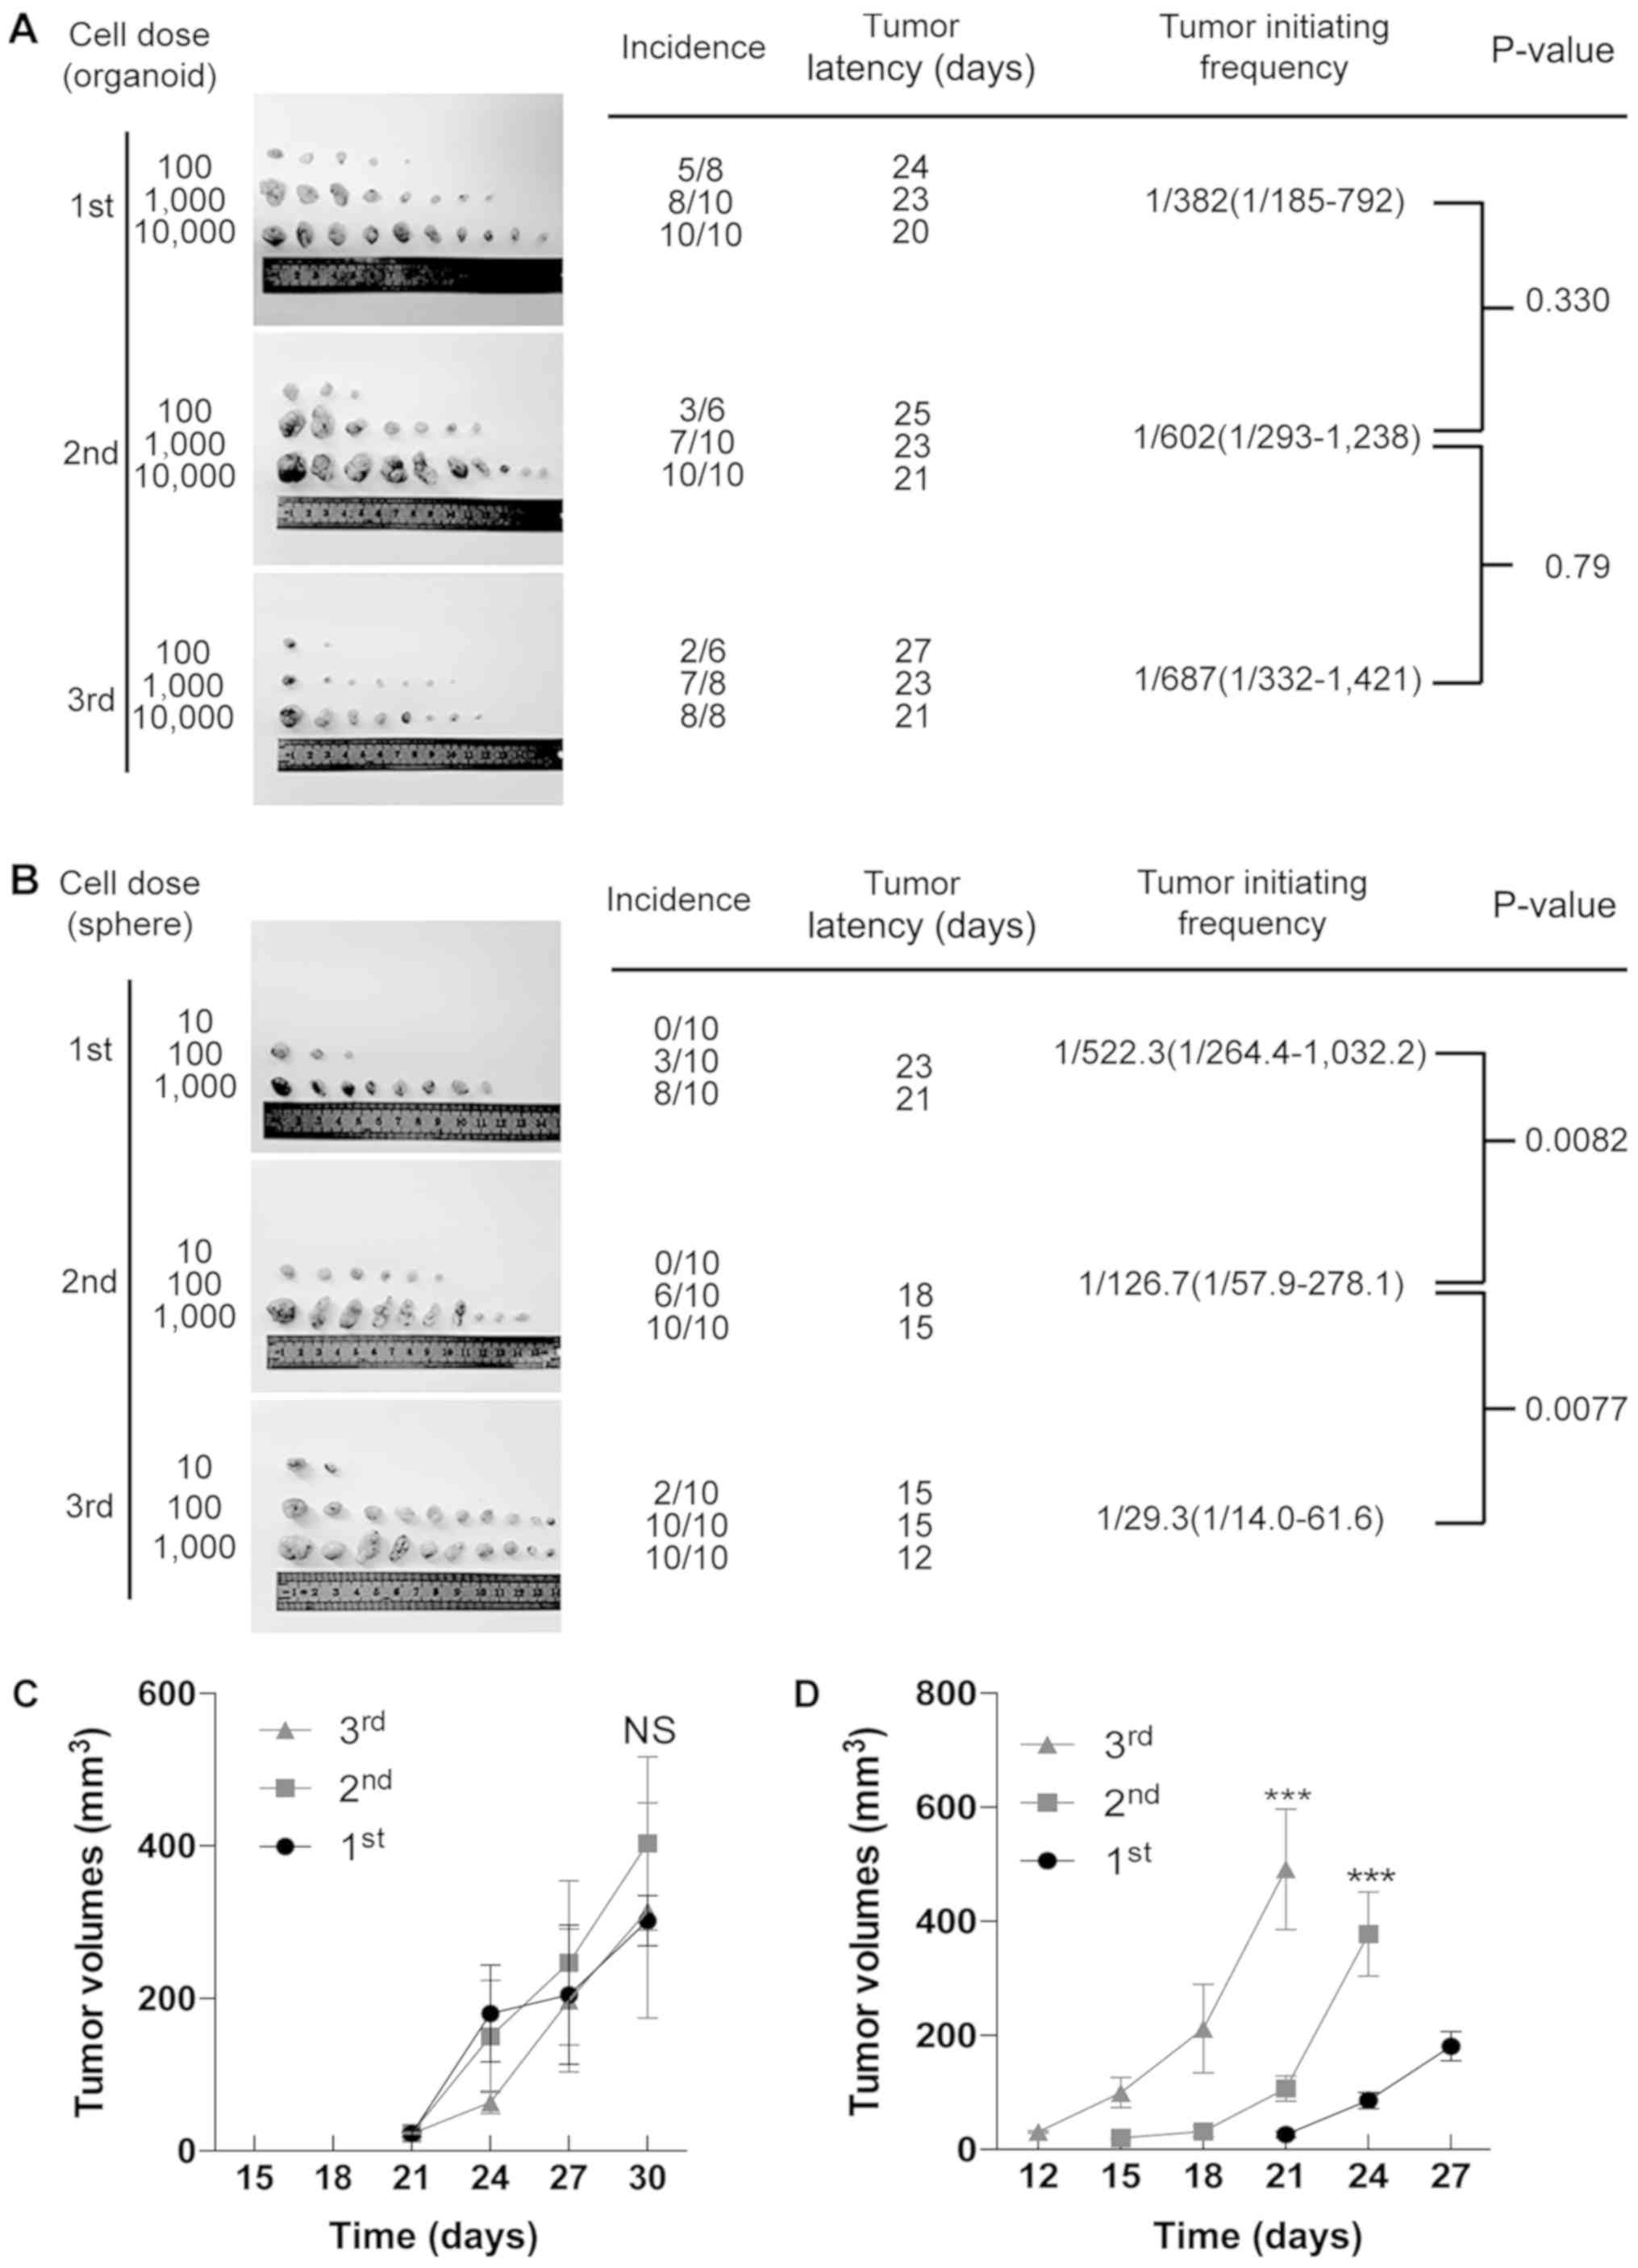
TICs, also known as CSCs, are a rare population
within CRC (30). In this study,
to investigate whether the frequency of TICs was altered during
serial transplantations, we performed limited dilution assays to
evaluate the tumorigenic capacity of organoid- and sphere-derived
cells in each generation (15,30).
As shown in Fig. 4A, during serial
transplantations (1st to 3rd), organoid-derived cells possessed a
constant number of TICs. On the other hand, serial sphere-forming
assays had significantly increased numbers of TICs with serial
passaging (Fig. 4B). Notably, it
was observed that organoid-derived cells initiated tumor generation
at almost the same time in each generation, while sphere-derived
cells initiated tumor generation earlier than the former generation
(Fig. 4A and B). Consistent with
this finding, there were no significant differences among the tumor
volumes of organoid-derived xenografts in serial transplantations
(Fig. 4C), while sphere-derived
cells developed increasingly larger tumors in serial
transplantations (Fig. 4D). Taken
together, these results indicate that organoid culture maintains
the frequency of TICs (i.e., CSCs) in long-term culture, while
sphere-forming assays enrich TICs.
Serial organoid cultures preserve the
proportion of Wnt+ CRC cells
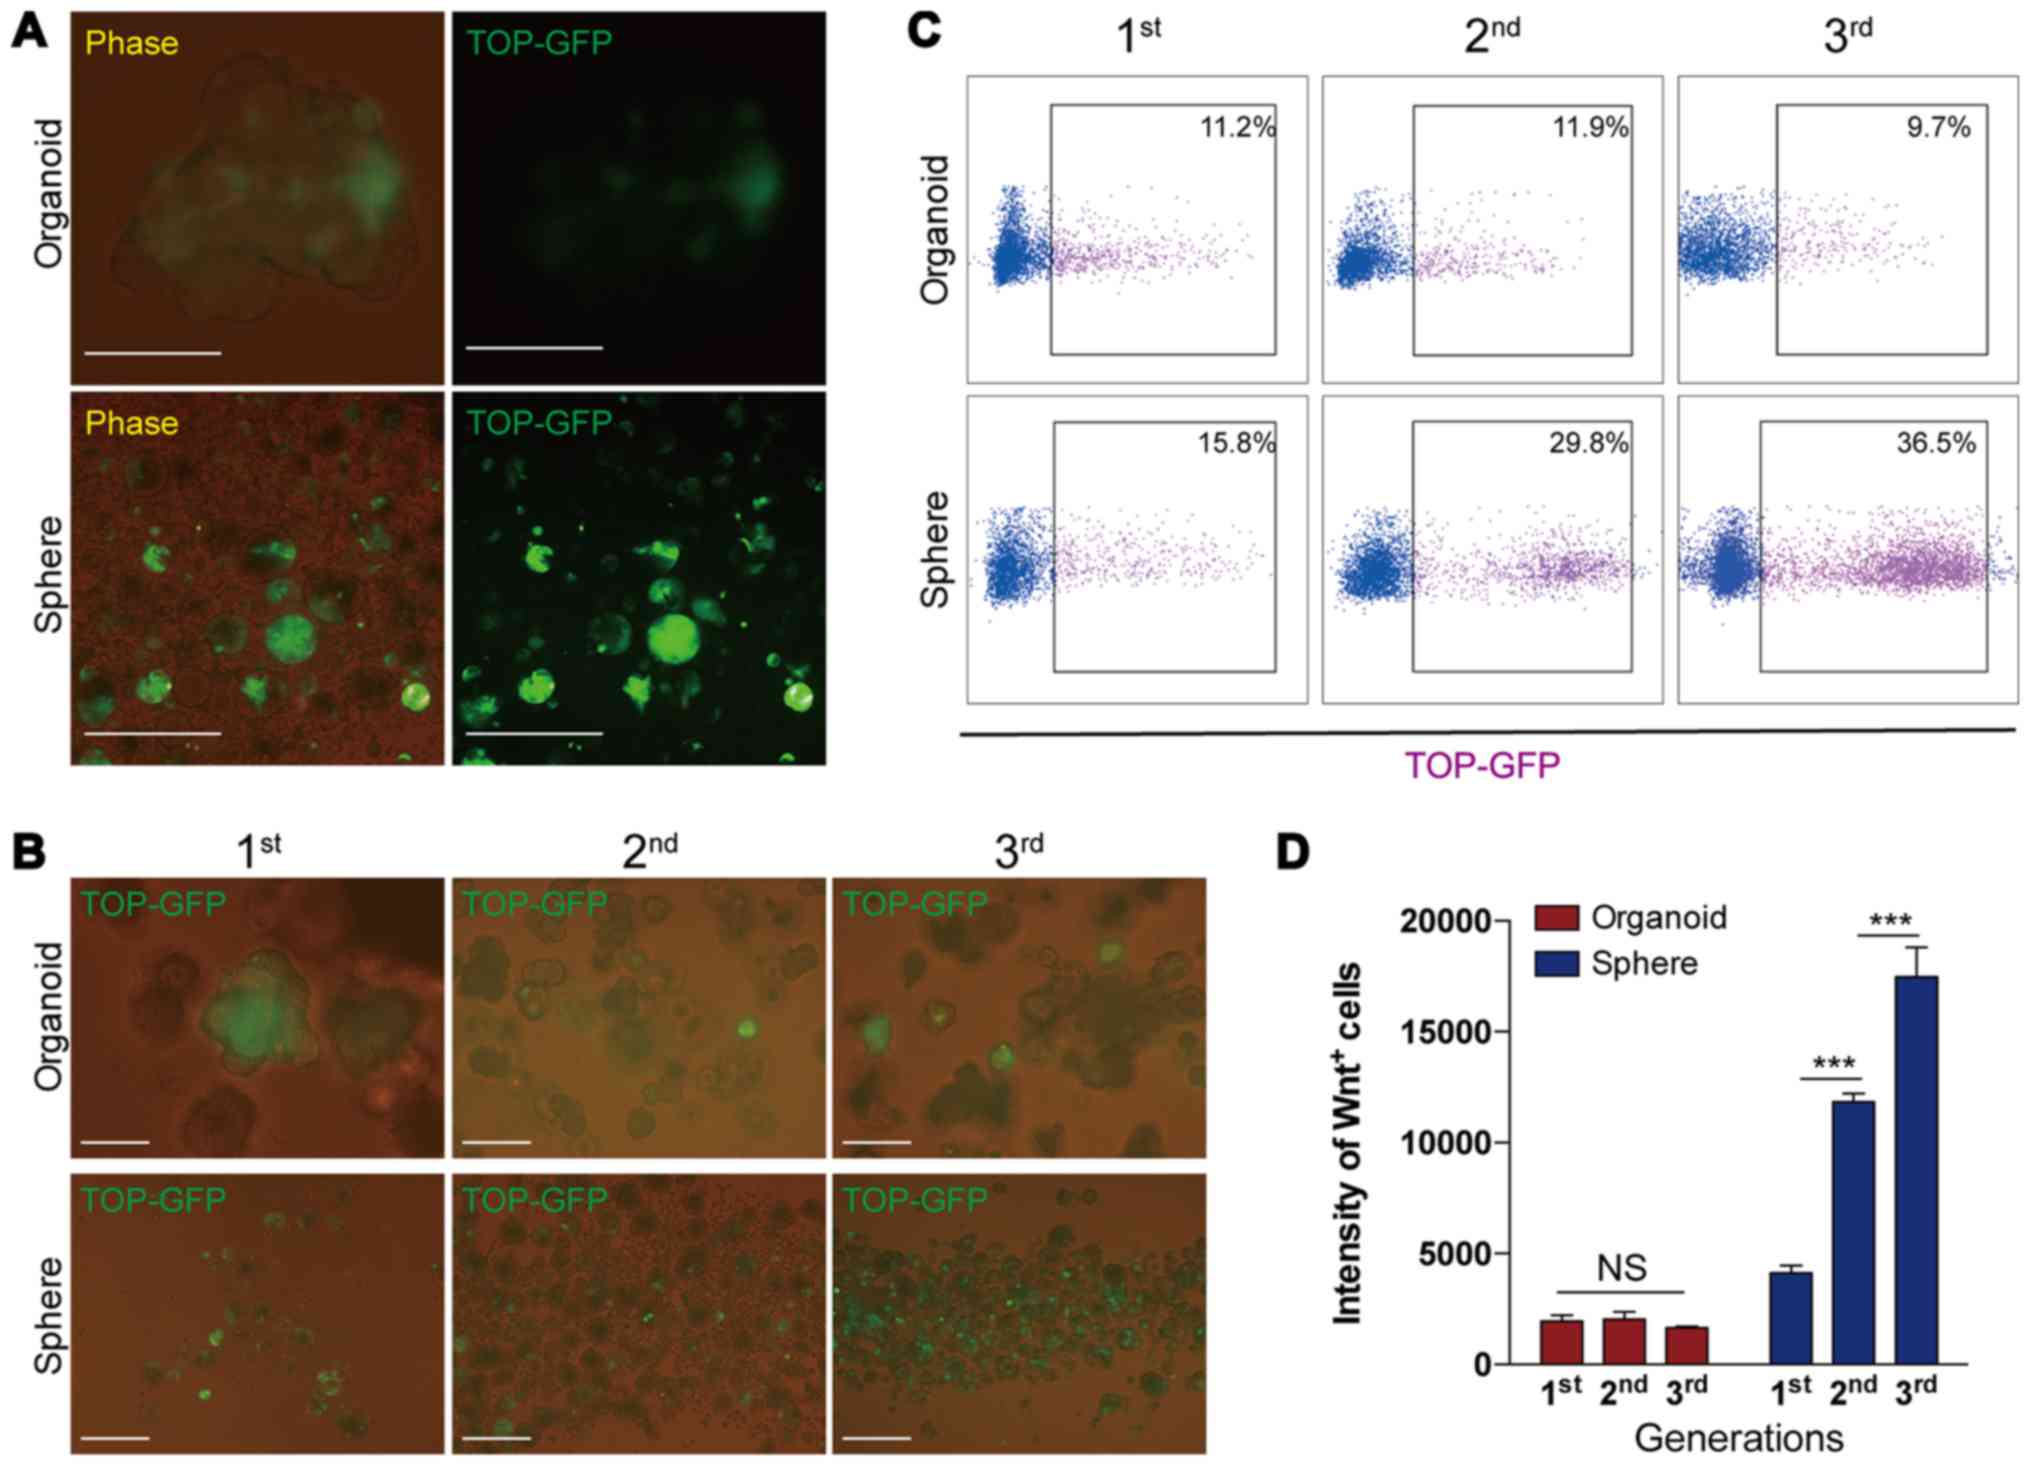
It has been demonstrated that a high Wnt activity
functionally designates the colon CSC population (18,31–33).
To further evaluate the alternations in Wnt activity during serial
passages, in the present study, we infected purified primary CRC
cells with lentivirus, in which the TCF/LEF reporter drove the
expression of GFP (TOP-GFP) and represented the cellular levels of
Wnt activity (18,31,32).
The transfected cells were then utilized in organoid culture and
sphere-forming assay; when the organoids and spheres were growing,
the expression of GFP was evaluated. The results revealed that the
intensity of GFP expression was stronger in the spheres than the
organoids (Fig. 5A), indicating
that spheres were more highly enriched for CSCs than organoids
during culture. The present results also demonstrated that during
serial passage, the number of cells expressing GFP (i.e.,
GFP+ or Wnt+ cells) gradually increased in
serial sphere-forming assays, but remained relatively constant in
serial organoid cultures (Fig. 5B and
C). Consistent with these findings, FACS analysis further
demonstrated that the intensity of Wnt+ cells remained
unaltered in organoids during serial passaging, while they markedly
increased in spheres with serial passaging (Fig. 5D). Collectively, these data
indicated that organoid cultures preserved relatively constant
numbers of Wnt+ cells and the level of Wnt signaling in
the cells during long-term culture, whereas the sphere-forming
assay enriched Wnt+ cells and increased the intensity of
Wnt signaling in the cells.
Organoid culture preserves chemoresistant
cells over time
As the presence of CSCs and the activation of Wnt
signaling have been demonstrated to be associated with the
chemoresistance of tumor cells (31–33),
we hypothesized assumed that serial sphere-forming assays, which
increased the proportion of CSCs and improved the levels of Wnt
signaling during serial passages, may also increase the frequency
of chemoresistant cells; whereas, organoid culture may only
maintain the chemoresistant capacity in the cells during serial
passages. To examine this hypothesis, the present study performed
serial organoid cultures or sphere-forming assays combined with
conventional chemotherapeutic agents (oxaliplatin or
5-fluorouracil), and then detected the efficiency of organoid or
sphere formation. As shown in Fig.
6A–D, the results indicated that, upon the administration of
chemotherapeutic agents, the efficiency of organoid and sphere
formation decreased; however, along with serial passages, this
impairment was partially rescued in serial sphere-forming assays,
but remained unchanged in organoid culture. Furthermore, in each
generation, the present study detected the frequency of
Wnt+ cells and the expression levels of adenosine
triphosphate binding cassette subfamily G member 2 (ABCG2), one of
the resistant markers of CRC (34), in organoids and spheres treated
with chemotherapeutic agents. The results verified that, the
frequency of Wnt+ cells, as detected by FACS, and the
expression level of ABCG2, as determined by RT-qPCR, significantly
increased in spheres and organoids following treatments with
chemotherapeutic agents; however, during serial passaging, these
markers remained unaltered in the organoid culture, while they
gradually increased with serial sphere formation (Fig. 6E–H). The half-maximal inhibitory
concentration (IC50) analysis upon OXA and 5-Fu
treatment suggested that, since the 1st generation, organoid cells
exhibited a similar IC50 to that of primary cells, while
the sphere forming assay significantly increased the original
IC50 (Fig. 6I and J).
These data, obtained from CRC6, indicated that organoid culture
preserved the characteristics of chemoresistance in primary CRC
cells. To verify the universality, a chemoresistance assay in
serial passages was respectively performed in CRC1, CRC5 and CRC9.
The subsequent CCK8 assay further demonstrated that the frequency
of chemoresistant cells gradually increased in serial
sphere-forming assays, while it remained relatively constant in
serial organoid cultures (Fig. 6K and
L). Overall, the results indicated that, when compared with
sphere-forming assays, organoid culture can preserve the frequency
of chemoresistant tumors cells in the long-term culture, and may
serve as a better pre-clinical model for drug screening and
discovery.
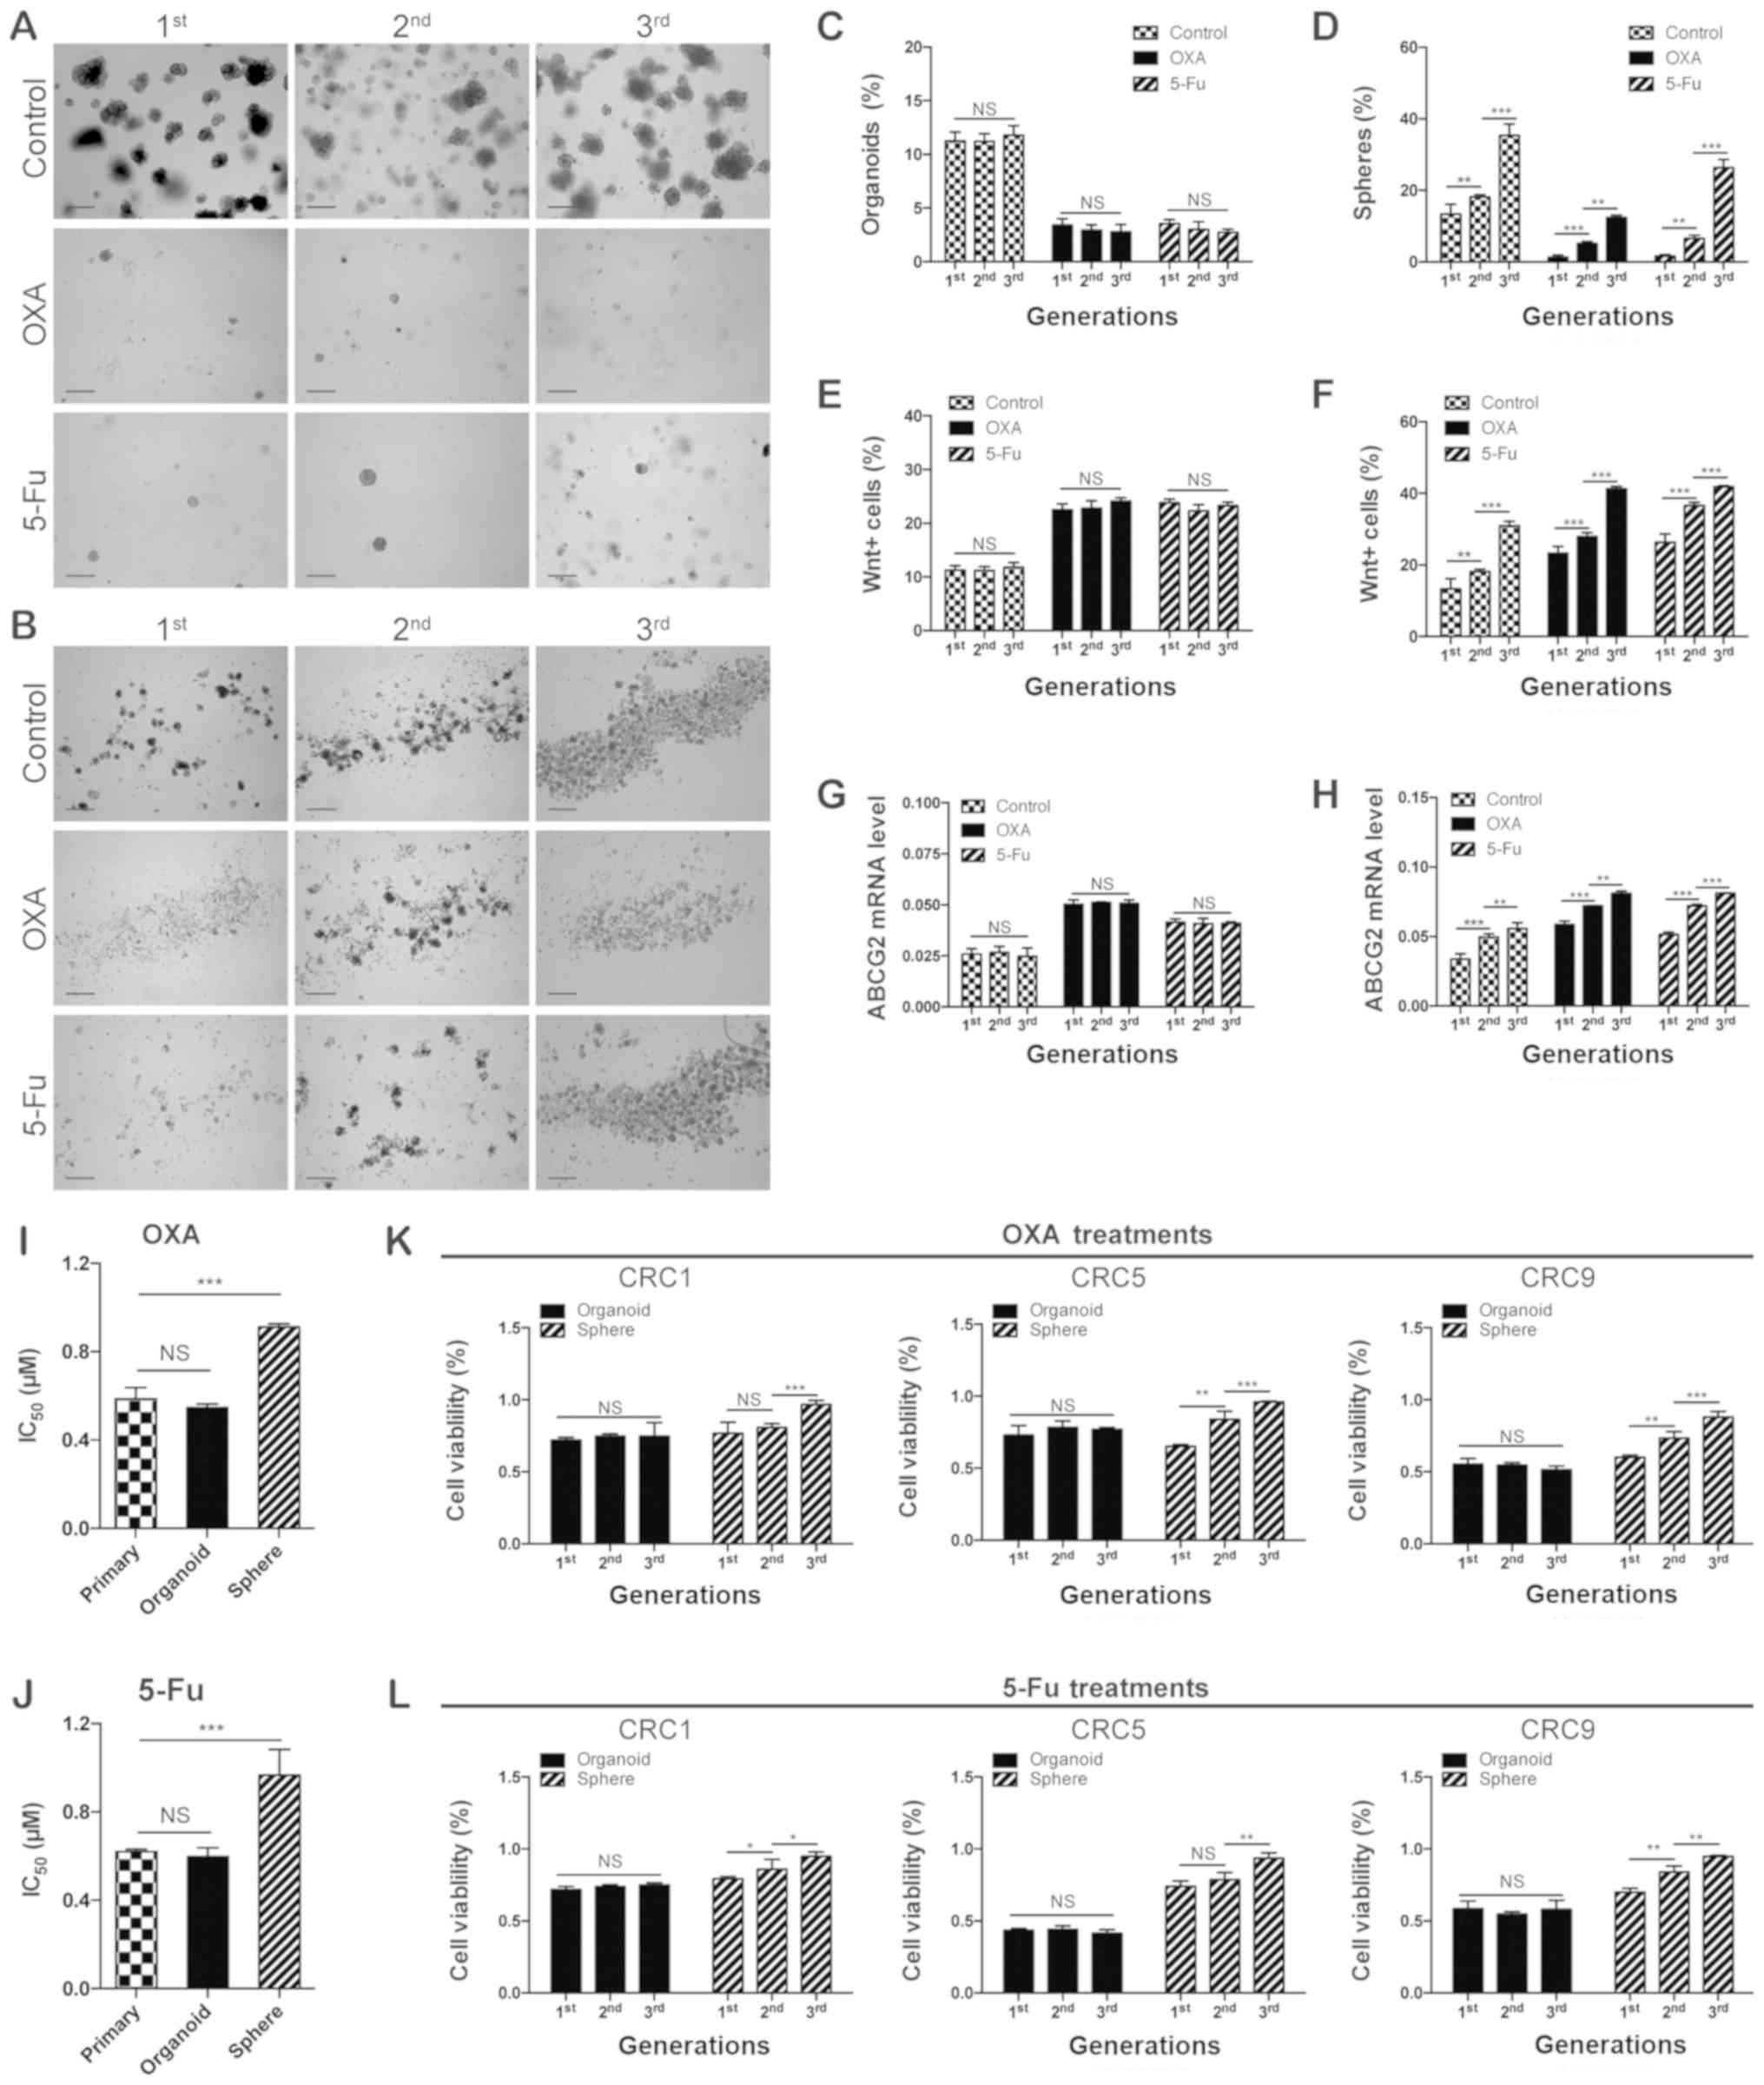 | Figure 6Organoid culture preserves
chemoresistant cells over time. Representative images of (A)
organoids and (B) spheres treated with chemotherapeutic agents (1
µM OXA or 1 µM 5-Fu) during serial passages. Scale
bars, 200 µm. (C) Organoid-forming efficiency in the serial
organoid cultures and (D) sphere-forming efficiency in the serial
sphere formation assays upon the administration of chemotherapeutic
agents (1 µM OXA or 1 µM 5-Fu).
**P<0.01 and ***P<0.001. Flow
cytometric quantification analysis of Wnt+ cells in the
serial (E) organoid cultures and (F) sphere formation assays upon
administration of chemotherapeutic agents (1 µM OXA or 1
µM 5-Fu). (G) Reverse transcription-quantitative polymerase
chain reaction analysis of expression of ABCG2 at the mRNA level in
the serial (G) organoid cultures and (H) sphere formation assays
upon the administration of chemotherapeutic agents (1 µM OXA
or 1 µM 5-Fu). **P<0.01 and
***P<0.001. Quantification of the IC50 of
primary cells, organoid and spheres of CRC upon (I) OXA (1
µM) and (J) 5-Fu (1 µM) treatment. The primary CRC
cells used in (A-J) were derived from CRC6. (K) The cell viability
of CRC1, CRC5, and CRC9 derived organoids or spheres treated with
(K) OXA (1 µM) and (L) 5-Fu (1 µM) during serial
passages. *P<0.05, **P<0.01 and
***P<0.001. IC50, 50% inhibitory
concentration. CRC, colorectal cancer; OXA, oxaliplatin; 5-Fu,
5-fluorouracil; ABCG2, adenosine triphosphate binding cassette
subfamily G member 2; NS, not significant. |
Discussion
Preclinical models are essential for assessing tumor
progression and designing therapeutic approaches (5). For decades, using numerous in
vitro and in vivo preclinical models, the identification
of oncogenes and tumor suppressor genes, aberrant signaling
pathways and interactions in tumor microenvironment, have yielded
several novel therapeutic strategies, including monoclonal
antibodies, chemotherapy, small molecule inhibitors and immune
therapy (5). However, previous
studies have indicated that the inability of preclinical models to
simulate tumor heterogeneity contributed to the failure of
treatments (5,26,27).
To avoid senseless trials and achieve better efficacy, the
advantages and/or limitations of various preclinical models must be
elucidated, and a relatively robust platform for drug testing must
be determined.
To date, the widely used preclinical models have
comprised of PDX, 2D monolayer cells culture (i.e., adherent cell
culture and clonal culture) and 3D culture models (i.e., sphere
formation assay and organoid culture) (5). For the PDX model, it has been
demonstrated that the histopathology and genome mutational
landscapes of patients can be highly preserved in the established
individual PDXs (35), and the
drug design procedures based on PDXs can partially predict patient
response (36). Nonetheless,
several limitations of PDX models impair its utilization, including
the following: i) Limited success rate of initiation; ii) the lack
of tumor-host interactions and immunity in xenograft animals; iii)
it is highly labor intensive and time consuming; and iv) there are
many ethical issues involving the use of animals (5,37).
For 2D monolayer cells culture, there are several practical
advantages: i) Immortalized cancer cell lines are easy to
propagate, and can easily process transfection and genomic
modification; and ii) the investigation concerning oncogenic
pathways relies heavily on cell lines based on their stable
manipulation (5). However, 2D
monolayer cell culture possesses very low successful initiation
rates for primary cells (<10% in CRC), and most notably, 2D
culture fails to represent the tumor heterogeneity of primary
cancers, which finally leads to the loss of the original clinical
characteristics of tumor cells during long term passaging (26,27).
To overcome the limitations of PDX and 2D cell
culture, in recent years, numerous novel 3D culture models have
been applied. Among the 3D culture models, the two most popular
ones are, the sphere formation assay and organoid culture (5,26,27).
3D culture models are considered to more accurately simulate the
tumor heterogeneity of primary tumors when compared with 2D cell
culture, and be less time-consuming and expensive than PDX
(5). In general, sphere formation
assays can be applied to enrich cancer cells with limited or
unlimited self-renewal capacity for primary tumor cells and cell
lines (38); on the other hand,
organoid culture has been utilized in a range of cancer studies
including drug testing, disease modeling, and co-culture models of
cancer and stromal cells (11–14,39–41).
Although the two 3D culture models can support the continuous
expansion of primary tumor cells, whether they maintain the
self-renewal capacity of cells in long-term culture, which is
critical to simulate the tumor heterogeneity of primary tumors,
remains largely uncertain.
It has been revealed that the tumor bulk harbored
cellular hierarchy with CSCs at the apex, possessing self-renewal
capacity and multi-differentiated potential (42). CSCs were considered to be closely
associated with tumor heterogeneity in cancers, particularly in
CRCs (43). Based on the
expression of cell surface markers (such as CD133 and CD44) and the
activity of Wnt signaling in CRC cells, it has been demonstrated
that CSCs are enriched in the cells that highly express such
markers or possess high activity of Wnt signaling (43). Furthermore, transplantation assays
are applied to test the self-renewal capacity of CSCs in
vivo (42,44). In the present study, the proportion
of CSCs (including CD133+, CD44+ and
Wnt+ cells) was enriched in serial sphere formation
assays, but maintained constant in serial organoid culturing.
Notably, following transplantation assays, the results demonstrated
that serial sphere forming assays expanded CSCs (including CSCs and
TICs), while serial organoid passage maintained the original
levels. In addition, the results further demonstrated that cellular
heterogeneity in organoids more closely resembled that of the
primary tumor and the corresponding PDX than in spheres.
Sphere formation assay and organoid culture are both
candidates of preclinical drug testing models (9). In previous studies, a sphere-forming
assay has been used to evaluate CSCs, the putative inherent
chemoresistant cells (38,45). However, several studies have
suggested that, during the sphere formation assay, as the CSCs
become enriched, the drug activity of cancer cells became unstable
(10,28). On the other hand, organoid culture,
with high efficiency to establish patient-derived organoids (PDOs),
enabled patient-specific drug testing and the development of
personalized treatments (11–14).
Although PDOs have been applied in drug testing in various types of
solid tumors, whether organoid culture maintains the chemoresistant
capacity of primary tumor cells in the long-term culture remains
largely unknown. The present results demonstrated that the
frequency of chemoresistant cells was constant in serial organoid
cultures, whereas it gradually increased in the serial
sphere-forming assays.
In conclusion, taken together with previous
findings, the results of the present study demonstrated that
organoid culture is the better preclinical model for reproducing
tumor heterogeneity and testing drug responses, especially in
long-term cultures.
Funding
The present study was supported by grants from the
National Natural Science Foundation of China (grant no. 81572894),
Program for New Century Excellent Talents in University (grant no.
NCET-12-0208), the Fundamental Research Funds for the Central
Universities (HUST; grant no. 01-18-540005), Tongji Hospital Funds
for the Returned Overseas Scientists and Outstanding Young
Scientists (grant no. 2012yq004) and China Postdoctoral Science
Foundation Funded Project (grant no. 2016M602313).
Availability of data and materials
All data generated or analyzed during this study are
included in the article.
Authors' contributions
HZ, CY and JQ contributed to the conception and
design of the study. HZ performed the majority of the experiments.
JQ and HZ wrote the manuscript. JQ revised the manuscript. YH, LM,
XL and DT analyzed the experimental data. HZ, KH and QL performed
the animal studies. All authors have read and approved the final
manuscript.
Ethics approval and consent to
participate
Surgical human colorectal adenocarcinoma samples
were obtained with written informed consent under guidelines
approved by Institutional Review Board of Tongji Hospital, Tongji
Medical College, Huazhong University of Science and Technology,
(Hubei China; IRB ID: 20141106), conducted according to the
principles of the Declaration of Helsinki. The mice used in the
present study were maintained according to guidelines approved by
Institutional Animal Care and Use Committee, Huazhong University of
Science and Technology (Hubei China; IACUC ID:2014S652), and were
anesthetized and sacrificed according to AVMA guidelines.
Patient consent for publication
Not applicable.
Competing interests
The authors declare that they have no competing
interests.
Acknowledgments
The authors would like to thank animal facility of
Tongji Medical College for assisting with the animal
experiments.
References
|
1
|
Siegel RL, Miller KD, Fedewa SA, Ahnen DJ,
Meester RGS, Barzi A and Jemal A: Colorectal cancer statistics,
2017. CA Cancer J Clin. 67:177–193. 2017. View Article : Google Scholar : PubMed/NCBI
|
|
2
|
O'Brien CA, Pollett A, Gallinger S and
Dick JE: A human colon cancer cell capable of initiating tumour
growth in immunodeficient mice. Nature. 445:106–110. 2007.
View Article : Google Scholar
|
|
3
|
McGranahan N and Swanton C: Biological and
therapeutic impact of intratumor heterogeneity in cancer evolution.
Cancer Cell. 27:15–26. 2015. View Article : Google Scholar : PubMed/NCBI
|
|
4
|
Zhou B-BS, Zhang H, Damelin M, Geles KG,
Grindley JC and Dirks PB: Tumour-initiating cells: Challenges and
opportunities for anticancer drug discovery. Nat Rev Drug Discov.
8:806–823. 2009. View
Article : Google Scholar : PubMed/NCBI
|
|
5
|
Sachs N and Clevers H: Organoid cultures
for the analysis of cancer phenotypes. Curr Opin Genet Dev.
24:68–73. 2014. View Article : Google Scholar : PubMed/NCBI
|
|
6
|
Visvader JE and Lindeman GJ: Cancer stem
cells in solid tumours: Accumulating evidence and unresolved
questions. Nat Rev Cancer. 8:755–768. 2008. View Article : Google Scholar : PubMed/NCBI
|
|
7
|
Vermeulen L, Todaro M, de Sousa Mello F,
Sprick MR, Kemper K, Perez Alea M, Richel DJ, Stassi G and Medema
JP: Single-cell cloning of colon cancer stem cells reveals a
multi-lineage differentiation capacity. Proc Natl Acad Sci USA.
105:13427–13432. 2008. View Article : Google Scholar : PubMed/NCBI
|
|
8
|
Zeuner A, Todaro M, Stassi G and De Maria
R: Colorectal cancer stem cells: From the crypt to the clinic. Cell
Stem Cell. 15:692–705. 2014. View Article : Google Scholar : PubMed/NCBI
|
|
9
|
Fang Y and Eglen RM: Three-dimensional
cell cultures in drug discovery and development. SLAS Discov.
22:456–472. 2017.PubMed/NCBI
|
|
10
|
Karlsson H, Fryknäs M, Larsson R and
Nygren P: Loss of cancer drug activity in colon cancer HCT-116
cells during spheroid formation in a new 3-D spheroid cell culture
system. Exp Cell Res. 318:1577–1585. 2012. View Article : Google Scholar : PubMed/NCBI
|
|
11
|
van de Wetering M, Francies HE, Francis
JM, Bounova G, Iorio F, Pronk A, van Houdt W, van Gorp J,
Taylor-Weiner A, Kester L, et al: Prospective derivation of a
living organoid biobank of colorectal cancer patients. Cell.
161:933–945. 2015. View Article : Google Scholar : PubMed/NCBI
|
|
12
|
Fujii M, Shimokawa M, Date S, Takano A,
Matano M, Nanki K, Ohta Y, Toshimitsu K, Nakazato Y, Kawasaki K, et
al: A colorectal tumor organoid library demonstrates progressive
loss of niche factor requirements during tumorigenesis. Cell Stem
Cell. 18:827–838. 2016. View Article : Google Scholar : PubMed/NCBI
|
|
13
|
Broutier L, Mastrogiovanni G, Verstegen
MMA, Francies HE, Gavarró LM, Bradshaw CR, Allen GE, Arnes-Benito
R, Sidorova O, Gaspersz MP, et al: Human primary liver
cancer-derived organoid cultures for disease modeling and drug
screening. Nat Med. 23:1424–1435. 2017. View Article : Google Scholar : PubMed/NCBI
|
|
14
|
Huang L, Holtzinger A, Jagan I, BeGora M,
Lohse I, Ngai N, Nostro C, Wang R, Muthuswamy LB, Crawford HC, et
al: Ductal pancreatic cancer modeling and drug screening using
human pluripotent stem cell- and patient-derived tumor organoids.
Nat Med. 21:1364–1371. 2015. View Article : Google Scholar : PubMed/NCBI
|
|
15
|
Yan C, Hu Y, Zhang B, Mu L, Huang K, Zhao
H, Ma C, Li X, Tao D, Gong J, et al: The CEA-/lo colorectal cancer
cell population harbors cancer stem cells and metastatic cells.
Oncotarget. 7:80700–80715. 2016. View Article : Google Scholar : PubMed/NCBI
|
|
16
|
Sato T, Stange DE, Ferrante M, Vries RGJ,
Van Es JH, Van den Brink S, Van Houdt WJ, Pronk A, Van Gorp J,
Siersema PD, et al: Long-term expansion of epithelial organoids
from human colon, adenoma, adenocarcinoma, and Barrett's
epithelium. Gastroenterology. 141:1762–1772. 2011. View Article : Google Scholar : PubMed/NCBI
|
|
17
|
Mu L, Huang K, Hu Y, Yan C, Li X, Tao D,
Gong J and Qin J: Small-sized colorectal cancer cells harbor
metastatic tumor-initiating cells. Oncotarget. 8:107907–107919.
2017. View Article : Google Scholar
|
|
18
|
Hu Y, Yan C, Mu L, Huang K, Li X, Tao D,
Wu Y and Qin J: Fibroblast-derived exosomes contribute to
chemoresistance through priming cancer stem cells in colorectal
cancer. PLoS One. 10:e01256252015. View Article : Google Scholar : PubMed/NCBI
|
|
19
|
Mahe MM, Aihara E, Schumacher MA, Zavros
Y, Montrose MH, Helmrath MA, Sato T and Shroyer NF: Establishment
of gastrointestinal epithelial organoids. Curr Protoc Mouse Biol.
3:217–240. 2013. View Article : Google Scholar
|
|
20
|
Livak KJ and Schmittgen TD: Analysis of
relative gene expression data using real-time quantitative PCR and
the 2(−Δ Δ C(T)) method. Methods. 25:402–408. 2001. View Article : Google Scholar
|
|
21
|
Fujii M, Matano M, Nanki K and Sato T:
Efficient genetic engineering of human intestinal organoids using
electroporation. Nat Protoc. 10:1474–1485. 2015. View Article : Google Scholar : PubMed/NCBI
|
|
22
|
Pastrana E, Silva-Vargas V and Doetsch F:
Eyes wide open: A critical review of sphere-formation as an assay
for stem cells. Cell Stem Cell. 8:486–498. 2011. View Article : Google Scholar : PubMed/NCBI
|
|
23
|
Drost J and Clevers H: Organoids in cancer
research. Nat Rev Cancer. 18:407–418. 2018. View Article : Google Scholar : PubMed/NCBI
|
|
24
|
Ricci-Vitiani L, Lombardi DG, Pilozzi E,
Biffoni M, Todaro M, Peschle C and De Maria R: Identification and
expansion of human colon-cancer-initiating cells. Nature.
445:111–115. 2007. View Article : Google Scholar
|
|
25
|
Shimokawa M, Ohta Y, Nishikori S, Matano
M, Takano A, Fujii M, Date S, Sugimoto S, Kanai T and Sato T:
Visualization and targeting of LGR5+ human colon cancer
stem cells. Nature. 545:187–192. 2017. View Article : Google Scholar : PubMed/NCBI
|
|
26
|
Mitra A, Mishra L and Li S: Technologies
for deriving primary tumor cells for use in personalized cancer
therapy. Trends Biotechnol. 31:347–354. 2013. View Article : Google Scholar : PubMed/NCBI
|
|
27
|
Centenera MM, Raj GV, Knudsen KE, Tilley
WD and Butler LM: Ex vivo culture of human prostate tissue and drug
development. Nat Rev Urol. 10:483–487. 2013. View Article : Google Scholar : PubMed/NCBI
|
|
28
|
Portillo-Lara R and Alvarez MM: Enrichment
of the cancer stem phenotype in sphere cultures of prostate cancer
cell lines occurs through activation of developmental pathways
mediated by the transcriptional regulator ΔNp63α. PLoS One.
10:e01301182015. View Article : Google Scholar
|
|
29
|
Lau WM, Teng E, Chong HS, Lopez KA, Tay
AY, Salto-Tellez M, Shabbir A, So JB and Chan SL: CD44v8–10 is a
cancer-specific marker for gastric cancer stem cells. Cancer Res.
74:2630–2641. 2014. View Article : Google Scholar : PubMed/NCBI
|
|
30
|
Qin J, Liu X, Laffin B, Chen X, Choy G,
Jeter CR, Calhoun-Davis T, Li H, Palapattu GS, Pang S, et al: The
PSA(-/lo) prostate cancer cell population harbors self-renewing
long-term tumor-propagating cells that resist castration. Cell Stem
Cell. 10:556–569. 2012. View Article : Google Scholar : PubMed/NCBI
|
|
31
|
Hu YB, Yan C, Mu L, Mi YL, Zhao H, Hu H,
Li XL, Tao DD, Wu YQ, Gong JP, et al: Exosomal Wnt-induced
dedifferen-tiation of colorectal cancer cells contributes to
chemotherapy resistance. Oncogene. Nov 2–2018.Epub ahead of print.
View Article : Google Scholar
|
|
32
|
Vermeulen L, De Sousa E, Melo F, van der
Heijden M, Cameron K, de Jong JH, Borovski T, Tuynman JB, Todaro M,
Merz C, Rodermond H, et al: Wnt activity defines colon cancer stem
cells and is regulated by the microenvironment. Nat Cell Biol.
12:468–476. 2010. View Article : Google Scholar : PubMed/NCBI
|
|
33
|
Nusse R and Clevers H: Wnt/β-catenin
signaling, disease, and emerging therapeutic modalities. Cell.
169:985–999. 2017. View Article : Google Scholar : PubMed/NCBI
|
|
34
|
Hsu HH, Chen MC, Baskaran R, Lin YM, Day
CH, Lin YJ, Tu CC, Vijaya Padma V, Kuo WW and Huang CY: Oxaliplatin
resistance in colorectal cancer cells is mediated via activation of
ABCG2 to alleviate ER stress induced apoptosis. J Cell Physiol.
233:5458–5467. 2018. View Article : Google Scholar
|
|
35
|
Cassidy JW, Caldas C and Bruna A:
Maintaining tumor heterogeneity in patient-derived tumor
xenografts. Cancer Res. 75:2963–2968. 2015. View Article : Google Scholar : PubMed/NCBI
|
|
36
|
Bruna A, Rueda OM, Greenwood W, Batra AS,
Callari M, Batra RN, Pogrebniak K, Sandoval J, Cassidy JW,
Tufegdzic-Vidakovic A, et al: A biobank of breast cancer explants
with preserved intra-tumor heterogeneity to screen anticancer
compounds. Cell. 167:260–274.e22. 2016. View Article : Google Scholar : PubMed/NCBI
|
|
37
|
Aparicio S, Hidalgo M and Kung AL:
Examining the utility of patient-derived xenograft mouse models.
Nat Rev Cancer. 15:311–316. 2015. View Article : Google Scholar : PubMed/NCBI
|
|
38
|
Singh SK, Hawkins C, Clarke ID, Squire JA,
Bayani J, Hide T, Henkelman RM, Cusimano MD and Dirks PB:
Identification of human brain tumour initiating cells. Nature.
432:396–401. 2004. View Article : Google Scholar : PubMed/NCBI
|
|
39
|
Drost J, van Boxtel R, Blokzijl F,
Mizutani T, Sasaki N, Sasselli V, de Ligt J, Behjati S, Grolleman
JE, van Wezel T, et al: Use of CRISPR-modified human stem cell
organoids to study the origin of mutational signatures in cancer.
Science. 358:234–238. 2017. View Article : Google Scholar : PubMed/NCBI
|
|
40
|
Seino T, Kawasaki S, Shimokawa M, Tamagawa
H, Toshimitsu K, Fujii M, Ohta Y, Matano M, Nanki K, Kawasaki K, et
al: Human pancreatic tumor organoids reveal loss of stem cell niche
factor dependence during disease progression. Cell Stem Cell.
22:454–467.e6. 2018. View Article : Google Scholar : PubMed/NCBI
|
|
41
|
Dijkstra KK, Cattaneo CM, Weeber F,
Chalabi M, van de Haar J, Fanchi LF, Slagter M, van der Velden DL,
Kaing S, Kelderman S, et al: Generation of tumor-reactive T cells
by co-culture of peripheral blood lymphocytes and tumor organoids.
Cell. 174:1586–1598.e12. 2018. View Article : Google Scholar : PubMed/NCBI
|
|
42
|
Batlle E and Clevers H: Cancer stem cells
revisited. Nat Med. 23:1124–1134. 2017. View Article : Google Scholar : PubMed/NCBI
|
|
43
|
Fearon ER: Molecular genetics of
colorectal cancer. Annu Rev Pathol. 6:479–507. 2011. View Article : Google Scholar
|
|
44
|
Bonnet D and Dick JE: Human acute myeloid
leukemia is organized as a hierarchy that originates from a
primitive hema-topoietic cell. Nat Med. 3:730–737. 1997. View Article : Google Scholar : PubMed/NCBI
|
|
45
|
Sun S, Liu S, Duan SZ, Zhang L, Zhou H, Hu
Y, Zhou X, Shi C, Zhou R and Zhang Z: Targeting the c-Met/FZD8
signaling axis eliminates patient-derived cancer stem-like cells in
head and neck squamous carcinomas. Cancer Res. 74:7546–7559. 2014.
View Article : Google Scholar : PubMed/NCBI
|