Introduction
Thyroid cancer (TC) is the most common endocrine
malignancy, accounting for 3.2% of all new malignancies (excluding
in situ carcinomas and skin cancers) in the United States,
according to statistics from 2012 (1). An increased incidence rate of TC has
been reported worldwide and has been attributed largely to the
increased detection of small papillary TC, potentially, but not
definitively, due to improved detection techniques (2). However, there is also an increase in
the incidence of more aggressive types of TC (3). Patients with differentiated TC (DTC)
have an excellent prognosis, with the 10-year survival rate ranging
between 80 and 95% (4,5). Recurrence, as well as distant
metastases at the time of surgery, however, significantly worsen
prognosis. Distant metastases at the time of surgery confer a
10-year survival rate of 40% (6),
whereas mortality for recurrence has been reported to be as high as
69% (7). Anaplastic TC (ATC) is a
rare histological type of TC, but it is considered one of the most
aggressive solid malignancies, with a 1-year survival rate of 20%
(8). Different therapeutic
modalities have been implemented for ATC, but no treatment to date
has provided significant clinical benefit to patients. Therefore,
all patients with ATC should be considered for inclusion in
available clinical trials (9). In
2011, medullary TC (MTC) comprised ~3-5% of all TC cases in the
United States, but accounted for 15% of all TC-associated
mortalities (10). While
representing a histologically distinct entity, MTC, like DTC, has a
much worse prognosis when presenting with distant metastases
(11). Thus, novel therapeutic
strategies are required for aggressive DTC and MTC, as well as for
ATC.
Tyrosine kinase inhibitors (TKIs) have been at the
forefront in the fight against TC, with 4 such inhibitors already
FDA-approved for the treatment of metastatic,
radioactive-iodine-refractory DTC and advanced MTC. Several other
TKIs are currently under investigation (12). However, treatment with TKIs is
commonly associated with significant adverse side-effects and is
costly. These characteristics have prompted the evaluation of
previously approved non-cancer medications for the treatment of
these malignancies. Repositioning of existing FDA-approved
medications has emerged as a promising strategy for the treatment
of TC (13). As an example,
nelfinavir, an HIV protease inhibitor, has demonstrated
effectiveness against all histological types of TC in the in
vitro setting. More specifically, it has been demonstrated to
downregulate tyrosine-protein kinase receptor Ret signaling,
inhibit the phosphoinositide 3-kinase/protein kinase B (AKT) and
mitogen-activated protein kinase (MAPK)/extracellular
signal-regulated kinase (ERK) signaling pathways, and induce
apoptosis in MTC cells, while inhibiting proliferation and inducing
DNA damage in DTC and ATC cells (14,15).
Metformin, widely prescribed to treat diabetes, has been reported
to increase progression-free survival in patients with diabetes and
TC through the inhibition of ribosomal protein S6 kinase β-1 and
upregulation of AMP-activated protein kinase in in vitro
models (16). Metformin also
inhibited oxidative phosphorylation in TC cells, and
metformin-induced downregulation of mitochondrial
glycerol-3-phosphate dehydrogenase was associated with growth
inhibitory effects in vitro and in vivo (17).
Previous studies have reported that mitotane, a
steroidogenesis inhibitor used for the treatment of adrenocortical
carcinoma (ACC) and Cushing's disease (18-20),
exerts its anti-neoplastic effects through the inhibition of key
mitochondrial enzymes (21,22).
Mitotane was reported to induce a mitochondrial respiratory chain
defect by inhibiting cytochrome c oxidase (COX) subunits 2
and 4I1 (COX2 and COX4I1). Furthermore, this drug has been reported
to induce endoplasmic reticulum (ER) stress and apoptosis in ACC
cells (22).
Since the inhibition of mitochondrial functions
emerged as a promising strategy for the treatment of TC, we
hypothesized that mitotane may be an effective compound against
this cancer. In the present study, the effects of mitotane were
examined on a number of cell lines representing major histological
subtypes of TC. With evidence of growth inhibition and induction of
apoptosis at therapeutically achievable concentrations of mitotane,
the present results imply the utility of this medication in the
treatment of patients with advanced TC.
Materials and methods
TC cells, culture and reagents
Human TC cell lines derived from follicular
(FTC-133), poorly differentiated (BCPAP), anaplastic (SW1736 and
C643) and medullary (TT) histotypes were obtained from Dr Motoyasu
Saji (Ohio State University, Columbus, OH, USA), with permission
from the researchers who originally established the cell lines.
Normal human dermal fibroblasts were purchased from Lonza Group
Ltd. These cell lines harbor thyroid oncogene mutations, including
serine/threonine-protein kinase B-raf V600E (BCPAP and SW1736),
phosphatidylinositol 3,4,5-trisphosphate 3-phosphatase and
dual-specificity protein phosphatase PTEN (FTC-133), cellular tumor
antigen p53 (D259Y mutation; BCPAP), p53 (R248Q mutation; C643),
GTPase HRas (C643), and Ret (C634W mutation; TT). All TC cell lines
had been tested and authenticated to be of thyroid origin by short
tandem repeat profiling analysis. The expression of
thyroid-specific genes was confirmed by polymerase chain reaction
(PCR) analysis. In the present study, FTC-133, BCPAP, SW1736 and
C643 cells were characterized by expression of homeobox protein
Nkx-2.1 or thyroid transcription factor 1, and thyroglobulin, and
the MTC-derived TT cells expressed thyrocalcitonin.
The cancer cells were propagated in conventional
RPMI-1640 medium supplemented with fetal bovine serum (both Thermo
Fisher Scientific, Inc.) to 10%, 100 U/ml penicillin and 100 mg/ml
streptomycin in a humidified 5% CO2 incubator at 37°C.
The cells were sub-cultured with 0.5% trypsin and 0.02% EDTA
(Sigma-Aldrich; Merck KGaA) until they reached 80% confluence. All
experiments were performed using cells that had been passaged
<20 times.
In order to express green fluorescent protein (GFP),
TT and BCPAP cells were infected with lentiviral particles that did
not target any known mammalian mRNA, containing a copGFP-coding
construct (cat. no. sc-108084; Santa Cruz Biotechnology, Inc.).
Following transduction, the GFP-positive cells were selected with
puromycin.
Mitotane
[1-(2-chlorophenyl)-1-(4-chlorophenyl)-2,2-dichlo-roethane] was
obtained from Sigma-Aldrich, Merck KGaA. The drug was dissolved in
dimethyl sulfoxide (DMSO) and kept as a 100-mM stock solution. A
concentration of 50 μM is within the threshold of
therapeutic serum levels for the treatment of adrenal
adenocarcinoma and was the target exposure concentration in the
present study. TC cell treatment was performed by supplementation
with media containing mitotane at concentrations 0-100 μM.
DMSO exposure of 0.1% in controls had no effect on the examined
cells lines. DMSO controls were treated over the same time course
and at the same concentrations of DMSO as was present in the
mitotane-treated cells.
Cell proliferation and detection of
mitochondrial membrane potential
Cell proliferation rate following treatment with
mitotane was determined by cell counting using a Vi-CELL™ Cell
Viability Analyzer (Beckman Coulter, Inc.). Evaluation of
mitochondrial membrane potential was performed with a fluorogenic
lipophilic cation (JC-1; Cayman Chemical Company), according to the
manufacturer's protocol. In cells with hyper-polarized
mitochondrial membranes, JC-1 spontaneously forms complexes
(J-aggregates) emitting red fluorescence. In cells with depolarized
mitochondrial membranes, JC-1 remains in the monomeric form, which
does not fluoresce. The detection of mitochondrial membrane
potential was performed by fluorescent microscopy (magnification,
×40 and ×200). All experiments were repeated ≥l times.
Cell cycle analysis
FTC-133, BCPAP, SW1736, C643 and TT cells were
harvested following 24-h incubation with mitotane (25 and 50
μM), washed with cold PBS, and fixed in 100% ice-cold
methanol for 1 h. The fixed cells (1×10⁶) were incubated
with RNase A for 30 min at room temperature, and stained with 50
μg/ml propidium iodide (PI) solution (Thermo Fisher
Scientific, Inc.) at room temperature in the dark for 30 min. Flow
cytometry analysis was performed on a BD LSRII flow cytometer
(Becton, Dickinson and Company). A 488-nm laser was used for the
dye excitation; 595 long pass and 610/20 band pass filters were
used for emission detection. Single cells were gated using forward
scatter height and area parameters. The single cell population gate
was confirmed by using area and width parameters of PI channel. The
distribution of cells in the G0/G1, S and
G2/M phases of the cell cycle was estimated using ModFit
LT version 5.0 analysis software (Verity Software House, Inc.). As
an estimate the extent of apoptosis, the percentage of apoptotic
cells was calculated in the DNA histograms. The measurements were
performed in triplicate.
RNA extraction and reverse
transcription-quantitative (RT-q) PCR
Total RNA was extracted using the AllPrep DNA/RNA
Mini kit (Qiagen, Inc.) according to the manufacturer's protocol.
The quality and quantity of total RNA was assessed with a NanoDrop
1000 spectrophotometer (Thermo Fisher Scientific, Inc.). A total of
1 μg RNA was reverse transcribed into cDNA with the miScript
II RT kit (Qiagen, Inc.) as indicated, at 37°C for 1 h and 95°C for
5 min for termination of the reaction. qPCR screening of
cancer-associated genes was performed using a pre-fabricated RT-PCR
Human Cancer PathwayFinder Array (PAHS-033ZA; cat. no. 330231) and
RT2 SYBR® Green qPCR Mastermix (both Qiagen,
Inc.). The arrays were run on the QuantStudio™ 6 Flex Real-Time PCR
System (Thermo Fisher Scientific, Inc.). Cycle thresholds were
determined for each gene using the QuantStudio 6 Flex software. The
thermocycling conditions were as follows: 95°C for 2 min followed
by 40 cycles of denaturation at 95°C for 15 sec and annealing at
60°C for 1 min. Melting curves were determined to ensure
amplification of a single product. Cycle threshold values were
transferred into a Data Analysis Template spreadsheet (Excel;
Microsoft Corporation) and ΔΔCt values determined for each gene in
the mitotane-treated and control cells. Data analysis was performed
following normalization to 5 control genes (β-actin,
β-2-microglobulin, GAPDH and hypoxanthine phosphoribosyltransferase
1). Fold-changes in expression of each gene in mitotane-treated
samples were compared to control using the comparative Ct method
(2−ΔΔCq) (23).
The expression levels of
phorbol-12-myristate-13-acetate-induced protein 1 (NOXA), p53
upregulated modulator of apoptosis (PUMA) and ATP synthase subunit
β (ATP5B) were measured using the following primer pairs: NOXA-F,
3′-GCA GAGCTGGAAGTCGAGTG-5′; NOXA-R, 3′-GAGCAGAAG
AGTTTGGATATCAG-5′; PUMA-F, 3′-GACGACCTCAAC GCACAGTA-5′; PUMA-R,
3′-AGGAGTCCCATGATGAGA TTGT-5′; ATP5B-F, 3′-TCACCCAGGCTGGTTCAGA-5′;
and ATP5B-R 3′-AGTGGCCAGGGTAGGCTGAT-5′. The expression level of the
endogenous control (18S) was determined using commercially
available primers (RT2 qPCR Primer Assay for Human 18S;
cat. no. PPH05666E; Qiagen, Inc.). For the ATP5B, PUMA and NOXA
genes, the PCR reactions were performed in triplicate on a
LightCycler 96 (Roche Diagnostics) with the following amplification
profile: 50°C for 2 min followed by 40 cycles of denaturation for
10 min at 95°C and annealing for 1 min at 60°C. Melting curves were
determined to ensure amplification of a single product. Negative
cDNA controls were run in parallel with each set of reactions. The
amount of transcripts was normalized to that of 18S. Baseline and
threshold values were set by the LightCycler 96 version 1.1
software and data was analyzed and expressed using the
2−ΔΔCq method of relative quantification.
Protein extraction and western blot
analysis
The TC cells were incubated with ice-cold M-PER™
Mammalian Protein Extraction Reagent (Thermo Fisher Scientific,
Inc.), scraped and centrifuged at 4°C at 12,000 × g for 10 min, and
the supernatant was stored at −80°C. The protein concentration was
measured using a bicinchoninic acid assay (Pearce; Thermo Fisher
Scientific, Inc.), 25 μg protein lysate was suspended in
reduced SDS sample buffer and the lysates were subjected to
SDS-PAGE (4-12% gels). Non-specific binding was prevented by
blocking the membrane with Odyssey® Blocking Buffer
(TBS) (LI-COR Biosciences) overnight at 4°C. The separated proteins
were transferred to a nitrocellulose membrane (Thermo Fisher
Scientific, Inc.) by electrophoretic blotting, which was then
incubated overnight at 4°C with primary antibodies against β-actin
(Sigma-Aldrich; Merck KGaA), total AKT, phosphorylated (p-)AKT1/2/3
(Ser473), total ERK, p-ERK1/2, cleaved caspase-3, poly [ADP-ribose]
polymerase (PARP), succinate dehydrogenase flavoprotein subunit
(SDHA), cytochrome c, COX4, ER oxidoreductin-1 (ERO1),
inositol-requiring enzyme 1 (IRE1), and heat shock protein 60 (all
Cell Signaling Technology, Inc.); histone γH2AX, NADH dehydrogenase
1 α-1 (NDUFA1) and anti-ATP5B (all Santa Cruz Biotechnology, Inc.)
(Table I). The membranes were then
incubated with the secondary antibody for 1 h at room temperature.
Detection of proteins was performed using the LI-COR Odyssey
imaging system (LI-COR Biosciences).
 | Table IList of antibodies used in the
present study. |
Table I
List of antibodies used in the
present study.
| Antibody | Supplier | Cat. no. | Dilution |
|---|
| p-AKT 1/2/3 | Cell Signaling
Technology, Inc. | 4060 | 1:1000 |
| AKT | | 9272 | 1:1000 |
| p-ERK 1/2 | | 4370 | 1:1000 |
| ERK | | 4695 | 1:1000 |
| Cleaved
caspase-3 | | 9664 | 1:1000 |
| SDHA | | 5839 | 1:1000 |
| Cytochrome
c | | 4280 | 1:1000 |
| COX4 | | 4850 | 1:1000 |
| ERO1 | | 3264 | 1:1000 |
| IRE1 | | 3294 | 1:1000 |
| HSP60 | | 4871 | 1:1000 |
| PARP | | 9532 | 1:1000 |
| γH2AX | Santa Cruz
Biotechnology, Inc. | sc-101696 | 1:200 |
| H2AX | | sc-54606 | 1:200 |
| NDUFA1 | | sc-376357 | 1:200 |
| ATP5B | | sc-166443 | 1:200 |
| β-actin | Sigma Aldrich;
Merck KGaA | A1978 | 1:2000 |
| IRDye 800 CW goat
anti-rabbit | LI-COR
Biosciences | 926-32211 | 1:5000 |
| IRDye 680 CW goat
anti-mouse | | 925-68070 | 1:5000 |
| IRDye 800 CW donkey
anti-goat | | 926-32214 | 1:5000 |
Immunostaining and human TC tissue
samples
Immunostaining was performed on commercially
available 5-μM thick paraffin-embedded thyroid tissue
microarray slides (US Biomax, Inc.). The microarrays included 100
thyroid tissue samples: 10 normal thyroid, 20 follicular TC (FTC),
44 papillary TC (PTC), 6 poorly differentiated TC (PDTC) and 20 MTC
samples. Furthermore, formalin-fixed/paraffin-embedded and frozen
thyroid tissue samples from 16 patients with thyroid tumors were
selected from the thyroid tumor bank at the Uniformed Services
University of the Health Sciences (Bethesda, MD, USA) and examined.
These samples included normal and tumor tissue from 12 PTC, 3 FTC
and 1 MTC case. The sections were deparaffinized in xylene,
incubated in alcohol, and following microwave heating with
antigen-unmasking solution (Vector Laboratories, Inc.) for 10 min,
they were incubated in 3% hydrogen peroxide for 15 min to
inactivate endogenous peroxidase activity, all at room temperature.
The samples were incubated for 10 min in a working solution of
blocking serum (component of the Vectastain Universal Quick kit;
Vector Laboratories, Inc.) and incubated at 4°C overnight with 2
μg/ml anti-ATP5B antibody (1:100 dilution). Immunostaining
was performed using the Vectastain Universal Quick kit (Vector
Laboratories, Inc.) according to the manufacturer's instructions.
They were then incubated with kit's biotinylated secondary antibody
for 10 min, and streptavidin/peroxidase complex working solution
for 10 min. Peroxidase staining was revealed using ImmPact DAB
peroxidase substrate kit (Vector Laboratories, Inc.). The sections
were counterstained with hematoxylin for 30 sec and mounted. All
steps were performed at room temperature. Antiserum was omitted in
the negative control. The immunostaining was evaluated using an
Olympus BX41 microscope (Olympus Corporation). The fluorescent
microscopy was performed using a Nikon EclipseTi inverted
microscope (magnification, ×40 and ×200; Nikon Corporation).
For quantification of the ATP5B expression, ≥200
cells in three different areas of tumor were examined, and the
percentage of positive cells was calculated. The results of
staining were interpreted as follows: Negative, no staining or
focal/low intensity of staining in <50% of cells; and positive,
strong staining in >50% of cells. The intensity of the
immunostaining was scored independently by two investigators.
Statistical analysis
The data were analyzed using SSPS version 22.0
software. For non-parametric data, the Kruskal-Wallis test was
used, followed by a Bonferroni correction for multiple comparisons.
For parametric data, 2-sample Student's t-test was used. P<0.05
was considered to indicate statistically significant differences.
UCSC Xena (https://xenabrowser.net/heatmap/) was used to explore
functional genomic data sets for links between ATP5B expression and
clinical prognosis. UCSC Xena allows for exploration of genomic
data sets to discover associations between genomic and/or
phenotypic variable, and to determine if a gene affects survival
through Kaplan-Meier survival analysis.
Results
Mitotane inhibits TC cell viability
TC cells FTC-133, BCPAP, SW1736, C643 and TT were
treated with increasing concentrations of mitotane for 24 h, and
the number of viable cells was determined by direct cell counting
using the Vi-CELL Cell Viability Analyzer. As demonstrated in
Fig. 1A, treatment with mitotane
was associated with a decrease in the number of viable cells in all
examined cell lines. The cells responded to treatment in a
dose-dependent manner, and demonstrated differential sensitivity to
mitotane. BRAF-mutant BCPAP and SW1736 cells, and Ret-positive TT
cells were more sensitive to mitotane compared with the
PTEN-deficient FTC-133 or HRas-mutant C643 cells. Treatment with
mitotane (50 μM for 24 h) decreased the viability of
FTC-133, BCPAP, SW1736, C643 and TT cells by 12, 59, 54, 31 and
66%, respectively. This degree of inhibition was statistically
significant for the BCPAP, SW1736 and TT cells compared with that
in the control cells (P≤0.01).
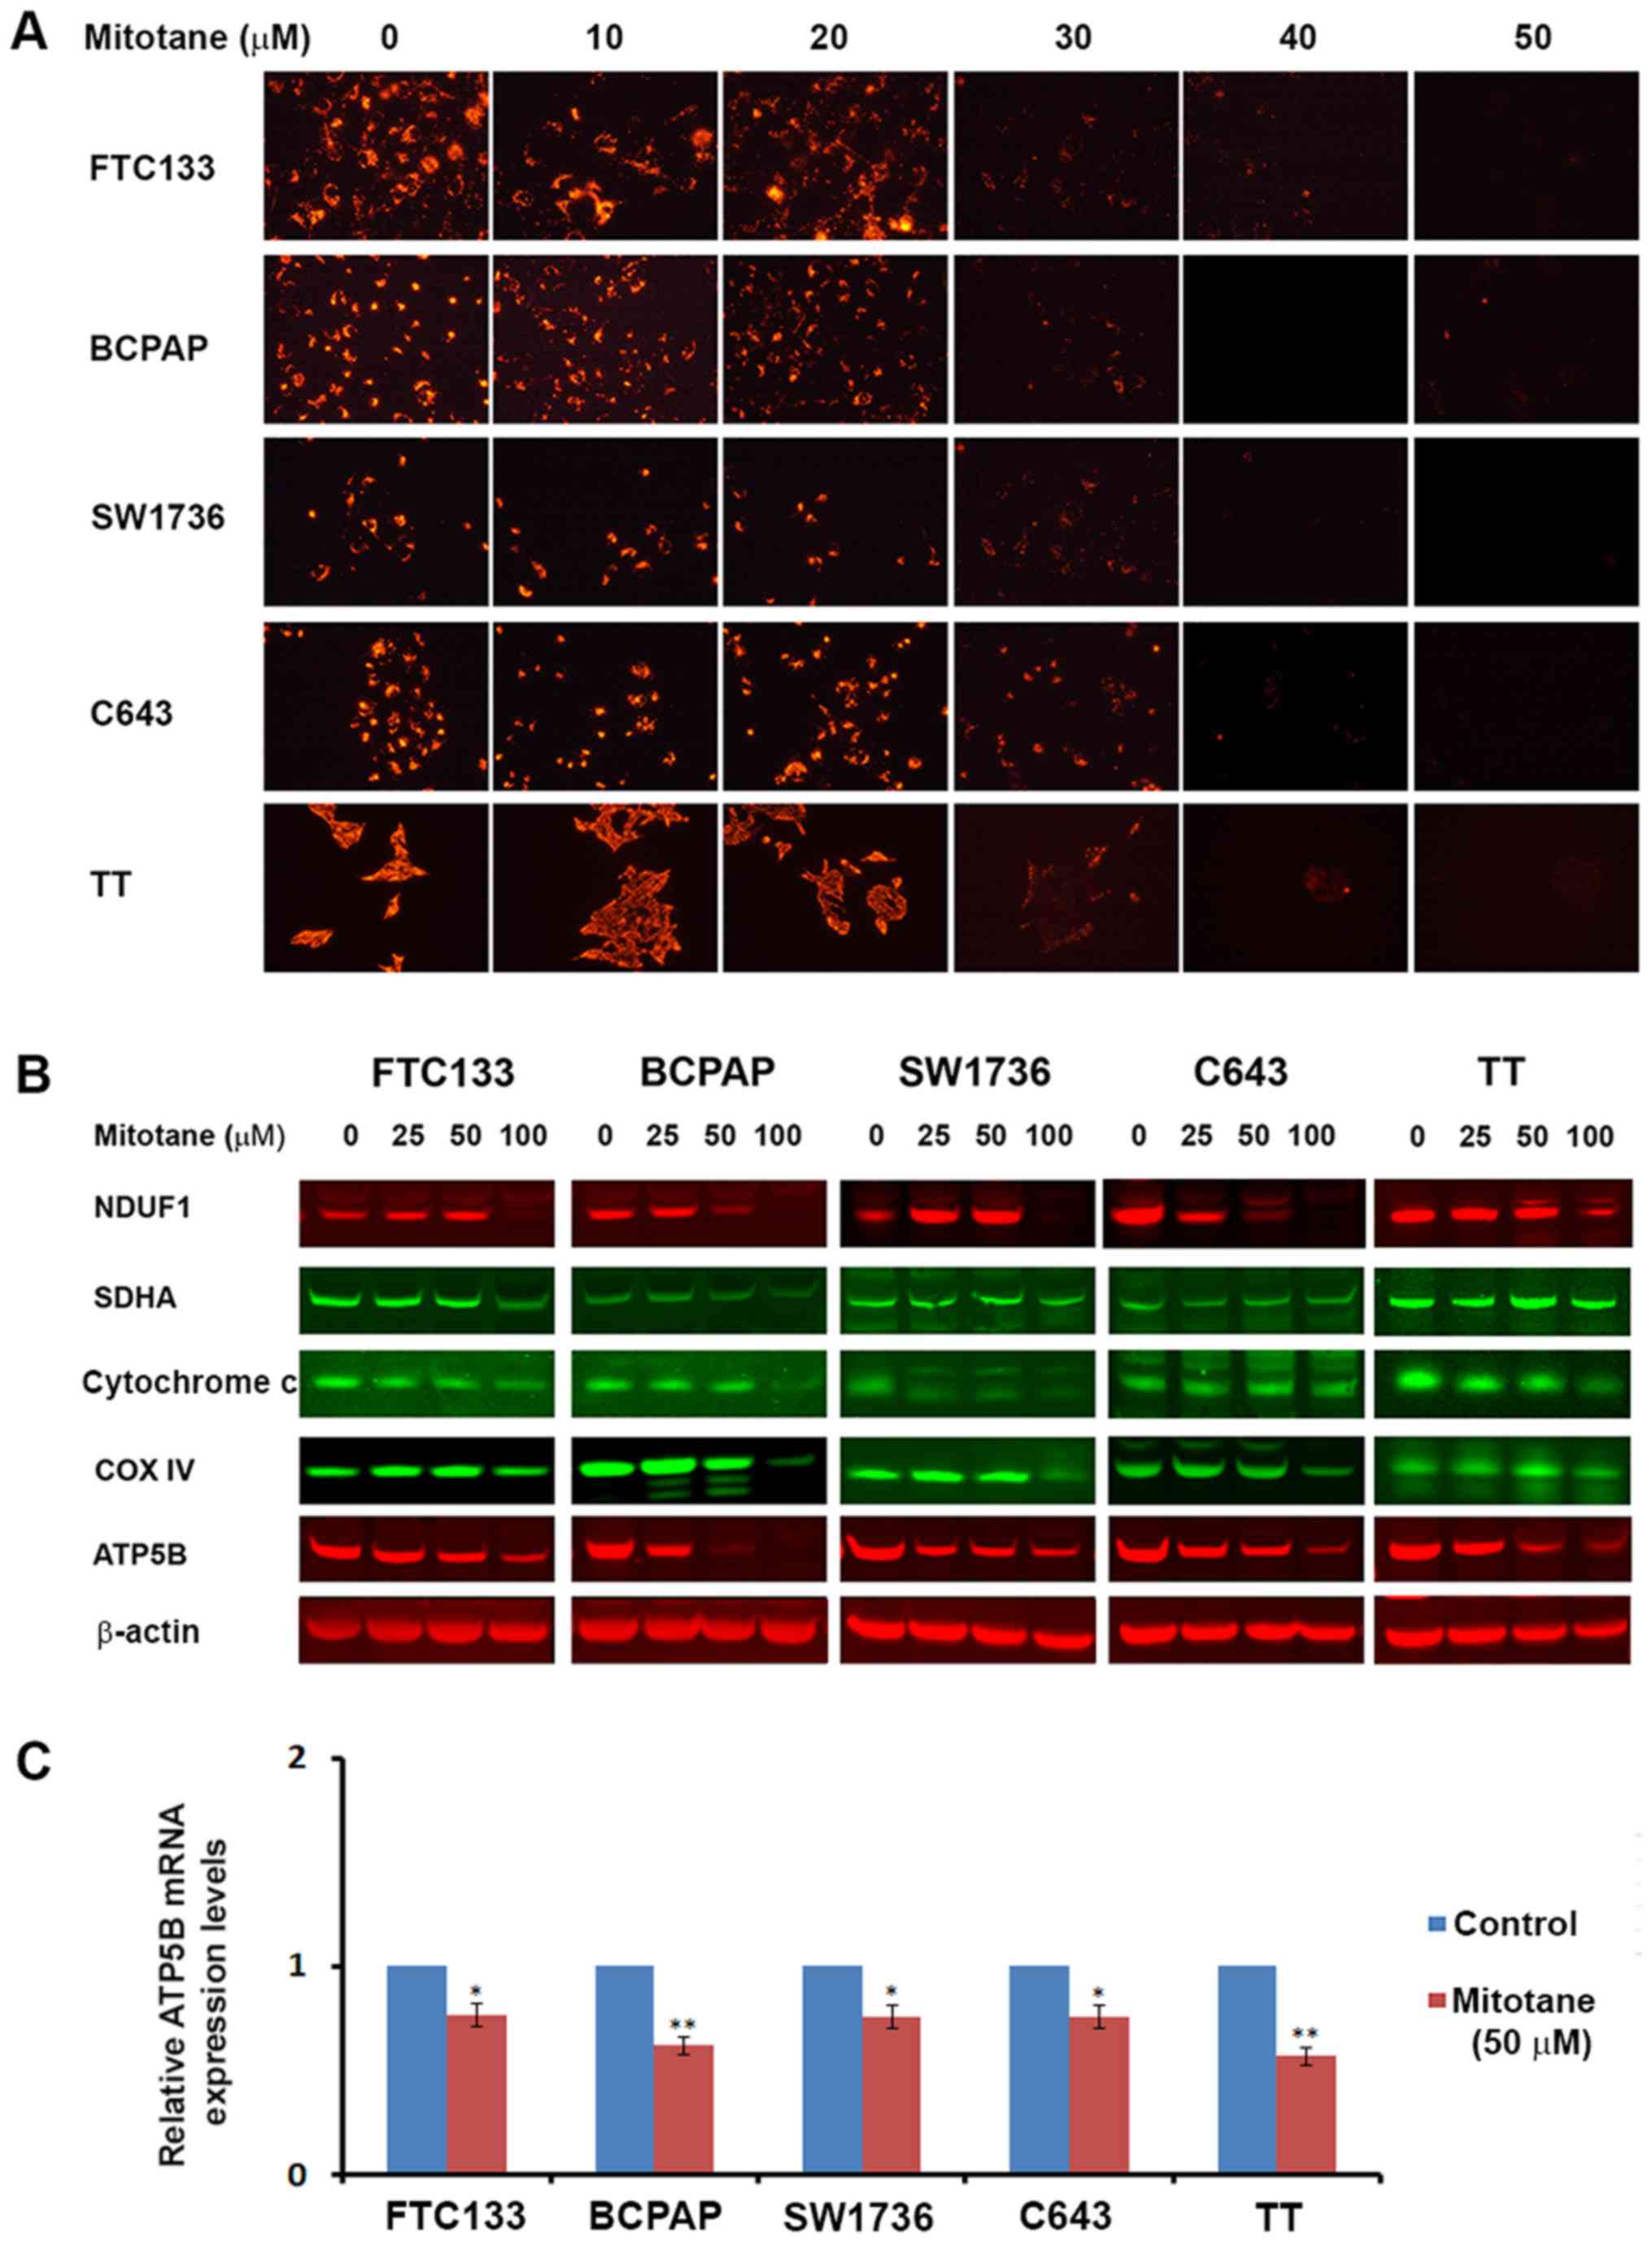
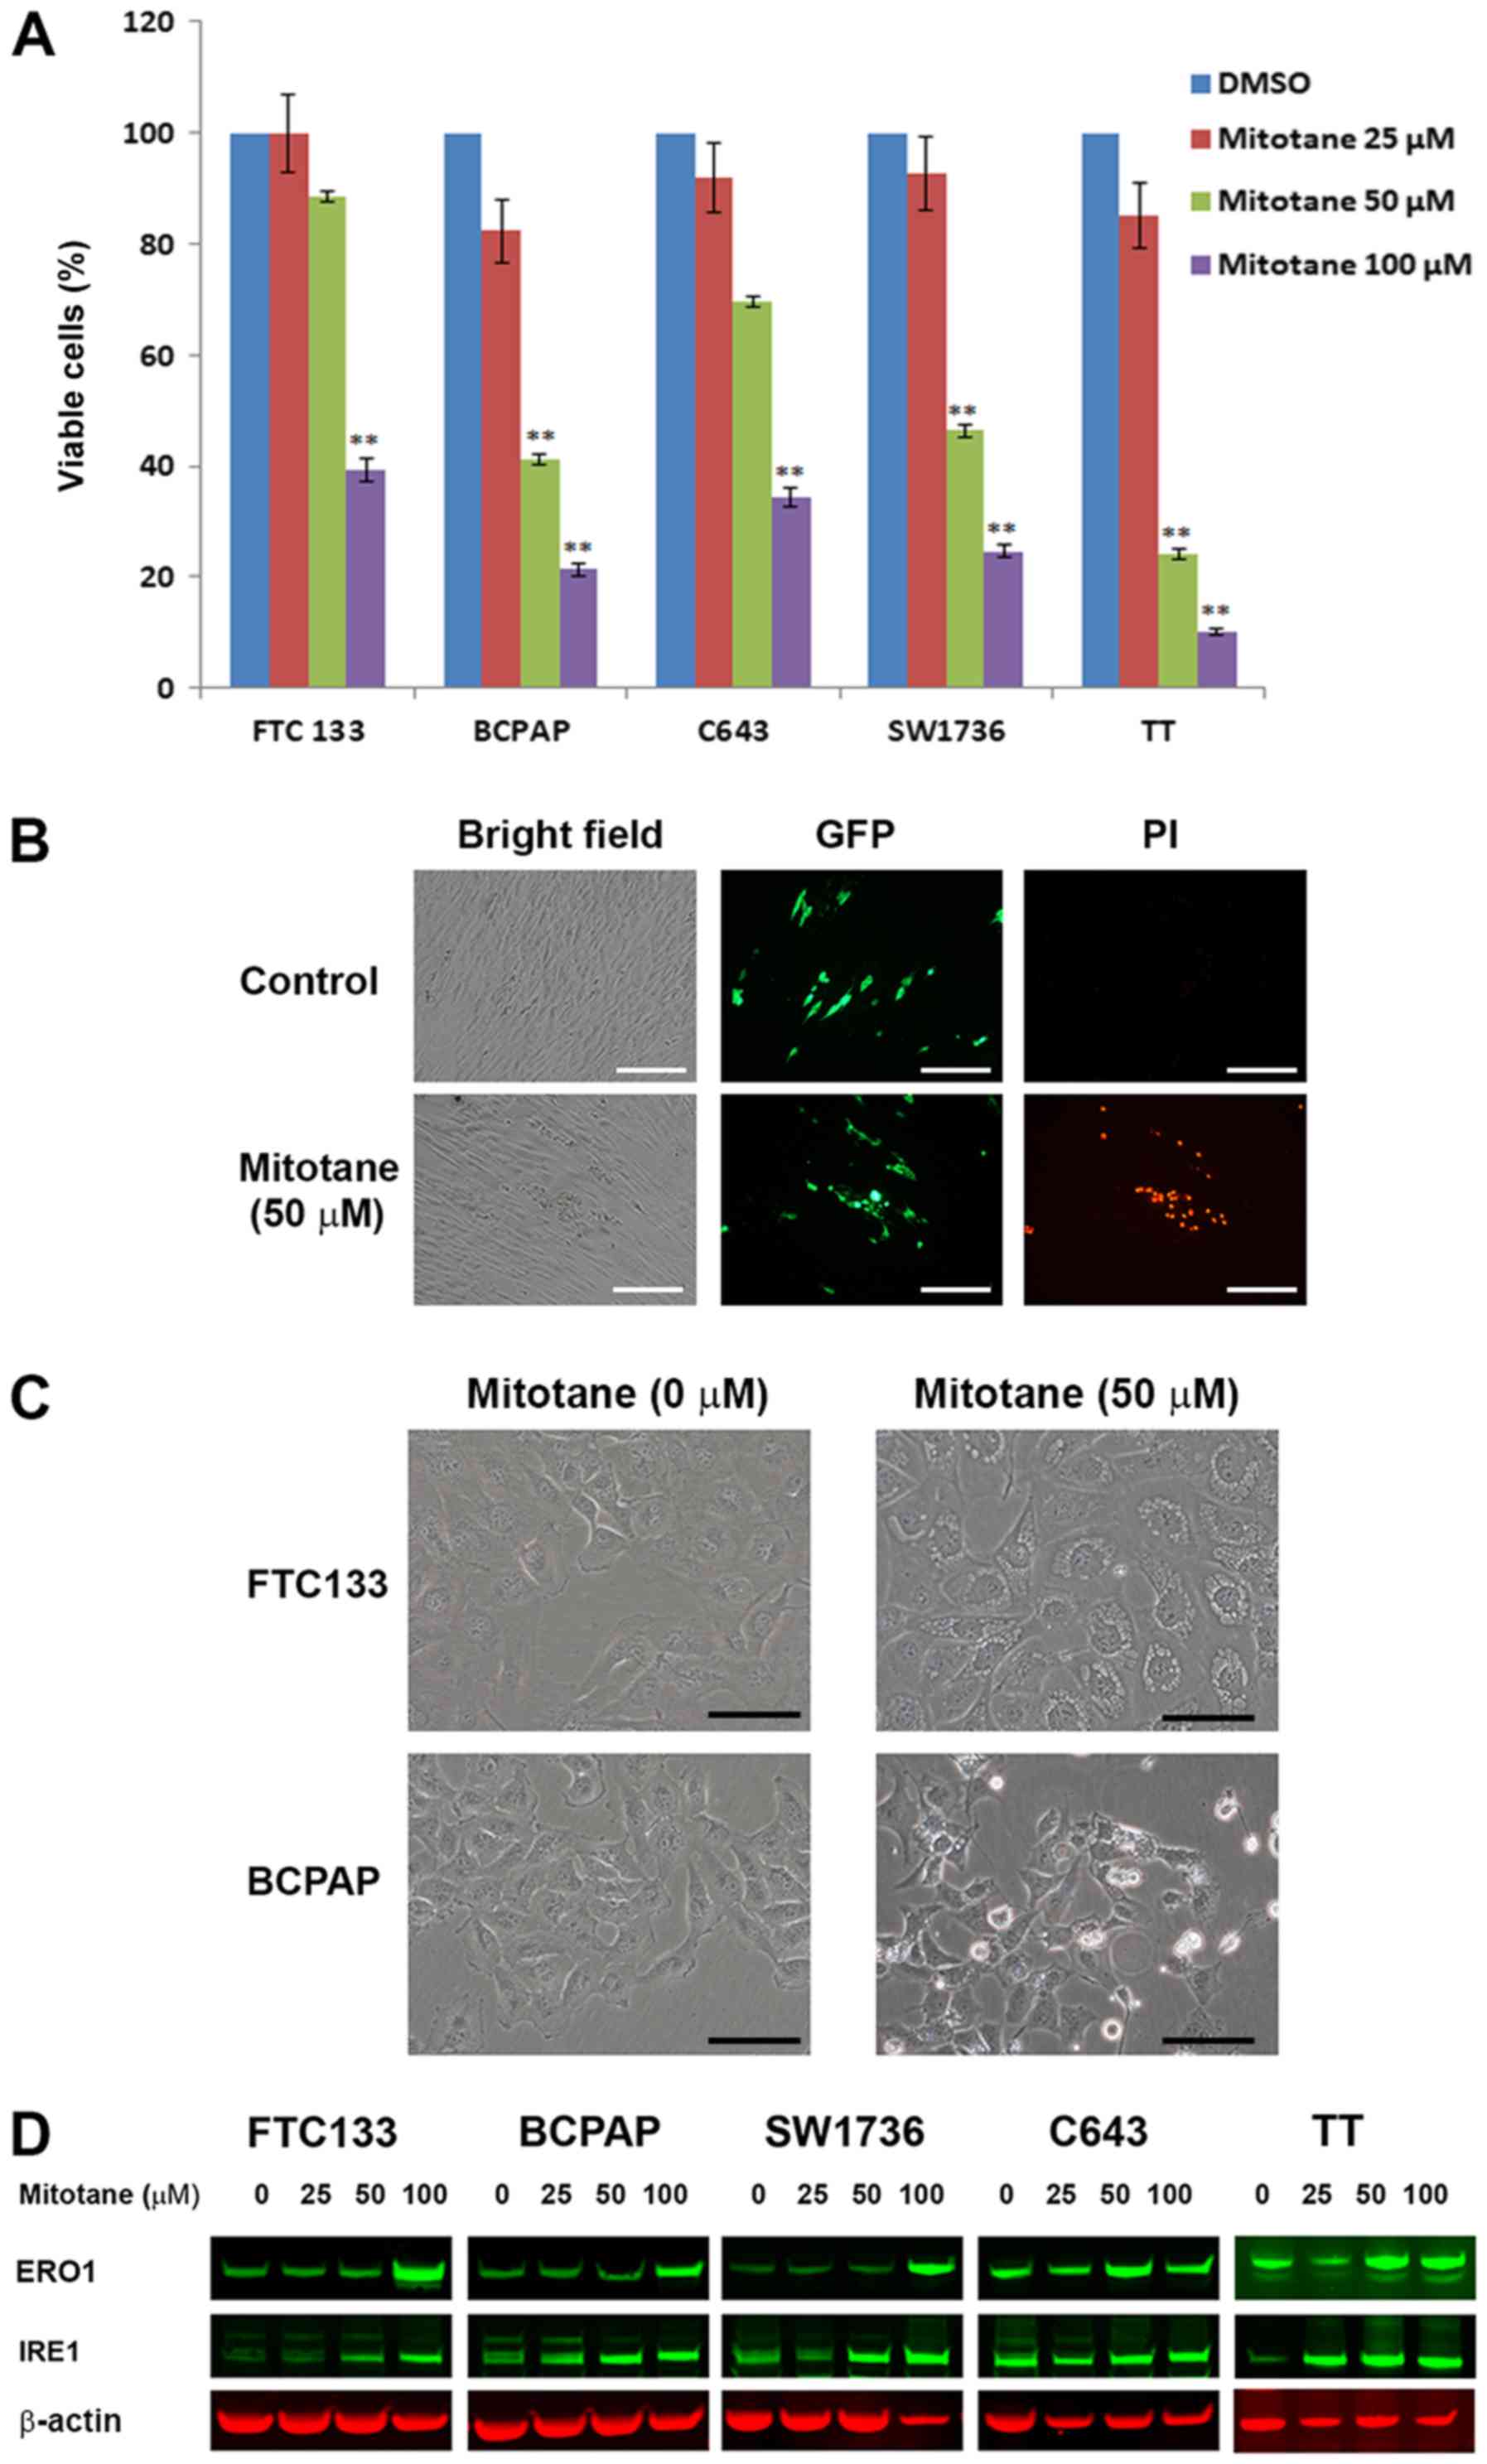 | Figure 1Mitotane inhibits cell viability and
induces ER stress in thyroid cancer cell lines. (A) Inhibition of
thyroid cancer cell viability following treatment with increasing
concentrations of mitotane (10, 50 and 100 μM) for 24 h.
BCPAP, SW1736 and TT cells indicated increased sensitivity to
mitotane. **P<0.01 versus no-mitotane control. The
data are presented as the mean ± standard deviation. (B) TT cells
expressing GFP were co-cultured with human fibroblasts and treated
with 0 and 50 μM mitotane for 24 h (bright-field microscopy
images are displayed in the left column). TT-GFP cells were easily
identified from human fibroblasts by fluorescent microscopy (middle
column). Nuclear accumulation of propidium iodide, indicating cell
death was detected in GFP-positive TT cells, but not in fibroblasts
(right column), demonstrating differential sensitivity to treatment
with 50 μM mitotane for 24 h. Scale bar, 100 μm. (C)
Direct bright-field microscopy images of FTC-133 and BCPAP cells
following exposure to 0 or 50 μM mitotane for 24 h.
Formation of large cytoplasmic vacuoles, indicative of ER stress
induction, was observed in mitotane-treated FTC-133 cells. Cellular
shrinkage, nuclear fragmentation, plasma membrane blebbing and cell
detachment from the plate, indicating apoptosis, were observed in
the mitotane-treated BCPAP cells. Scale bar, 20 μm. (D)
Western blot analysis revealed that treatment with mitotane for 24
h increased the protein level of IRE1 and ERO1 in FTC-133, BCPAP,
SW1736, C643 and TT cells, indicating induction of ER stress. GFP,
green fluorescent protein; PI, propidium iodide; ER, endoplasmic
reticulum; IRE1, inositol-requiring enzyme 1; ERO1, endoplasmic
reticulum oxidoreductin-1. |
The effects of mitotane on TC cells and
fibroblasts
To further confirm that TC cells are sensitive to
mitotane, co-culture experiments were performed. MTC-derived TT
cells expressing GFP (TT-GFP cells) were co-cultured with human
fibroblasts in the same plate, and subsequently treated with 50
μM mitotane for 24 h. The TT-GFP cells formed cellular
clusters that were barely distinguishable from the fibroblasts by
bright-field microscopy, but easily identifiable by fluorescence
microscopy (Fig. 1B). Treatment
with mitotane was associated with progressive decrease in the
number of TT-GFP cells (data not shown). To demonstrate that
treatment with mitotane leads to death of TT cells but not
fibroblasts, PI staining was performed. Nuclear accumulation of PI,
indicating dead cells, was detected in the TTT-GFP cells, but not
in the fibroblasts (Fig. 1B).
Similar results were observed for mitotane-treated GFP-positive
BCPAP cells co-cultured with fibroblasts (data not shown).
Mitotane induces ER stress in TC
cells
The morphological changes in mitotane-treated TC
cells were monitored. Treatment with 50 μM mitotane for 24 h
was associated with the formation of large cytoplasmic vacuoles in
all examined thyroid cells, suggesting the induction of ER stress
(Fig. 1C). In addition, the
morphological features of apoptosis, including cellular shrinkage,
nuclear fragmentation, plasma membrane blebbing and cell detachment
from the plate, were observed in BCPAP (Fig. 1C), SW1736 and TT cells (data not
shown) following exposure to mitotane. These morphological changes
were observed over time and the effects of mitotane withdrawal from
the medium were investigated. In the FTC-133 cells, mitotane
treatment for 12 h was associated with the formation of vacuoles in
the cytoplasm, and over time the number and size of vacuoles
progressively increased. For cells exposed to the drug for 16 h,
the replacement of the medium to drug-free conditions induced a
reversion of the cellular phenotype. At 20 h (4 h after the medium
change), the morphological features of pre-treated FTC-133 cells
were indistinguishable from control untreated cells. Notably,
following exposure to 50 μM mitotane for 24 h, the switch to
mitotane-free media was sufficient for the restoration of normal
morphology in the FTC-133 and C643 cells, but not in the BCPAP,
SW1736 and TT cells. Treatment with a 100 μM concentration
for 24 h induced irreversible morphological changes among all
examined TC cell lines (data not shown).
To confirm that mitotane induces ER stress in TC
cells, the expression of ER-stress-associated proteins in
mitotane-treated cells was examined by western blotting. Treatment
with 50 μM of the drug for 24 h increased the protein level
of IRE1 in the FTC-133, BCPAP, SW1736 and TT cells, but not in the
C643 cells. In all examined cells, 24-h exposure to 100 μM
mitotane was associated with upregulation of ERO1, confirming that
ER stress serves a role in the response of TC cells to treatment
with this compound (Fig. 1D).
Together, these data reveal that TC cells exhibit differing
abilities to recover from mitotane-induced ER stress.
The effects of mitotane on the cell cycle
of TC cells
Suppression of cell proliferation in cancer cells is
usually associated with concomitant cell cycle arrest and
activation of cell death pathways. Therefore, the contribution of
cell cycle arrest and apoptosis to the observed proliferation
inhibition following treatment with mitotane was examined. As
observed in Fig. 2A, the cell
cycle was arrested at the G1 phase for mitotane-treated
BCPAP, C643, SW1736 and TT cells compared with untreated cells. For
the FTC-133 cells, the drug treatment had minimal effects on the
cell cycle; the percentage of cells in G1 increased from
53.9 to 55.5%, and the percentage of G2 cells decreased
from 11.7 to 9.5%.
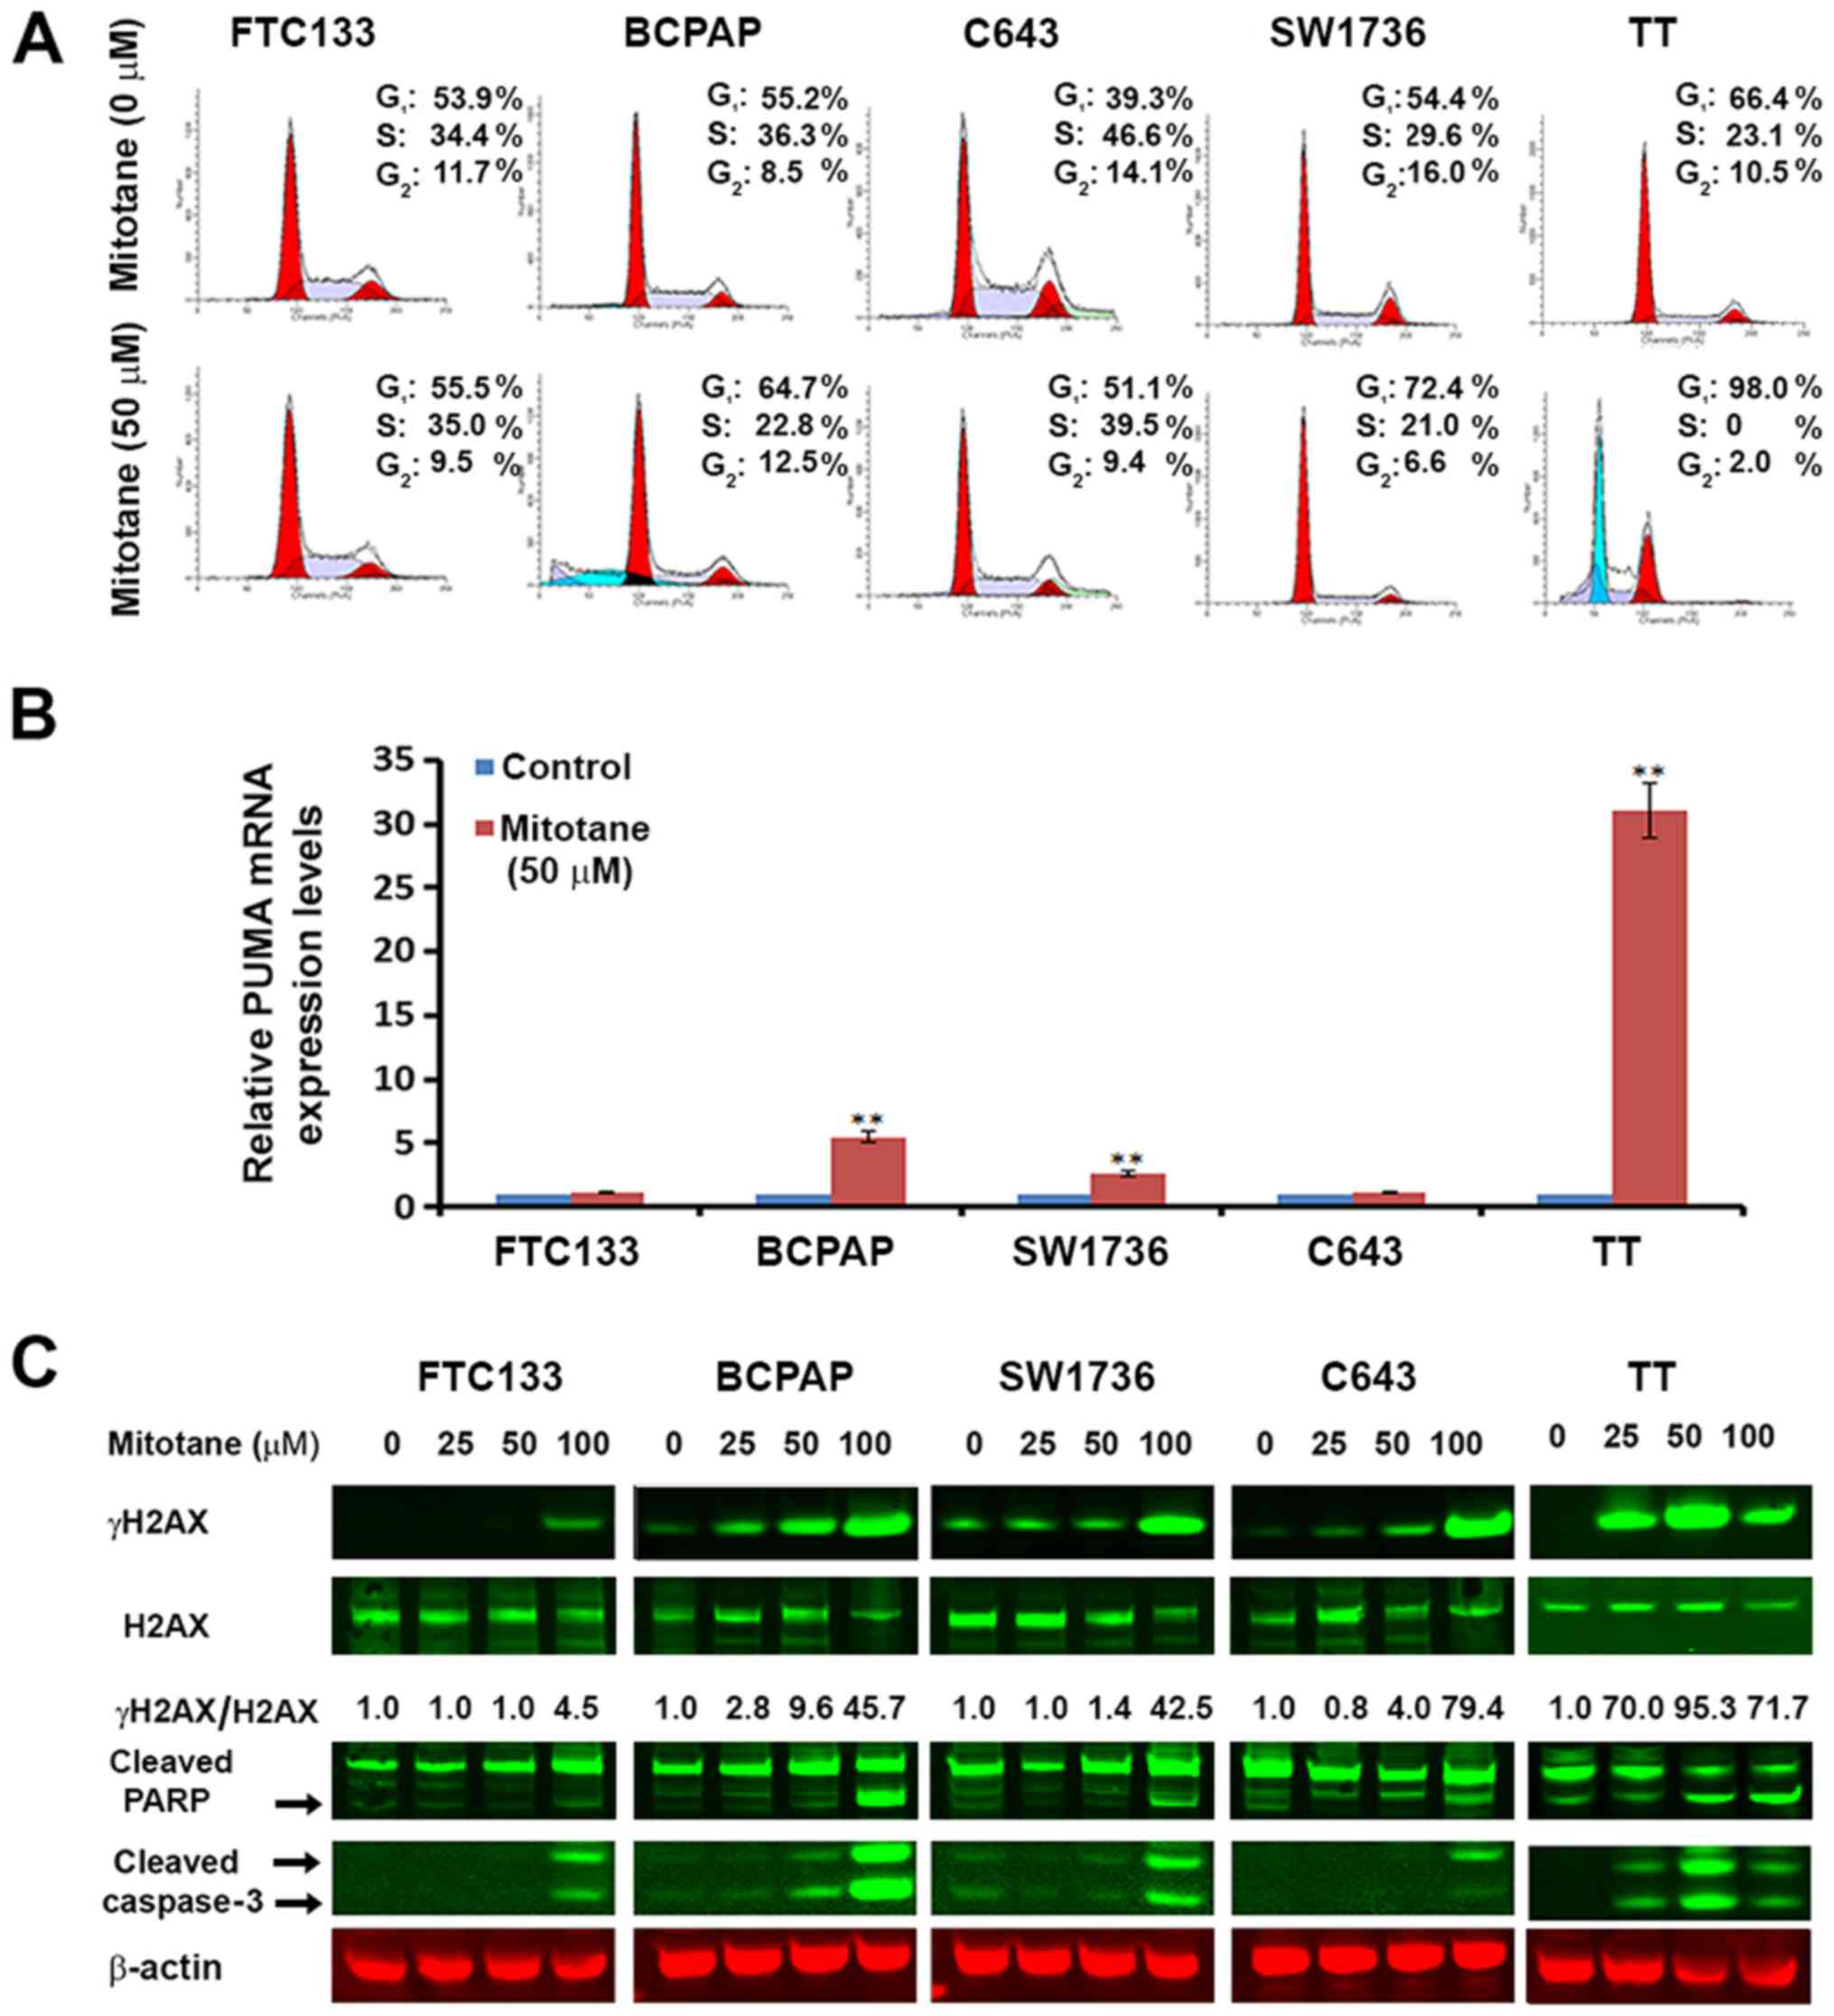 | Figure 2Mitotane induces cell cycle arrest,
apoptosis and DNA damage in thyroid cancer cell lines. (A)
Mitotane-induced thyroid cancer cell cycle arrest. FTC-133, BCPAP,
C643, SW1736 and TT cells were cultured with or without 50
μM mitotane for 24 h. The DNA content was measured by flow
cytometry to determine the cell cycle fractions. Representative
flow cytometry histograms are presented, and the fraction of cells
in each cell cycle phase is indicated. (B) Mitotane increases the
mRNA levels of the pro-apoptotic gene PUMA in thyroid cancer cells
harboring BRAF mutations (BCPAP and SW1736), and MTC-derived
proto-oncogene tyrosine-protein kinase receptor Ret-positive TT
cells. The fold-changes presented are normalized to the control
group for each cell type. **P<0.01 versus control.
The data are presented as the mean ± standard deviation. (C)
Treatment with mitotane for 24 h induces DNA damage in a
dose-dependent and cell type-specific manner as demonstrated by the
upregulation of γH2AX, detected by western blotting. Total H2AX and
γH2AX are presented with the numbers below the bands indicating the
ratio of phosphorylated to total protein, demonstrating
upregulation of γH2AX. Treatment for 24 h also induced cell death
in a dose-dependent and cell type-specific manner, as demonstrated
by the upregulation of cleaved PARP and cleaved caspase-3.
MTC-derived TT cells were the most sensitive to treatment, with
upregulation of cleaved caspase-3 following exposure to 25
μM mitotane. MTC, medullary thyroid cancer; PUMA, p53
upregulated modulator of apoptosis; H2AX, histone H2AX; γ,
phosphorylated; PARP, poly [ADP-ribose] polymerase. |
In addition, flow cytometry was used to quantify the
effects of mitotane on TC cell apoptosis (with the
sub-G1 fraction shown in Fig. 2A). For the FTC-133, C643 and SW1736
cells, 24-h treatment with 25 and 50 μM mitotane did not
lead to induction of apoptosis. Treatment of the BCPAP cells with
concentrations 25 and 50 μM resulted in the detection of
21.2 and 24.9% apoptotic cells, respectively. For the TT cells,
treatment with 25 and 50 μM of the drug also resulted in
induction of apoptosis with a detection of 48.2 and 55.4% apoptotic
cells, respectively.
Mitotane affects the expression of
cancer-associated genes in TC cells
To clarify the cellular mechanisms controlling the
response of TC cells to mitotane, we examined the expression of
genes with an established role in cancer using a commercial RT-PCR
cancer array. The tested genes are listed in Table II, along with the fold change
(upregulation or downregulation) in each of the tested TC cell
lines following 24-h treatment with 50 μM mitotane.
Treatment with mitotane was associated with cell type-specific
changes in the mRNA levels of cancer-associated genes. Only 2 of
the 84 examined genes, heme oxygenase 1 (HMOX1) and
DNA-damage-inducible transcript 3 (DDIT3), were affected by
mitotane treatment in all tested TC cells. Exposure to this drug
was associated with increased expression of HMOX1 and DDIT3,
molecules known as key mediators of cellular response to stress and
DNA damage.
| Table IIFold changes in gene expression in TC
cells treated with mitotane, as tested using the RT-PCR cancer
array.a |
Table II
Fold changes in gene expression in TC
cells treated with mitotane, as tested using the RT-PCR cancer
array.a
| No. | Gene | BCPAP | SW1736 | FTC-133 | C643 | TT |
|---|
| 1 | ACLY | −1.58 | −1.36 | −1.17 | 1.42 | 1.46 |
| 2 | ACSL4 | 1.34 | 1.27 | 1.44 | 1.51 | 1.12 |
| 3 | ADM | 1.39 | 1.29 | 1.62 | −2.35 | 1.36 |
| 4 | ANGPT1 | 1.22 | −9.49b | −1.95 | −2.48 | 2.80 |
| 5 | ANGPT2 | −1.71 | 1.93 | −3.04b | 1.01 | 2.89 |
| 6 | APAF1 | −1.84 | −3.27b | −1.25 | −1.50 | 2.08 |
| 7 | ARNT | 1.81 | −1.49 | −1.31 | 1.54 | 2.57 |
| 8 | ATP5A1 | 2.19 | 1.97 | 2.07 | 1.77 | 1.24 |
| 9 | AURKA | −1.35 | −1.18 | −2.18 | 1.37 | −19.69b |
| 10 | BCL2L11 | 2.13 | −7.08b | −2.02 | −1.06 | 3.15b |
| 11 | BIRC3 | 1.38 | −1.30 | −3.39b | 5.48b | 9.55b |
| 12 | BMI1 | 1.29 | 1.12 | 1.26 | 1.86 | 2.66 |
| 13 | CA9 | −1.22 | −56.06b | −4.02b | 1.80 | 2.44 |
| 14 | CASP2 | 1.04 | 1.07 | −1.59 | 1.23 | −1.92 |
| 15 | CASP7 | 2.71 | 1.07 | 1.52 | 1.65 | 1.33 |
| 16 | CASP9 | 2.57 | 1.60 | −1.03 | 2.65 | 1.24 |
| 17 | CCL2 | 2.90 | −59.40b | 1.82 | 1.80 | 1.53 |
| 18 | CCND2 | 12.96b | −8.70b | −2.35 | 2.01 | −2.23 |
| 19 | CCND3 | 1.50 | −1.64 | −1.95 | 1.19 | −1.63 |
| 20 | CDC20 | 1.81 | −1.42 | −1.22 | −1.13 | −2.07 |
| 21 | CDH2 | −1.87 | −2.86 | 2.07 | −1.50 | 1.04 |
| 22 | CFLAR | 1.50 | −2.49 | 1.66 | 1.52 | 2.72 |
| 23 | COX5A | 1.11 | −1.38 | 1.14 | −1.06 | −1.31 |
| 24 | CPT2 | 1.16 | −1.23 | −2.65 | 1.39 | −1.26 |
| 25 | DDB2 | −1.64 | −2.69 | −1.84 | −1.94 | 5.96b |
| 26 | DDIT3 | 8.11b | 3.08b | 3.23b | 8.86b | 26.02b |
| 27 | DKC1 | 5.02b | 1.47 | 2.32 | 1.69 | 1.73 |
| 28 | DSP | 2.11 | −2.88 | −56.57b | 2.27 | 1.24 |
| 29 | E2F4 | 1.12 | 1.32 | 1.51 | 1.61 | −1.05 |
| 30 | EPO | 2.90 | 1.47 | 1.82 | 1.80 | 2.50 |
| 31 | ERCC3 | 1.14 | 1.26 | −1.05 | 1.89 | 1.96 |
| 32 | ERCC5 | 1.89 | 1.32 | −1.03 | 4.38b | 3.93b |
| 33 | ETS2 | 1.74 | −1.09 | −1.63 | 2.14 | 1.92 |
| 34 | FASLG | 2.90 | 1.47 | 1.82 | 1.80 | −1.91 |
| 35 | FGF2 | 7.18b | 1.68 | 1.00 | 1.36 | −2.96 |
| 36 | FLT1 | 2.90 | −3.25b | 1.82 | 4.69b | −2.08 |
| 37 | FOXC2 | −1.59 | 1.47 | 1.82 | −1.70 | 9.12b |
| 38 | G6PD | 1.00 | −1.44 | −1.14 | −2.19 | 1.32 |
| 39 | GADD45G | 2.90 | 1.47 | 1.82 | 1.80 | 1.21 |
| 40 | GPD2 | −1.29 | −1.12 | −2.31 | −1.57 | 1.81 |
| 41 | GSC | 2.90 | 1.47 | 1.82 | 1.80 | 2.50 |
| 42 | HMOX1 | 7.00b | 23.76b | 10.07b | 3.42b | 21.58b |
| 43 | IGFBP3 | 1.36 | −1.12 | 1.09 | 2.24 | 1.43 |
| 44 | IGFBP5 - | 4.69b | −9.43b | −16.10b | −22.21b | 2.42 |
| 45 | IGFBP7 | 1.43 | −1.46 | 1.72 | −1.76 | 1.16 |
| 46 | KDR | −1.76 | 1.47 | −4.35b | 1.80 | −1.80 |
| 47 | KRT14 | −1.33 | 2.62 | 5.21b | 1.80 | 1.75 |
| 48 | LDHA | −1.45 | −2.45 | −1.14 | 1.13 | 1.61 |
| 49 | LIG4 | 3.33b | 1.62 | −1.96 | 1.88 | 1.48 |
| 50 | LPL | 5.24b | −4.64b | −2.21 | 1.80 | 3.76b |
| 51 | MAP2K1 | 1.28 | 1.15 | 2.39 | 3.87b | 3.36b |
| 52 | MAP2K3 | 2.59 | 2.04 | 2.14 | 2.99 | −1.33 |
| 53 | MAPK14 | −1.05 | −1.57 | −1.22 | 1.38 | 2.47 |
| 54 | MCM2 | 1.34 | 1.11 | −1.73 | 1.31 | 1.22 |
| 55 | MKI67 | −1.55 | 1.03 | −1.69 | −1.87 | 1.13 |
| 56 | NOL3 | 1.12 | −3.18b | −1.25 | 1.45 | 1.25 |
| 57 | OCLN | 1.44 | −2.48 | 4.07b | 1.74 | 2.15 |
| 58 | PFKL | −1.13 | −1.81 | 1.21 | 1.67 | 1.64 |
| 59 | PGF | 1.75 − | −1.57 | −1.04 | 1.65 | −1.83 |
| 60 | PINX1 | −1.69 | −1.85 | −18.59b | 2.04 | −2.73 |
| 61 | POLB | 1.11 | −1.93 | −1.70 | −1.01 | 1.23 |
| 62 | PPP1R15A | 5.22b | 2.48 | −1.21 | 6.14b | 45.75b |
| 63 | SERPINB2 | 7.77b | 13.44b | 1.82 | 9.34b | −1.33 |
| 64 | SERPINF1 | 7.41b | −1.03 | −1.96 | 1.80 | 1.79 |
| 65 | SKP2 | −1.61 | −1.32 | −1.41 | −1.44 | −1.18 |
| 66 | SLC2A1 | −1.84 | −2.25 | 1.85 | −1.42 | 1.50 |
| 67 | SNAI1 | 2.90 | −8.64b | −1.43 | −1.42 | 2.37 |
| 68 | SNAI2 | 1.51 | 11.87b | −12.22b | 1.26 | 1.19 |
| 69 | SNAI3 | 2.90 | −1.63 | 1.82 | 1.80 | −2.20 |
| 70 | SOD1 | 1.50 | −1.90 | −1.27 | −1.16 | 1.01 |
| 71 | SOX10 | 2.90 | 2.36 | 1.82 | 2.46 | 1.79 |
| 72 | STMN1 | −1.42 | −1.62 | 1.92 | −4.37b | −374.29b |
| 73 | TBX2 | 2.90 | −1.57 | 2.11 | 2.10 | −1.23 |
| 74 | TEK | 2.90 | 1.47 | −1.22 | 1.80 | 1.37 |
| 75 | TEP1 | 2.41 | 1.76 | 2.03 | 1.56 | 2.09 |
| 76 | TERF1 | 1.11 | −2.00 | −1.14 | 1.58 | −1.26 |
| 77 | TERF2IP | 4.01b | 1.84 | 1.60 | 3.53b | 3.21b |
| 78 | TINF2 | −1.38 | −1.03 | −1.04 | 1.38 | −1.63 |
| 79 | TNKS | 1.01 | −1.42 | −2.57 | 1.68 | 2.04 |
| 80 | TNKS2 | 1.15 | 1.09 | 1.45 | 1.86 | 4.21b |
| 81 | UQCRFS1 | 1.74 | −1.05 | −1.80 | 1.35 | 1.71 |
| 82 | VEGFC | 1.21 | 2.13 | −1.48 | 4.30b | −2.86 |
| 83 | WEE1 | −1.18 | −1.14 | −1.41 | 1.11 | 6.83b |
| 84 | XIAP | 1.05 | 2.03 | −1.47 | 1.48 | −40.74b |
Notably, mitotane significantly inhibited expression
of the X-linked inhibitor of apoptosis gene XIAP in the MTC-derived
TT cells, but not in other cell lines. Therefore, additional
experiments were performed in order to clarify the effects of
mitotane on apoptosis-associated genes. The expression of apoptotic
markers NOXA and PUMA were investigated using RT-qPCR. No
significant difference was noted in the NOXA expression in
mitotane-treated FTC-133, BCPAP, SW1736 and C643 cells, but a
4.28-fold increase was observed in the TT cells (data not shown).
Also, no significant effect was noted in the mRNA levels of PUMA in
the FTC-133 and C643 cells following exposure to mitotane, but they
were increased in the BCPAP, SW1736 and TT cells by 5.5-, 2.6- and
31.5-fold, respectively (Fig. 2B).
These data demonstrate that exposure to mitotane is associated with
changes in the mRNA level of genes regulating the cellular response
to stress, DNA damage and apoptosis.
Mitotane induces DNA damage and apoptosis
in TC cells
To confirm that mitotane-induced toxicity in TC
cells is associated with the induction of DNA damage and apoptosis,
western blot analysis was performed using antibodies against γH2AX
and cleaved caspase-3 (Fig. 2C).
Treatment with mitotane led to an increased expression of γH2AX in
a dose-dependent manner. The induction of γH2AX expression was more
prominent in BCPAP, SW1736 and TT cells than in FTC-133 and C643
cells. Exposure to this drug also resulted in the upregulation of
caspase-3 and PARP cleavage in a dose-dependent and cell
type-specific manner (Fig. 2C). In
the MTC-derived TT cells, caspase-3 cleavage was detected following
24-h exposure to 25 μM mitotane, in the B-raf-positive BCPAP
cells it was detected following treatment with a concentration of
50 μM, and the 100 μM concentration led to its
detection in all cells. Combined, these data suggest that treatment
with mitotane leads to the induction of DNA damage and apoptosis in
TC cells, particularly in cells harboring BRAF and RET
mutations.
Mitotane affects mitochondrial function
and expression of mitochondrial proteins
Mitochondria serve a critical role in the execution
of apoptotic programming, and a previous study demonstrated the
effects of mitotane on their activity (21). Therefore, the mitochondrial
membrane potential was examined in TC cells following treatment
with increasing concentrations of mitotane (0-50 μM). A
dose-dependent decrease in JC-1 fluorescence was observed,
indicative of progressive loss of mitochondrial activity. Treatment
with 30 μM of the drug was sufficient to initiate inhibition
of mitochondrial membrane potential in all examined TC cell lines
(Fig. 3A).
Additionally, the levels of mitochondrial proteins
NDUFA1 (complex 1), SDHA (complex 2), cytochrome c, COX4
(complex 4) and ATP5B (complex 5) were assessed in the TC cells by
western blot analysis. Mitotane treatment resulted in a decrease in
the levels of factors regulating oxidative respiration in a
dose-dependent and cell type-specific manner. In all examined cell
types, exposure to 50 μM mitotane led to a decrease in the
protein level of ATP5B (Fig. 3B).
The mRNA levels of ATP5B were also assessed by RT-qPCR in
mitotane-treated TC cells and untreated controls. Treatment with 50
μM mitotane for 24 h was associated with downregulated ATP5B
transcription in all TC cells. The relative mRNA levels of ATP5B in
the FTC-133, BCPAP, SW1736, C643 and TT cells decreased by 0.71-,
0.62-, 0.7-, 0.8- and 0.58-fold, respectively, compared with the
corresponding untreated controls (Fig.
3C). These data demonstrate that mitotane targets mitochondria
in TC cells, and mitochondrial membrane depolarization is a common
event following exposure to this compound.
Expression of ATP5B in human TC
specimens
Since the cytotoxic effects of mitotane included a
decrease of ATP5B expression in TC cell lines, the expression of
this protein was further investigated in human thyroid tissue
samples. Immunostaining with anti-ATP5B was performed in 100
commercially available thyroid tissue samples: 10 normal thyroid,
20 FTC, 44 PTC, 6 PDTC and 20 MTC samples. ATP5B expression was
detected in the cytoplasm of normal thyroid cells. Compared with
the detection in the normal thyroid tissue, ATP5B expression was
increased in 6/20 (30%) FTC, 29/44 (65%) PTC, 2/6 (33%) PDTC and
16/20 (80%) MTC samples. Representative immunostaining images are
displayed in Fig. 4. The pattern
of immunostaining with anti-ATP5B in PDTCs was similar to that in
FTCs (data not shown). The intensity of staining with anti-ATP5B
was significantly higher in TCs as compared to normal thyroid
(P=0.001). No significant association was observed between the
level of ATP5B immunostaining and the sex of the patients, tumor
size or presence of metastases at the time of surgery. The
intensity of anti-ATP5B staining among the FTC, PTC and PDTC
samples was not significantly different, but was higher in MTC
samples compared with those from FTC tissue (P=0.01).
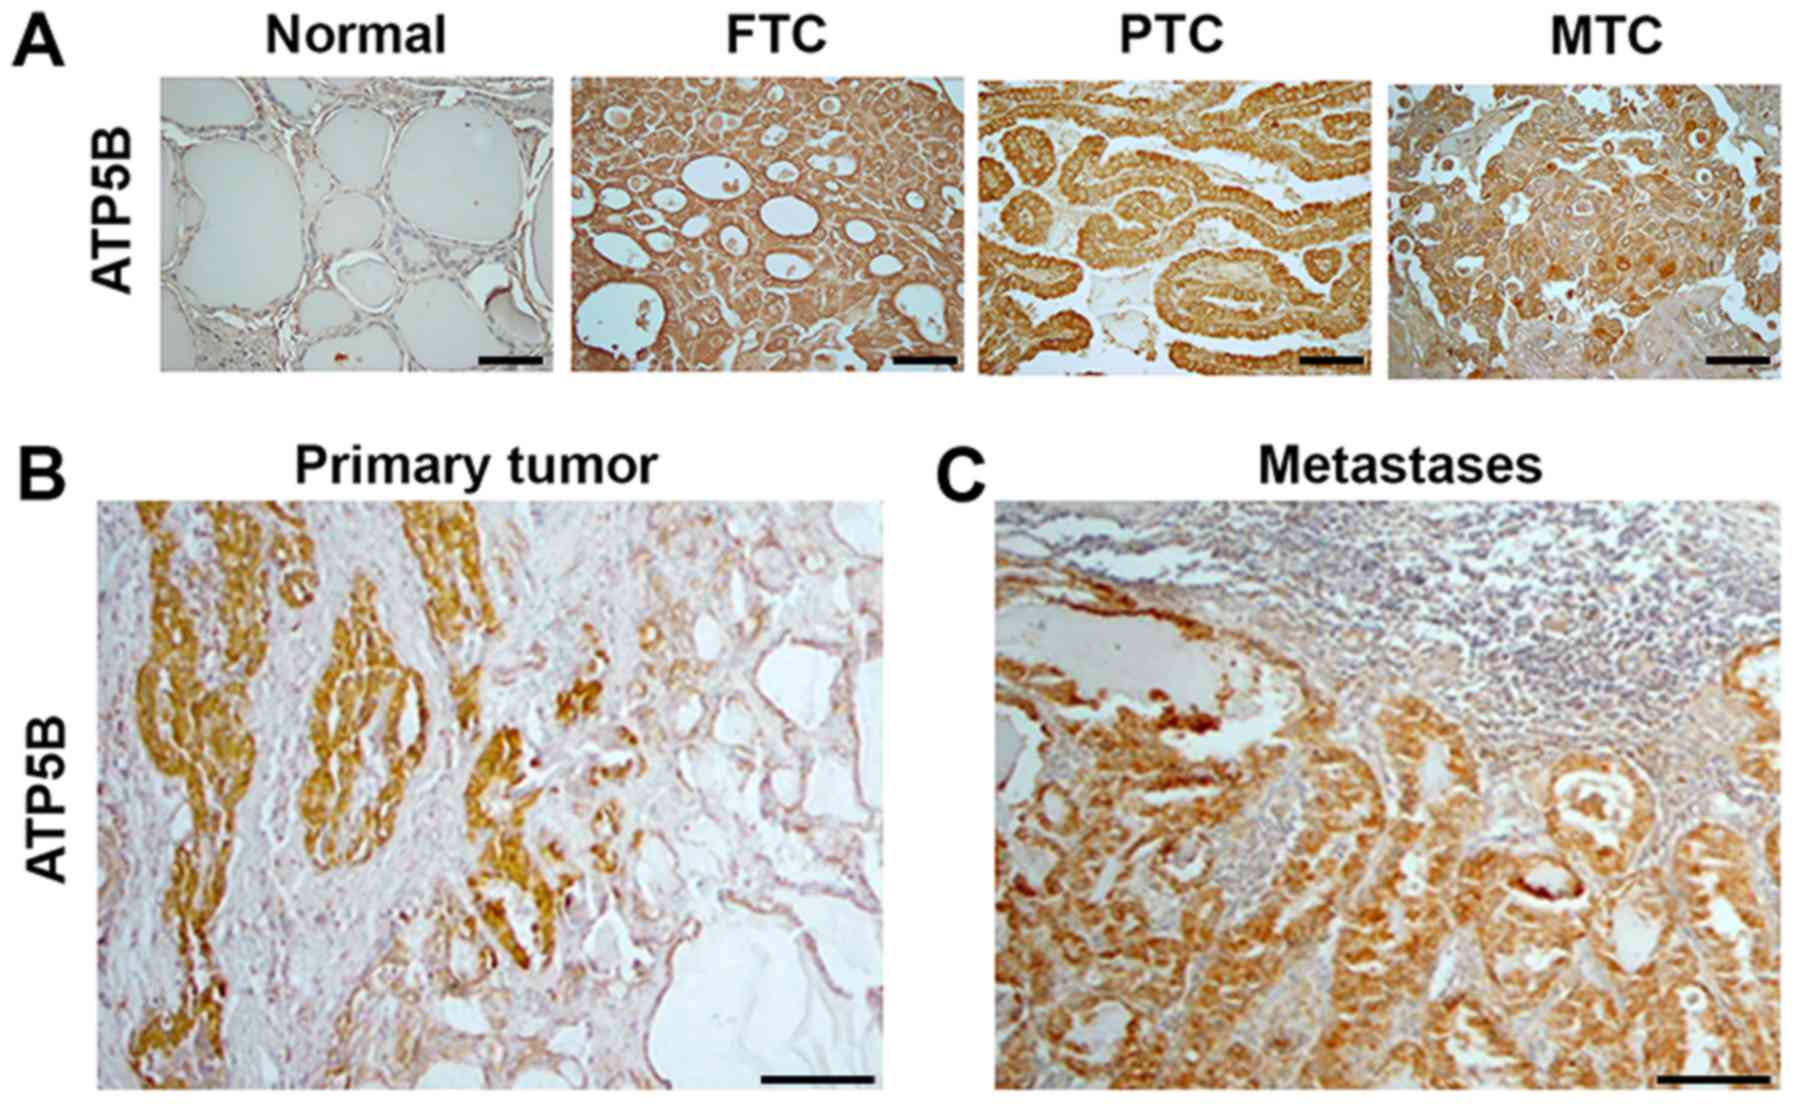 | Figure 4ATP5B expression in human thyroid
tissue samples. Immunostaining with anti-ATP5B indicating (A)
minimal expression of ATP5B in normal tissue samples, compared with
the strong, homogeneous cytoplasmic expression in FTC, PTC and MTC
samples (magnification, ×400; scale bars, 100 μm), (B)
expression of ATP5B in primary PTC, and (C) expression of ATP5B in
corresponding lymph node metastasis tissue (magnification, ×100;
scale bars, 100 μm). ATP5B, ATP synthase subunit β; FTC,
follicular thyroid cancer; PTC, papillary thyroid cancer; MTC,
medullary thyroid cancer. |
Furthermore, ATP5B mRNA levels were determined in 16
thyroid tumor samples (12 PTC, 3 FTC and 1 MTC) and in
corresponding normal thyroid tissue from each patient. No
significant difference was observed between the ATP5B expression in
the tumor samples and that in the corresponding normal thyroid
tissue. Analysis of ATP5B mRNA in cases of lymph node metastases (5
cases) demonstrated that, in the metastatic tissue, the mRNA levels
of ATP5B were similar to those detected in the corresponding
primary tumors.
Notably, the results of immunostaining with
anti-ATP5B in tumors and in adjacent normal thyroid were not in
agreement with the RT-qPCR data. The ATP5B protein levels were
higher in 5/12 PTC, 1/3 FTC and in the MTC sample when compared
with the corresponding normal thyroid tissue. As demonstrated in
Fig. 4B, prominent ATP5B
immunostaining was detected in cancer cells, but not in adjacent to
the tumor normal thyroid. Positive staining with anti-ATP5B was
also found in metastatic lesions and intensity of staining was
similar those observed in corresponding primary tumors (Fig. 4C).
UCSC Xena was used to explore functional genomic
data sets for links between ATP5B expression and clinical
prognosis. This analysis revealed no significant associations
between the ATP5B mRNA levels in TC and survival probability (data
not shown).
Discussion
Repositioning of already established, effective
medications for the treatment of cancer represents a feasible way
to accelerate the translation of experimental findings into
clinical practice. In the current study, mitotane was examined as a
new therapeutic agent against TC. To the best of our knowledge,
this is the first study reporting the effects of mitotane on TC
cells. The present results demonstrated that mitotane is toxic for
these cells. It was revealed that mitotane-induced toxicity
implicates multiple mechanisms, including induction of ER stress,
inhibition of the mitochondrial membrane potential, DNA damage and
apoptosis. The study also provided evidence that a molecular target
for mitotane, mitochondrial ATP5B, is upregulated in human types of
TC.
Repositioning of medications requires that the drug
is effective for its new purpose within its already established
therapeutic range, which for mitotane is 14-20 μg/ml
(19,24). Several studies have reported that
the effectiveness of mitotane treatment is linked to the serum
concentration of the medication, with concentrations ≥14
μg/ml being favorably associated with patient survival and
response to treatment (25-27).
Pharmacokinetic studies have demonstrated that the therapeutic
range of 14-20 μg/ml (corresponding to 40-60 μM) is
achieved in only 50% of patients with ACC, and for that reason
several specialists now use a therapeutic window of 10-30
μg/ml, as this represents the only predictive marker of
antitumor response to date (28).
In the present study, the proliferation and cell
viability experiments demonstrated that mitotane is toxic to TC
cells. These findings are consistent with previous reports
demonstrating that mitotane could be toxic for ACC cells (22,29),
as well as for breast, lung and colon cancer cell lines (30). In the TC cell lines used herein,
low doses of mitotane triggered ER stress, and increasing
concentrations led to the induction of DNA damage and apoptosis.
These findings are in accordance with previously reported data
demonstrating that accumulation of unfolded proteins within the ER
results in the release of calcium, which in turn triggers the
initiation of apoptosis (31). A
previous study revealed that mitotane induced ER stress through
sterol-O-acyltransferase 1/mitochondrial acetyl-CoA
acetyltransferase inhibition, which in turn led to apoptosis
(32). Notably, microscopic
evidence of toxicity following mitotane exposure has been reported
in neoplastic adrenal cells (cytoplasmic vacuoles, cell shrinking
and partial cell detachment), similar to the results presented in
the current study (33).
Growing evidence suggests that the effects of
mitotane are closely associated with mitochondria. It has been
reported that mitotane induces a mitochondrial respiratory chain
defect by inhibiting COX2 and COX4I1 (21). Treatment with mitotane also altered
expression of mitochondria-associated membrane proteins, including
ATPase family AAA domain-containing protein 3A and translocator
protein/peripheral-type benzodiazepine receptor (34). It has been suggested that reactive
oxygen species (ROS) can act as messengers among mitochondria,
leading to mitochondrial membrane depolarization and further ROS
release, eventually causing global depolarization if the stressor
is not removed (35).
The present study revealed that the initial event
following treatment with mitotane was inhibition of the
mitochondrial membrane potential. Mitochondrial membrane
depolarization was observed at a concentration of 30 μM,
which is well below the current therapeutic range for ACC (50
μM), suggesting that mitotane may be effective for TC at
therapeutically achievable concentrations. The western blotting and
immunohistochemistry data demonstrated that the mitochondrial
respiratory chain enzymes are targets of mitotane. Mitochondrial
localization following mitotane exposure was altered in TC cells,
as demonstrated by JC-1 staining, corroborating findings from ACC
cells. Mitotane-treated ACC cells exhibit a more punctiform pattern
in the mitochondrial compartment, possibly resulting from
disequilibrium between mitochondrial fission and fusion (21,36).
One intriguing finding of the current study is the
differential response of various TC cell lines to mitotane
treatment. BCPAP, SW1736 and TT cells were the most sensitive to
the drug. These TC cell lines are characterized by constitutive
activation of the MAPK/ERK signaling pathway as result of BRAF
(BCPAP and SW1736 cells) or RET (TT cells) mutations. One of the
main questions that should be addressed by future studies is
whether the mutational status in TC serves a significant role in
the response to mitotane. It will also be important to determine
whether mitochondria-enriched TC cells, such as those in Hürthle
cell thyroid carcinomas, would be sensitive to treatment with this
compound.
Since the present in vitro data suggested
that mitochondrial proteins could be molecular targets for
mitotane, ATP5B expression in human TC tissue samples was examined.
This revealed that ATP5B expression was increased in cancer versus
normal thyroid tissue, particularly in MTC tissue samples. This
finding may provide an alternate explanation as to why TC cells
derived from MTC (TT cells) were the most sensitive to the effects
of mitotane in the present in vitro experiments. These
results suggest that this drug could be effective in targeting
aggressive types of TC.
Despite the documented effectiveness in the
management of ACC, the tolerability of the medication is limited by
its side-effect profile. The most common side effects are
gastrointestinal, including nausea, vomiting, diarrhea and
anorexia, occurring in as many as 78% of treated patients (37). Other side effects include
endocrinological (secondary adrenal insufficiency and thyroid
dysfunction), neurological (confusion, ataxia and tremors) and
metabolic (hypercholesterolemia, hyperbilirubinemia and rash)
issues (38,39). Certainly, the adrenolytic effects
of mitotane and the enhanced production of cortisol-binding
globulin would lead to hypocortisolism, which would be the most
clinically significant side effect.
The majority of studies on mitotane have been
performed on cell lines that are derived from ACC, such as
NCI-H295, H295R or Fang-8 cells, or cells that are derived from
metastasis to the adrenals, for example SW-13 cells. However,
canine primary adrenal cell cultures have been used to demonstrate
loss of steroidogenesis and cell death in response to mitotane,
among other toxins (40). Limited
studies have also been performed on thyroid function, revealing
that mitotane can cause central hypothyroidism by inhibiting
thyrotrophic cell viability, and thyroid-stimulating hormone
expression and secretion (41,42).
Despite the fact that mitotane has a significant
side-effect profile as discussed above, it is important to mention
that, from the clinical standpoint, it is manageable. Adrenal
insufficiency is probably the most significant side effect, and it
is well established that it can be treated with supraphysiological
replacement with hydrocortisone, as cytochrome P450 3A4 induction
by mitotane results in rapid inactivation of >50% of
administered hydrocortisone (43).
TC cells lines that were used in the current study
may represent useful models for undifferentiated types of cancer
(44). Previous studies have
demonstrated that these cell lines derived from differentiated and
undifferentiated tumor types have evolved similar phenotypes in
vitro, with gene expression profiles that are closest to in
vivo undifferentiated tumors (44,45).
There are limited treatment options for the
management of patients with ATC (8,9).
Many studies have used a variety of chemotherapeutic agents for the
treatment of patients with this condition (46). The majority, however, concluded
that chemotherapy did not improve survival (46,47).
Patients with ATC have extremely short survival times, and for many
of them, only palliative care can be offered to manage symptoms of
pain, bleeding, nausea, dyspnea and depression.
Although the present results should be considered in
the context of a benefit/harm discussion of treatment options
between the physician and patient, it is our opinion that patients
with aggressive medullary, poorly differentiated and anaplastic
types of TC may benefit from the administration of mitotane, while
exhibiting a significant, but manageable, side effect profile.
The current study is the first to demonstrate the
in vitro activity of mitotane against aggressive TC.
However, one limiting factor is the lack of an animal model that
would provide valuable information more closely resembling the
human macroenvironment. In that regard, in vivo experiments
in a xenograft TC animal model that will better elucidate the
cytotoxic effects of mitotane are being designed. Furthermore, a
more direct evaluation of the functional mitochondrial activity in
TC cells will be performed, since the current study has established
that mitotane affects the expression of several mitochondrial
proteins. The results of whether treatment with mitotane is more
effective in cells relying more heavily on oxidative
phosphorylation will be presented in a separate manuscript.
In summary, the present findings provide evidence
that mitotane inhibits proliferation, promotes apoptosis and
induces DNA damage in TC cells. This drug also induces ER stress
and inhibits expression of mitochondrial membrane enzymes, most
notably ATP5B. On the basis of these findings, we propose that
mitotane, an FDA-approved medication for ACC, may be used against
aggressive TC and warrants further clinical studies.
Funding
This study was supported by the International
Endocrine Research Fellowship Program, MedStar Health Research
Institute and MedStar Washington Hospital Center.
Availability of data and materials
The datasets used and/or analyzed during the current
study are available from the corresponding author on reasonable
request.
Authors' contributions
AB and KJ acquired the data and drafted the
manuscript. AB, AP, JC, VH, and VV collected tissue samples and
performed the in vitro experiments. KJ, GK, and KB analyzed
and interpreted the data, and performed statistical analysis. VV,
KJ, KB and LW reviewed the manuscript, figures and tables. All
authors read and approved the final manuscript.
Ethics approval and consent to
participate
This study was approved by the Institutional Review
Board and the Human Use Committee of the Uniformed Services
University of the Health Sciences (approval no. FG86GI-S14).
Patient consent for publication
Not applicable.
Competing interests
The authors declare that they have no competing
interests.
Acknowledgments
The views expressed in this article are those of the
authors and do not reflect the official policy or position of the
US Air Force, the Department of Defense or the US government. Title
17 U.S.C. 105 provides that 'copyright protection under this title
is not available for any work of the United States Government'.
Title 17 U.S.C. 101 defines a United States government work as 'a
work prepared by a military service member or employee of the
United States government as part of that person's official duties'.
This work was prepared as part of the official duties of KJ, VV, JC
and AP.
References
|
1
|
Ferlay J, Soerjomataram I, Dikshit R, Eser
S, Mathers C, Rebelo M, Parkin DM, Forman D and Bray F: Cancer
incidence and mortality worldwide: Sources methods and major
patterns in GLOBOCAN 2012. Int J Cancer. 136:E359–E386. 2015.
View Article : Google Scholar
|
|
2
|
Ahn HS, Kim HJ and Welch HG: Korea's
thyroid-cancer 'epidemic' - screening and overdiagnosis. N Engl J
Med. 371:1765–1767. 2014. View Article : Google Scholar : PubMed/NCBI
|
|
3
|
Chen AY, Jemal A and Ward EM: Increasing
incidence of differentiated thyroid cancer in the United States,
1988-2005. Cancer. 115:3801–3807. 2009. View Article : Google Scholar : PubMed/NCBI
|
|
4
|
Schlumberger MJ: Papillary and follicular
thyroid carcinoma. N Engl J Med. 338:297–306. 1998. View Article : Google Scholar : PubMed/NCBI
|
|
5
|
Sherman SI: Thyroid carcinoma. Lancet.
361:501–511. 2003. View Article : Google Scholar : PubMed/NCBI
|
|
6
|
Muresan MM, Olivier P, Leclère J, Sirveaux
F, Brunaud L, Klein M, Zarnegar R and Weryha G: Bone metastases
from differentiated thyroid carcinoma. Endocr Relat Cancer.
15:37–49. 2008. View Article : Google Scholar : PubMed/NCBI
|
|
7
|
Tubiana M, Schlumberger M, Rougier P,
Laplanche A, Benhamou E, Gardet P, Caillou B, Travagli JP and
Parmentier C: Long-term results and prognostic factors in patients
with differentiated thyroid carcinoma. Cancer. 55:794–804. 1985.
View Article : Google Scholar : PubMed/NCBI
|
|
8
|
Smallridge RC and Copland JA: Anaplastic
thyroid carcinoma: Pathogenesis and emerging therapies. Clin Oncol
(R Coll Radiol). 22:486–497. 2010. View Article : Google Scholar
|
|
9
|
Smallridge RC, Ain KB, Asa SL, Bible KC,
Brierley JD, Burman KD, Kebebew E, Lee NY, Nikiforov YE, Rosenthal
MS, et al American Thyroid Association Anaplastic Thyroid Cancer
Guidelines Taskforce: American Thyroid Association guidelines for
management of patients with anaplastic thyroid cancer. Thyroid.
22:1104–1139. 2012. View Article : Google Scholar : PubMed/NCBI
|
|
10
|
Nosé V: Familial thyroid cancer: A review.
Mod Pathol. 24(Suppl 2): S19–S33. 2011. View Article : Google Scholar : PubMed/NCBI
|
|
11
|
Williams SD, Birch R and Einhorn LH: Phase
II evaluation of doxorubicin plus cisplatin in advanced thyroid
cancer: A Southeastern Cancer Study Group Trial. Cancer Treat Rep.
70:405–407. 1986.PubMed/NCBI
|
|
12
|
Bikas A, Vachhani S, Jensen K, Vasko V and
Burman KD: Targeted therapies in thyroid cancer: An extensive
review of the literature. Expert Rev Clin Pharmacol. 9:1299–1313.
2016. View Article : Google Scholar : PubMed/NCBI
|
|
13
|
Kushchayeva Y, Jensen K, Burman KD and
Vasko V: Repositioning therapy for thyroid cancer: New insights on
established medications. Endocr Relat Cancer. 21:R183–R194. 2014.
View Article : Google Scholar : PubMed/NCBI
|
|
14
|
Jensen K, Bikas A, Patel A, Kushchayeva Y,
Costello J, McDaniel D, Burman K and Vasko V: Nelfinavir inhibits
proliferation and induces DNA damage in thyroid cancer cells.
Endocr Relat Cancer. 24:147–156. 2017. View Article : Google Scholar : PubMed/NCBI
|
|
15
|
Kushchayeva Y, Jensen K, Recupero A,
Costello J, Patel A, Klubo-Gwiezdzinska J, Boyle L, Burman K and
Vasko V: The HIV protease inhibitor nelfinavir down-regulates RET
signaling and induces apoptosis in medullary thyroid cancer cells.
J Clin Endocrinol Metab. 99:E734–E745. 2014. View Article : Google Scholar : PubMed/NCBI
|
|
16
|
Klubo-Gwiezdzinska J, Jensen K, Costello
J, Patel A, Hoperia V, Bauer A, Burman KD, Wartofsky L and Vasko V:
Metformin inhibits growth and decreases resistance to anoikis in
medullary thyroid cancer cells. Endocr Relat Cancer. 19:447–456.
2012. View Article : Google Scholar : PubMed/NCBI
|
|
17
|
Thakur S, Daley B, Gaskins K, Vasko VV,
Boufraqech M, Patel D, Sourbier C, Reece J, Cheng SY, Kebebew E, et
al: Metformin targets mitochondrial glycerophosphate dehydrogenase
to control rate of oxidative phosphorylation and growth of thyroid
cancer in vitro and in vivo. Clin Cancer Res. 24:4030–4043. 2018.
View Article : Google Scholar : PubMed/NCBI
|
|
18
|
Baudry C, Coste J, Bou Khalil R, Silvera
S, Guignat L, Guibourdenche J, Abbas H, Legmann P, Bertagna X and
Bertherat J: Efficiency and tolerance of mitotane in Cushing's
disease in 76 patients from a single center. Eur J Endocrinol.
167:473–481. 2012. View Article : Google Scholar : PubMed/NCBI
|
|
19
|
Berruti A, Baudin E, Gelderblom H, Haak
HR, Porpiglia F and Fassnacht M; Adrenal cancer: ESMO Clinical
Practice Guidelines for diagnosis, treatment and follow-up. Ann
Oncol. 23(Suppl 7): vii131–vii138. 2012. View Article : Google Scholar
|
|
20
|
Henley DJ, van Heerden JA, Grant CS,
Carney JA and Carpenter PC: Adrenal cortical carcinoma - a
continuing challenge. Surgery. 94:926–931. 1983.PubMed/NCBI
|
|
21
|
Hescot S, Slama A, Lombès A, Paci A, Remy
H, Leboulleux S, Chadarevian R, Trabado S, Amazit L, Young J, et
al: Mitotane alters mitochondrial respiratory chain activity by
inducing cytochrome c oxidase defect in human adrenocortical cells.
Endocr Relat Cancer. 20:371–381. 2013. View Article : Google Scholar : PubMed/NCBI
|
|
22
|
Poli G, Guasti D, Rapizzi E, Fucci R, Canu
L, Bandini A, Cini N, Bani D, Mannelli M and Luconi M:
Morphofunctional effects of mitotane on mitochondria in human
adrenocortical cancer cells. Endocr Relat Cancer. 20:537–550. 2013.
View Article : Google Scholar : PubMed/NCBI
|
|
23
|
Livak KJ and Schmittgen TD: Analysis of
relative gene expression data using real-time quantitative PCR and
the 2(-Delta Delta C(T)) Method. Methods. 25:402–408. 2001.
View Article : Google Scholar
|
|
24
|
Schteingart DE, Doherty GM, Gauger PG,
Giordano TJ, Hammer GD, Korobkin M and Worden FP: Management of
patients with adrenal cancer: Recommendations of an international
consensus conference. Endocr Relat Cancer. 12:667–680. 2005.
View Article : Google Scholar : PubMed/NCBI
|
|
25
|
Haak HR, Hermans J, van de Velde CJ,
Lentjes EG, Goslings BM, Fleuren GJ and Krans HM: Optimal treatment
of adrenocortical carcinoma with mitotane: Results in a consecutive
series of 96 patients. Br J Cancer. 69:947–951. 1994. View Article : Google Scholar : PubMed/NCBI
|
|
26
|
Hermsen IG, Fassnacht M, Terzolo M,
Houterman S, den Hartigh J, Leboulleux S, Daffara F, Berruti A,
Chadarevian R, Schlumberger M, et al: Plasma concentrations of o,
p'DDD, o, p'DDA, and o, p'DDE as predictors of tumor response to
mitotane in adrenocortical carcinoma: Results of a retrospective
ENS@T multicenter study. J Clin Endocrinol Metab. 96:1844–1851.
2011. View Article : Google Scholar : PubMed/NCBI
|
|
27
|
van Slooten H, Moolenaar AJ, van Seters AP
and Smeenk D: The treatment of adrenocortical carcinoma with o,
p'-DDD: Prognostic implications of serum level monitoring. Eur J
Cancer Clin Oncol. 20:47–53. 1984. View Article : Google Scholar : PubMed/NCBI
|
|
28
|
Baudin E; Endocrine Tumor Board of Gustave
Roussy: Adrenocortical carcinoma. Endocrinol Metab Clin North Am.
44:411–434. 2015. View Article : Google Scholar : PubMed/NCBI
|
|
29
|
Lehmann TP, Wrzesiński T and Jagodziński
PP: The effect of mitotane on viability, steroidogenesis and gene
expression in NCI-H295R adrenocortical cells. Mol Med Rep.
7:893–900. 2013. View Article : Google Scholar
|
|
30
|
Waszut U, Szyszka P and Dworakowska D:
Understanding mitotane mode of action. J Physiol Pharmacol.
68:13–26. 2017.PubMed/NCBI
|
|
31
|
Pinton P, Giorgi C, Siviero R, Zecchini E
and Rizzuto R: Calcium and apoptosis: ER-mitochondria Ca2+ transfer
in the control of apoptosis. Oncogene. 27:6407–6418. 2008.
View Article : Google Scholar : PubMed/NCBI
|
|
32
|
Sbiera S, Leich E, Liebisch G, Sbiera I,
Schirbel A, Wiemer L, Matysik S, Eckhardt C, Gardill F, Gehl A, et
al: Mitotane inhibits sterol-O-acyl transferase 1 triggering
lipid-mediated endoplasmic reticulum stress and apoptosis in
adrenocortical carcinoma cells. Endocrinology. 156:3895–3908. 2015.
View Article : Google Scholar : PubMed/NCBI
|
|
33
|
Fang VS: Cytotoxic activity of
1-(o-chlorophenyl)-1-(p-chlorophenyl)-2,2-dichloroethane (mitotane)
and its analogs on feminizing adrenal neoplastic cells in culture.
Cancer Res. 39:139–145. 1979.PubMed/NCBI
|
|
34
|
Hescot S, Amazit L, Lhomme M, Travers S,
DuBow A, Battini S, Boulate G, Namer IJ, Lombes A, Kontush A, et
al: Identifying mitotane-induced mitochondria-associated membranes
dysfunctions: Metabolomic and lipidomic approaches. Oncotarget.
8:109924–109940. 2017. View Article : Google Scholar
|
|
35
|
Whelan SP and Zuckerbraun BS:
Mitochondrial signaling: Forwards, backwards, and in between. Oxid
Med Cell Longev. 2013:3516132013. View Article : Google Scholar : PubMed/NCBI
|
|
36
|
Chen H and Chan DC: Physiological
functions of mitochondrial fusion. Ann N Y Acad Sci. 1201:21–25.
2010. View Article : Google Scholar : PubMed/NCBI
|
|
37
|
Hutter AM Jr and Kayhoe DE: Adrenal
cortical carcinoma. Clinical features of 138 patients. Am J Med.
41:572–580. 1966. View Article : Google Scholar : PubMed/NCBI
|
|
38
|
Veytsman I, Nieman L and Fojo T:
Management of endocrine manifestations and the use of mitotane as a
chemotherapeutic agent for adrenocortical carcinoma. J Clin Oncol.
27:4619–4629. 2009. View Article : Google Scholar : PubMed/NCBI
|
|
39
|
Creemers SG, Hofland LJ, Korpershoek E,
Franssen GJ, van Kemenade FJ, de Herder WW and Feelders RA: Future
directions in the diagnosis and medical treatment of adrenocortical
carcinoma. Endocr Relat Cancer. 23:R43–R69. 2016. View Article : Google Scholar
|
|
40
|
Morishita K, Okumura H, Ito N and
Takahashi N: Primary culture system of adrenocortical cells from
dogs to evaluate direct effects of chemicals on steroidogenesis.
Toxicology. 165:171–178. 2001. View Article : Google Scholar : PubMed/NCBI
|
|
41
|
Zatelli MC, Gentilin E, Daffara F,
Tagliati F, Reimondo G, Carandina G, Ambrosio MR, Terzolo M and
Degli Uberti EC: Therapeutic concentrations of mitotane (o, p'-DDD)
inhibit thyrotroph cell viability and TSH expression and secretion
in a mouse cell line model. Endocrinology. 151:2453–2461. 2010.
View Article : Google Scholar : PubMed/NCBI
|
|
42
|
Russo M, Scollo C, Pellegriti G, Cotta OR,
Squatrito S, Frasca F, Cannavò S and Gullo D: Mitotane treatment in
patients with adrenocortical cancer causes central hypothyroidism.
Clin Endocrinol (Oxf). 84:614–619. 2016. View Article : Google Scholar
|
|
43
|
Chortis V, Taylor AE, Schneider P,
Tomlinson JW, Hughes BA, O'Neil DM, Libé R, Allolio B, Bertagna X,
Bertherat J, et al: Mitotane therapy in adrenocortical cancer
induces CYP3A4 and inhibits 5α-reductase, explaining the need for
personalized glucocorticoid and androgen replacement. J Clin
Endocrinol Metab. 98:161–171. 2013. View Article : Google Scholar
|
|
44
|
van Staveren WC, Solís DW, Delys L, Duprez
L, Andry G, Franc B, Thomas G, Libert F, Dumont JE, Detours V, et
al: Human thyroid tumor cell lines derived from different tumor
types present a common dedifferentiated phenotype. Cancer Res.
67:8113–8120. 2007. View Article : Google Scholar : PubMed/NCBI
|
|
45
|
Saiselet M, Floor S, Tarabichi M, Dom G,
Hébrant A, van Staveren WC and Maenhaut C: Thyroid cancer cell
lines: An overview. Front Endocrinol (Lausanne). 3:1332012.
View Article : Google Scholar
|
|
46
|
Salehian B, Liem SY, Mojazi Amiri H and
Maghami E: Clinical Trials in Management of Anaplastic Thyroid
Carcinoma; Progressions and Set Backs: A Systematic Review. Int J
Endocrinol Metab. 17:e677592019.PubMed/NCBI
|
|
47
|
Sosa JA, Elisei R, Jarzab B, Balkissoon J,
Lu SP, Bal C, Marur S, Gramza A, Yosef RB, Gitlitz B, et al:
Randomized safety and efficacy study of fosbretabulin with
paclitaxel/carboplatin against anaplastic thyroid carcinoma.
Thyroid. 24:232–240. 2014. View Article : Google Scholar
|