Introduction
In recent years, a large amount of epidemiological
data has indicated that colorectal cancer (CRC) remains a common
and lethal cancer (1-2345);
adenocarcinomas are a common type of CRC. At present, surgery
remains the primary procedure for treating patients with CRC, as
novel effective treatments have not yet been developed.
Additionally, the recurrence rates following surgery in patients
with CRC of stages I-III has been increasing (6). This may be overcome by the
development of primary and secondary preventative strategies for
CRC (7,8). As such, determining early CRC in
high-risk populations and identifying targets to inhibit early CRC
development are valid approaches. The occurrence and development of
CRC are correlated with genetic mutations (9,10).
Identifying specific gene mutations and alterations in expression
in tumor tissues have been the main focus of cancer research, and
have led to developments in immunotherapy (11-13).
Previous studies of CRC have mainly involved genomic and
transcriptomics analyses (14-1516).
It is widely documented that proteins are key factors in biological
processes; whether gene mutations can alter the expression of
proteins is largely unknown. Therefore, a direct comparison of
proteomic differences between tumor and normal tissues may provide
insight into the development of CRC.
The Cancer Genome Atlas (TCGA) (17) contains extensive data regarding
tumor genomes. In addition, the Human Protein Atlas (HPA) provides
information regarding tissues, cells and pathology (18-1920).
TCGA and HPA are open-access, and have made considerable
contributions to advances in tumor research. Weighted correlation
network analysis (WGCNA) involves the separation of genes with the
same expression pattern into the same module (21); thus, different modules represent
sets of differentially expression pattern genes. Furthermore, these
various modules could be associated with certain features of the
data, and those linked to these characteristics of interest can be
filtered out.
In the present study, stage II CRC was selected to
represent early stage CRC. To identify potential targets of early
CRC, TCGA-colon adenocarcinoma (COAD) stage II data were combined
with the proteomic data of tumor and adjacent tissues from 21
patients with CRC for analysis.
Materials and methods
Clinical data of patients with stage II CRC. A total
of 21 pairs (13 males and 8 females; age ± SD, 60.90±8.26 years) of
malignant tissues and adjacent benign or normal tissues from
patients diagnosed with stage II CRC were obtained from The Tumor
Tissue Bank at the Third Hospital of Jilin University between
November 2015 and June 2016. All patients without hepatitis,
tuberculosis and HIV did not receive radiotherapy or chemotherapy
prior to surgery. Patients provided informed consent before
surgery. The present study was approved by the Clinical Research
Ethics Committee of the Second Hospital of Jilin University. The
experimental scheme applied in the present study is presented in
Fig. 1.
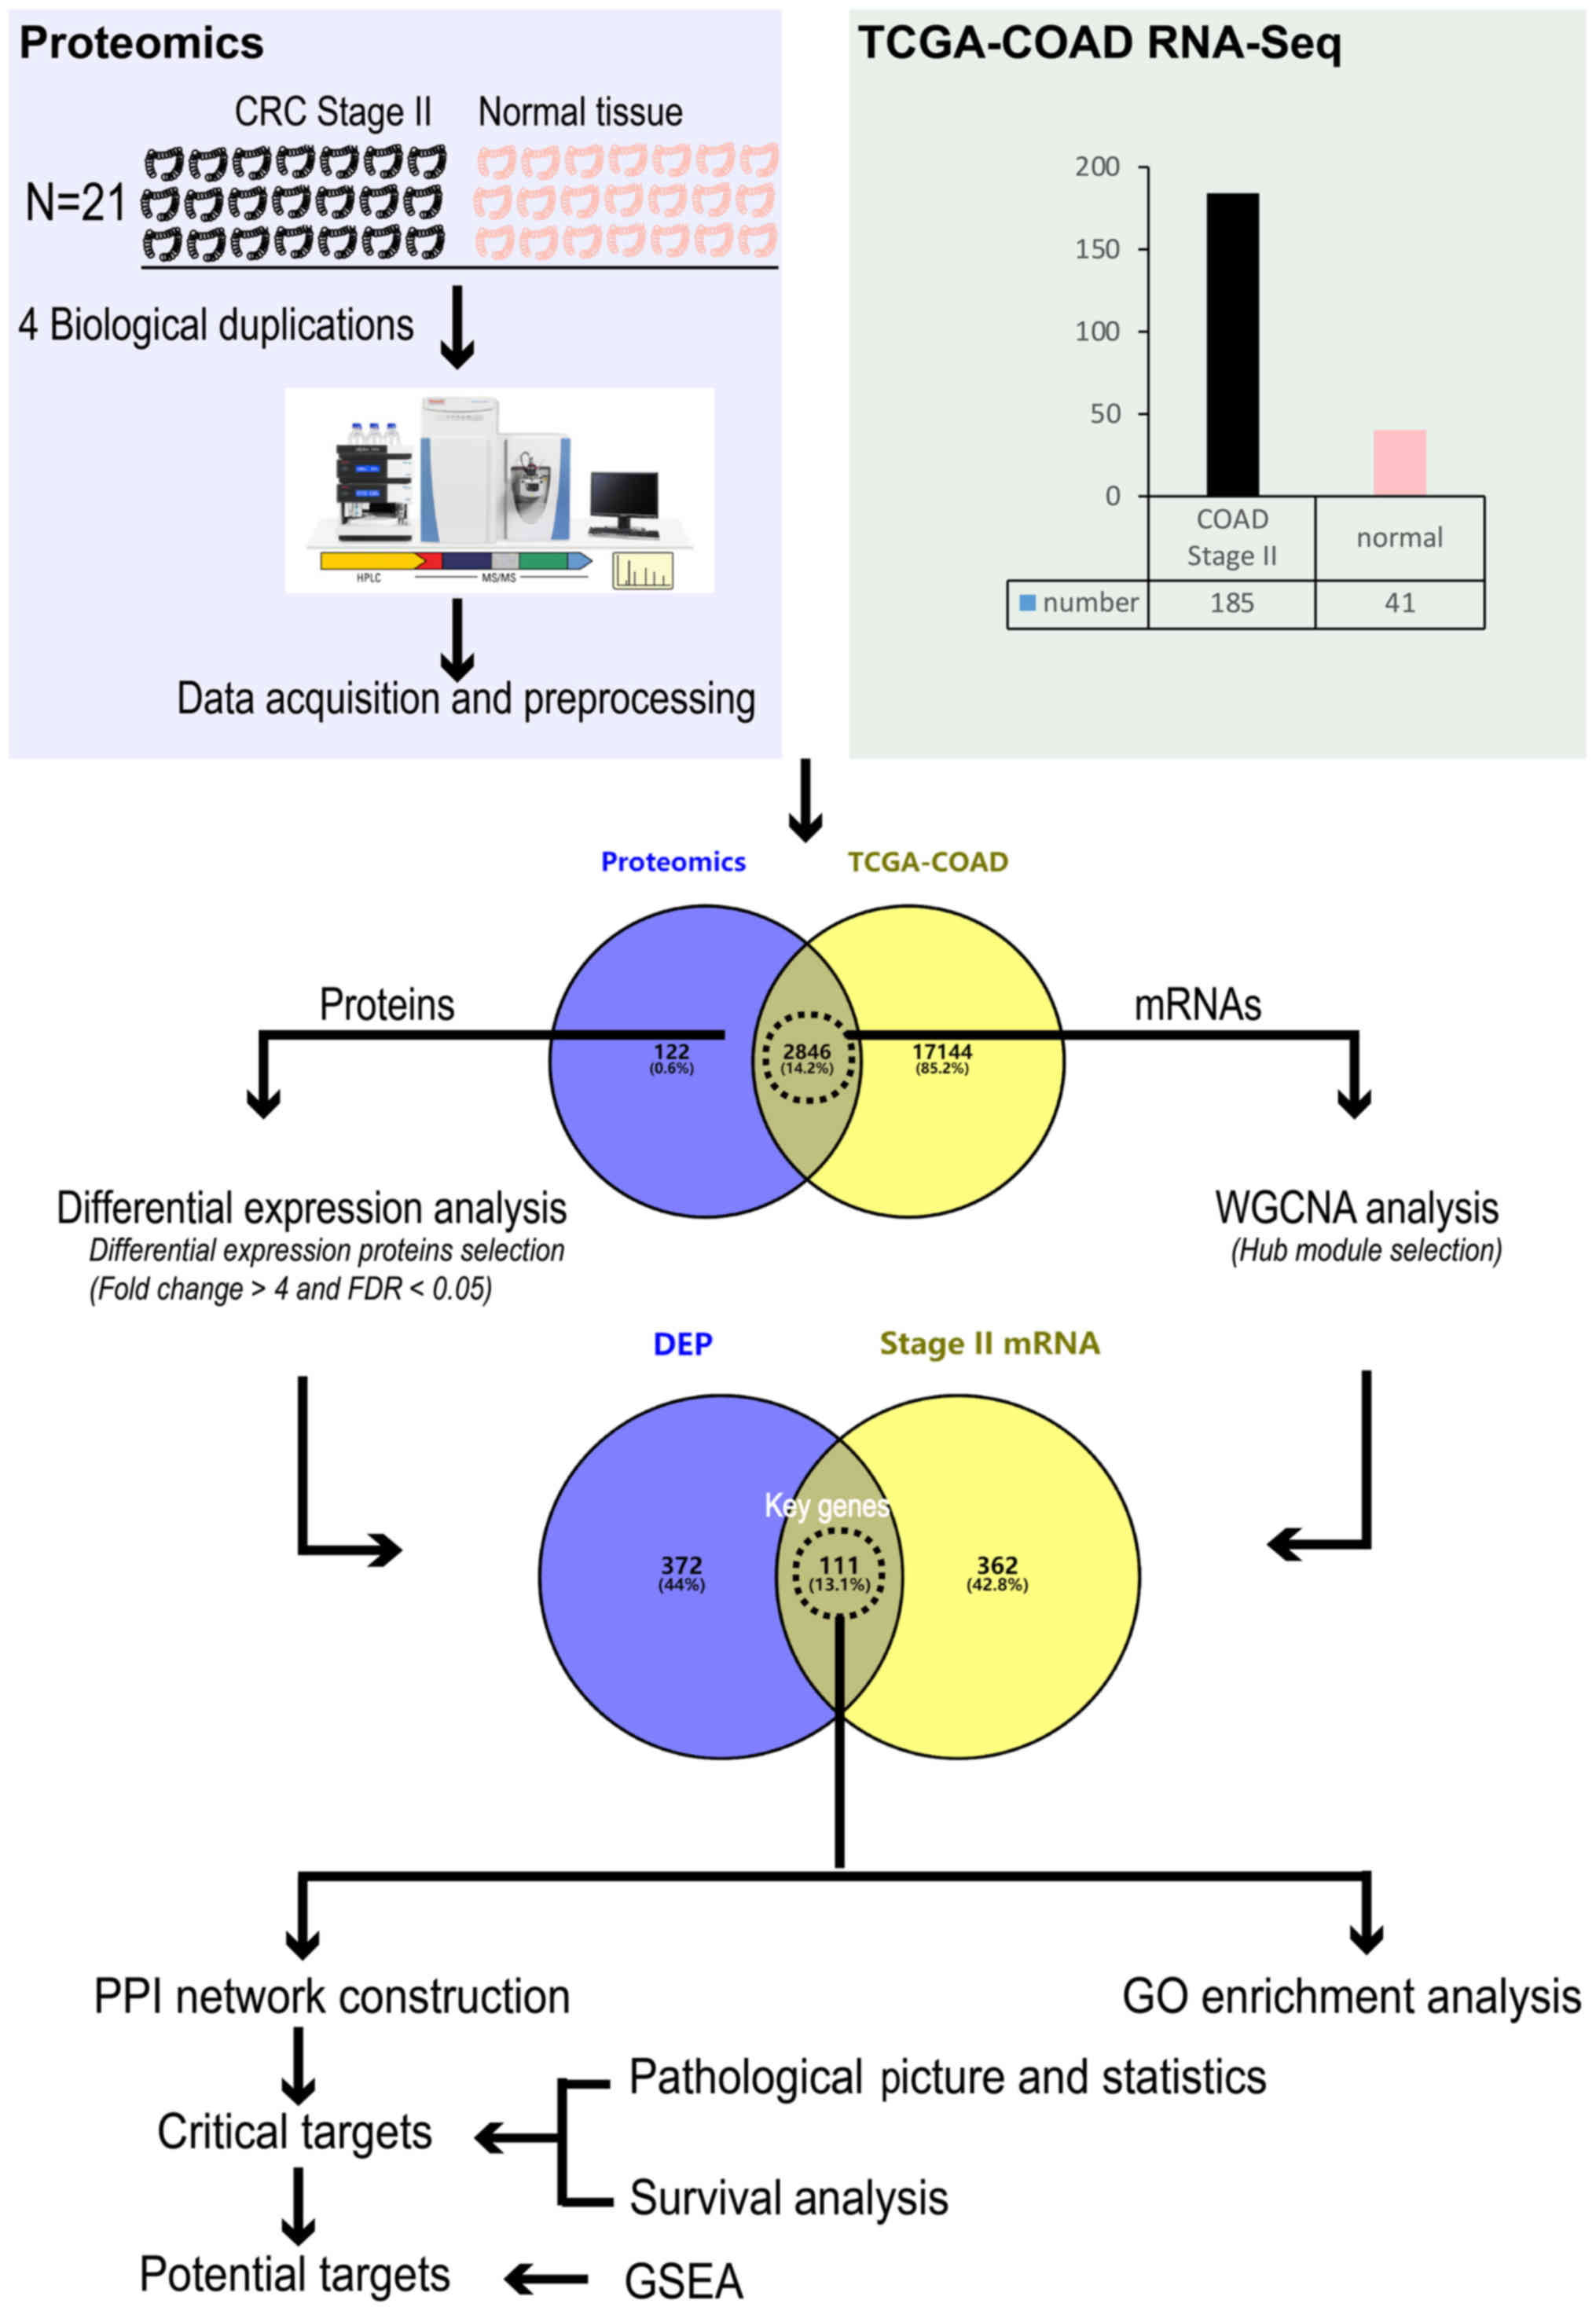 | Figure 1Flow chart for identifying potential
targets of stage II CRC. CRC, colorectal cancer; TCGA, The Cancer
Genome Atlas; COAD, colon adenocarcinoma; RNA-Seq, RNA-Sequencing;
FDR, false discovery rate; WGCNA, weighted correlation network
analysis; DEP, differentially expressed protein; PPI,
protein-protein interaction; GO, Gene Oncology; GSEA, Gene Set
Enrichment Analysis. |
Protein extraction and filter-aided tryptic
digestion. Frozen tissues (~100 mg each) were placed into 2-ml
screw-cap tubes pre-filled with ceramic beads (1.4 mm; Roche
Diagnostics), followed by the addition of 1 ml lysis buffer [8 M
urea, 100 mM Tris, 50 mM dithiothreitol (DTT), 1 mM
phenylmethylsul-phonyl fluoride and protease inhibitor cocktail].
Tissue sample homogenization was then performed on a MagNA Lyser
Instrument (Roche Diagnostics). The homogenous lysates were
centrifuged at 40,000 x g at 4°C for 1 h to isolate the proteins.
The protein content of each sample was determined and adjusted by
adding the lysis buffer. Subsequently, stage II CRC tissues (CT)
and paired adjacent normal tissues (CN) were pooled. The pooled
samples were aliquoted and stored at −80°C until use; the two
pooled protein samples (CT and CN) were then subjected to
proteomics analyses. The protein samples were thawed on ice and
further processed using a filter-aided tryptic digestion method, as
previously described (22).
Briefly, samples were concentrated by centrifugation at 15,000 x g
at room temperature for 20 min in 1.5 ml 10 kDa ultrafiltration
centrifuge tubes (Pall Corporation). Then, the concentrated samples
(<20 µl) were diluted with 200 µl buffer (8 M urea
and 50 mM Tris) supplemented with 10 mM DTT and stored at 55°C for
1 h. The samples were centrifuged at 15,000 x g at room temperature
for 20 min and then mixed with 200 µl buffer (8 M urea and
50 mM Tris) supplemented with 20 mM iodoacetamide. Following
alkylation in the dark at 37°C for 30 min, the protein samples
underwent buffer-exchange twice with 50 mM ammonium bicarbonate
solution. Digestion of the protein samples was initiated by adding
L-1-Tosylamide-2-phenylethyl chloromethyl ketone-modified
sequencing-grade trypsin (Promega Corporation) at an enzyme/protein
ratio of 1:100. The reaction was conducted at 37°C for ≥15 h and
quenched by adding 10% formic acid to a final concentration of 1%.
The tryptic digests were subject to centrifugation at 15,000 x g at
room temperature for 20 min, and the filtrates were collected and
de-salted with C18 Ziptips (EMD Millipore). The purified tryptic
peptides were freeze-dried and stored at −80°C until use.
Nano liquid chromatography (LC)-tandem mass
spectrometry (MS/MS). The tryptic peptide samples, solubilized in
20 µl 0.1% (vol/vol) trifluoroacetic acid, were analyzed
using a TripleTOF5600+ mass spectrometer (AB Sciex) coupled with an
Eksigent nanoLC system (AB Sciex). The peptide mixture was
separated using a C18 capillary column (ChromXP; SCIEX; 150 mm × 75
µm ×3.0 µm) at 300 nl/min, using a 120 min gradient
rendered by solvents A (2% acetonitrile/0.1% formic acid) and B
(98% acetonitrile/0.1% formic acid). The entire gradient comprised
1-35% solvent B for 90 min, 35-80% solvent B for 15 min, and 85%
solvent B for 15 min. The mass spectrometer, fitted with a PicoView
Nanospray source, which does not require a nebulizer gas (PV400;
New Objective), was operated under the positive ion mode. Complete
MS spectra were acquired for the mass range of 350-1,250 m/z. The
proteomics data were collected using
information-dependent-acquisition mode by selecting 10 most
abundant ions for MS/MS fragmentation under the following
conditions: The number of charged ions is 2-5 and the collision
energy is applied in the mode of Rolling Collision Energy.
Database searches and data processing. The collected
data files (.wiff) were transferred to a data processing
workstation. MS data analysis software ProteinPilot 5.0 (AB Sciex)
was used for protein database searching against the SwissProt
database (ftp://ftp.uniprot.org/pub/databases/uniprot/current_release/knowledgebase/complete/uniprot_sprot.fasta.gz).
The parameters were set as follows: i) The protease was selected as
trypsin; ii) alkylation of Cys by iodoacetamide; and iii)
biological modifications were selected as the ID Focus. The
resulting group files were converted into mzIDentML format using
the GroupFileExtractor tool affiliated with ProteinPilot
(https://download.sciex.com/ProteinPilot_502-relNotes.pdf).
Scaffold (version Scaffold_4.8.4; Proteome Software) was used to
validate MS/MS-based peptide and protein identifications. Peptide
identifications were accepted if they could be established at
>73.0% probability to achieve a false discovery rate (FDR)
<1.0% by the Scaffold Local FDR algorithm. Protein
identifications were accepted if they could be established at
>5.0% probability to achieve an FDR <1.0% and contained ≥2
identified peptides. Proteins that contained similar peptides and
could not be differentiated based on MS/MS analysis alone were
grouped to satisfy the principles of parsimony. Proteins sharing
significant peptide data were grouped into clusters. Spectral
counting, which refers to the total number of spectra identified
for a protein, was used to quantitatively estimate protein
abundance in the proteomics dataset.
RNA sequencing data acquisition. The mRNA expression
profiles of TCGA-COAD- Fragments Per Kilobase of transcript per
Million mapped reads (FPKM) were downloaded from TCGA (https://cancergenome.nih.gov/) (17). The datasets numbers are presented
in Fig. S1. In the present study,
there were 226 samples, including 41 normal tissue normal samples
and 185 COAD stage II samples. The Encyclopedia of DNA Elements
(23) (GRCh38; V22) catalog
(https://www.gencodegenes.org/releases/22.html) was
used as a reference to identify mRNAs. Briefly, 19,990 mRNAs from
the RNA-Sequencing (RNA-Seq) data were extracted. The data were
downloaded from R Studio v1.2.1335 (https://www.rstudio.com/products/rstudio/download/#download)
using R package TCGAbiolinks (24).
Differentially expressed protein (DEP) selection.
The 'edgeR' package (25,26) was used to select DEPs between CT
and CN. The FDR P-value was corrected by the Benjamini-Hochberg
method (26). The selection
criteria of DEPs were FDR P-value <0.05 and fold change (FC)
>4. Then, the distribution of DEPs were presented as heatmaps
and volcano plots using the ggplot2 package (27) in R.
Construction of a scale-free network construction by
WGCNA. To link proteomics data with mRNA data, only genes
overlapping in the proteomics and mRNA data were selected for
subsequent WGCNA analysis. WGCNA (21) was used to analyze RNA-Seq data and
two main parts comprised this analysis. In the first part, the
correlation coefficients between any two mRNAs were calculated to
determine whether two mRNAs have similar expression patterns. WGCNA
employs correlation coefficient weights to construct a scale-free
network. The weighted gene co-expression network stresses high
correlations at the cost of low correlations by increasing the
absolute value of the correlation to a power β ≥1 (soft
thresholding). The best-suited soft threshold value (β) was
selected to build the scale-free network. Then, the scale-free
network distribution could be tested. In the second part, the
hierarchical clustering tree was constructed by using the
correlation coefficients between mRNAs. Based on the weighted
correlation coefficient of mRNAs, mRNAs were classified according
to their expression pattern, and mRNAs with similar patterns were
grouped into the same module. Subsequently, the module-trait
association was determined by combining the sample information. A
correlation test P-value or a regression-based P-value was used for
evaluating the statistical significance between xi and
trait (21).
Gene Ontology (GO) enrichment analysis of key genes.
DEPs from proteomics data were screened; in addition, the hub gene
module of mRNAs was determined. Genes that appeared as both DEPs
and mRNAs of the hub module were defined as key genes. GO
enrichment analysis (28)
comprised biological process (BP), cellular component and molecular
function; BP was selected to understand the general function of key
genes. Then, 'clusterProfiler' (29) was used for GO enrichment analysis.
The top 15 GO terms with the highest significance following
enrichment were chosen.
Construction of a protein-protein interaction (PPI)
network. A PPI network of key genes was constructed using the
STRING v11.0 (30,31). Subsequently, Cytoscape v3.6.0
(https://cytoscape.org/download.html)
was used to present the PPI network; default settings of the
Cytoscape MCODE plug-in (http://apps.cytoscape.org/apps/mcode) were applied.
The key cluster and seed node of each cluster were then obtained.
These seed nodes were considered as critical targets in the PPI
network.
Pathological images and survival analysis. The HPA
(https://www.proteinatlas.org/) is a free
and open database comprising three sub-atlases: The tissue, cell
and the pathology atlases, which provide a large amount of public
data available for cancer research (18-20).
To screen clinically important molecules from critical targets,
pathological images were obtained and survival analysis was
conducted based on TCGA-COAD clinical data in the HPA database
(https://www.proteinatlas.org/humanproteome/pathology/colorectal+cancer).
Normal colonic tissue contains epithelial cells, glandular cells
and peripheral nerves/ganglia. Of note, the tumor employed for
analysis was adenocarcinoma; thus, the clinical significance of
each potential target was determined based on the
immunohistochemistry analysis of glandular cells in normal tissue.
Additionally, Kaplan-Meier analysis revealed a correlation between
the expression levels of mRNA and patient survival; P-values were
obtained using a log-rank test. Based on the FPKM value of each
gene, the patients were classified into two groups and their
prognoses were examined. In the analysis, genes with low expression
were excluded, such as those with a median expression among samples
with FPKM <1. The prognosis of each group of patients was
examined by Kaplan-Meier survival estimators, and the survival
outcomes of the two groups were compared by log-rank tests. To
choose the best FPKM cut-offs for grouping the patients most
significantly, all FPKM values from the 20th to 80th percentiles
were used to group the patients; significant differences in the
survival outcomes of the groups were examined and the value
yielding the lowest log-rank P-value was selected (https://www.proteinatlas.org). The data used for the
survival analysis included all the TCGA-COAD data in the HPA
database.
Statistical analysis. Using the 'ggstatsplot'
package (https://github.com/IndrajeetPatil/ggstatsplot/issues)
in R, further statistical analysis of the critical targets was
conducted to interpret pathological images and survival results.
P-values were obtained by an independent samples t-test. The
statistical significance cut-off level was P<0.05.
Gene Set Enrichment Analysis (GSEA) and protein
classes of potential targets. To verify the biological function of
potential targets, their expression levels were used to classify
samples into high- and low-expression groups. Kyoto Encyclopedia of
Genes and Genomes (v6.2) (32)
enrichment analysis was conducted using GSEA v3.0 (33,34).
The mRNA data of TCGA-COAD stage II were used for the GSEA, and
these mRNAs were present in both the proteomics and transcriptomics
data. The parameters of the software were set to default. The
normalized enrichment score (NES) value and the P-value of the
enriched pathways were used to confirm the accuracy of the results.
|NES| >1 and P<0.05 were used to filter the pathways. Then,
the 'ggplot2' and 'ggrepel' packages (https://github.com/slowkow/ggrepel/issues) were
applied to present the results in the R platform. Meanwhile, the
protein classes were queried using the HPA database (https://www.proteinatlas.org/).
Results
Distribution of protein expression regulation. In
total, 2,968 proteins were identified in the stage II CRC
proteomics data. Most of the identified proteins (2,846 items) were
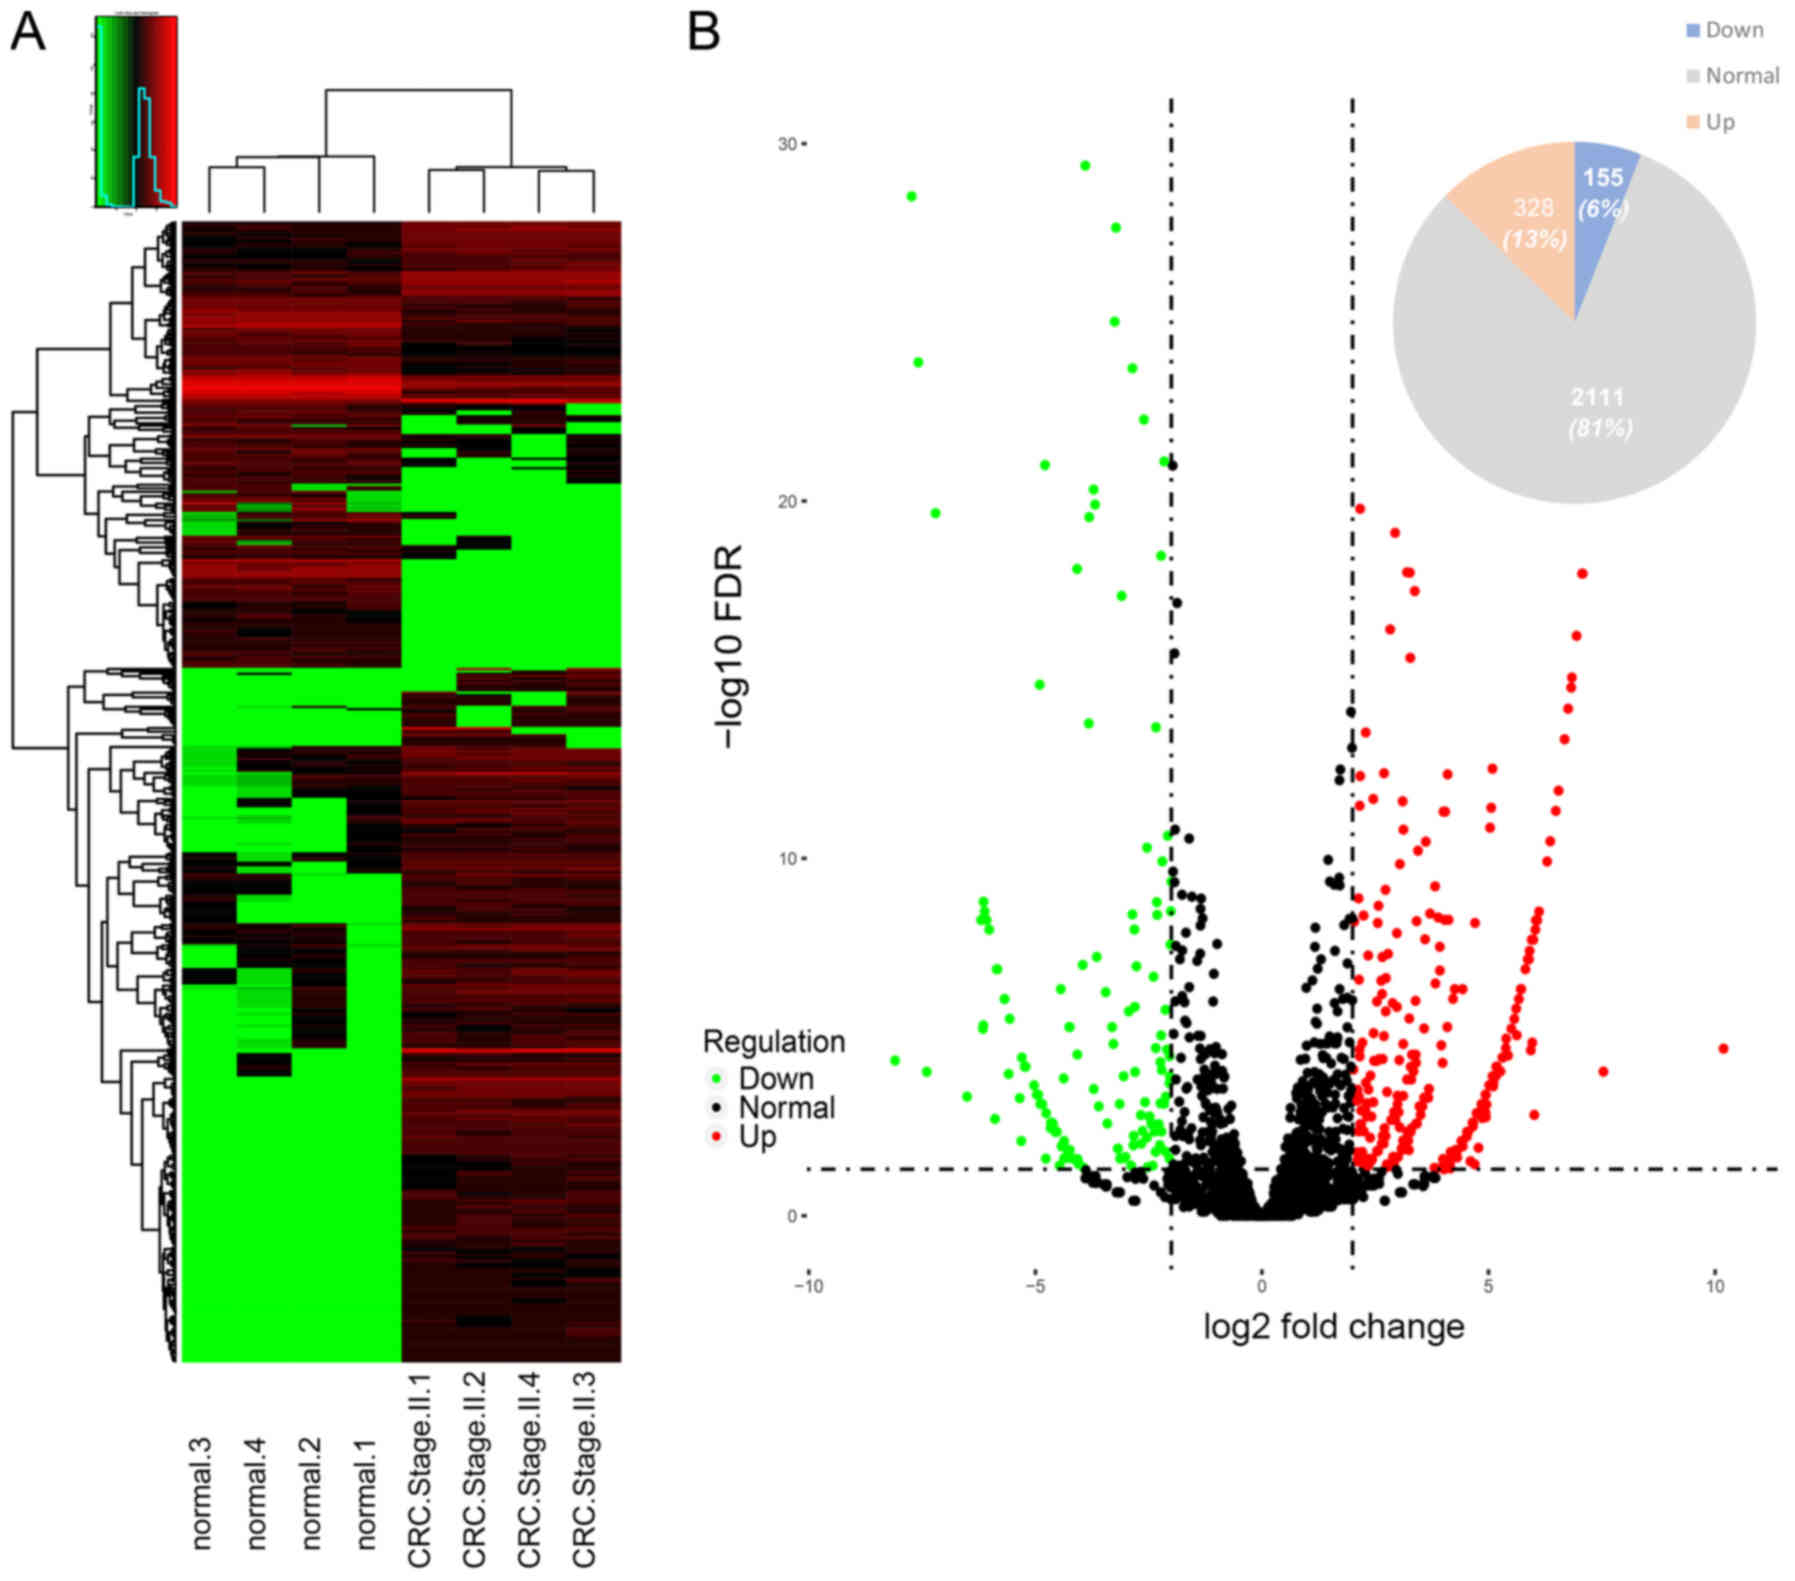
identified in TCGA-COAD transcriptome data (Fig. 1). 328 upregulated DEPs and 155
downregulated DEPs (P<0.05; FC >4) were reported (Fig. 2).
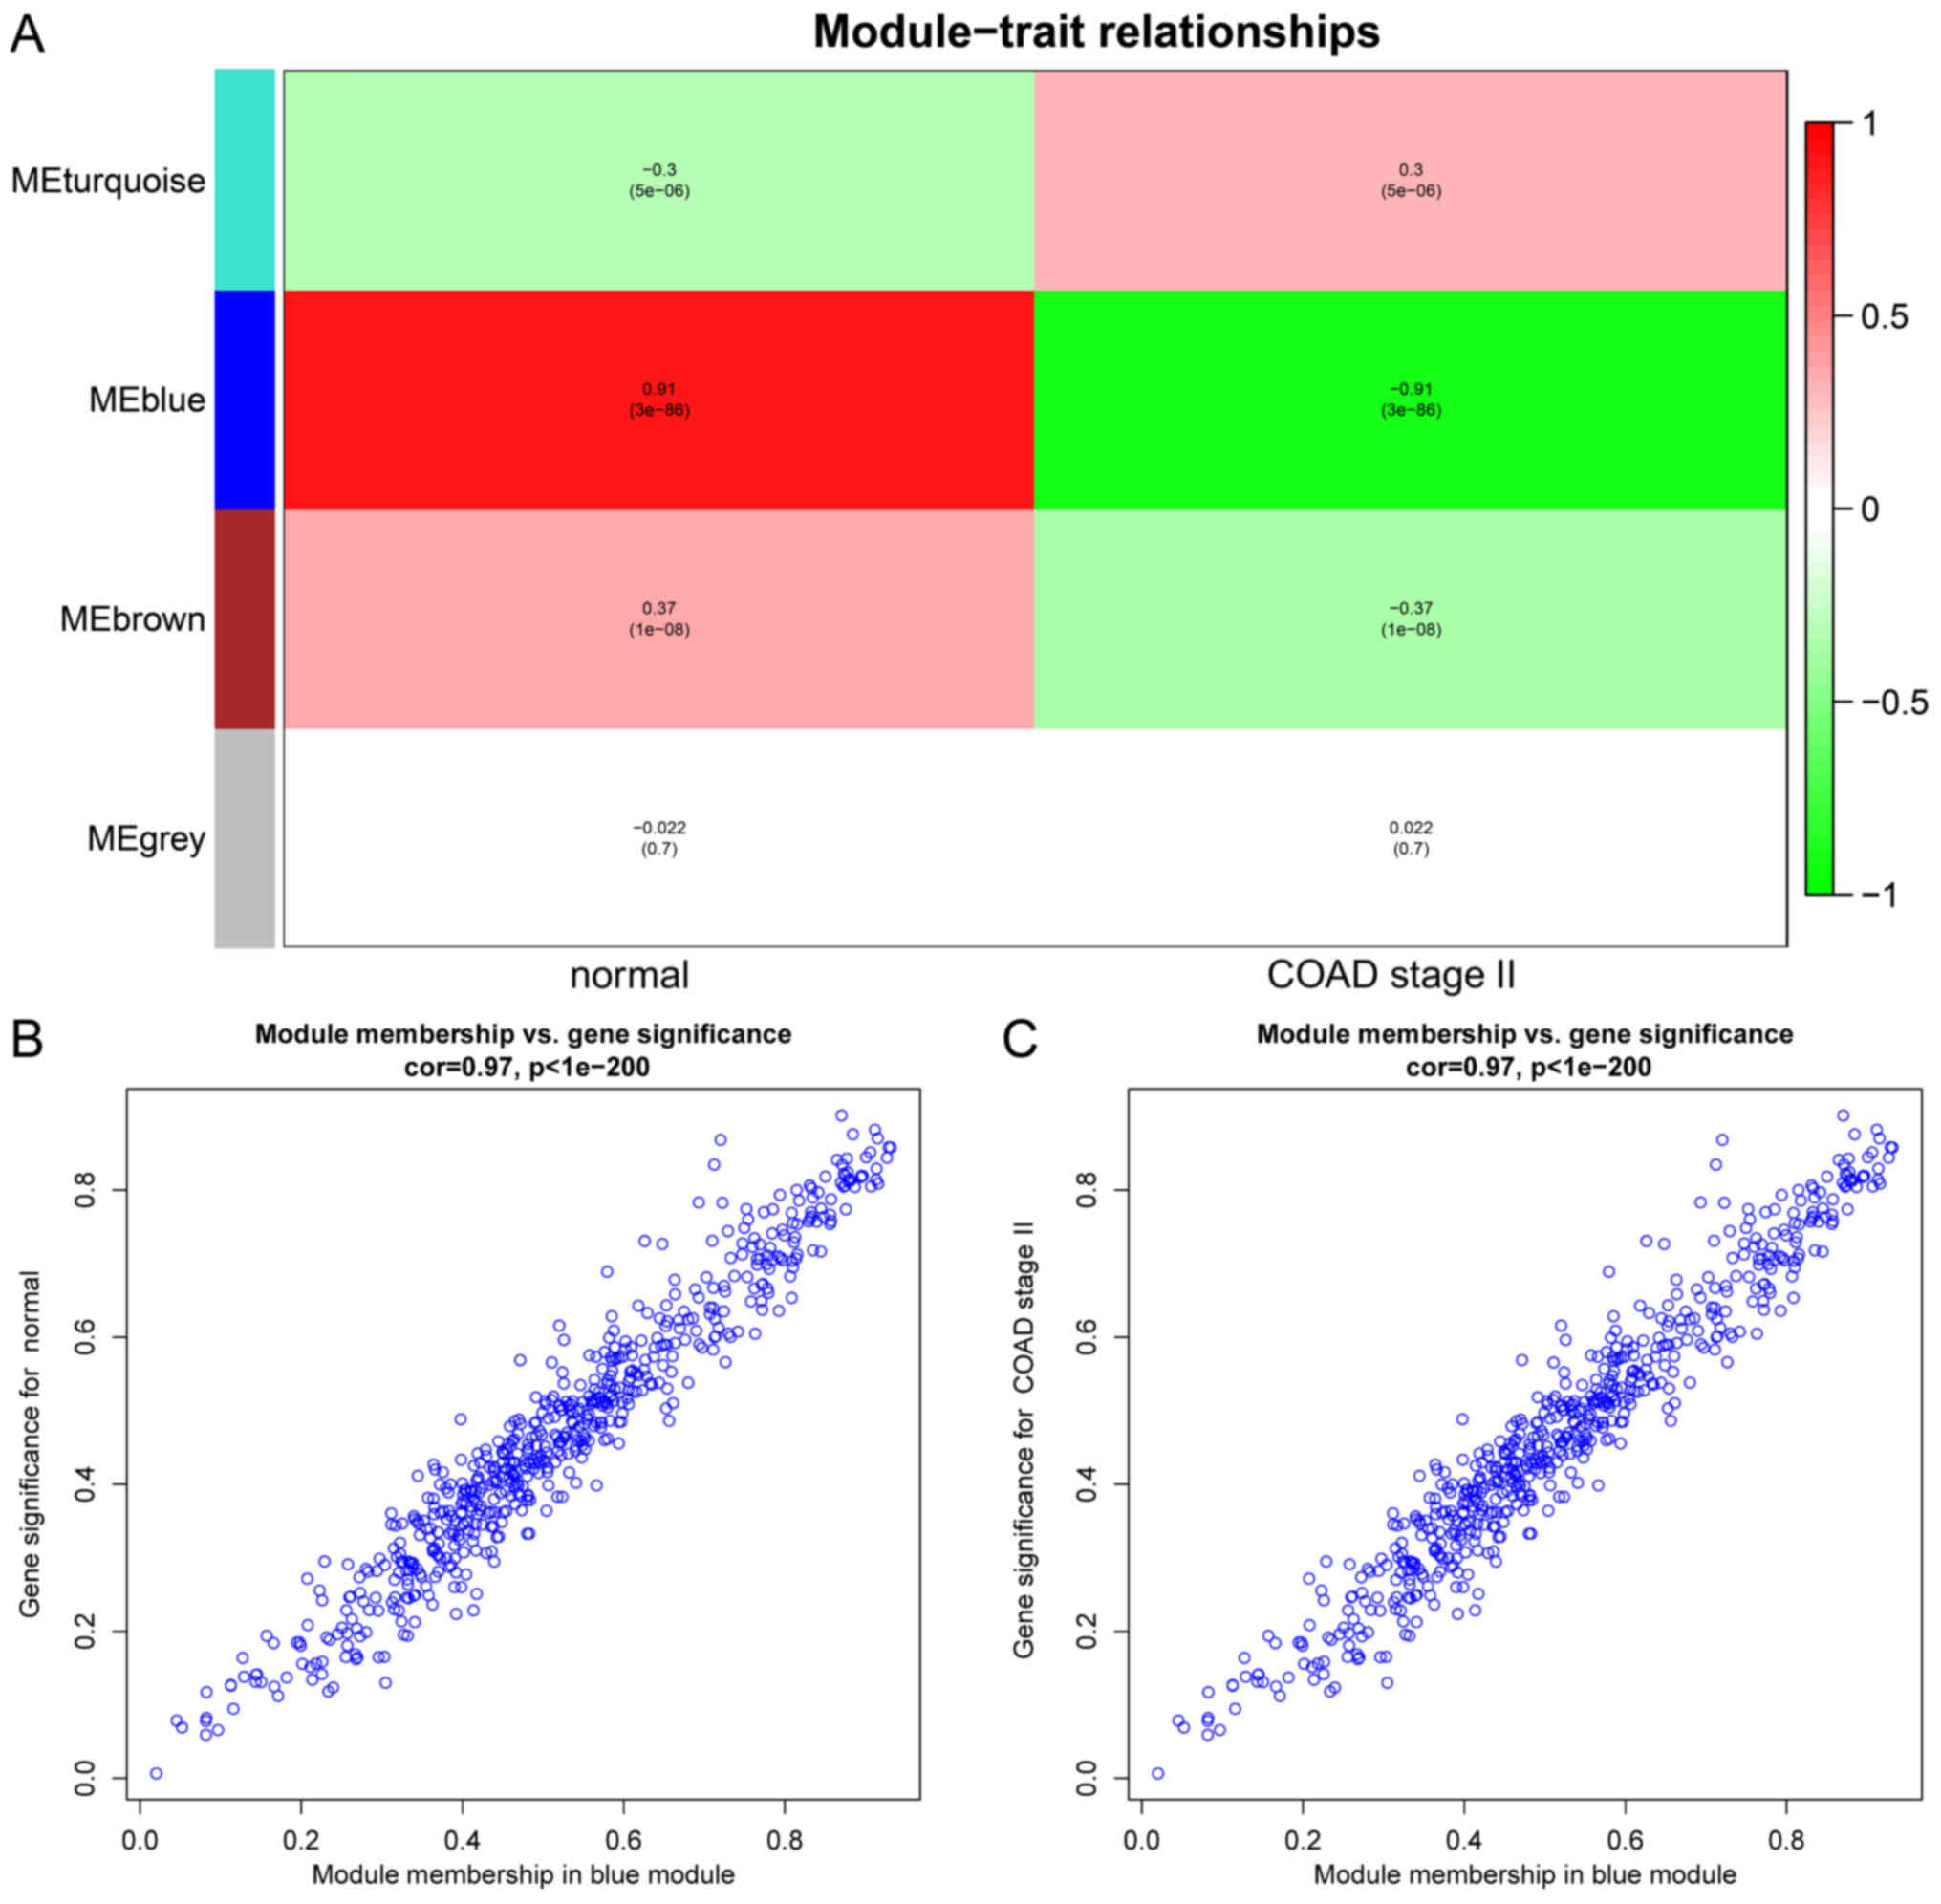
Construction of a scale-free network and screening
for hub modules. In the present study, 2,846 coincident genes
coexisted in stage II CRC proteomics and TCGA-COAD data. The
hierarchical clustering tree revealed the similarity of different
samples. The results demonstrated that the cancer tissue and normal
sample had apparent heterogeneity (Fig. S1). In addition, WGCNA was used to
construct a scale-free network, which was built with β=8 (Fig. S2A-D). A total of four gene modules
(blue, brown, turquoise and grey) were generated; the majority of
the genes were summarized into the 'turquoise module' (Fig. S2E).
According to the module-trait association, the
'blue' module with the highest correlation coefficient was selected
for subsequent analysis (Fig. 3A).
Gene significance (GS) was used to measure the degree of
association between protein and trait. Module membership (MM) was
used to determine the location of a global network. GS versus MM
reflected the relationship between characteristics and proteins.
The results revealed that the 'blue module' was essential (Fig. 3B and C).
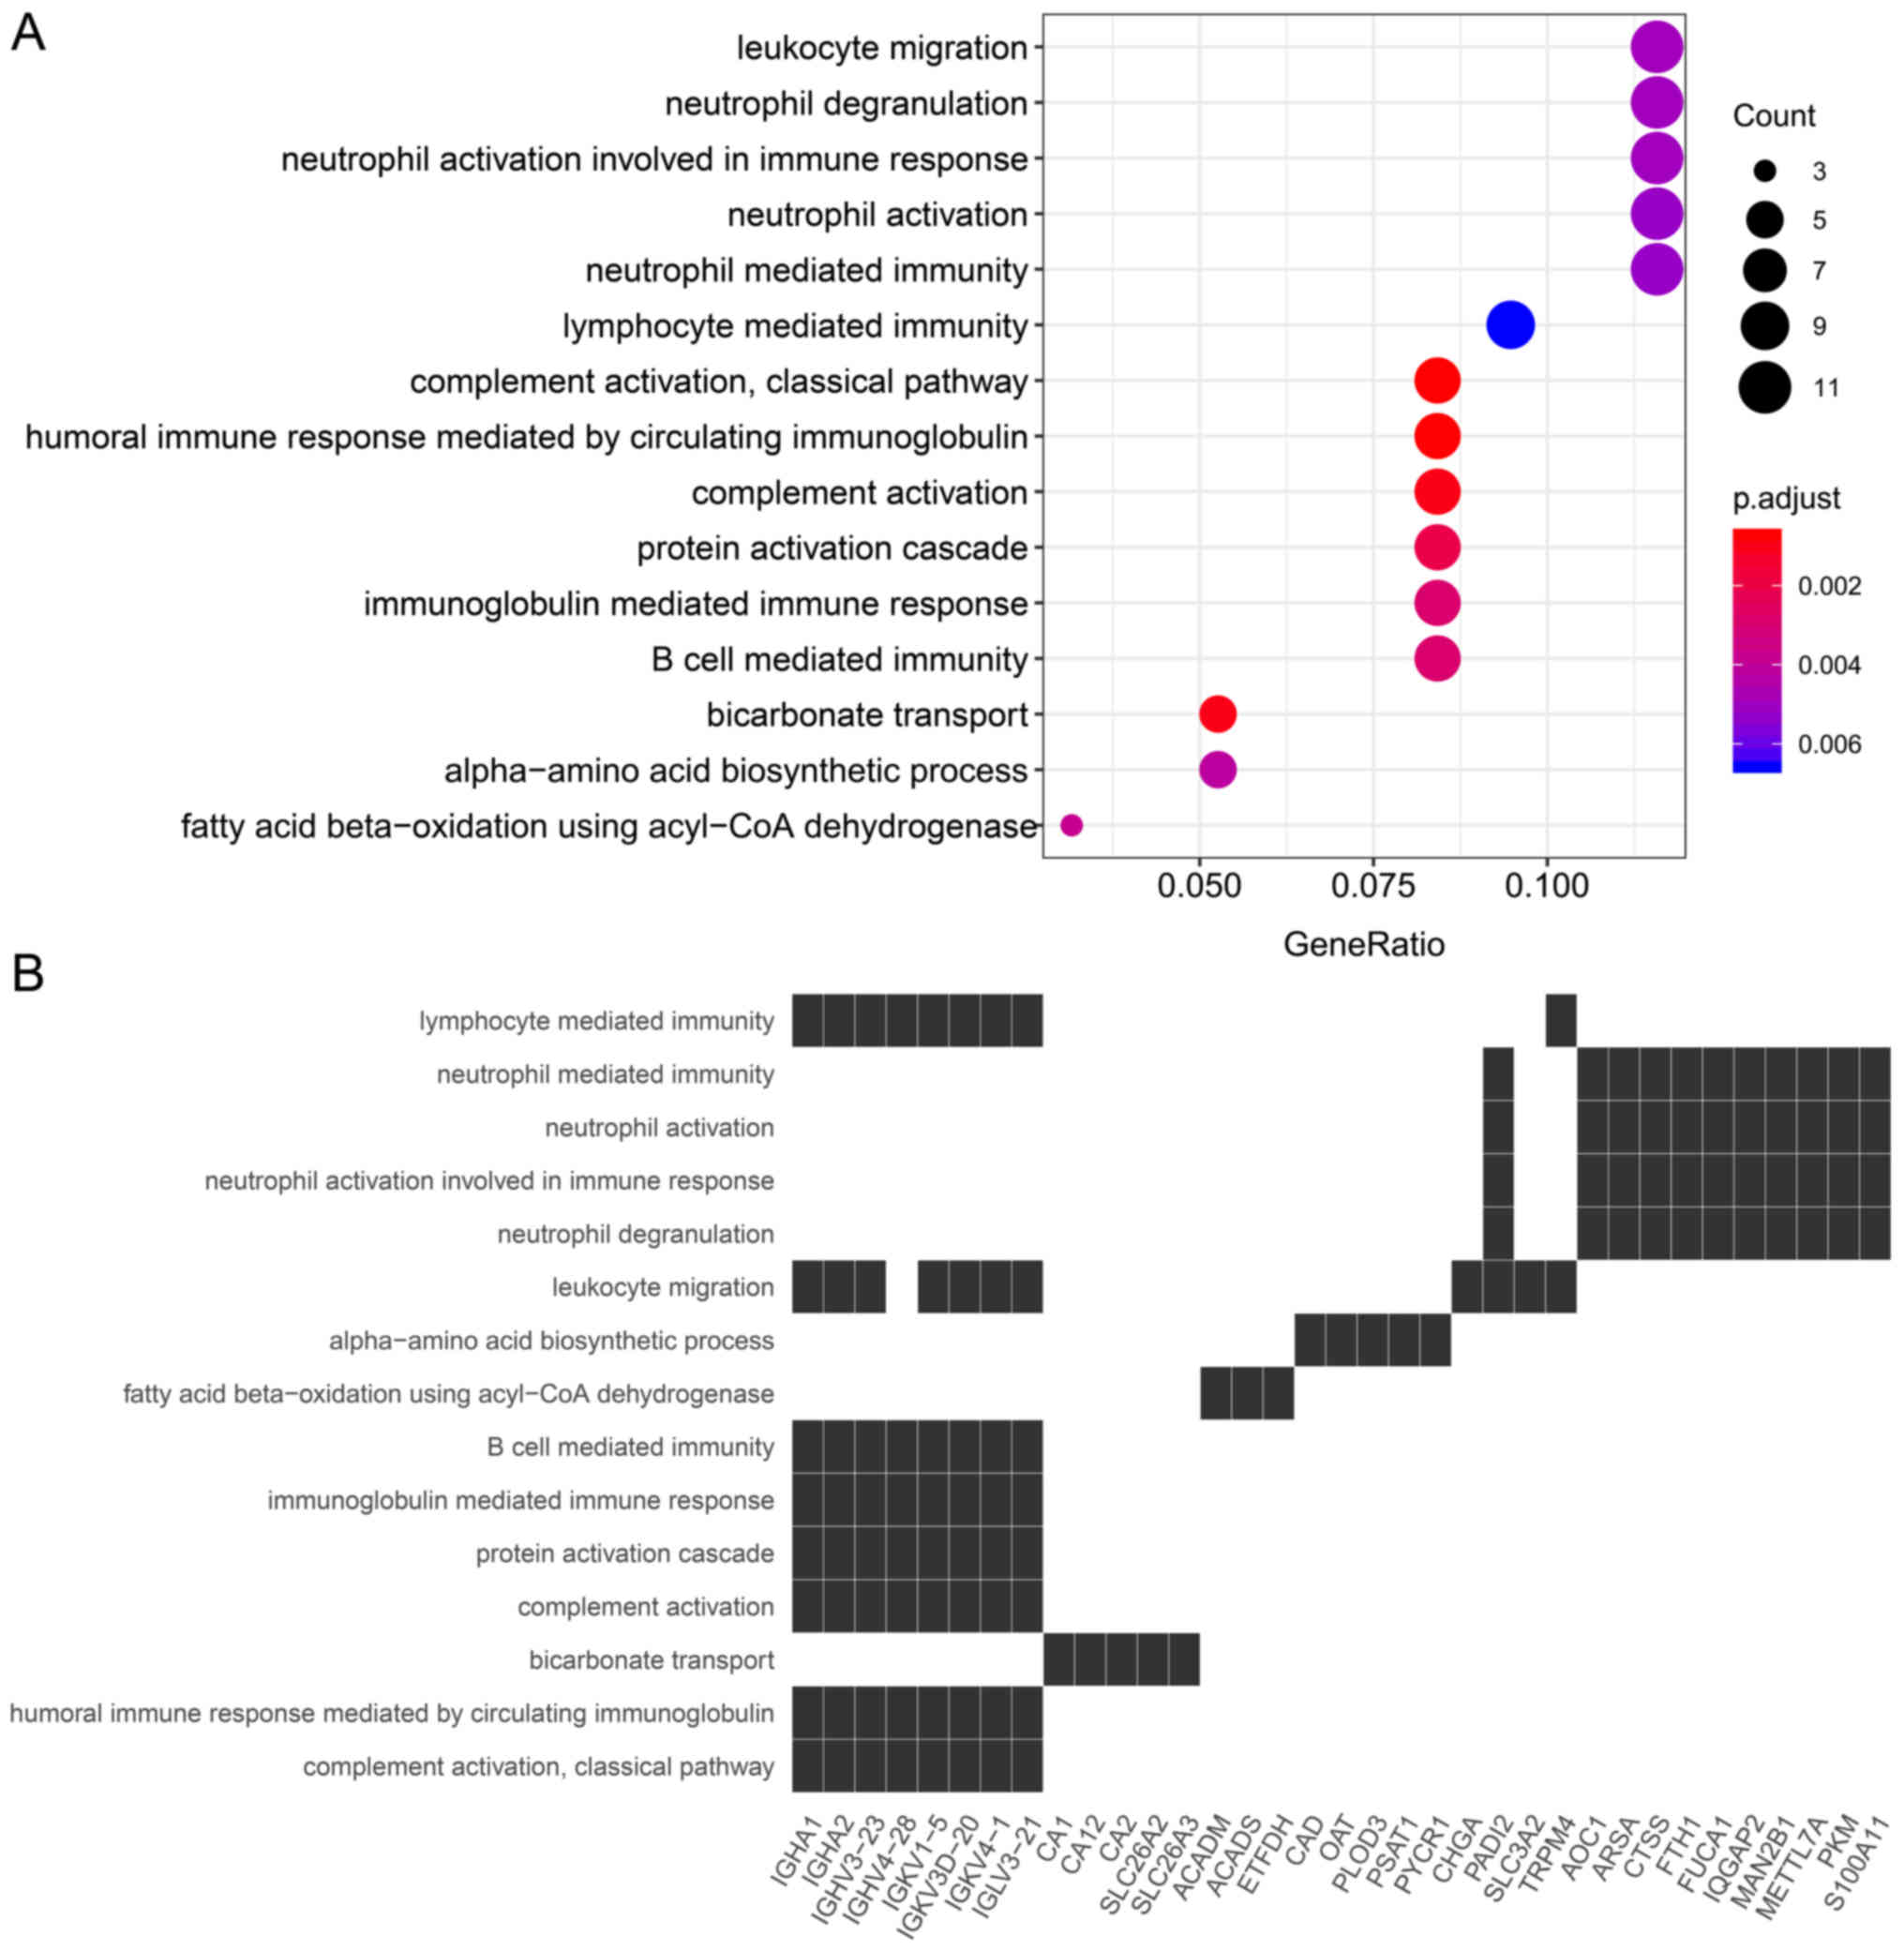
GO enrichment analysis of key genes. There were 111
key genes derived from the overlapping of DEPs and mRNAs of the
'blue' module. Then, BPs associated with these genes were
identified by GO enrichment analysis; only the top 15 most
significant GO terms were used to determine the general function of
these genes. A total of 12/15 GO terms were mainly involved in
immunity, including 'neutrophil degranulation', 'neutrophil
activation involved in immune response', 'neutrophil activation',
'neutrophil mediated immunity', 'lymphocyte mediated immunity',
'leukocyte migration', 'B cell mediated immunity', 'immunoglobulin
mediated immune response', 'protein activation cascade',
'complement activation, classical pathway', 'humoral immune
response mediated by circulating immunoglobulin' and 'complement
activation'. 'Complement activation' was the most significant. The
remaining 3/15 GO terms were involved in metabolic pathways,
including 'bicarbonate transport' with the highest significance
(Fig. 4).
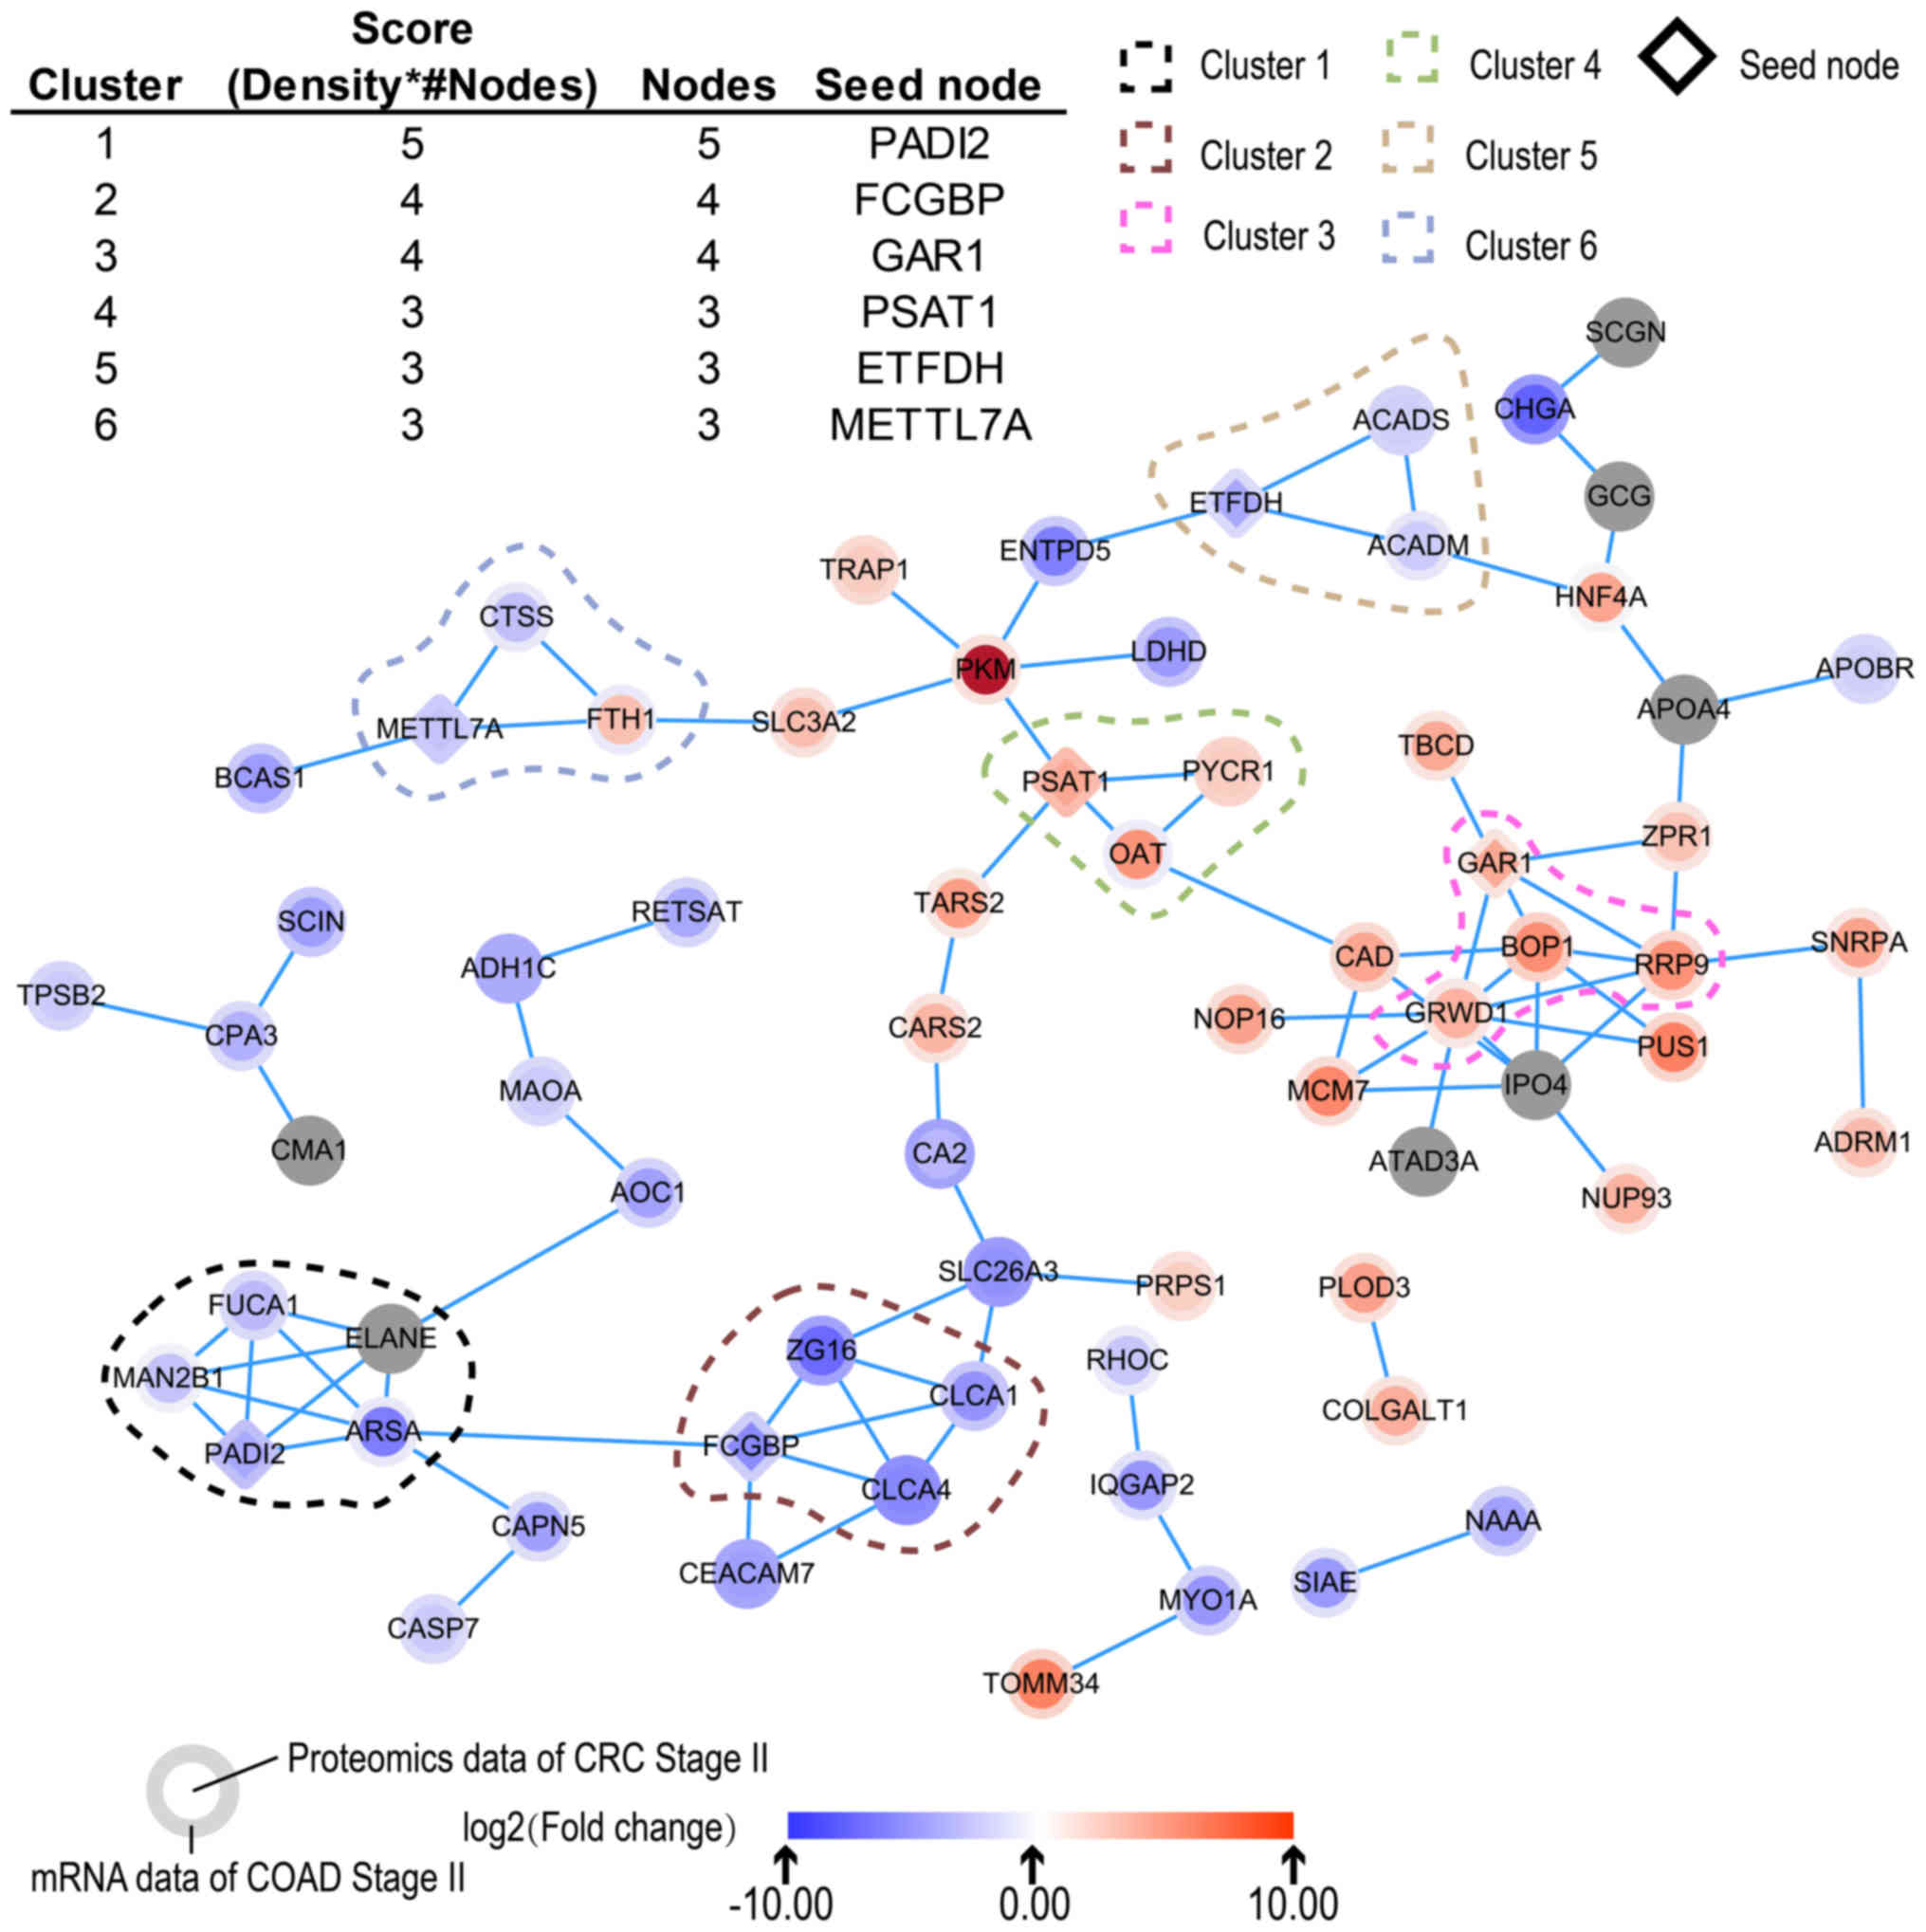
Construction of PPI networks and identification of
critical targets. Based on the STRING database, a PPI network of
associated key genes was built. Using the MCODE plug-in, six
clusters were selected in the PPI network, including
protein-arginine deiminase type-2 (PADI2), Fc fragment of IgG
binding protein (FCGBP), GAR1 ribonucleoprotein (GAR1),
phosphoserine aminotransferase 1 (PSAT1), electron-transfer
flavoprotein-ubiquinone oxidoreductase (ETFDH) and
methyltransferase-like 7A (METTL7A), which were the seed nodes in
each cluster (Fig. 5).
Pathological images and statistics. To verify the
clinical role of these critical targets, pathological images
(Fig. 6) and statistical analysis
(Fig. 7) of PADI2 (P<0.001 in
RNA-Seq and P<0.001 in proteomics), FCGBP (P<0.001 in RNA-Seq
and P<0.001 in proteomics), GAR1 (P<0.001 in RNA-Seq and
P=0.020 in proteomics), PSAT1 (P<0.001 in RNA-Seq and P=0.003 in
proteomics) and ETFDH (P<0.001 in RNA-Seq and P=0.108 in
proteomics) were obtained, but not for METTL7A. Of note, the
pathological images of PADI2, FCGBP and PSAT1 were notably
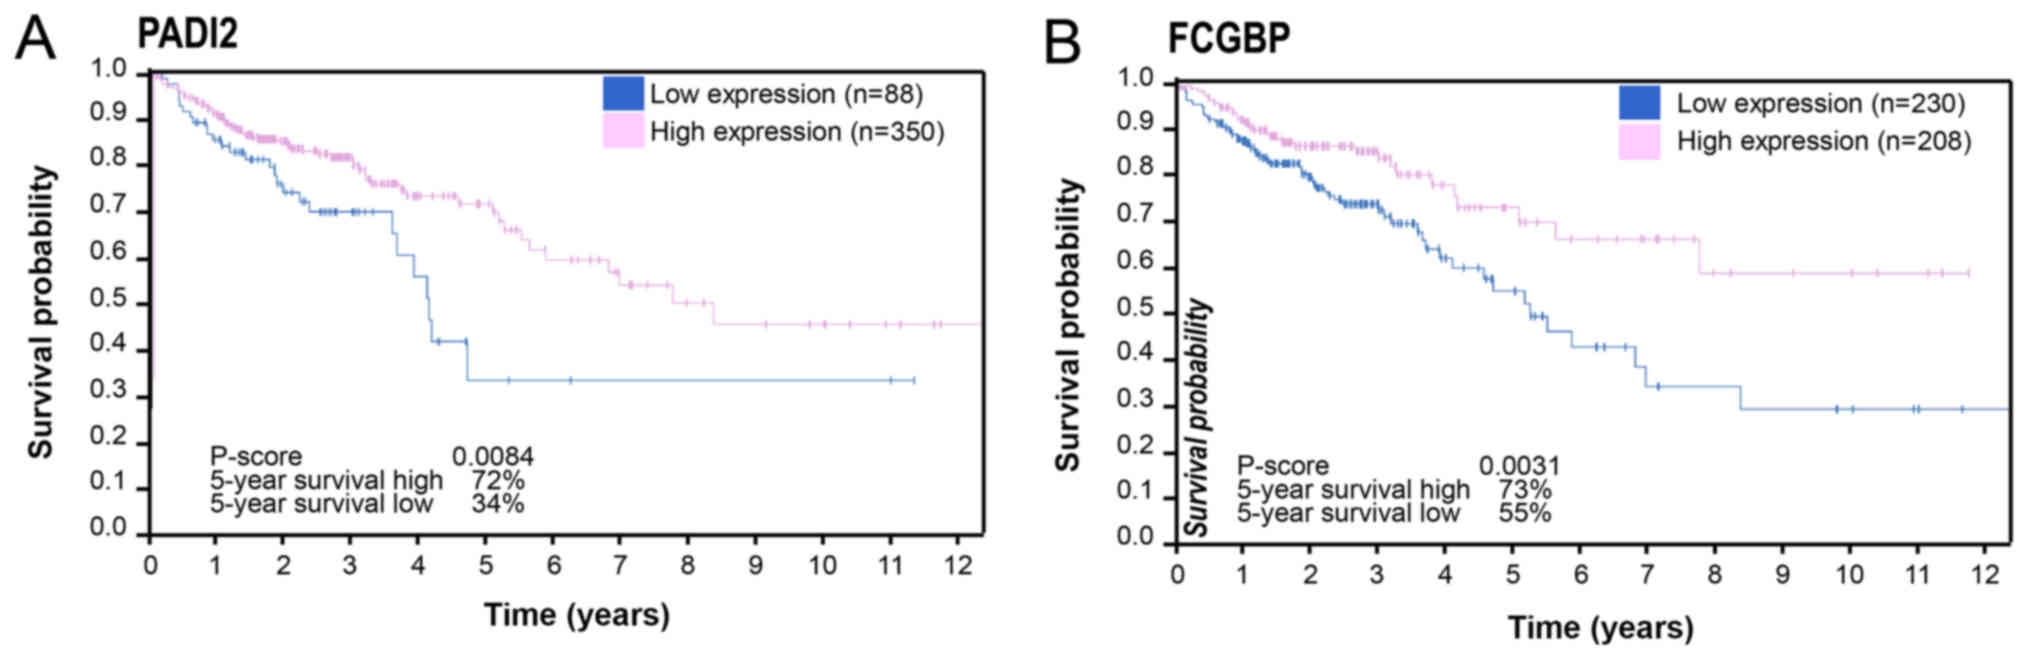
different from those of normal colon tissues (Figs. 6 and 7). Additionally, PADI2 (P=0.0084) and
FCGBP (P=0.0031) were associated with the prognosis of COAD
(Fig. 8).
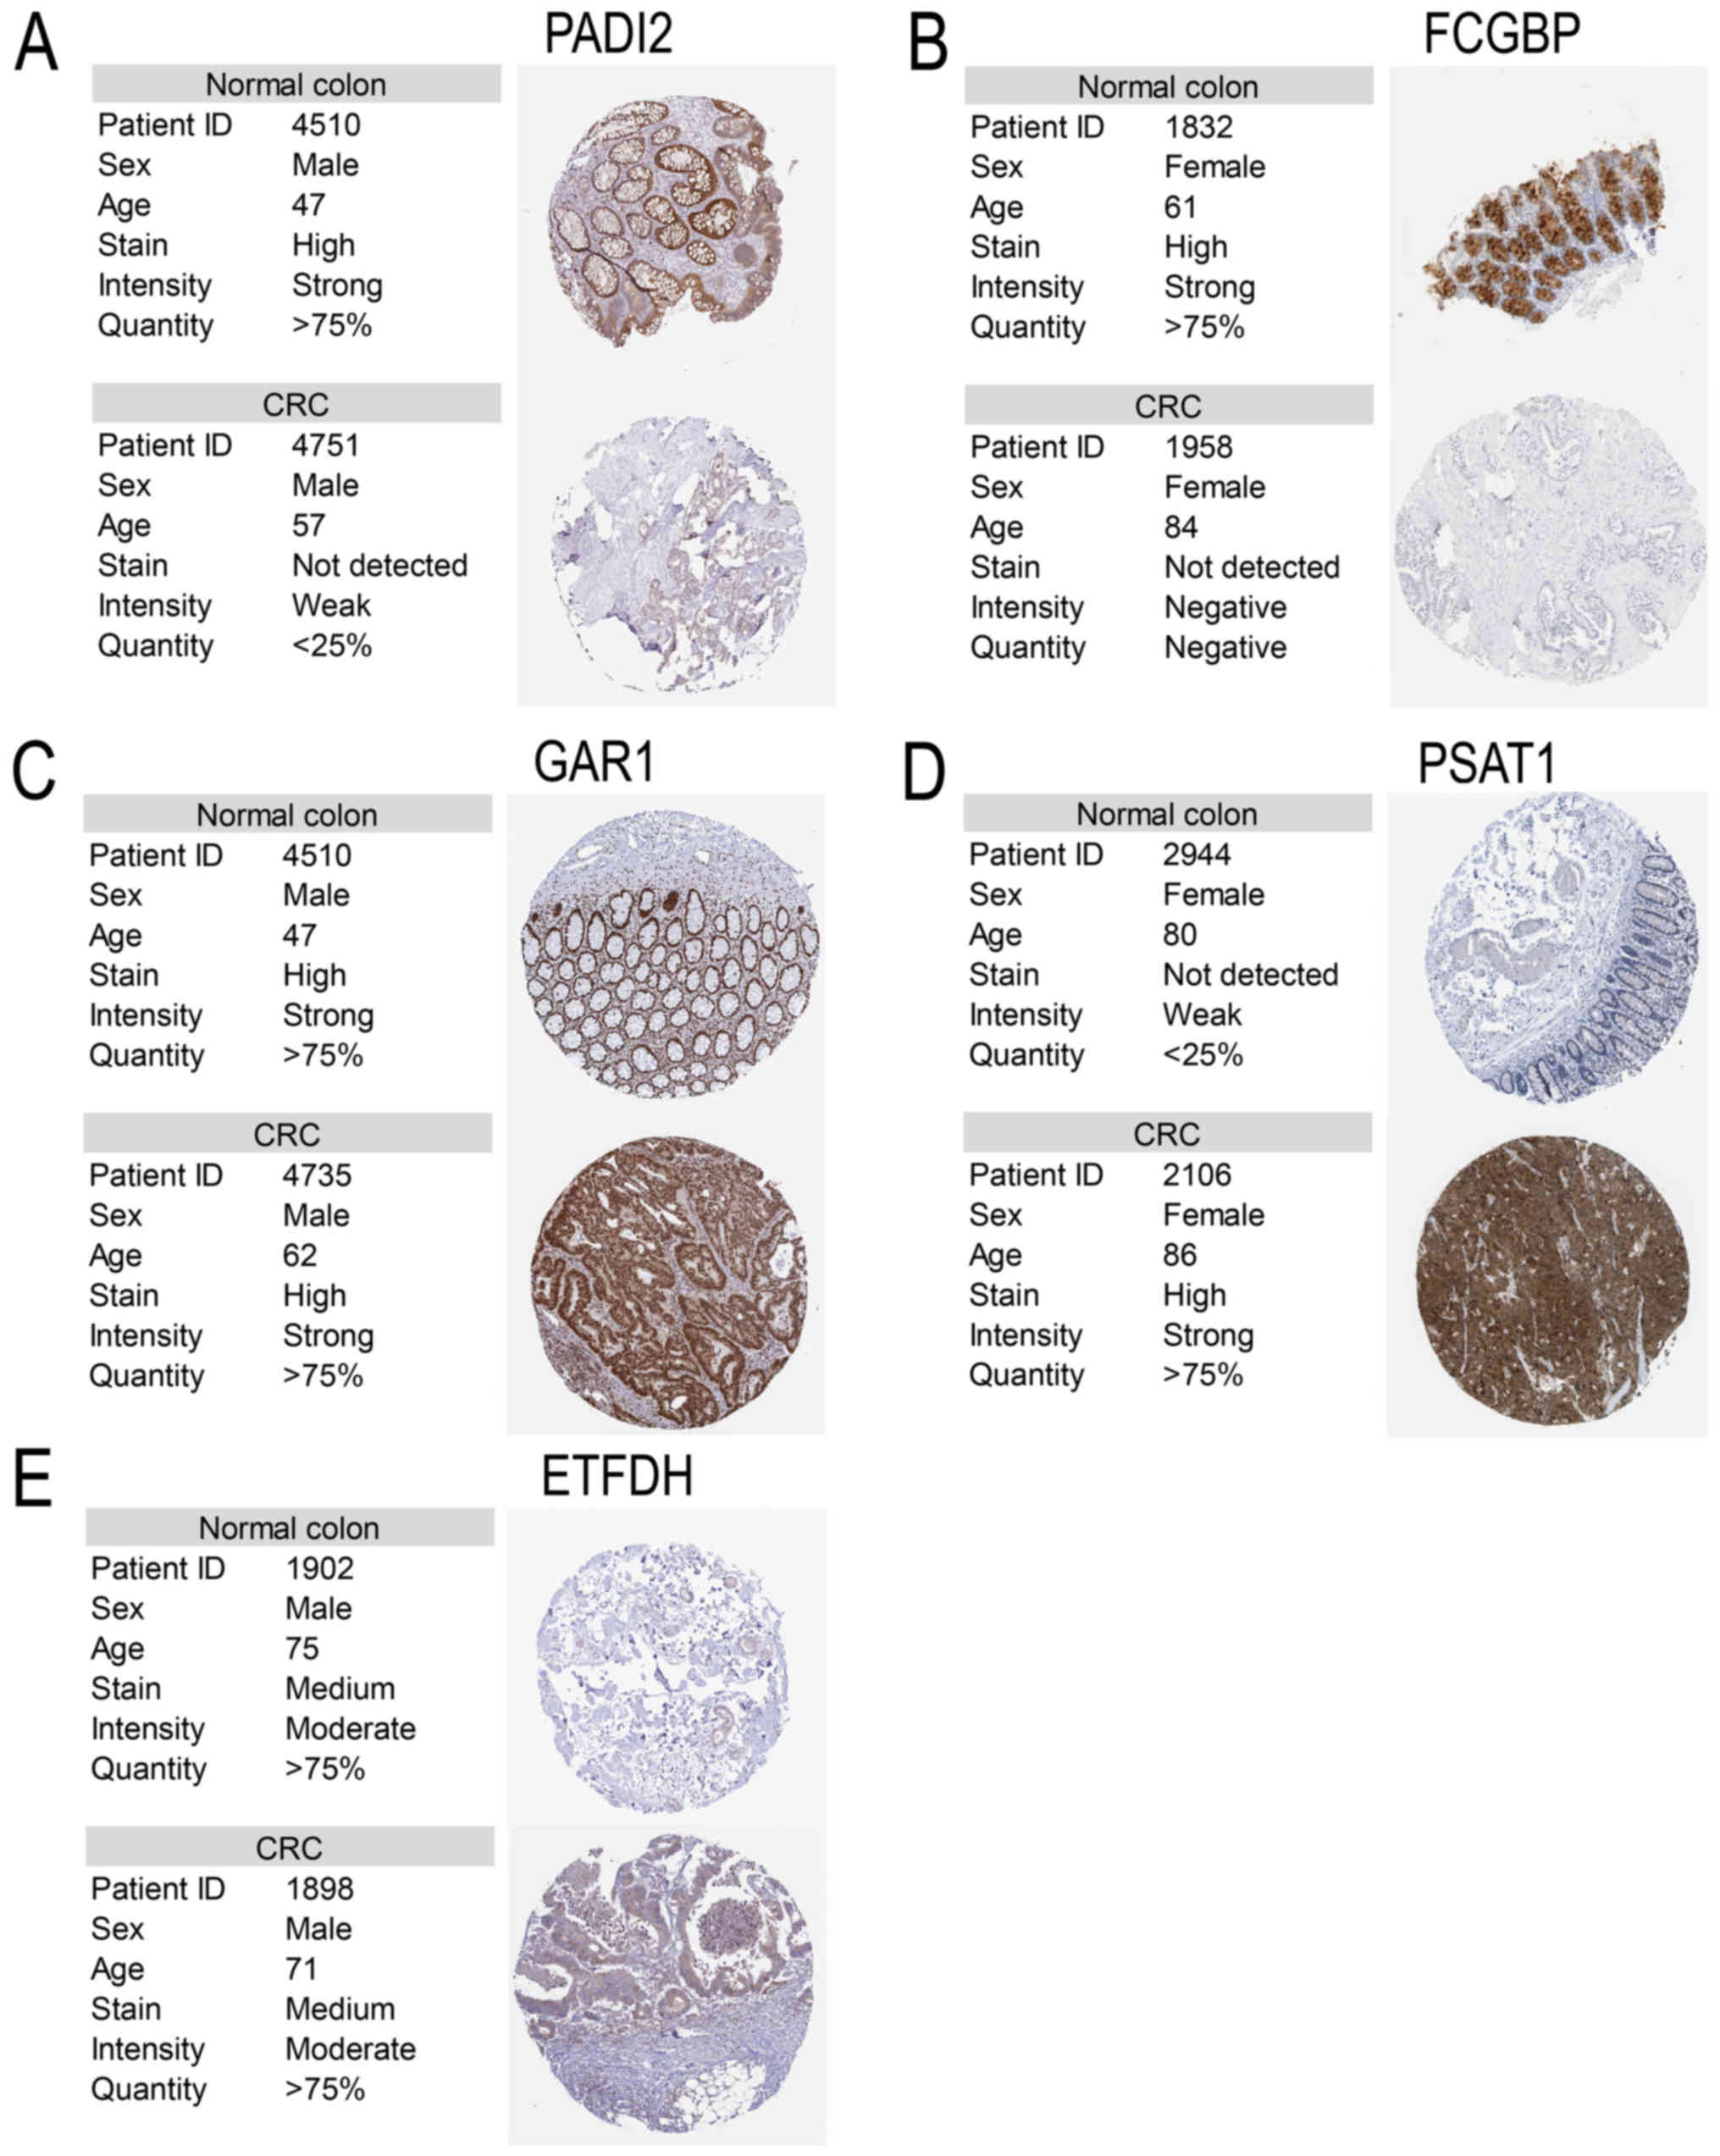 | Figure 6Pathological images of critical
targets. The pathological and normal images of (A) PADI2, (B)
FCGBP, (C) GAR1, (D) PSAT1 and (E) ETFDH. The information was
obtained from the Human Protein Atlas. Magnification, x20. PADI2,
protein-arginine deaminase type-2; FCGBP, Fc fragment of IgG
binding protein; GAR1, GAR1 ribonucleoprotein; PSAT1, phosphoserine
aminotransferase; ETFDH, electron-transfer flavoprotein-ubiquinone
oxidoreductase; CRC, colorectal cancer. |
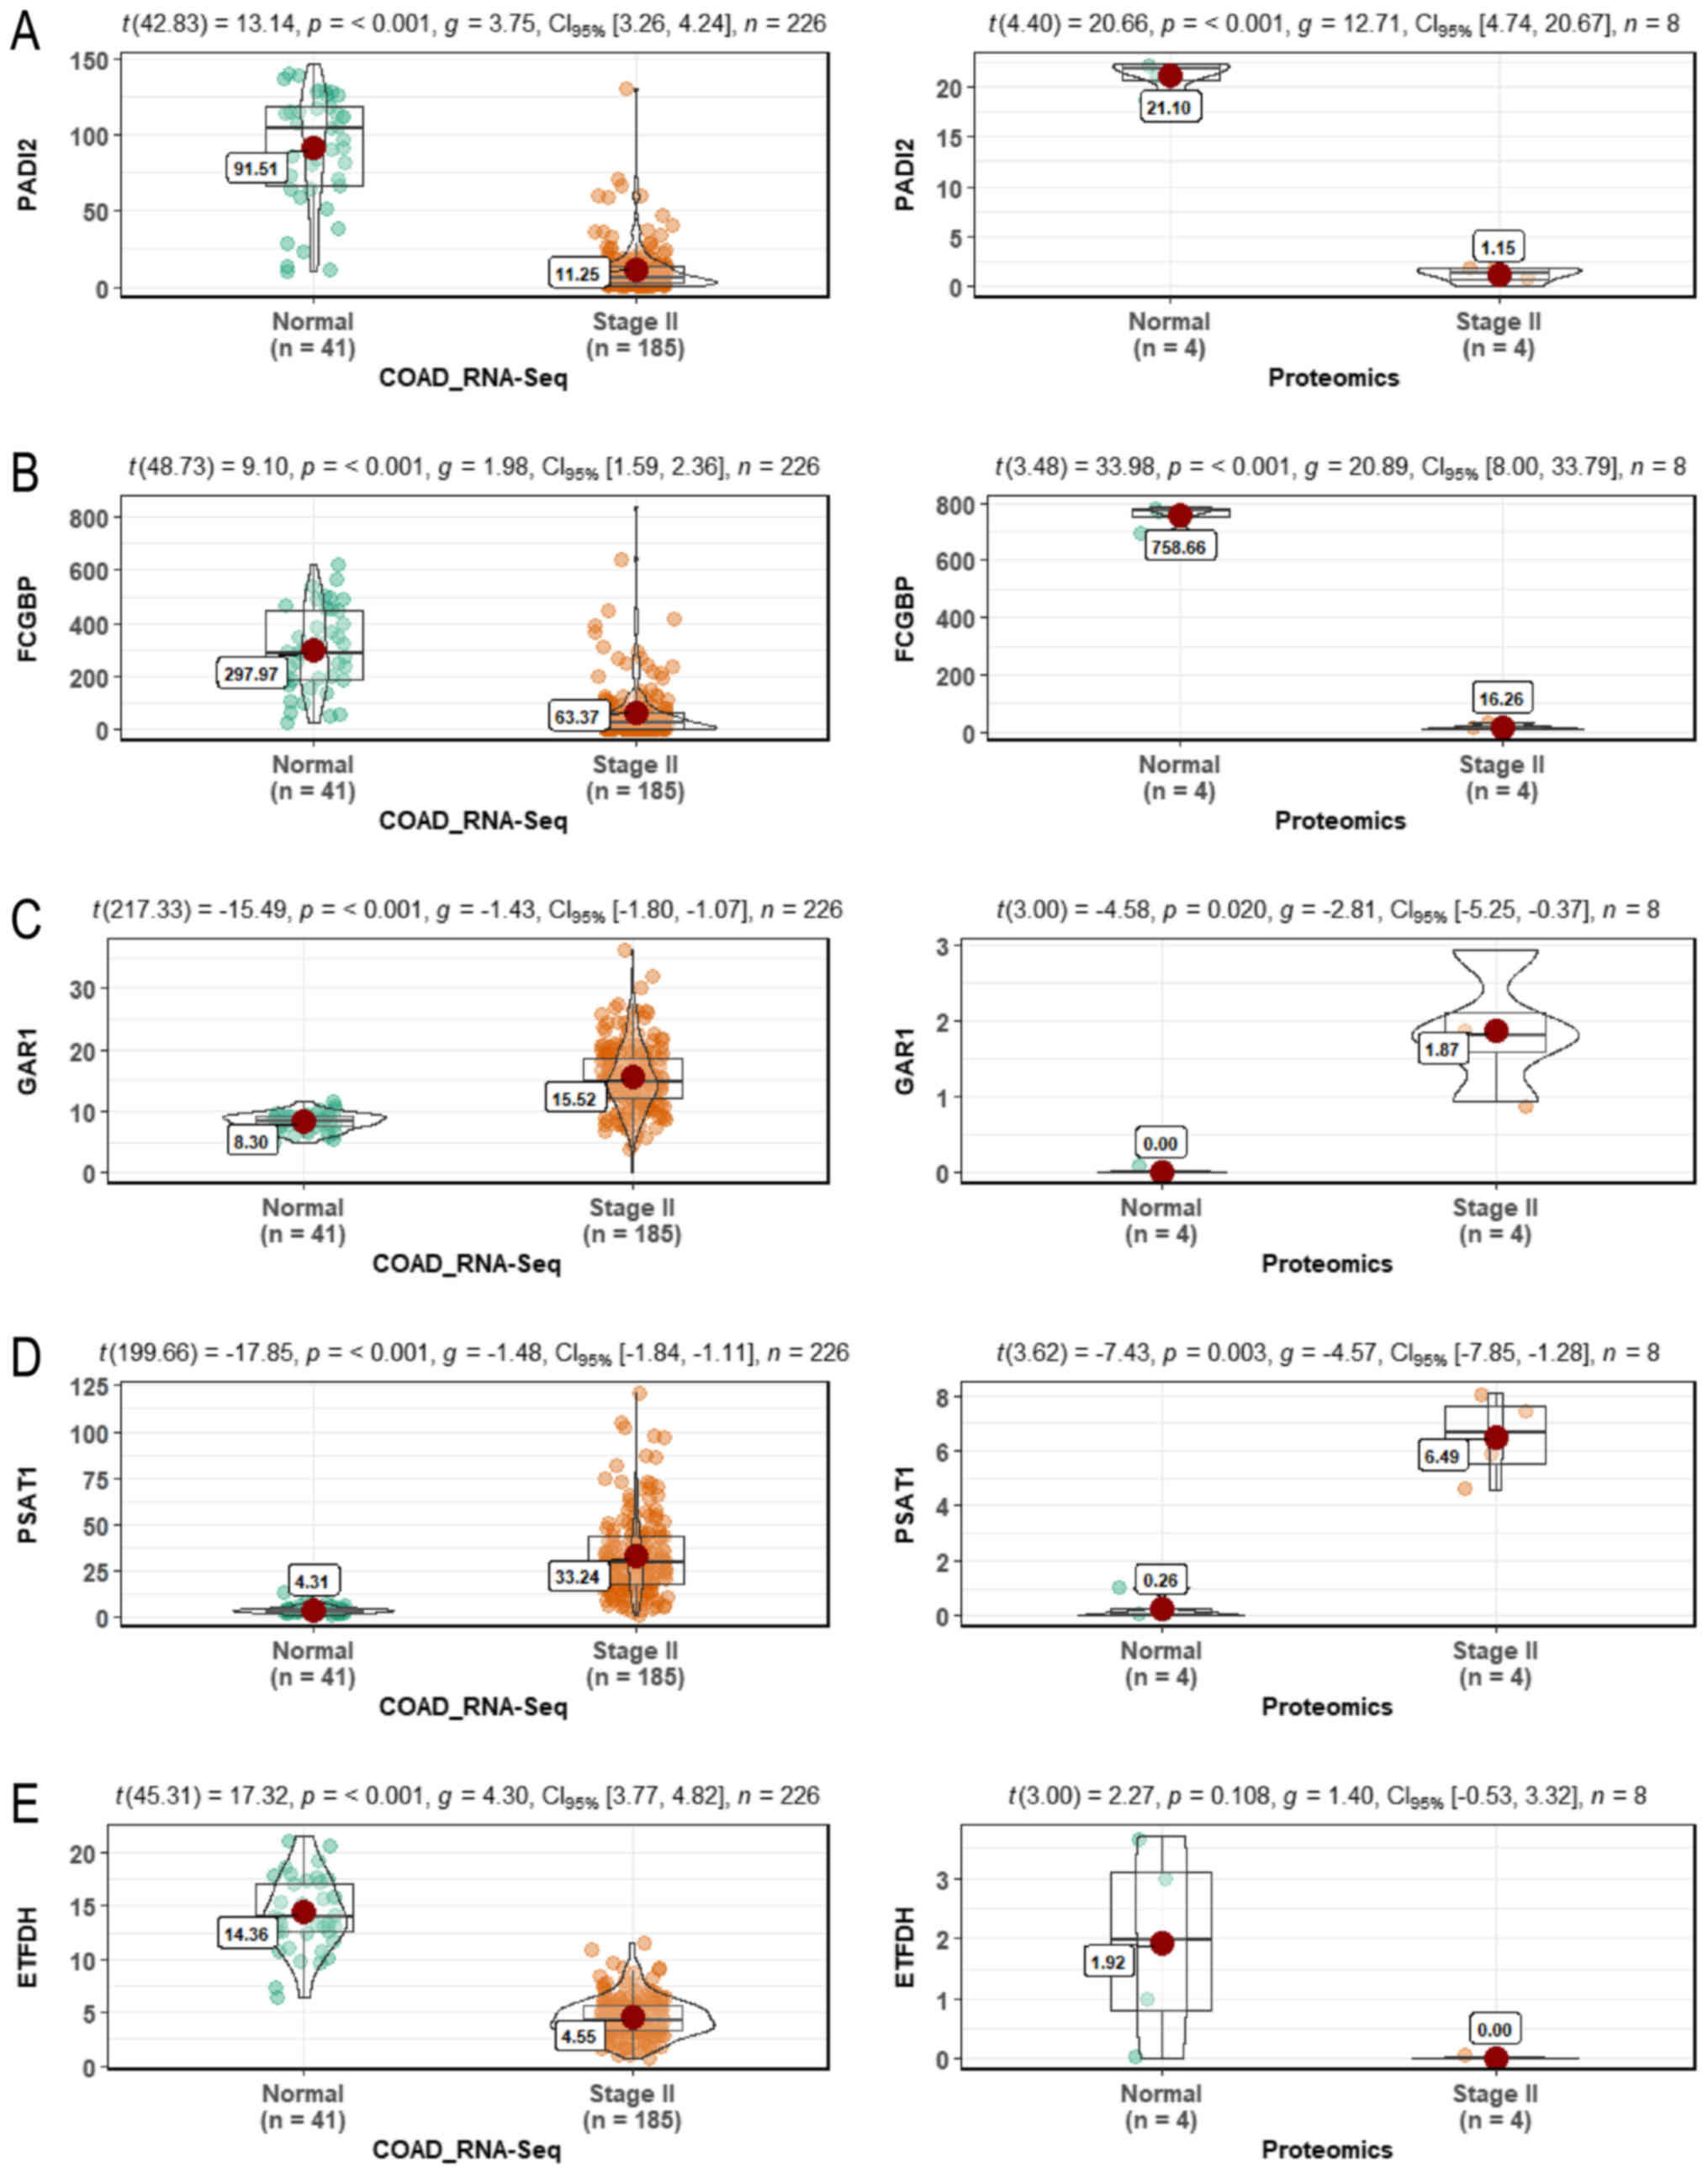 | Figure 7Statistical analysis of critical
targets. Statistical analysis of (A) PADI2 (P<0.001 in RNA-Seq
and P<0.001 in proteomics), (B) FCGBP (P<0.001 in RNA-Seq and
P<0.001 in proteomics), (C) GAR1 (P<0.001 in RNA-Seq and
P=0.020 in proteomics), (D) PSAT1 (P<0.001 in RNA-Seq and
P=0.003 in proteomics) and (E) ETFDH (P<0.001 in RNA-Seq and
P=0.108 in proteomics). PADI2, protein-arginine deaminase type-2;
FCGBP, Fc fragment of IgG binding protein; GAR1, GAR1
ribonucleoprotein; PSAT1, phosphoserine aminotransferase; ETFDH,
electron-transfer flavoprotein-ubiquinone oxidoreduc-tase; RNA-Seq,
RNA-Sequencing; COAD, colon adenocarcinoma. |
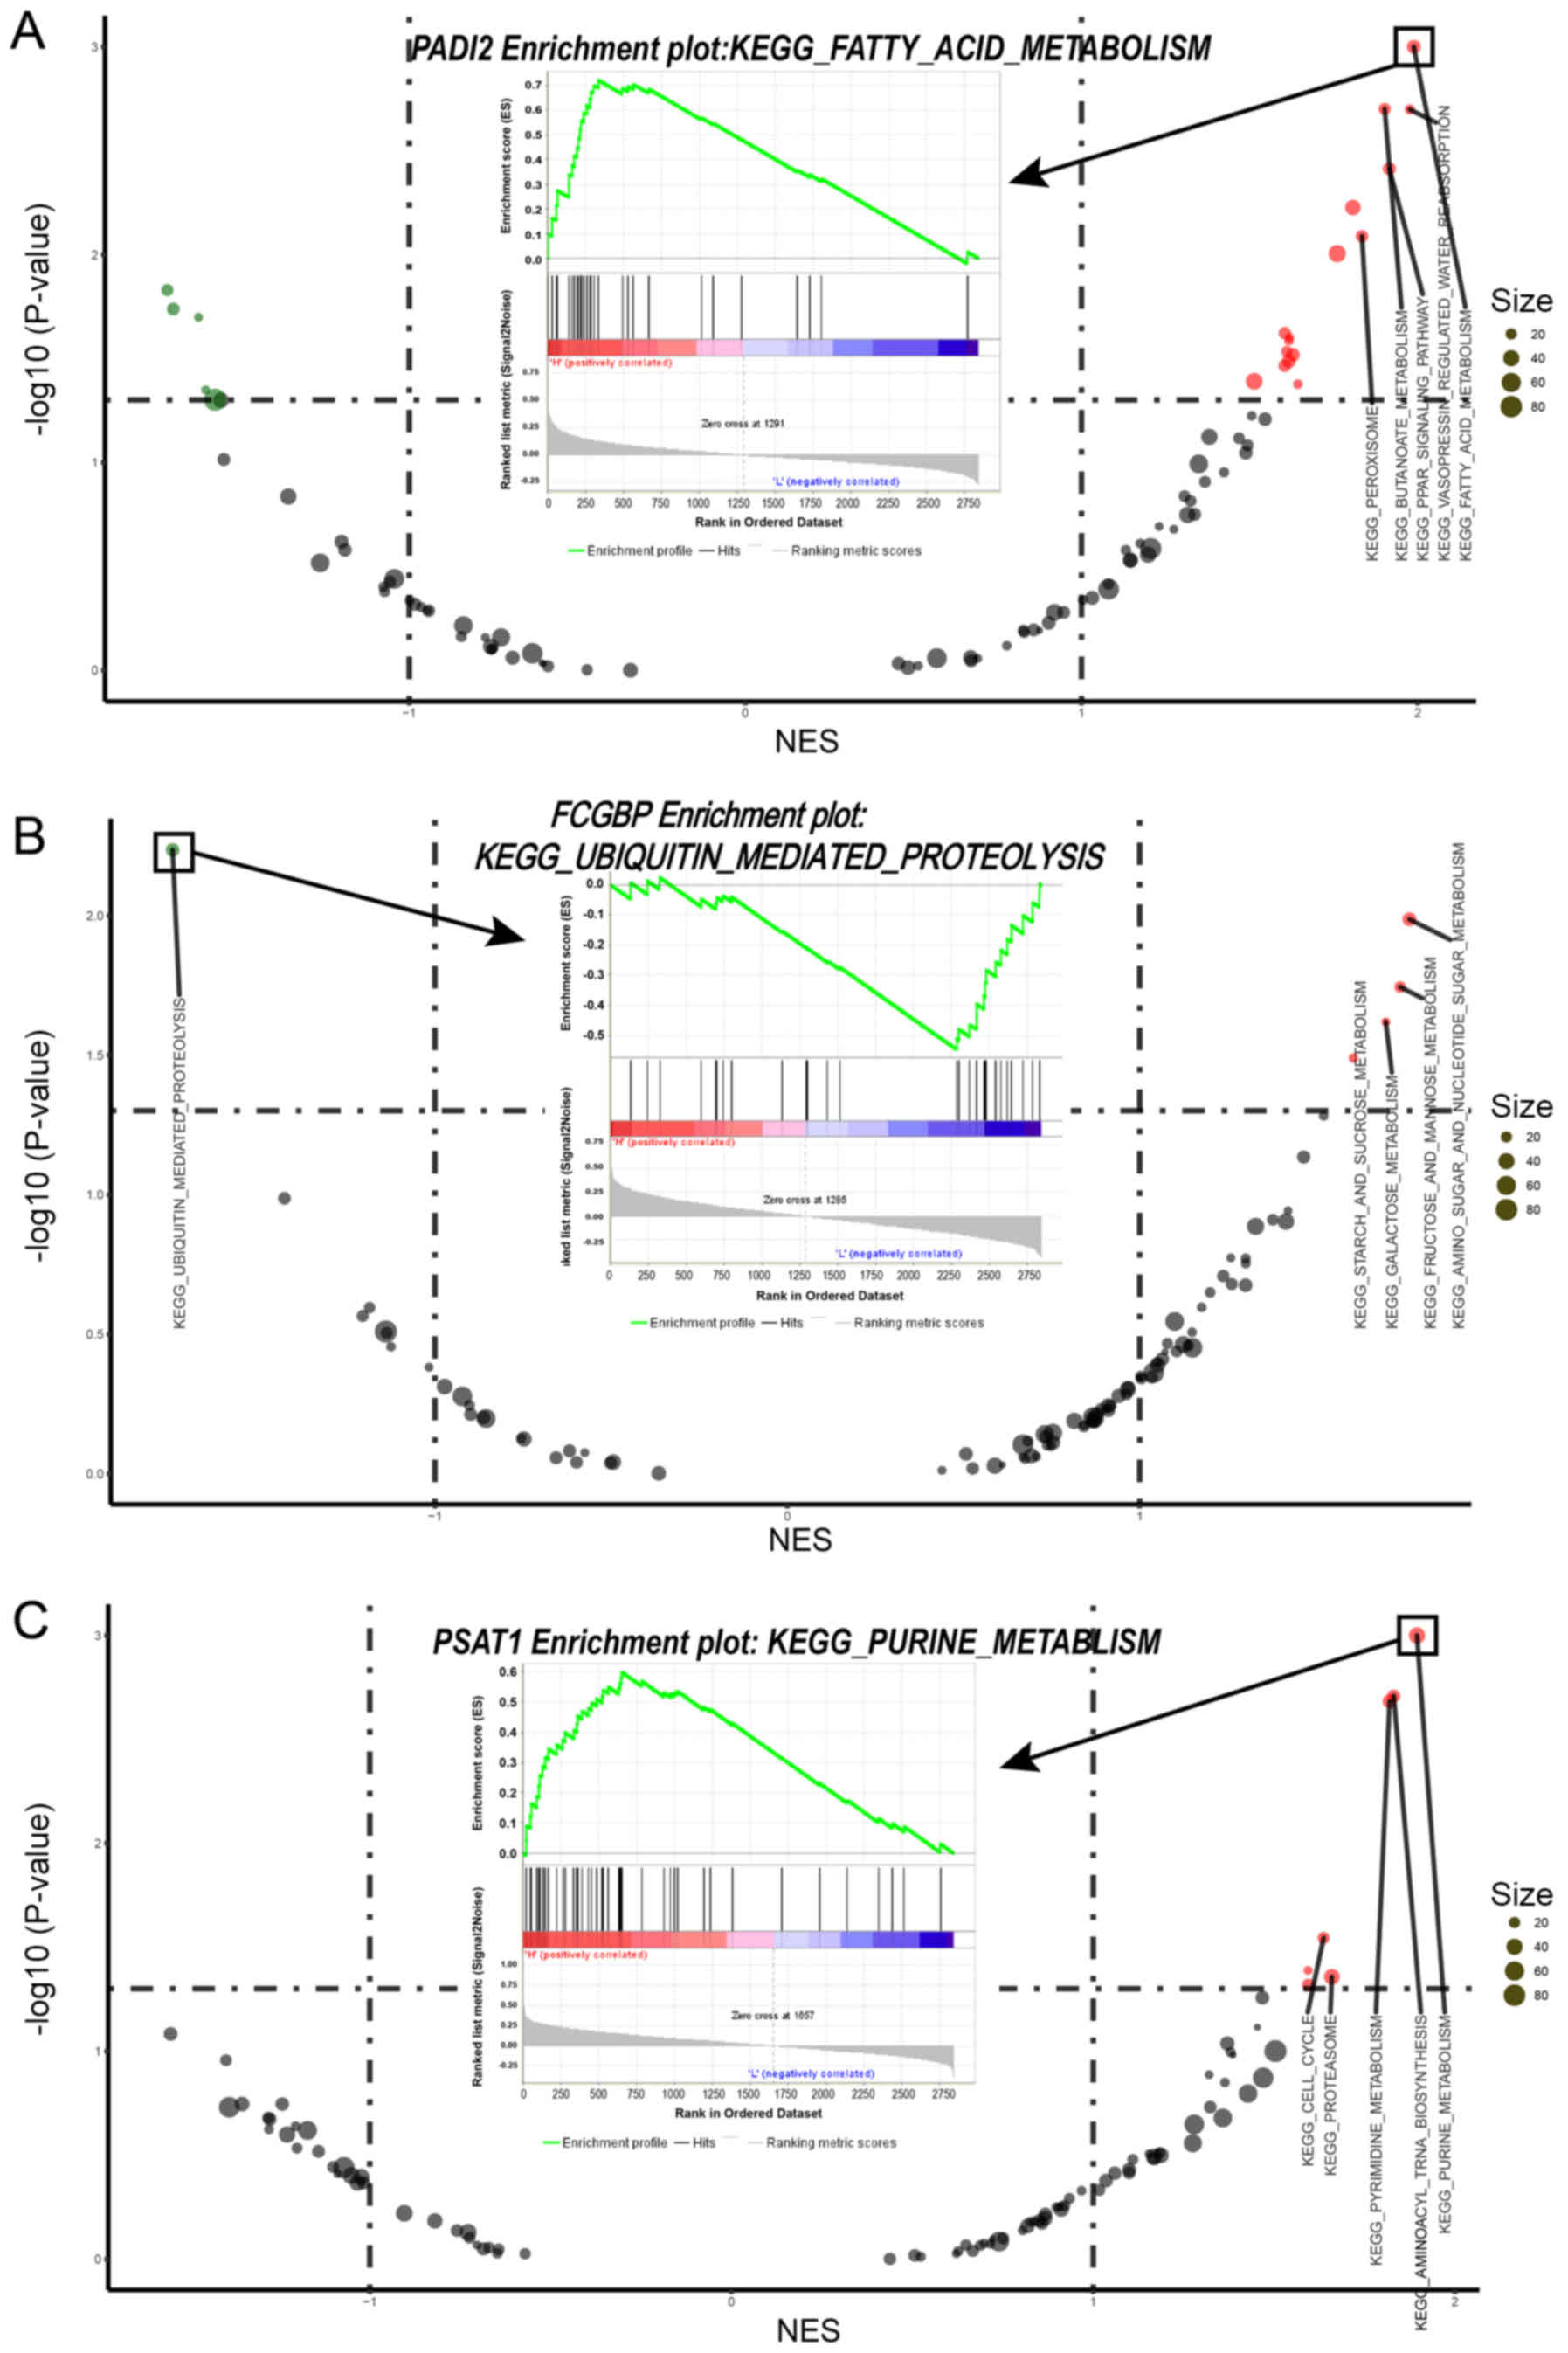
Biological function and protein classes of potential
gene targets. The results of the GSEA indicated that alterations in
PADI2 were most likely to affect 'fatty acid metabolism', changes
in FCGBP were most likely to influence 'ubiquitin mediated
proteolysis' and alterations in PSAT1 were most likely to lead to
changes in the 'purine metabolism' pathway (Fig. 9). In the HPA database, PADI2 was
predicted as an intracellular protein; FCGBP was predicted as a
secreted protein and an intracellular protein, while PSAT1 was
determined to be a plasma protein and a predicted intracellular
protein.
Discussion
In the present study, potential targets (PADI2,
FCGBP and PSAT1) were identified in stage II CRC. In addition,
pathological images and survival analysis confirmed the function of
these targets. A large amount of RNA-Seq data were accumulated from
previous studies (35-37); at present, few CRC-related
proteomics analyses have been conducted to the best of our
knowledge. In the present study, WGCNA was conducted to analyze
RNA-Seq data. WGCNA focused on the expression pattern, while the
differential expression analysis revealed differences between tumor
and normal tissue. The information obtained from the data was
extracted by selecting the most appropriate method of analysis.
Although the number of samples was low, differences in the
proteomics data of 21 patients with stage II CRC were analyzed. In
addition, stage II CRC stage-related key genes were screened by
determining overlapping DEPs and mRNAs in the hub module. Of note,
proteins mainly execute biological processes; alterations in
proteins can reflect dysfunctional biological processes in cancer.
Proteomics and RNA-Seq data were combined prior to screening
potential targets in stage II CRC. The GO enrichment analysis
revealed that the activation of the immune system is vital in stage
II CRC, involving regulation of neutrophil and 'complement
activation' in particular. On the contrary, inflammatory cells are
an essential part of the tumor microenvironment, especially
neutrophils (38,39). A previous study demonstrated that
the density of tumor-associated neutrophils in late CRC was
significantly lower than early stage CRC (40). Of note, it has been suggested that
complement activation may facilitate the development of CRC
(41-43). In addition, the presence of
neutrophils was associated with the prognosis of this disease
(44-46).
In the present study, the PPI network revealed the
expression of components between the proteomics and RNA-Seq data to
be similar. A total of six critical targets (PADI2 in cluster 1 and
FCGBP in cluster 2) were selected from the PPI network that was
constructed with key genes; five of the key targets were identified
in the HPA database. Furthermore, PADI2, FCGBP and PSAT1 notably
differed between the pathological images and the normal tissue
images; PADI2 and FCGBP were associated with prognosis. Through
signal-gene GSEA, PADI2 tended to affect 'fatty acid metabolism';
FCGBP changes were most likely to influence 'ubiquitin mediated
proteolysis'; and PSAT1 changes were most likely to lead to changes
in the 'purine metabolism' pathway.
Certain findings of the present study were
consistent with previous literature. PADI2 was downregulated in CRC
tissue; the occurrence of early CRC has been associated with
downregulated PADI2 (47,48) and indicated poor prognosis
(49,50). It was demonstrated that PADI2 could
enhance the effect of nitazoxanide in promoting β-catenin
citrullination and inhibiting Wnt signaling in cancer, and this
effect was observed in CRC (51).
It was previously identified that FCGBP was associated with
immunity as a component of intestinal mucus, which forms the
first-line of defense in the gastrointestinal tract (52,53).
Previous studies have revealed that transforming growth factor-β
(TGF-β) molecules were involved in the inhibition of FCGBP
expression, which in turn affected the occurrence of various cancer
types, including CRC (54),
gallbladder cancer (55) and head
and neck squamous-cell carcinoma (56). Additionally, cross talk between the
Wnt and TGF-β signaling pathways has been reported to be involved
in regulating epithelial-mesenchymal transition (57,58).
Wnt and TGF-β were associated with consensus molecular subtypes of
CRC (59). Of note, PADI2 and
FGCBP were particularly prominent in the present results. In
addition, PSAT1 was upregulated in CRC tissue, and overexpression
of PSAT1 could promote the progression of CRC (60,61).
Based on the HPA database, PADI2 was predicted as an intracellular
protein; FCGBP was predicted as a secreted protein and an
intracellular protein, while PSAT1 was determined to be a plasma
protein and a predicted intracellular protein. Whether these
potential targets in the serum were similar to those in cancer
tissue remain unknown; however, PADI2 and FCGBP may be considered
as potential biomarkers for the prognosis of CRC. There were some
limitations of the present study. The proteomics data were derived
from Chinese patients and the mRNA expression data were derived
from TCGA-COAD (including African American, Caucasian and Asian).
While the ethnic differences could have potential effects.
Therefore, the analysis was selected to assess the two types of
data to ensure that the potential target screened are meaningful.
However, functional enrichment analysis of key genes only provides
more general results. The function of the gene is instructive for
further research. Although experimental validation was not
performed in the present study, a single-gene GSEA was conducted to
obtain more accurate functional annotations.
In summary, three potential early stage CRC-related
targets (PADI2, FCGBP and PSAT1) were identified by combining
proteomics and transcriptomics data. These targets could be applied
in screening for early stage CRC. Furthermore, the present findings
may provide a basis for further investigation into the mechanism
underlying the occurrence of CRC.
Supplementary Data
Abbreviations:
|
BP
|
biological process
|
|
CN
|
adjacent normal tissues
|
|
COAD
|
colon adenocarcinoma
|
|
CRC
|
colorectal cancer
|
|
CT
|
stage II CRC tissues
|
|
DEP
|
differentially expressed protein
|
|
ETFDH
|
electron-transfer
flavoprotein-ubiquinone oxidoreductase
|
|
FC
|
fold change
|
|
FCGBP
|
Fc fragment of IgG binding protein
|
|
FDR
|
false discovery rate
|
|
GAR1
|
GAR1 ribonucleoprotein
|
|
GO
|
Gene Ontology
|
|
GS
|
gene significance
|
|
GSEA
|
Gene Set Enrichment Analysis
|
|
HPA
|
Human Protein Atlas
|
|
METTL7A
|
methyltransferase-like 7A
|
|
MM
|
molecular membership
|
|
NES
|
normalized enrichment score
|
|
PADI2
|
protein-arginine deiminase type-2
|
|
PPI
|
protein-protein interaction
|
|
PSAT1
|
phosphoserine aminotransferase 1
|
|
RNA-Seq
|
RNA-Sequencing
|
|
TCGA
|
The Cancer Genome Atlas
|
|
TGF-β
|
transforming growth factor-β
|
|
WGCNA
|
weighted correlation network
analysis
|
Acknowledgments
Not applicable.
Funding
The present study was funded by the National Natural
Science Foundation of China (grant no. 81472030), Jilin Province
Science and Technology Department (grant no. 20180101267JC) and
Graduate Innovation Fund of Jilin University (grant no.
101832018C070).
Availability of data and materials
The mRNA expression profiles of colon adenocarcinoma
were downloaded from The Cancer Genome Atlas (https://cancergenome.nih.gov/).
Authors' contributions
NL, KZ and TL conceived and designed the
experiments. WY, JS, YZ and FZ performed the experiments. WY
analyzed the data. WY and JS wrote the manuscript. WY, JS, TL, FZ,
KZ and NL modified the manuscript.
Ethics approval and consent to
participate
Patients provided informed consent before surgery.
The present study was approved by The Clinical Research Ethics
Committee of the Second Hospital of Jilin University.
Patient consent for publication
All patients have provided written informed consent
for the publication of any associated data and accompanying
images.
Competing interests
The authors declare that they have no competing
interests.
References
|
1
|
Brody H: Colorectal cancer. Nature.
521:S12015. View
Article : Google Scholar : PubMed/NCBI
|
|
2
|
Ferlay J, Soerjomataram I, Dikshit R, Eser
S, Mathers C, Rebelo M, Parkin DM, Forman D and Bray F: Cancer
incidence and mortality worldwide: Sources methods and major
patterns in GLOBOCAN 2012. Int J Cancer. 136:E359–E386. 2015.
View Article : Google Scholar
|
|
3
|
Arnold M, Sierra MS, Laversanne M,
Soerjomataram I, Jemal A and Bray F: Global patterns and trends in
colorectal cancer incidence and mortality. Gut. 66:683–691. 2017.
View Article : Google Scholar
|
|
4
|
Weinberg BA, Marshall JL and Salem ME: The
Growing Challenge of Young Adults With Colorectal Cancer. Oncology
(Williston Park). 31:381–389. 2017.
|
|
5
|
Bray F, Ferlay J, Soerjomataram I, Siegel
RL, Torre LA and Jemal A: Global cancer statistics 2018: GLOBOCAN
estimates of incidence and mortality worldwide for 36 cancers in
185 countries. CA Cancer J Clin. 68:394–424. 2018. View Article : Google Scholar : PubMed/NCBI
|
|
6
|
Osterman E and Glimelius B: Recurrence
risk after up- to- date colon cancer staging, surgery, and
pathology: Analysis of the entire Swedish population. Dis Colon
Rectum. 61:1016–1025. 2018. View Article : Google Scholar : PubMed/NCBI
|
|
7
|
Roncucci L and Mariani F: Prevention of
colorectal cancer: How many tools do we have in our basket? Eur J
Intern Med. 26:752–756. 2015. View Article : Google Scholar : PubMed/NCBI
|
|
8
|
Aran V, Victorino AP, Thuler LC and
Ferreira CG: Colorectal cancer: Epidemiology, disease mechanisms
and interventions to reduce onset and mortality. Clin Colorectal
Cancer. 15:195–203. 2016. View Article : Google Scholar : PubMed/NCBI
|
|
9
|
Stoffel EM and Boland CR: Genetics and
genetic testing in hereditary colorectal cancer. Gastroenterology.
149:1191–1203.e2. 2015. View Article : Google Scholar : PubMed/NCBI
|
|
10
|
Jones PA and Baylin SB: The epigenomics of
cancer. Cell. 128:683–692. 2007. View Article : Google Scholar : PubMed/NCBI
|
|
11
|
Naldini L: Gene therapy returns to centre
stage. Nature. 526:351–360. 2015. View Article : Google Scholar : PubMed/NCBI
|
|
12
|
Wu L, Johnson M and Sato M:
Transcriptionally targeted gene therapy to detect and treat cancer.
Trends Mol Med. 9:421–429. 2003. View Article : Google Scholar : PubMed/NCBI
|
|
13
|
Mair B, Kubicek S and Nijman SM:
Exploiting epigenetic vulnerabilities for cancer therapeutics.
Trends Pharmacol Sci. 35:136–145. 2014. View Article : Google Scholar : PubMed/NCBI
|
|
14
|
Dalerba P, Sahoo D, Paik S, Guo X, Yothers
G, Song N, Wilcox- Fogel N, Forgó E, Rajendran PS, Miranda SP, et
al: CDX2 as a prognostic biomarker in stage II and stage III colon
cancer. N Engl J Med. 374:211–222. 2016. View Article : Google Scholar : PubMed/NCBI
|
|
15
|
Mo A, Jackson S, Varma K, Carpino A,
Giardina C, Devers TJ and Rosenberg DW: Distinct transcriptional
changes and epithelial-stromal interactions are altered in
early-stage colon cancer development. Mol Cancer Res. 14:795–804.
2016. View Article : Google Scholar : PubMed/NCBI
|
|
16
|
Lucena- Cacace A, Otero-Albiol D,
Jiménez-García MP, Muñoz-Galvan S and Carnero A: NAMPT is a potent
oncogene in colon cancer progression that modulates cancer stem
cell properties and resistance to therapy through Sirt1 and PARP.
Clin Cancer Res. 24:1202–1215. 2018. View Article : Google Scholar
|
|
17
|
Tomczak K, Czerwińska P and Wiznerowicz M:
The Cancer Genome Atlas (TCGA): An immeasurable source of
knowledge. Contemp Oncol (Pozn). 19:A68–A77. 2015.
|
|
18
|
Uhlén M, Fagerberg L, Hallström BM,
Lindskog C, Oksvold P, Mardinoglu A, Sivertsson Å Kampf C, Sjöstedt
E, Asplund A, et al: Proteomics. Tissue-based map of the human
proteome. Science. 347:12604192015. View Article : Google Scholar : PubMed/NCBI
|
|
19
|
Thul PJ, Åkesson L, Wiking M, Mahdessian
D, Geladaki A, Ait Blal H, Alm T, Asplund A, Björk L, Breckels LM,
et al: A subcellular map of the human proteome. Science.
356:3562017. View Article : Google Scholar
|
|
20
|
Uhlen M, Zhang C, Lee S, Sjöstedt E,
Fagerberg L, Bidkhori G, Benfeitas R, Arif M, Liu Z, Edfors F, et
al: A pathology atlas of the human cancer transcriptome. Science.
357:3572017. View Article : Google Scholar
|
|
21
|
Langfelder P and Horvath S: WGCNA: An R
package for weighted correlation network analysis. BMC
Bioinformatics. 9:5592008. View Article : Google Scholar : PubMed/NCBI
|
|
22
|
Sun N, Sun W, Li S, Yang J, Yang L, Quan
G, Gao X, Wang Z, Cheng X, Li Z, et al: Proteomics analysis of
cellular proteins co- immunoprecipitated with nucleoprotein of
influenza A virus (H7N9). Int J Mol Sci. 16:25982–25998. 2015.
View Article : Google Scholar : PubMed/NCBI
|
|
23
|
Davis CA, Hitz BC, Sloan CA, Chan ET,
Davidson JM, Gabdank I, Hilton JA, Jain K, Baymuradov UK, Narayanan
AK, et al: The Encyclopedia of DNA elements (ENCODE): Data portal
update. Nucleic Acids Res. 46:D794–D801. 2018. View Article : Google Scholar :
|
|
24
|
Colaprico A, Silva TC, Olsen C, Garofano
L, Cava C, Garolini D, Sabedot TS, Malta TM, Pagnotta SM,
Castiglioni I, et al: TCGAbiolinks: An R/Bioconductor package for
integrative analysis of TCGA data. Nucleic Acids Res. 44:e712016.
View Article : Google Scholar :
|
|
25
|
Robinson MD, McCarthy DJ and Smyth GK:
edgeR: A Bioconductor package for differential expression analysis
of digital gene expression data. Bioinformatics. 26:139–140. 2010.
View Article : Google Scholar
|
|
26
|
McCarthy DJ, Chen Y and Smyth GK:
Differential expression analysis of multifactor RNA- Seq
experiments with respect to biological variation. Nucleic Acids
Res. 40:4288–4297. 2012. View Article : Google Scholar : PubMed/NCBI
|
|
27
|
Ito K and Murphy D: Application of ggplot2
to pharmacometric graphics. CPT Pharmacometrics Syst Pharmacol.
2:e792013. View Article : Google Scholar : PubMed/NCBI
|
|
28
|
Gene Ontology Consortium: Gene Ontology
Consortium: Going forward. Nucleic Acids Res. 43:D1049–D1056. 2015.
View Article : Google Scholar :
|
|
29
|
Yu G, Wang LG, Han Y and He QY:
clusterProfiler: An R package for comparing biological themes among
gene clusters. OMICS. 16:284–287. 2012. View Article : Google Scholar : PubMed/NCBI
|
|
30
|
Szklarczyk D, Morris JH, Cook H, Kuhn M,
Wyder S, Simonovic M, Santos A, Doncheva NT, Roth A, Bork P, et al:
The STRING database in 2017: Quality- controlled protein- protein
association networks, made broadly accessible. Nucleic Acids Res.
45:D362–D368. 2017. View Article : Google Scholar
|
|
31
|
von Mering C, Huynen M, Jaeggi D, Schmidt
S, Bork P and Snel B: STRING: A database of predicted functional
associations between proteins. Nucleic Acids Res. 31:258–261. 2003.
View Article : Google Scholar : PubMed/NCBI
|
|
32
|
Kanehisa M and Goto S: KEGG: Kyoto
encyclopedia of genes and genomes. Nucleic Acids Res. 28:27–30.
2000. View Article : Google Scholar
|
|
33
|
Mootha VK, Lindgren CM, Eriksson KF,
Subramanian A, Sihag S, Lehar J, Puigserver P, Carlsson E,
Ridderstråle M, Laurila E, et al: PGC-1alpha-responsive genes
involved in oxidative phosphorylation are coordinately
downregulated in human diabetes. Nat Genet. 34:267–273. 2003.
View Article : Google Scholar : PubMed/NCBI
|
|
34
|
Subramanian A, Tamayo P, Mootha VK,
Mukherjee S, Ebert BL, Gillette MA, Paulovich A, Pomeroy SL, Golub
TR, Lander ES, et al: Gene set enrichment analysis: A knowledge-
based approach for interpreting genome- wide expression profiles.
Proc Natl Acad Sci USA. 102:15545–15550. 2005. View Article : Google Scholar
|
|
35
|
Xu H, Wang C, Song H, Xu Y and Ji G: RNA-
Seq profiling of circular RNAs in human colorectal Cancer liver
metastasis and the potential biomarkers. Mol Cancer. 18:82019.
View Article : Google Scholar
|
|
36
|
Li XN, Wang ZJ, Ye CX, Zhao BC, Li ZL and
Yang Y: RNA sequencing reveals the expression profiles of circRNA
and indicates that circDDX17 acts as a tumor suppressor in
colorectal cancer. J Exp Clin Cancer Res. 37:3252018. View Article : Google Scholar : PubMed/NCBI
|
|
37
|
Jones MF, Hara T, Francis P, Li XL, Bilke
S, Zhu Y, Pineda M, Subramanian M, Bodmer WF and Lal A: The CDX1-
microRNA- 215 axis regulates colorectal cancer stem cell
differentiation. Proc Natl Acad Sci USA. 112:E1550–E1558. 2015.
View Article : Google Scholar
|
|
38
|
Triner D, Devenport SN, Ramakrishnan SK,
Ma X, Frieler RA, Greenson JK, Inohara N, Nunez G, Colacino JA,
Mortensen RM, et al: Neutrophils restrict tumor-associated
microbiota to reduce growth and invasion of colon tumors in mice.
Gastroenterology. 156:1467–1482. 2019. View Article : Google Scholar
|
|
39
|
Wu L, Saxena S, Awaji M and Singh RK:
Tumor- associated neutrophils in cancer: Going Pro. Cancers
(Basel). 11:112019. View Article : Google Scholar
|
|
40
|
Galdiero MR, Bianchi P, Grizzi F, Di Caro
G, Basso G, Ponzetta A, Bonavita E, Barbagallo M, Tartari S,
Polentarutti N, et al: Occurrence and significance of tumor-
associated neutrophils in patients with colorectal cancer. Int J
Cancer. 139:446–456. 2016. View Article : Google Scholar : PubMed/NCBI
|
|
41
|
Ning C, Li YY, Wang Y, Han GC, Wang RX,
Xiao H, Li XY, Hou CM, Ma YF, Sheng DS, et al: Complement
activation promotes colitis-associated carcinogenesis through
activating intestinal IL-1β/IL- 17A axis. Mucosal Immunol.
8:1275–1284. 2015. View Article : Google Scholar : PubMed/NCBI
|
|
42
|
Piao C, Zhang WM, Li TT, Zhang CC, Qiu S,
Liu Y, Liu S, Jin M, Jia LX, Song WC, et al: Complement 5a
stimulates macrophage polarization and contributes to tumor
metastases of colon cancer. Exp Cell Res. 366:127–138. 2018.
View Article : Google Scholar : PubMed/NCBI
|
|
43
|
Piao C, Cai L, Qiu S, Jia L, Song W and Du
J: Complement 5a enhances hepatic metastases of colon cancer via
monocyte chemoattractant protein-1-mediated inflammatory cell
infiltration. J Biol Chem. 290:10667–10676. 2015. View Article : Google Scholar : PubMed/NCBI
|
|
44
|
Wikberg ML, Ling A, Li X, Öberg Å, Edin S
and Palmqvist R: Neutrophil infiltration is a favorable prognostic
factor in early stages of colon cancer. Hum Pathol. 68:193–202.
2017. View Article : Google Scholar : PubMed/NCBI
|
|
45
|
Governa V, Trella E, Mele V, Tornillo L,
Amicarella F, Cremonesi E, Muraro MG, Xu H, Droeser R, Däster SR,
et al: The interplay between neutrophils and CD8+ T
cells improves survival in human colorectal cancer. Clin Cancer
Res. 23:3847–3858. 2017. View Article : Google Scholar : PubMed/NCBI
|
|
46
|
Zhou G, Peng K, Song Y, Yang W, Shu W, Yu
T, Yu L, Lin M, Wei Q, Chen C, et al: CD177+ neutrophils
suppress epithelial cell tumourigenesis in colitis-associated
cancer and predict good prognosis in colorectal cancer.
Carcinogenesis. 39:272–282. 2018. View Article : Google Scholar
|
|
47
|
Guo W, Zheng Y, Xu B, Ma F, Li C, Zhang X,
Wang Y and Chang X: Investigating the expression, effect and
tumorigenic pathway of PADI2 in tumors. OncoTargets Ther.
10:1475–1485. 2017. View Article : Google Scholar
|
|
48
|
Funayama R, Taniguchi H, Mizuma M,
Fujishima F, Kobayashi M, Ohnuma S, Unno M and Nakayama K: Protein-
arginine deiminase 2 suppresses proliferation of colon cancer cells
through protein citrullination. Cancer Sci. 108:713–718. 2017.
View Article : Google Scholar : PubMed/NCBI
|
|
49
|
Cantariño N, Musulén E, Valero V, Peinado
MA, Perucho M, Moreno V, Forcales SV, Douet J and Buschbeck M:
Downregulation of the deiminase PADI2 is an early event in
colorectal carcinogenesis and indicates poor prognosis. Mol Cancer
Res. 14:841–848. 2016. View Article : Google Scholar : PubMed/NCBI
|
|
50
|
Shangkuan WC, Lin HC, Chang YT, Jian CE,
Fan HC, Chen KH, Liu YF, Hsu HM, Chou HL, Yao CT, et al: Risk
analysis of colorectal cancer incidence by gene expression
analysis. PeerJ. 5:e30032017. View Article : Google Scholar : PubMed/NCBI
|
|
51
|
Qu Y, Olsen JR, Yuan X, Cheng PF, Levesque
MP, Brokstad KA, Hoffman PS, Oyan AM, Zhang W, Kalland KH, et al:
Small molecule promotes β-catenin citrullination and inhibits Wnt
signaling in cancer. Nat Chem Biol. 14:94–101. 2018. View Article : Google Scholar
|
|
52
|
Pelaseyed T, Bergström JH, Gustafsson JK,
Ermund A, Birchenough GM, Schütte A, van der Post S, Svensson F,
Rodríguez-Piñeiro AM, Nyström EE, et al: The mucus and mucins of
the goblet cells and enterocytes provide the first defense line of
the gastrointestinal tract and interact with the immune system.
Immunol Rev. 260:8–20. 2014. View Article : Google Scholar : PubMed/NCBI
|
|
53
|
Johansson ME, Thomsson KA and Hansson GC:
Proteomic analyses of the two mucus layers of the colon barrier
reveal that their main component, the Muc2 mucin, is strongly bound
to the Fcgbp protein. J Proteome Res. 8:3549–3557. 2009. View Article : Google Scholar : PubMed/NCBI
|
|
54
|
Lee S, Bang S, Song K and Lee I:
Differential expression in normal- adenoma- carcinoma sequence
suggests complex molecular carcinogenesis in colon. Oncol Rep.
16:747–754. 2006.PubMed/NCBI
|
|
55
|
Xiong L, Wen Y, Miao X and Yang Z: NT5E
and FcGBP as key regulators of TGF-1-induced epithelial-mesenchymal
transition (EMT) are associated with tumor progression and survival
of patients with gallbladder cancer. Cell Tissue Res. 355:365–374.
2014. View Article : Google Scholar
|
|
56
|
Wang Y, Liu Y, Liu H, Zhang Q, Song H,
Tang J, Fu J and Wang X: FcGBP was upregulated by HPV infection and
correlated to longer survival time of HNSCC patients. Oncotarget.
8:86503–86514. 2017.PubMed/NCBI
|
|
57
|
Zoni E, van der Pluijm G, Gray PC and
Kruithof- de Julio M: Epithelial plasticity in cancer: Unmasking a
MicroRNA Network for TGF-β-, Notch-, and Wnt-Mediated EMT. J Oncol.
2015:1989672015. View Article : Google Scholar
|
|
58
|
Chiu HC, Li CJ, Yiang GT, Tsai AP and Wu
MY: Epithelial to mesenchymal transition and cell biology of
molecular regulation in endometrial carcinogenesis. J Clin Med.
8:82019. View Article : Google Scholar
|
|
59
|
Guinney J, Dienstmann R, Wang X, de
Reyniès A, Schlicker A, Soneson C, Marisa L, Roepman P, Nyamundanda
G, Angelino P, et al: The consensus molecular subtypes of
colorectal cancer. Nat Med. 21:1350–1356. 2015. View Article : Google Scholar : PubMed/NCBI
|
|
60
|
Vié N, Copois V, Bascoul-Mollevi C, Denis
V, Bec N, Robert B, Fraslon C, Conseiller E, Molina F, Larroque C,
et al: Overexpression of phosphoserine aminotransferase PSAT1
stimulates cell growth and increases chemoresistance of colon
cancer cells. Mol Cancer. 7:142008. View Article : Google Scholar : PubMed/NCBI
|
|
61
|
Ma L, Tao Y, Duran A, Llado V, Galvez A,
Barger JF, Castilla EA, Chen J, Yajima T, Porollo A, et al: Control
of nutrient stress- induced metabolic reprogramming by PKCζ in
tumorigenesis. Cell. 152:599–611. 2013. View Article : Google Scholar : PubMed/NCBI
|