Introduction
Multiple myeloma (MM) is a hematological malignancy
comprising of plasma cell deformation and overproduction of
non-functional antibodies (1). MM
is the second most prevalent blood cancer, which accounted for 13%
cases of all hematological malignancies throughout the world in
2011 (2). Infiltration of
cancerous plasma cells or deposition of paraproteins in different
organs, such as the kidney and in bones, is the characteristic
feature of MM (3-5). Besides these features, symptoms like
anemia, bone pain, kidney failure and immune deficiency are usually
observed in MM (6). MM is a
heterogeneous hematological malignancy and various factors are
responsible for its manifestation, such as translocations
[t(11;14), t(6;14), t(4;14), t(14;16), and t(14;20)] (7) and hyperdiploidy of certain
chromosomes i.e., 3, 5, 7, 9, 11, 15 and 19 (8,9).
However, proteins, such as CD138, HDAC-6, KSP1, AKT3, XPO1, PIM
kinase, are considered to be therapeutic targets for MM that are
associated with the pathogenesis of MM (10). Despite the advancement in treatment
of cancer, MM still has a poor prognosis and is incurable in most
cases (11).
The lack of highly-reliable markers for the early
and precise diagnosis of hematological malignancies, such as MM,
suggests that novel strategies are required to discover novel and
reliable biomarkers for the early diagnosis and intervention to
reduce the disease burden. Novel theranostic biosignatures would be
one such strategy. Proteomic alterations are well-known to be
associated with various diseases, including several cancers. For
example, α-fetoprotein protein expression levels were found to be
altered in hepatocellular and non-seminomatous testicular cancers;
CA125 protein levels were increased in ovarian, cervical, uterine
and fallopian tube malignancies; prostate specific antigen levels
were increased in prostate cancer and thyroglobulin protein levels
were found to be upregulated in Grave's disease (12-14).
Mass spectrometry based proteomics serves as a promising approach
to explore and identify the alterations in expression and
post‑translational modifications of the proteins in the tissues,
body fluids, and cells from the patient (12,13,15-18).
Investigating the important differentially regulated proteins and
validating their functional role in the occurrence and progression
of the disease could lead to the identification of novel
theranostic targets.
Previously, studies have been performed in MM by
investigating the serum proteomic alterations to explore the
markers for this disease. Proteins, such as immunoglobulin heavy
constant μ, proto-oncogene diffuse B-cell lymphoma, 26S protease
regulatory subunit 4, serum albumin and hapto-globin were found to
be decreased in samples obtained from patients with MM, while
actin-related protein 2/3 complex subunit 1A, immunoglobulin heavy
constant γ 1, fibrinogen α chain fragment D and zinc finger protein
70 were found to be increased (19,20).
Similarly, MM cell lines were used to identify novel therapeutic
targets for MM (21,22). Recently, exportin‑1 (XPO1) has been
identified as a potential therapeutic target of bortezomib-mediated
chemoresistance in MM using the RPMI-8226 cell line model (23). Surprisingly, the actual site of the
origin of MM i.e., mononuclear cells (MNCs) has not currently been
explored to identify the proteome alterations for this disease.
MNCs may serve as the most appropriate cell for the identification
of a dysregulated protein signature for MM that can be useful for
designing novel therapeutic interventions for MM.
In the present study, the aim was to identify the
proteomic alterations in MM MNCs using the label-free quantitative
(LFQ) proteomic approach, which may play a crucial role in the
occurrence and progression of MM.
Materials and methods
Sample collection and allocation
The present study was approved by the Ethical
Committee of National Centre for Cell Science and Armed Forces
Medical College (Pune, India; Institutional Review Board no.
NCCS/IEC/2016-I/8). All experiments were performed according to the
guidelines of ethical principles for medical research involving
human subjects mentioned in the World Medical Association
Declaration of Helsinki. Written informed consent was provided by
all the patients recruited into the present study prior to
collection of bone marrow aspirate samples. Serum protein
electrophoresis (24), free
light-chain diagnosis (25) and
visualization of deformed plasma cells (26) are the common clinical diagnosis
procedures regularly used for detection of MM. Mayo Clinic Risk
Stratification for Multiple Myeloma (mSMART) and International
Staging System for Myeloma are two of the guidelines/staging
systems that are currently being used to diagnose multiple myeloma
in clinical practise (27). All
the recruited patients underwent these procedures at the
hematological clinic of the Armed Forces Medical College (Pune,
India). All the samples were collected between May 2014 and
September 2018. A total of 32 patients with MM and 32 patients with
non-hematological malignancy (anemia and idiopathic
thrombocytopenic purpura; ITP), that served as controls, were
recruited into the present study. Bone marrow smears of both ITP
and MM samples were taken and stained with Leishman-Giemsa stain to
observe the morphological changes of blood cells as described
previously (28). The fresh bone
marrow aspirate and serum samples from patients with MM and in the
control group were collected following biopsy in BD
Vacutainer® EDTA tubes and BD Vacutainer™ SST™ II
advance tubes, respectively. The samples that were collected from
newly diagnosed patients with MM and non-hematological diseases was
used as the inclusion criteria. Patients who suffered from
comorbidities, such as hypertension, diabetes, inflammatory
diseases and all other types of cancer that was not set as the
inclusion criteria. The patients with MM had an mean age of
60.2±9.8 years and patients with non-hematological malignancies had
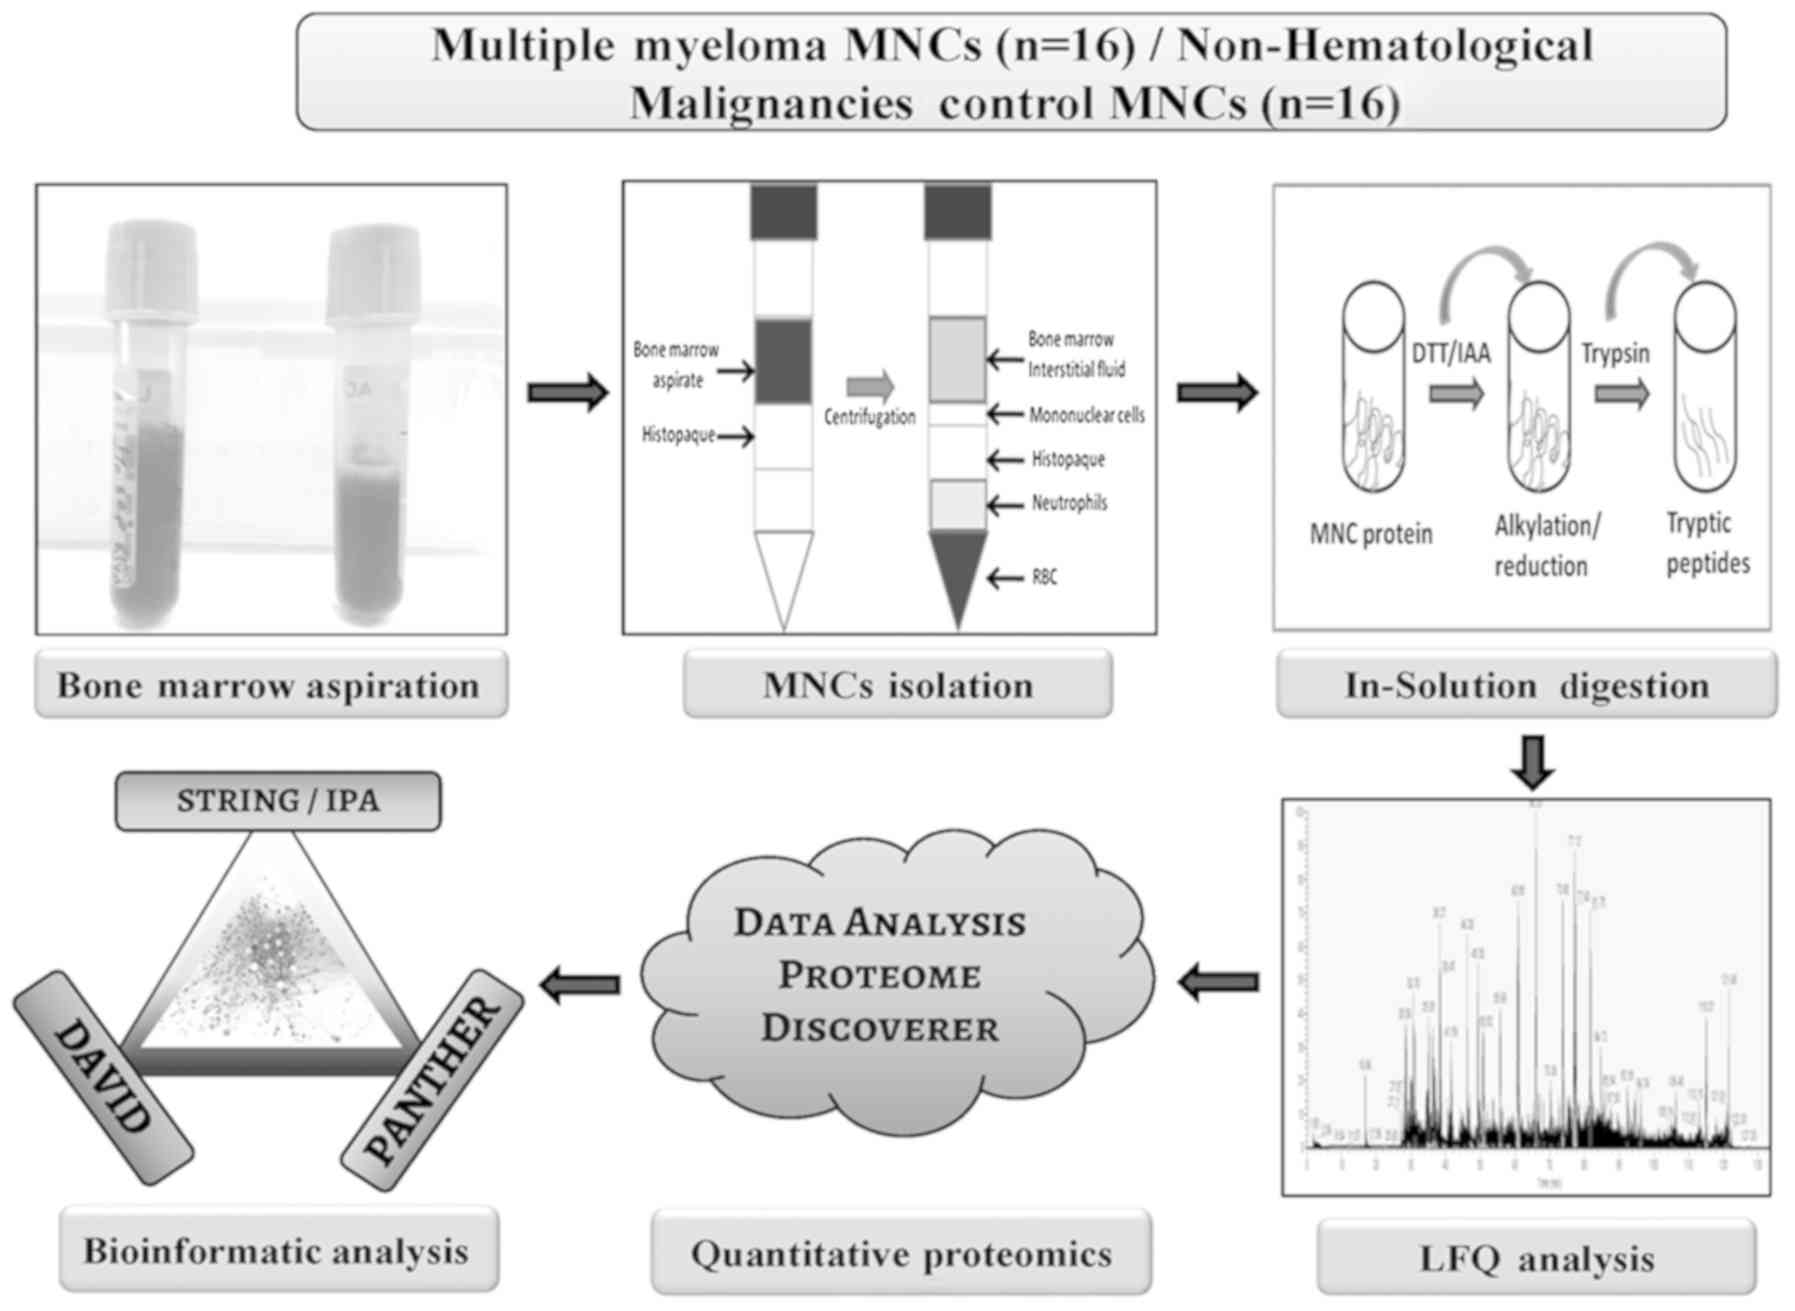
an mean age of 56.7±10.2 years. A flow chart depicting sample
allocation strategy and discovery phase experimental design
information is shown in Fig. 1. A
total of 16 patients with MM and 16 pateints with non-hematological
malignancies were randomly selected from the total number of
patients from each group to be used for the discovery phase
experiments. Validation experiments, such as reverse
tarnscription-quantitative PCR (RT-qPCR) and western blot (WB)
analysis were performed using the remaining cohort of samples that
included 16 patients with MM and 16 patients with non-hematological
malignancies. Table I provides the
details of the patients recruited into the present study. For the
discovery phase LFQ analysis, 16 MNCs samples were pooled (4
samples x 4 sets) to obtain 50 µg protein for each set and 4
sets of experiments (biological replicates) were performed. In
addition, a separate cohort of 16 samples was pooled (4 samples x 4
sets) for the validation experiments in 4 sets of biological
replicates. Healthy control serum samples (n=16), with a mean age
of 54.6±8.2 years, serum samples from patients with MM (n=16) and
bone marrow interstitial fluid (BMIF; n=16) from the patients with
MM and control serum and control BMIF samples from patients with
non-hematological malignancy were used for the WB validation of
candidate proteins.
 | Table IDetails of clinical subjects
recruited in the study. |
Table I
Details of clinical subjects
recruited in the study.
| Criteria | No. of
subjects |
|---|
| Patients with
MM | 32 |
| Sex | |
| Male | 18 |
| Female | 14 |
| Discovery
phase | 16 |
| Validation
phase | 16 |
| Mean age at
surgery, years (range) | 60.2±9.8
(46-78) |
| Preoperative
Radiotherapy or chemotherapy | No |
| MM clonal plasma
cells, %±SD | 65±20 |
| Patients with
non-hematology malignancy | 32 |
| Sex | |
| Male | 18 |
| Female | 14 |
| Discovery
phase | 16 |
| Validation
phase | 16 |
| Mean age at blood
collection, years (range) | 57.3±10.2
(43-65) |
| Preoperative
Radiotherapy or chemotherapy | No |
| MM clonal plasma
cells, %±SD | NA |
| Healthy
Controls | 16 |
| Sex | |
| Male | 9 |
| Female | 7 |
| Validation
phase | 16 |
| Mean age at blood
collection, years (range) | 54.6±8.2 (41-60) |
| Preoperative
Radiotherapy or chemotherapy | No |
| MM clonal plasma
cells, %±SD | NA |
Cell culture
The human RPMI-8226 MM cell line was purchased from
American Type Culture Collection. The cells were grown in RPMI-1640
medium containing 10% fetal bovine serum (FBS), 2 mM L-glutamine
and 100 µg/ml penicillin/streptomycin at 37°C in a
hummidified incubator with 5% CO2. 293T cells were
kindly provided by Professor Michael R. Green (University of
Massachusetts Medical School, Worcester, MA, USA). 293T cells were
cultured in DMEM containing 10% FBS at 37°C in a hummidified
incubator with 5% CO2.
Bone marrow MNCs isolation and protein
extraction
Fresh bone marrow aspirate samples were collected
from the patients in BD Vacutainer® EDTA tubes (Becton
Dickinson and Company). Bone marrow aspirate was diluted with 1X
PBS in a 1:5 ratio and filtered through a 100 µm filter to
remove bone fragments. Using the ficoll gradient centrifugation
method, mononuclear cells were isolated using
Histopaque®-1077 according to the manufacturer's
instructions (Sigma Aldrich; Merck KGaA). Briefly, the density
gradient centrifugation was performed in a swing bucket centrifuge
at 800 × g for 5 min at room temperature. The white layer of MNCs
formed in the middle of the centrifuge tube was removed and the
cells washed twice with 1X PBS solution. Red blood cell (RBC)
contamination was eliminated using RBC lysis buffer (ACK lysing
buffer; cat. no. A10492‑01; Thermo Fisher Scientific, Inc.). The
MNCs were washed with 1X PBS solution and the cells were pelleted
down using centrifugation at 800 × g for 5 min at room temperature
and final pellet was stored at ‑80°C until required. The MNC cells
from both the control and MM group were lysed using urea lysis
buffer (7 M urea, 2 M thiourea and 2% CHAPS) as previously
described by Chanukuppa et al (23). The cell lysate mixture was
centrifuged at 15,000 × g for 15 min at 4°C. Following
centrifugation, the supernatant was collected in a fresh
microcentrifuge tube and four volumes of the supernatant of
pre-chilled acetone were added. The mixture was subsequently
incubated overnight at ‑20°C and the resultant precipitated protein
was pelleted using centrifugation at 8,000 × g at 4°C for 15 min.
Furthermore, the protein pellet was resuspended in a buffer
containing 7 M urea in 50 mM ammonium bicarbonate. A 2D Quant kit
(GE Healthcare) was used to calculate the final protein
concentration.
In-solution digestion and LFQ
analysis
Solution based protein digestion was performed using
50 µg of protein per sample as previously described
(23). Briefly, each proteome
sample was reduced (10 mM dithiothreitol), alkylated (50 mM
iodoacet-amide) and subjected to protein digestion using the
proteolytic enzyme trypsin (1:50; enzyme:protein). Furthermore, the
digested tryptic peptides from the MNC proteome isolated from
patients with MM and from the control group were desalted using C18
ziptips (EMD Millipore) and reconstituted in liquid
chromatography-mass spectrometry (LC-MS) grade water (J.T.Baker;
Thermo Fisher Scientific, Inc.) containing 0.1% formic acid (Sigma
Aldrich; Merck KGaA). A Orbitrap Fusion™ mass spectrometer (Thermo
Fisher Scientific, Inc.) coupled to an EASY-nLC™ 1200 nano-flow LC
system (Thermo Fisher Scientific, Inc.) equipped with EASY‑Spray
column (50 cm x 75 µm ID; PepMap C18 column) was used for
LFQ data acquisition. For each MS data acquisition, 1 µg
desalted tryptic peptides from each sample were injected into the
Orbitrap Fusion mass spectrometer and 4 technical replicates of
each sample were used. Peptides were separated using a 5% to 95%
phase B (0.1% formic acid in 80% acetonitrile) at a flow rate of
300 nL/min for 140 min gradient process. The mass spectra were
acquired in positive ioninzation mode with positive ionization
spray voltage of 2KV. The MS scan began with an analysis of MS1
spectrum from the mass range 375-1,500 m/z using the Orbitrap
analyzer at a resolution of 60,000; with an automatic gain control
(AGC) target of 4×10⁵ and maximum injection time of 50
msec. The precursors identified in MS1 were fragmented by high
energy collision-induced dissociation and analyzed using the
Orbitrap mass analyzer (NCE 35; AGC 1×10⁵; maximum
injection time 40 msec, resolution 15,000 at 200 m/z).
Data analysis for LFQ proteomics
data
The identification and quantitation of proteins from
the MS data was analyzed using the Proteome Discoverer software
(version 2.2; Thermo Fisher Scientific, Inc.) by employing the
Sequest HT database search engine with 1% false discovery rate
(FDR) and the cut-off criteria of 2 missed cleavages. Database
searching included all entries from the Homo sapiens (H.
sapiens) UniProt reference proteome database (downloaded on 03
May 2019; https://www.uniprot.org/proteomes/UP000005640). Total
protein level analysis was performed using a 10 parts per million
precursor ion tolerance. The product ion tolerance used for the
data analysis was 0.05 Da. Oxidation of methionine residues
(+15.995 Da) was kept as a variable modification, whereas
carbamidomethylation of cysteine residues (+57.021 Da) was kept as
a static modification. Peptide‑spectra matches (PSMs) were adjusted
to a FDR of 0.01. PSMs were identified, quantified (using MS/MS
fragment intensity), and narrowed down to a 1% peptide FDR and then
further narrowed down to a final FDR protein level of 1% for
protein-level comparisons. The sum of the area of peptide ions
across all matching PSMs was used for protein quantification.
Fold‑change values were determined by considering the mean area
values of all the triplicate samples. For further analysis, the
protein abundance ratios were exported to Microsoft Excel
(Microsoft Corporation). The proteomics data are available via
ProteomeXchange with identifier PXD015598.
Functional and interaction analysis using
bioinformatics tools
The statistically significant differentially
expressed (DE) proteins identified from the MS data analysis were
subjected to different bioinformatics analyses to understand their
biological context and their involvement in the pathophysiology of
MM. Proteins that were significantly DE (P<0.05 and
log2 fold-change (log2 FC) value of
≥1.0/≤‑1.0) in samples from patients were analyzed using Ingenuity
Pathway Analysis (IPA), Protein Analysis THrough Evolutionary
Relationships (PANTHER; version 14.1; http://www.pantherdb.org/), Search Tool for the
Retrieval of Interacting Genes/Proteins (STRING; https://string-db.org; version 11.0) with parameters
like multiple proteins, homo sapiens as the organism and Database
for Annotation, Visualization and Integrated Discovery (DAVID;
version 6.8; http://david.abcc.ncifcrf.gov/home.jsp). Parameters,
such as functional annotation, UniProt accession as identifier ID
as well as extracted biological functions and pathways were
selected for DAVID based bioinformatic analysis. Similarly, for
PANTHER analysis, parameters, including H. sapiens as an
organism, and the functional classifications viewed graphically for
selected analysis, and the export of the molecular functions,
biological processes, protein classes and pathways were used.
BMIF and serum protein extraction
The bone marrow aspirate and peripheral blood
samples were collected from patients with MM and patients with
non-hematological malignancies, and incubated at room temperature
for 30 min, and subsequently centrifuged at 3,000 × g for 10 min at
10°C to separate the BMIF and the serum. The BMIF and the serum
were thawed, and an albumin and immunoglobulin (Ig)G depletion kit
(GE Healthcare) was used to remove the most abundant proteins, such
as albumin and IgG from these biological fluids. Subsequently, the
depleted samples were desalted using a 2D clean-up kit (GE
Healthcare). The obtained protein pellet was dissolved in urea
lysis buffer (7 M urea, 2 M thiourea and 2% CHAPS) and the protein
content was quantified using 2D Quant kit (GE Healthcare).
RNA extraction and RT-qPCR analysis
Total RNA was extracted from MNCs in patients with
MM and from the control group using TRIzol® reagent
(Invitrogen; Thermo Fisher Scientific, Inc.). The total RNA was
quantified using a Nanodrop 2000C (Thermo Fisher Scientific, Inc.)
and a denaturing agarose gel was used for quality control. The
PrimeScript cDNA synthesis kit (Takara Biotechnology Co., Ltd.),
was used to synthesize the first-strand cDNA according to the
manufacturer's protocol, with 1 μg of total RNA. The qPCR was
performed to measure the mRNA level of MZB1 (forward primer,
5′-ACAACTGGATGATGAGGAG-3′ and reverse 5′-ACATCTGGTAAGCCACAG-3′)
using SYBR-Green as part of a kit (cat. no. RR82WR; Takara
Biotechnology Co., Ltd.). The thermocyclying conditions used were
as follows: Initial denaturation for 2 min 95°C, and 95°C for 15
sec, 57.2°C for 30 sec, and 72°C for 30 sec for 39 cycles. The
experiments were performed in four biological replicates and each
replicate consisted of pooling MNCs from four patients. The
analysis of relative expression for MZB1 was calculated by
normalizing the data with GAPDH (forward primer: 5′-CAATGACCCCTT
CATTGACC-3′ and reverse, 5′-GACAAGCTTCCCGTTCTC AG-3′) as an
internal control, using the 2−ΔΔCq method (29).
Generation of stable knockdown of
RPMI-8226 cells
Stable knockdown in RPMI‑8226 cells of the
identified target protein (MZB1) were constructed using the short
hairpin (sh)RNA mediated knockdown approach as previously described
(23). In brief, the shRNA‑MZB1
vector, with a concentration of 1 µg, was transfected into
293T cells using polyethylene amine (Sigma Aldrich; Merck KGaA). A
total of 3 shRNAs were used, including shMZB1_1 (cat. no.
TRCN0000372920), shMZB1_2 (cat. no. TRCN0000165757), shMZB1_3 (cat.
no. TRCN0000165010) (all Sigma Aldrich; Merck KGaA). A scramble
shRNA was used as the control (5'-TCTCGCTTGGGCGAGAGTAAG‑3'; Thermo
Fisher Scientific, Inc.). The culture transfected 293T cells with
infectious culture media were harvested and the viruses were
collected after 72 h. For the next 3 days, RPMI-8226 cells were
incubated with the virus solution in the presence of polybrene (10
µg/ml; cat. no. TR-1003; Sigma Aldrich; Merck KGaA).
Subsequently, the infected cells were cultured in the presence of
puromycin (1.0 µg/ml) for 10 days.
WB analysis
The protein concentration in each of the MNCs, serum
and BMIF samples from patients with MM (n=16) and in the control
group (n=16) was calculated using the 2D‑Quant kit (GE Healthcare)
prior to WB analysis. WB analysis was performed as previously
described (30). In brief, MNCs,
serum and BMIF proteins were electrophoretically resolved on a 12%
SDS-PAGE gel (40 µg per well) and transferred onto the PVDF
membranes, under wet conditions using Mini Trans-Blot®
Cell transfer unit (Bio-Rad Laboratories, Inc.). Blocking was
performed using 5% skimmed milk at room temperature for 1 h. WB
analysis was performed using a monoclonal/poly-clonal primary
antibody against human MZB1 (1:250 dilution; cat. no. HPA043745;
Sigma Aldrich; Merck KGaA), β-actin (1:2,500 dilution; cat. no.
A2228; Sigma Aldrich; Merck KGaA), β-tubulin (1:2,500 dilution;
cat. no. T0198; Sigma Aldrich; Merck KGaA). Incubation with the
primary antibody was performed overnight at 4°C. The anti‑mouse
cat. no. NXA931-1ML) and anti-rabbit (NA934-1ML; both GE
Healthcare) secondary antibodies conjugated with horseradish
peroxidase were subsequently used at room temperature for 1 h.
Following which, the blots were treated with a chemiluminescent
substrate (cat. no. 170-5067; Bio-Rad Laboratories, Inc.) and the
bands were visualized using Image Quant LAS 4000 imaging system (GE
Healthcare) and ImageJ version 2 software (National Institutes of
Health) was used for the densi-tometry analysis.
For the knockdown experiments, the proteins from
RPMI‑8226 control cells and RPMI‑8226‑MZB1 knockdown cells, using
shMZB1_3, were extracted as previously described (23). Antibodies against cyclin A, cyclin
B, cyclin D, AKT, pAKT (Ser473), ERK, pERK were obtained from Santa
Cruz Biotechnology, Inc. The quantification of the proteins was
performed and the samples were subjected to WB analysis as
aforementioned. In additon, WB analysis was also performed to
examine the protein levels of MZB1 in culture media of RPMI‑8226
control cells and RPMI‑8226‑MZB1 knockdown cells as previously
described (31). We normalized the
amount of media supernatant to be loaded on SDS-PAGE based on equal
cell number (3×10⁵)
Cell proliferation assay
The cell proliferation of RPMI-8226 and
RPMI‑8226‑sh‑MZB1 cells was measured using the Trypan blue dye as
previously described (32). In
brief, an equal number of RPMI‑8226 and RPMI‑8226‑sh‑MZB1 cells
were seeded. The cell number of the first‑day was considered as the
zero time point. After every 24-h interval, the cells were counted
using the Trypan blue dye and a hemocytometer using an Olympus
light microscope (cat. no. 1X2-SP; Olympus Corporation) using ×10
objective. The zero time point was taken as 100% cells. The
experiment was repeated three times.
Fluorescence-activated cell sorting
(FACS) based cell cycle analysis
RPMI-8226 cells with/without knockdown of MZB1, in
exponential growth phase, were collected and washed three times
with ice cold 1X PBS. The cells were washed with 95% chilled
ethanol and incubated at 4°C for 24 h for cell fixation. Prior to
FACS acquisition, the ethanol fixed cells were rinsed with ice cold
1X PBS and stained with propidium iodide (50 µg/ml) and
RNAse (50 µg/ml) in 1X PBS at 37°C in the dark for 30 min. A
BD FACS Calibur cell analyzer (BD Biosciences) was used to perform
cell cycle analysis. The cell cycle data analysis was performed
using Cell Quest Pro software (BD Biosciences).
Soft agar colony formation assay
To evaluate the effect of MZB1 knockdown on the
RPMI-8226 MM cell line soft agar colony formation assay was
performed as previously described (33). Briefly, the cells (RPMI‑8226 and
RPMI‑8226‑sh‑MZB1) were collected after 48 h of culture at 37°C
with 5% CO2. Cell culture dishes were filled with 0.6%
base agar (Invitrogen; Thermo Fisher Scientific, Inc.) and 2X
RPMI‑1640 with 20% FBS and allowed to solidify. Following which,
5,000 RPMI-8226 and RPMI‑8226‑sh‑MZB1 cells were suspended in 0.3%
of agar containing 20% FBS and were placed on the top of the base
agar. Cells were observed using an Olympus light microscope (cat.
no. 1X2-SP; Olympus Corporation) using ×20 objective and images
were obtained after 20 days.
Statistical analysis
To determine the significant differences of all the
data sets, statistical analysis was performed using GraphPad Prism
software (version 7.0; GraphPad Software, Inc.). Comparisons
between two groups (control vs. MM) was performed using Student's
t-test, while datasets containing 3 groups (RPMI‑8226,
RPMI‑8226‑sh‑MZB1_2 and RPMI‑8226‑sh‑MZB1_3) were analyzed using
one‑way ANOVA followed by Tukey's post hoc multiple comparisons
test. The experiments were repeated independently 3 times. The mean
± SD of each biological triplicate samples were used for data
representation.
Results
Comparative proteomic analysis of bone
marrow MNCs in MM
To identify the DE proteins in MNCs from patients
with MM compared to the MNCs from patients with non-hematological
malignancies, LFQ‑based quantitative proteomic analysis was
performed. Representative microscopic images for the ITP and MM are
shown in Fig. S1A and S1B. A
total of 4 biological triplicate experiments from MNCs from
patients with MM and patients with non-hematological malignant
MNCs, as controls, were analysed using a Orbitrap Fusion mass
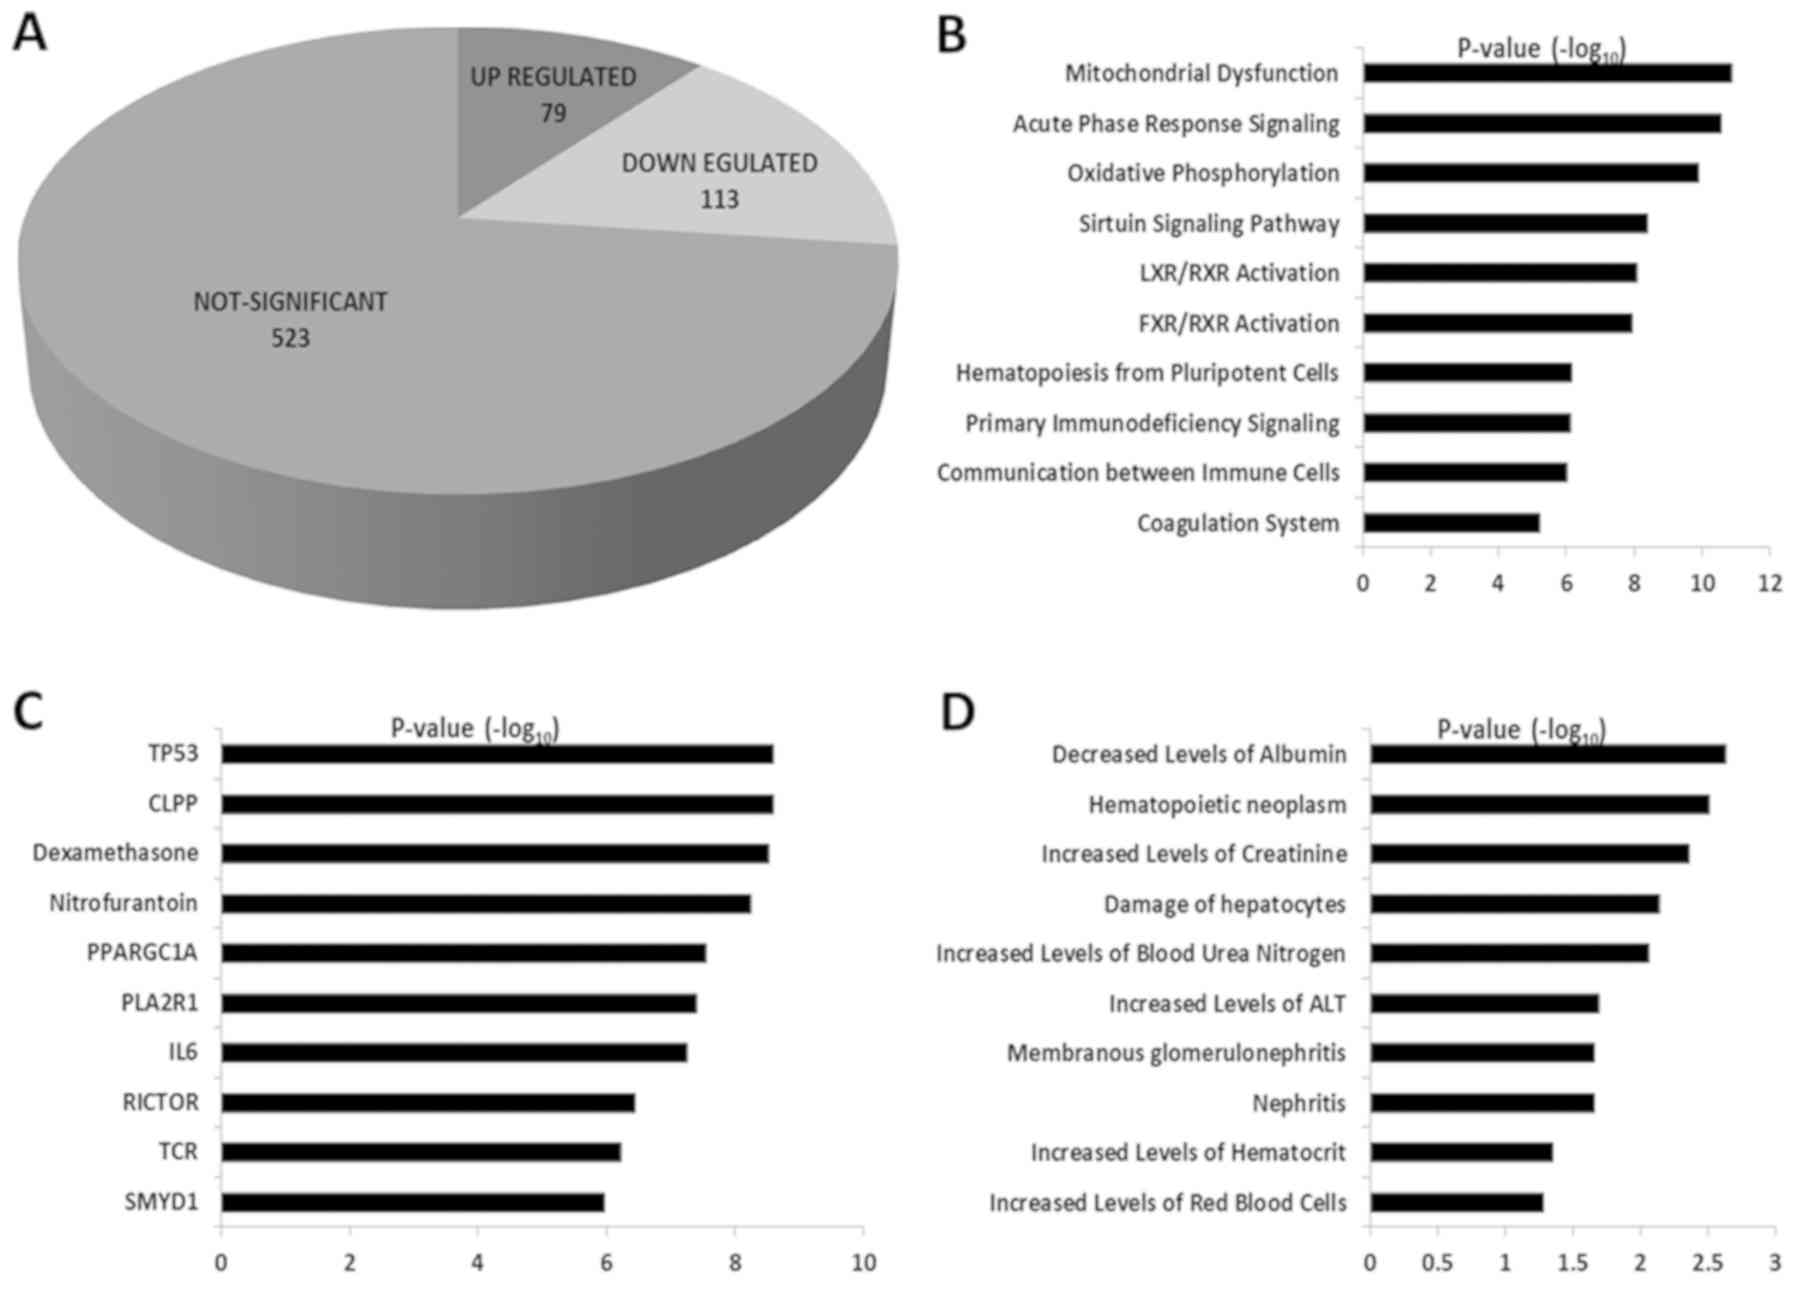
spectrometer. Proteomic analysis identified 715 common proteins
from the total dataset, out of which 192 proteins were DE. Among
these DE proteins, the expression of 79 proteins was upregulated
and 113 proteins showed a downregulated pattern (Fig. 2A). The proteins with
log2 FC values ≥1.0 were considered as upregulated
proteins and those with log2 FC values of ≤‑1.0 were
considered as downregulated proteins. All the DE proteins included
in the present study were highly significant with an FDR value
≤0.01 and P≤0.05. The list of all the DE proteins along with FCs
are shown in Table SI.
Bioinformatics based functional and
interaction analysis
The 192 statistically significant DE proteins,
identified from the LFQ‑based quantitative proteomic analysis, were
selected for bioinformatic analysis to understand and elucidate the
biological role of these proteins in MM. The bioinformatic tools,
IPA, DAVID and PANTHER, were used to identify the molecular
functions, biological processes, protein classes and pathways that
were altered in MNCs from patients with MM. The analysis using
DAVID revealed that the upregulated proteins were involved in
biological processes, such as 'platelet degranulation', 'regulation
of complement activation', 'complement activation classical
pathway', 'receptor-mediated endocytosis' and 'complement
activation' (the top 10 are shown in Fig. S2A). The key molecular functions
identified to be altered in the upregulated proteins were
'immunoglobulin receptor binding', 'antigen binding', 'structural
constituent of the cytoskeleton', 'serine-type endopeptidase
activity' and 'chaperone binding' (the top 10 are shown in Fig. S2B). In addition, various
cancer-associated pathways were also found to be altered in the
upregulated proteins, including 'platelet degranulation',
'respiratory electron transport', 'regulation of complement
cascade', 'scavenging of heme from plasma' and 'the formation of
tubulin folding intermediates' (the top 10 are shown in Fig. S2C). Similarly, the downregulated
proteins identified from MNCs in patients with MM were found to be
involved in biological processes, such as 'cell-cell adhesion',
'movement of a cell or subcellular component', 'small GTPase
mediated signal transduction', 'inflammatory response' and
'glycolytic process' (the top 10 are shown in Fig. S3A). The key molecular functions
found to be altered in the down-regulated proteins include
'cadherin binding', 'RAGE receptor binding', 'GTPase activity',
'GDP binding', 'GTP binding' and 'calcium-dependent protein
binding' (the top 10 are shown in Fig. S3B). In additon, the downregulated
proteins were found to be involved in pathways, such as 'advanced
glycosylation endproduct', 'platelet degranulation', 'glycolysis',
'gluconeogenesis' and 'EPHB-mediated forward signaling' (the top 10
are shown in Fig. S3C).
Furthermore, bioinformatics analysis using PANTHER, to provide
further insights, was also performed to obtain molecular functions,
biological processes, protein classes and pathways involved in the
DE proteins, which revealed different result (Figs. S4 and S5). PANTHER analysis of the
upregulated proteins showed alterations in molecular functions,
such as 'transporter activity', 'catalytic activity', 'molecular
function regulator' and 'structural molecule activity'. In
addition, biological processes such as 'immune system process',
'metabolic process,' and biological regulation and adhesion were
also found to be altered. Furthermore, the upregulated proteins
belonged to protein classes, such as chaperone, transporter,
oxidoreductase and enzyme modulator, while the key pathways that
were identified included 'blood coagulation', 'FAS signaling
pathway', 'cytoskeletal regulation by ρ GTPase' and 'CCKR
signalling map'. Similarly, PANTHER analysis of the downregulated
proteins showed alterations in molecular functions such as
transporter activity, 'catalytic activity', 'binding activity' and
'structural molecule activity'. In addition, biological processes,
such as 'cellular process', 'localization', 'immune system process'
and 'metabolic process' were also found to be altered. Furthermore,
downregulated proteins were associated with protein classes, such
as 'enzyme modulator' 'chaperone', 'transferase' and
'oxidoreductase', while the key pathways identified included 'p53
pathway', 'ubiquitin protea-some pathway', 'interferon γ signalling
pathway', and 'integrin signaling pathway'. The protein-protein
interactions (PPI) between the upregulated proteins were determined
using the online software STRING. From the 79 upregulated proteins,
67 nodes were found to be interacting with each other and these
PPIs are shown in Fig. S6. The
MZB1 protein showed direct interaction with immunoglobulin J chain
(IGJ) protein, indicated with a red circle and a high confidence
level of interaction, which suggests it has a significant role in
the assembly and secretion of antibodies from the plasma cells
(Fig. S6). In addition, other
proteins, such as ECH, NDUFS3, UQCRC1, COXS8, ATP1A1, SLC4A1 and
SPTA1 were found to interact strongly with the identified
upregulated proteins. Furthermore, proteins, including APOA1, CP,
HPX, APOH, VTN, C4BPA and C3 also showed strong interactions with
the upregulated proteins from STRING analysis.
IPA analysis was subsequently performed by analyzing
the MS data from the 79 upregulated proteins, including their
P-values and FCs. Pathways, such as 'mitochondrial dysfunction',
'acute phase response signaling', 'oxidative phosphorylation',
'sirtuin signaling pathway' and 'LXR/RXR activation' were activated
in MNCs from patients with MM (Fig.
2B). Upstream regulators like TP53, CLPP, dexamethasone,
nitrofurantoin, PPARGC1A and IL6 were found to be amongst the top
10 DE proteins (Fig. 2C). By
analyzing the toxicology functions, the upregulated proteins were
found to be involved in the decreased levels of albumin,
hematopoietic neoplasm, increased levels of creatinine, damaged
hepatocytes and increased levels of blood urea nitrogen (Fig. 2D). IPA based interactions for the
MZB1 protein are shown in Fig.
S7. The red color indicates proteins that were identified in
the present study and the proteins without colour were not
identified. IPA based interactions revealed that MZB1 interacts
with Ig, such as Ig heavy constant mu (IGHM), IgA, IgG, IgM, IGHγ3,
Ig Jchain, IgG1, IgG3 and IGHG2. These results are a characteristic
feature of MM in which antibodies are overproduced. MZB1 also
showed strong interactions with CLU, as shown in Fig. S7.
Selection of candidate proteins
Among the statistically significant proteins, MZB1
(log2 FC, 3.4) was selected for further functional
studies using the MM cell line model, as this protein was one of
the significantly DE proteins (Table
II) and it also has significant roles in cell proliferation as
well as immunoglobulin synthesis (34). Furthermore, functions of MZB1 are
associated with characteristic features of MM, such as calcium
homeostasis, immunoglobulin production and cell replication
(35). The majority of the
significantly DE proteins were also found to be immunoglobulins,
which are known to be dysregulated in MM. MZB1 was found to be
upregulated in the present study and notably, this protein is least
explored in the context of hematological malignancies.
| Table IIA partial list of significantly
differentially expressed proteins identified using label‑free
quantitative analysis in mono-nuclear cells from patients with
multiple myeloma as compared with patients with non-hematology
malignancies. |
Table II
A partial list of significantly
differentially expressed proteins identified using label‑free
quantitative analysis in mono-nuclear cells from patients with
multiple myeloma as compared with patients with non-hematology
malignancies.
A, Upregulated
proteins
|
|---|
| Accession ID | Description | Fold-change | P-value | FDR adjusted
P-value |
|---|
| P30043 | Flavin reductase
NADPH | 22.801 |
2.46×10⁻⁷ |
2.4×10⁻⁶ |
| A0A0J9YXX1 | Immunoglobulin
heavy variable 5-10-1 | 19.497 |
4.62×10⁻⁵ |
9.59×10⁻⁵ |
| P01023 |
α-2-macroglobulin | 17.171 |
4.32×10⁻⁵ |
9.03×10⁻⁵ |
| P08603 | Complement factor
H | 15.636 |
2.93×10⁻⁶ |
1.20×10⁻⁵ |
| P04003 | C4b-binding protein
α chain | 14.925 |
1.28×10⁻⁴ |
2.41×10⁻⁴ |
| P04004 | Vitronectin | 14.556 |
1.47×10⁻⁵ |
3.95×10⁻⁵ |
| P01011 |
α-1-antichymotrypsin | 12.607 |
8.41×10⁻⁵ |
1.64×10⁻⁴ |
| P80748 | Immunoglobulin λ
variable 3-21 | 12.425 |
2.95×10⁻⁵ |
6.64×10⁻⁵ |
| A0A0B4J2B5 | Immunoglobulin
heavy variable 3/OR16-9 non-functional fragment | 11.104 |
4.51×10⁻⁵ |
9.39×10⁻⁵ |
| P0DOY3 | Immunoglobulin λ
constant 3 | 11.092 |
2.43×10⁻⁵ |
5.67×10⁻⁵ |
| P01859 | Immunoglobulin
heavy constant γ 2 | 10.814 |
1.12×10⁻⁴ |
2.14×10⁻⁴ |
| Q8WU39a | marginal zone B and
B1 cell specific protein | 10.579 |
5.47×10⁻⁴ |
8.74×10⁻⁴ |
| P02647 | Apolipoprotein
A-I | 9.982 |
3.93×10⁻⁵ |
8.42×10⁻⁵ |
| P01591 | Immunoglobulin J
chain | 9.808 |
1.60×10⁻⁵ |
4.22×10⁻⁵ |
|
B. Downregulated
proteins
|
|
| Accession ID | Description | Fold-change | P-value | FDR adjusted
P-value |
| P02775 | Platelet basic
protein | 0.124 |
1.13×10⁻⁹ |
2.12×10⁻⁷ |
| Q05315 | Galectin‑10 | 0.130 |
4.61×10⁻⁹ |
3.02×10⁻⁷ |
| P35754 | Glutaredoxin-1 | 0.150 |
1.47×10⁻⁸ |
6.32×10⁻⁷ |
| P07384 | Calpain-1 catalytic
subunit | 0.217 |
4.69×10⁻⁶ |
1.69×10⁻⁵ |
| P04908 | Histone H2A type
1-B/E | 0.245 |
9.02×10⁻⁷ |
5.61×10⁻⁶ |
| P32320 | Cytidine
deaminase | 0.249 |
1.62×10⁻⁹ |
2.12×10⁻⁷ |
| P52566 | ρ-GDP-dissociation
inhibitor 2 | 0.250 |
1.25×10⁻⁶ |
6.73×10⁻⁶ |
| P84095 | ρ‑related
GTP‑binding protein ρG | 0.253 |
2.62×10⁻⁷ |
2.40×10⁻⁶ |
| P09960 | Leukotriene A-4
hydrolase | 0.255 |
4.44×10⁻⁸ |
1.05×10⁻⁶ |
| O75131 | Copine-3 | 0.261 |
7.72×10⁻⁹ |
4.06×10⁻⁷ |
| P48595 | Serpin B10 | 0.262 |
4.77×10⁻⁸ |
1.07×10⁻⁶ |
| P61978-3 | Isoform 3 of
Heterogeneous nuclear ribonucleoprotein K | 0.264 |
1.04×10⁻⁶ |
5.98×10⁻⁶ |
| E7EUC7 | UTP -
glucose-1-phosphate uridylyltransferase | 0.265 |
7.65×10⁻⁸ |
1.29×10⁻⁶ |
| P05109 | Protein
S100-A8 | 0.269 |
1.02×10⁻⁷ |
1.38×10⁻⁶ |
| P05089 | Arginase-1 | 0.270 |
2.54×10⁻⁸ |
7.83×10⁻⁷ |
Validation of MZB1 using RT-qPCR and WB
analysis
Quantitative gene expression analysis of MZB1 was
performed using RT-qPCR. The qPCR data revealed that mRNA levels of
MZB1 were significantly increased at the transcriptional level
(Fig. 3A). Similarly, WB analysis
also revealed that expression levels of MZB1 were significantly
increased in MNCs from patients with MM compared with that in the
control samples (Fig. 3B). To
further confirm this result, the expression level of MZB1 in the
serum and in BMIF from patients with MM, and in patients with
non-hematological malignancies were analyzed. There was
upregulation of MZB1 in the patients with MM compared with that in
the control group. Representative WB images are shown in Fig. 3C and D. In addition, the expression
level of MZB1 in the culture media of RPMI‑8226 and knockdown of
MZB1 in RPMI‑8226 was investigated and the protein expression
levels of MZB1 in RPMI‑8226 cells with knockdown of MZB1 secretome
was lower (Fig. S8).
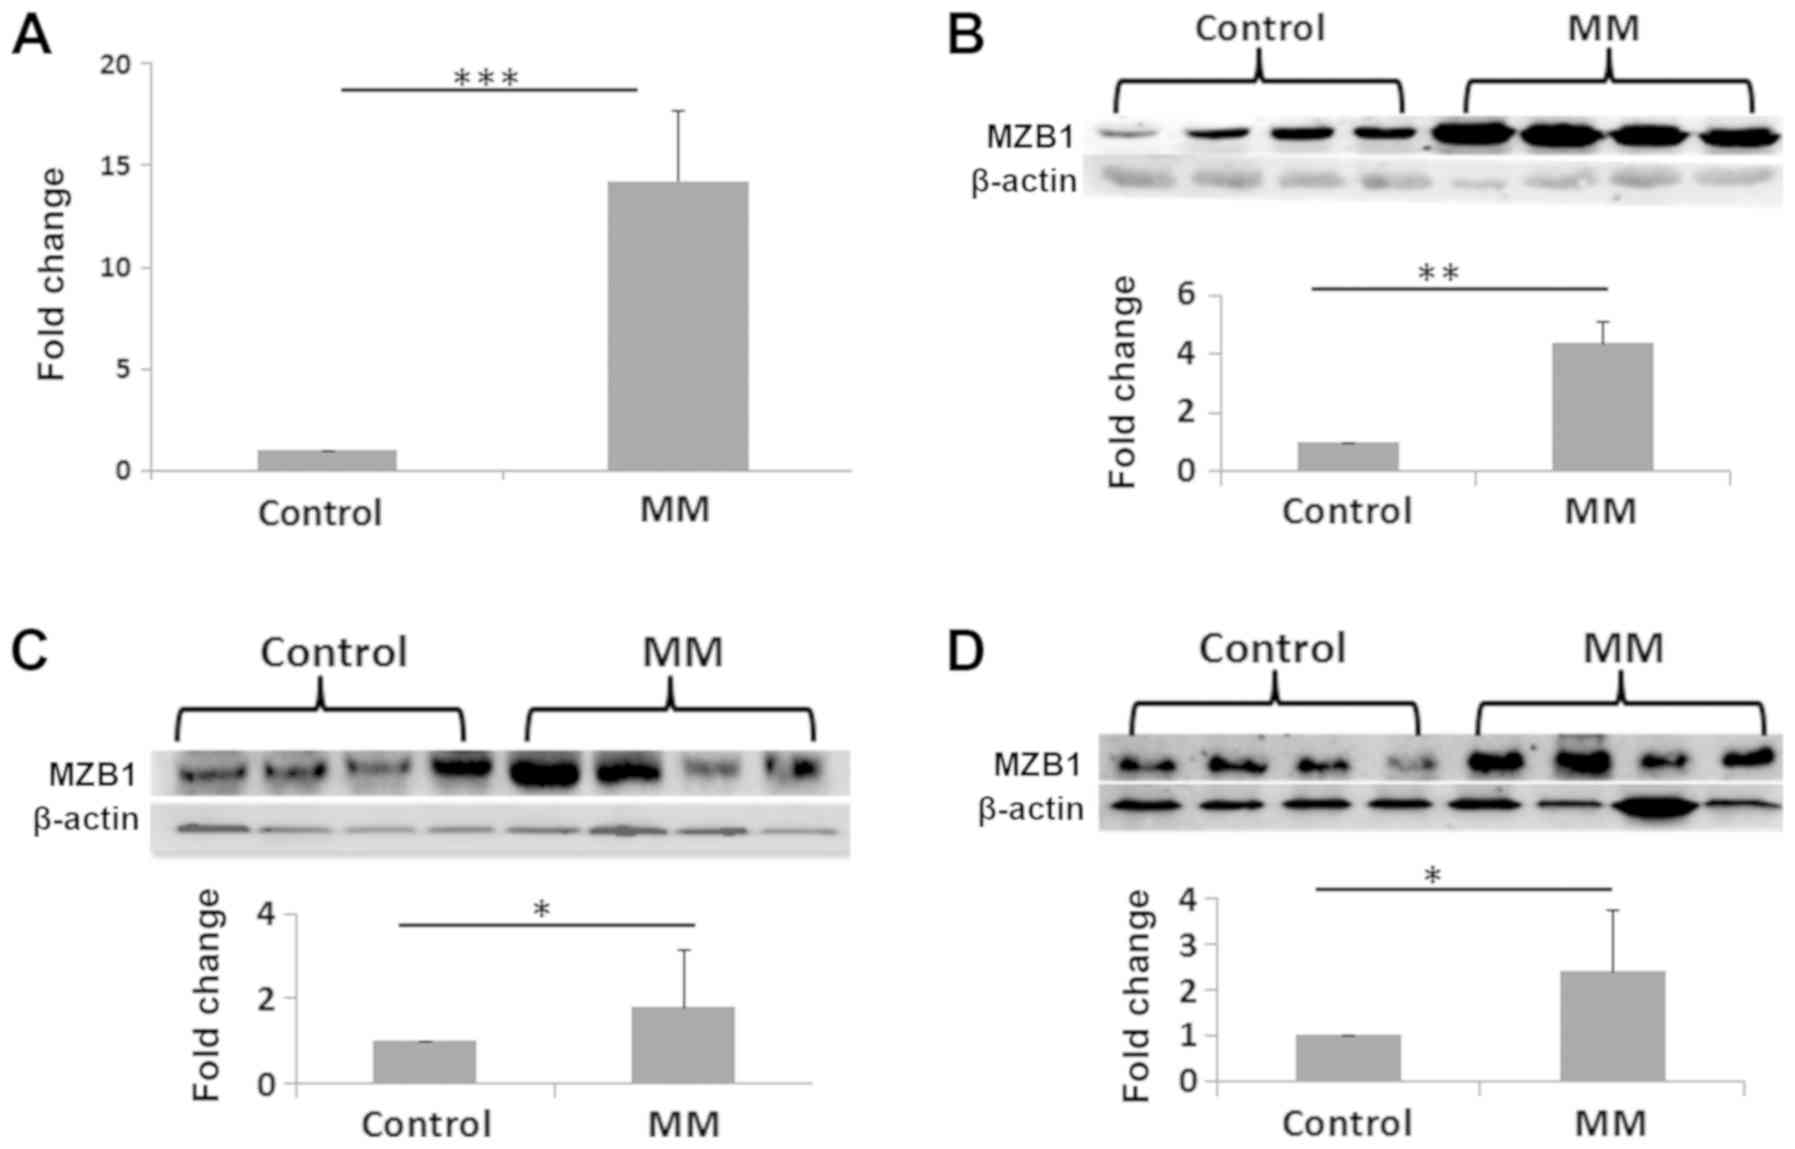 | Figure 3Validation experiments for the
analysis of the MZB1 protein in MNCs from patients with MM and with
non‑hematological malignancies. (A) mRNA and (B) protein expression
level of MZB1 using reverse transcription‑quantitative PCR and
western blot analysis, respectively. mRNA fold‑change, 14.25.
Protein fold‑change, 4.62 (C) Protein expression levels of MZB1
from serum samples. The first four lanes are from healthy controls
and last four lanes are from patients with MM. Fold‑change, 1.78
(D) Protein expression levels of MZB1 in BMIF. The first four lanes
are from patients with non‑hematological malignancies and the last
four lanes are from patients with MM. Fold-change, 2.36.
*P≤0.05, **P≤0.01, ***P≤0.001.
BMIF, bone marrow intersitital fluid; MM, multiple myeloma; MZB1,
marginal zone B and B1 cell specific protein. |
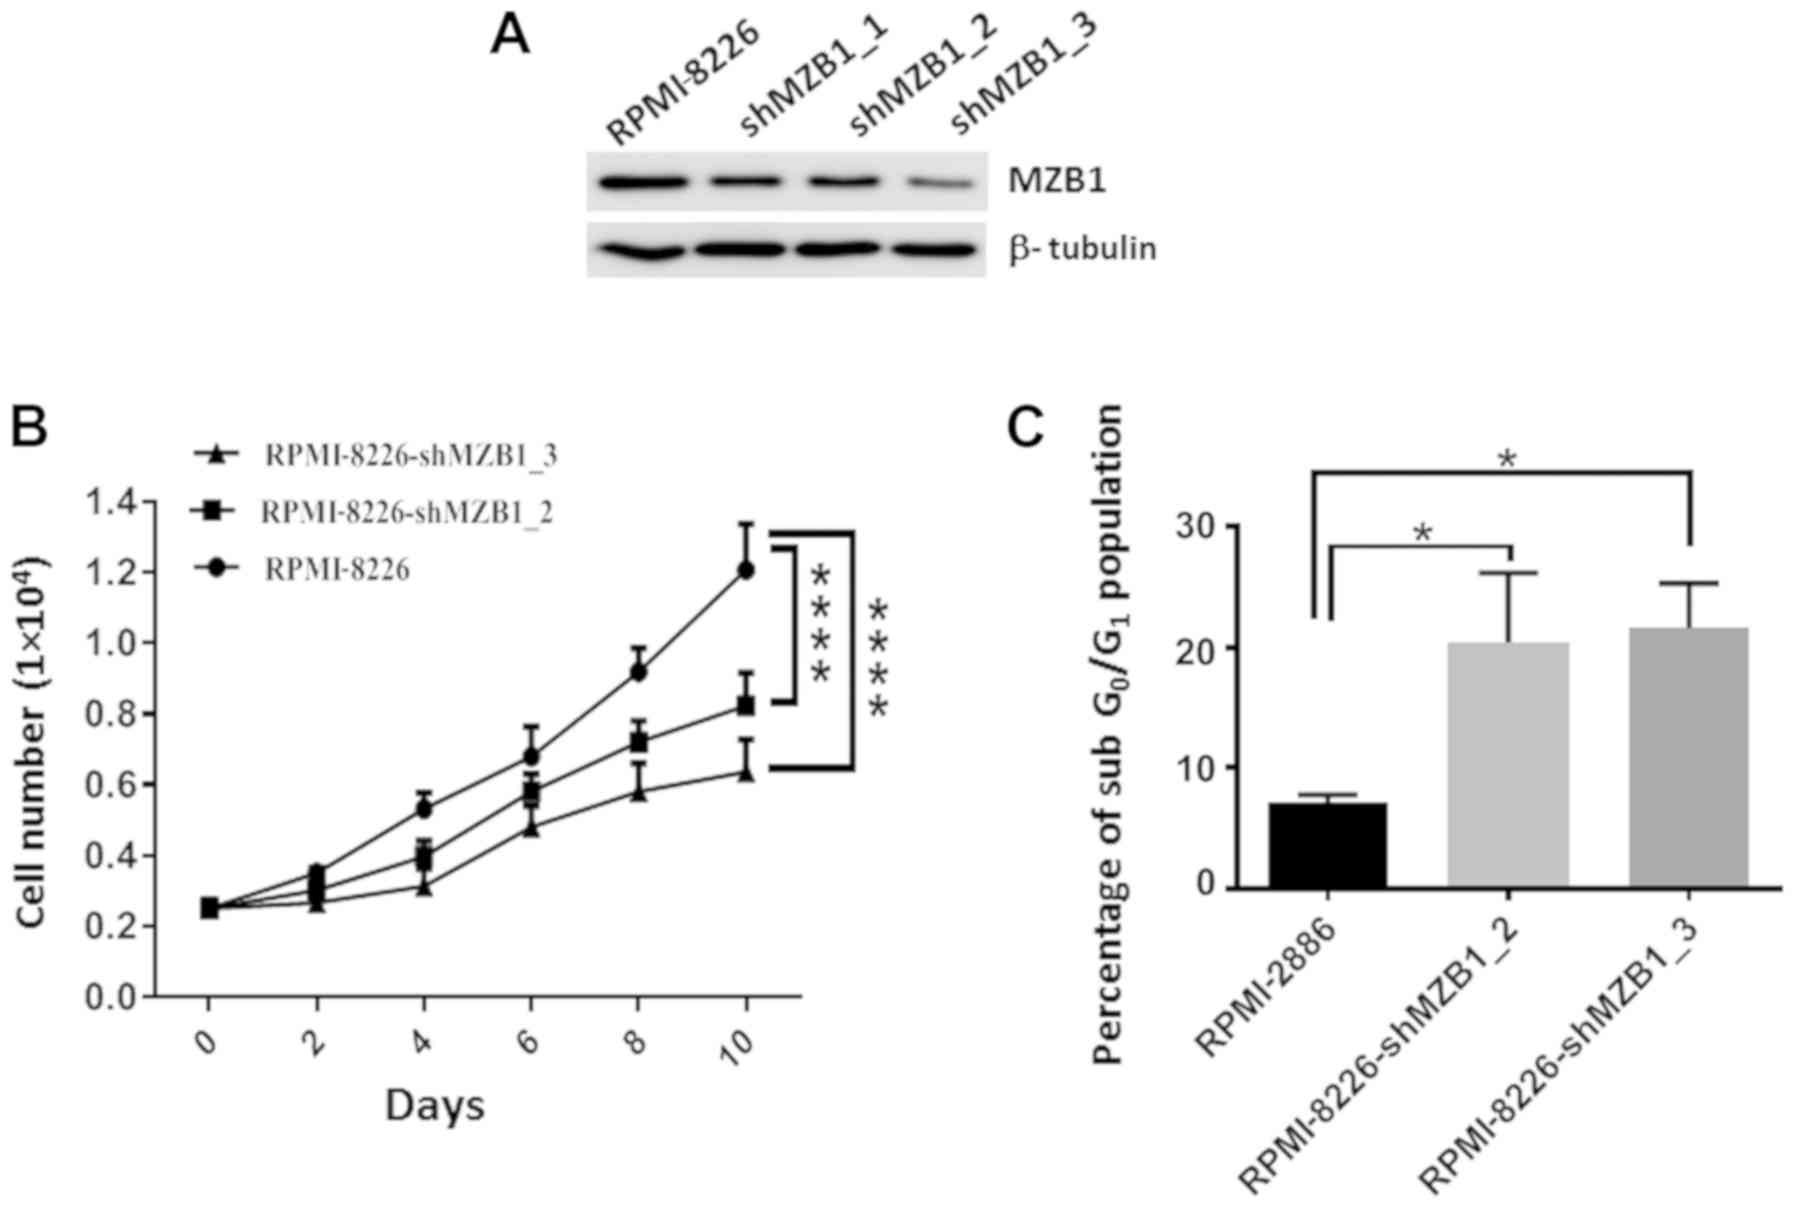
MZB1 promotes the proliferation of
RPMI-8226 cells
To investigate the role of MZB1 in MM progression,
MZB1 stably knocked down in RPMI-8226 cells using lentivirus shRNA
interference in RPMI-8226 cells (Fig.
4A). There was marked attenuation of the MZB1 protein
expression level in RPMI-8226 cells using multiple shRNA,
validating the target effect of RNA interference. Subsequently the
proliferation of RPMI‑8226 cells with stable knockdown of MZB1 was
investigated, using shMZB1_2 and shMZB1_3, as they knocked down
MZB1 expression more effectively. The results revealed that the
depletion of MZB1 results in a slower proliferation of RPMI-8226
cells (Fig. 4B). To further
examine how knockdown of MZB1 led to the reduction in cell
proliferation, flow cytometry was performed to examine the number
of apoptotic cells. The results revealed that the knockdown of MZB1
(in RPMI‑8226‑shMZB1_2 and RPMI‑8226‑shMZB1_3 expressing cells)
significantly increased the sub-G1 cell population i.e., apoptotic
cells (Fig. 4C). Representative
flow cytometry analysis plots were shown in Fig. S9.
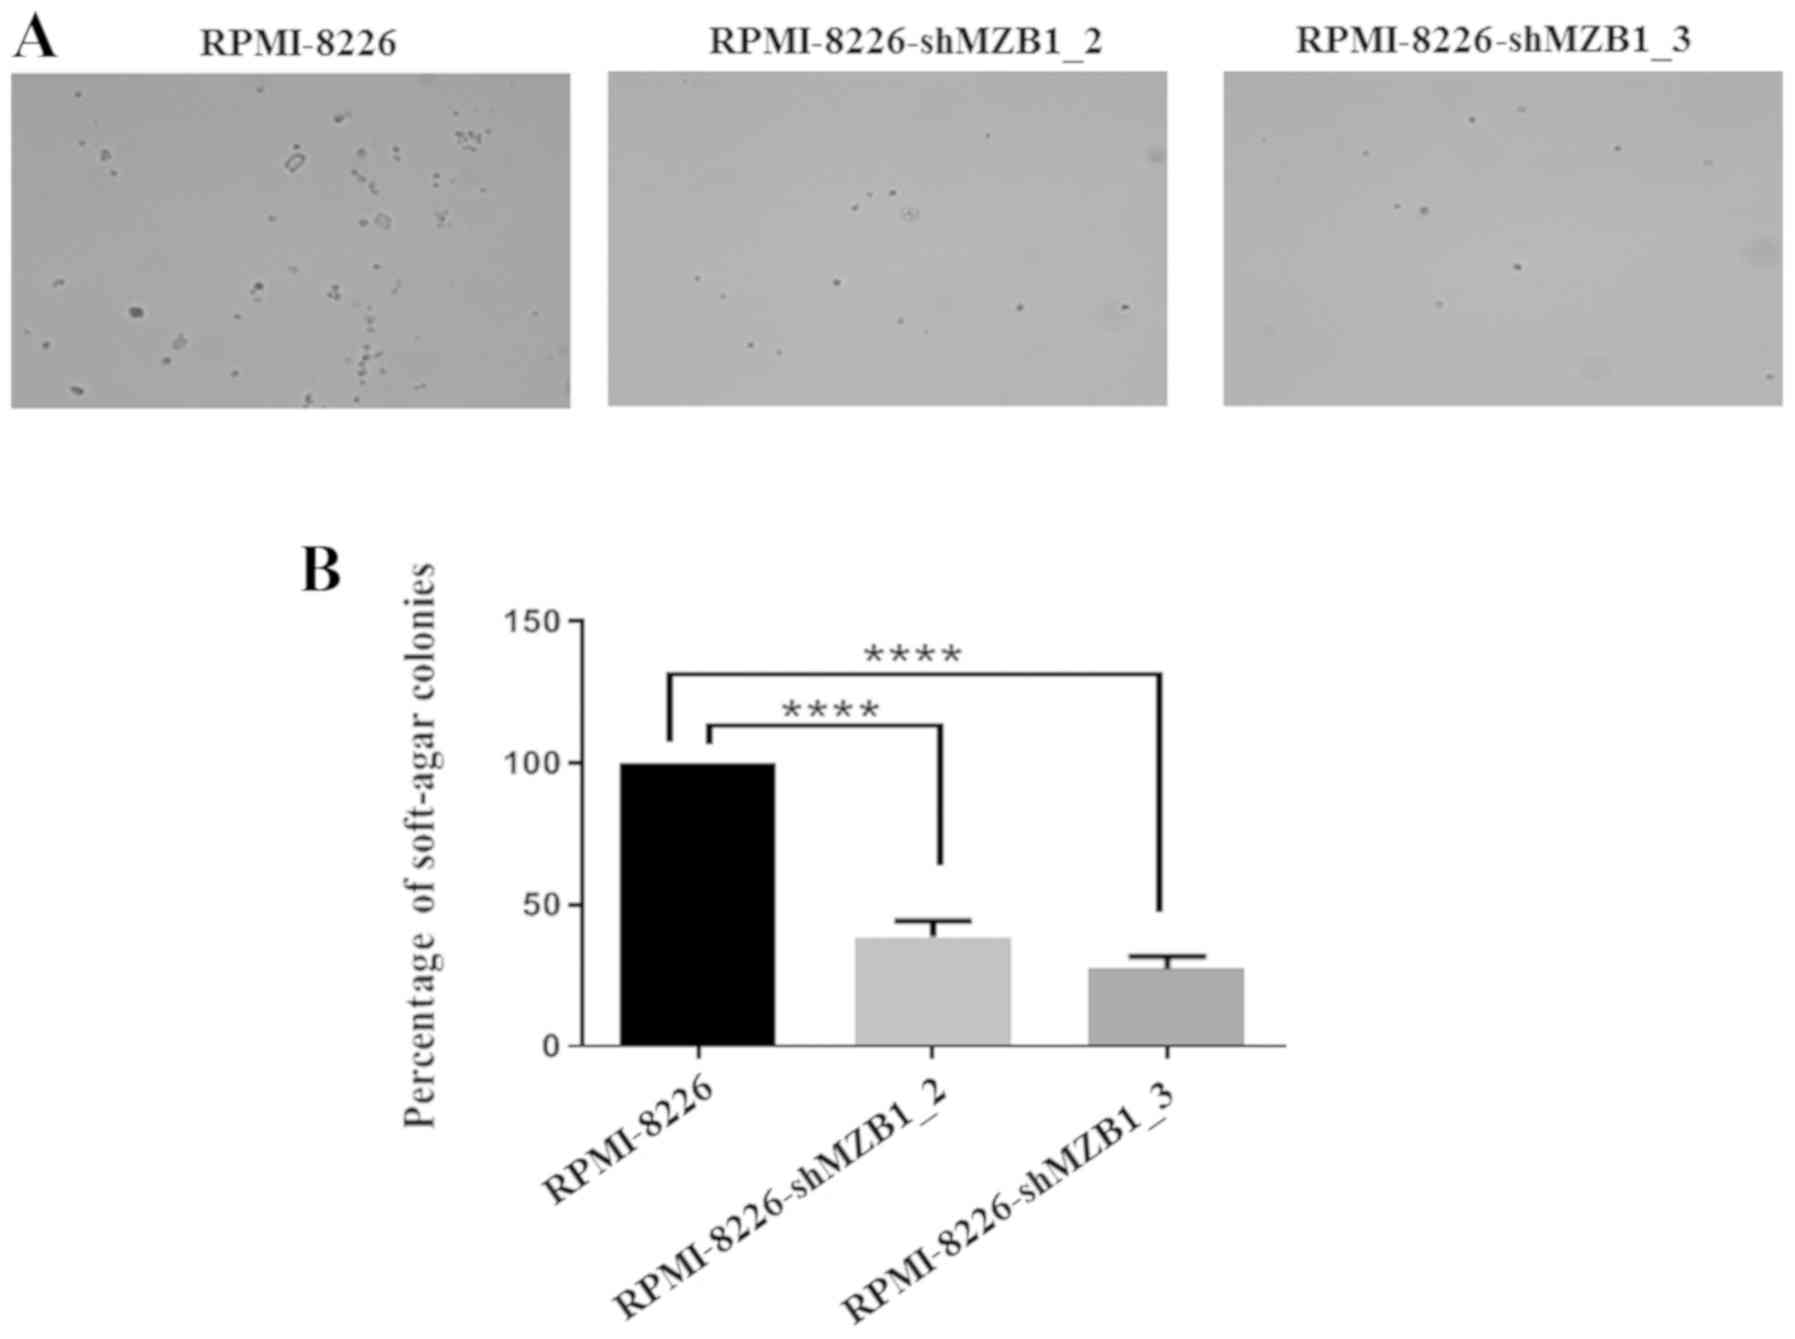
Cancer cells grow in an anchorage-independent manner
(36). As RPMI8226 grow in
suspension, it was investigated whether MZB1 has any role in
anchorage‑independent growth of RPMI-8226 cells using soft agar
colony formation assays. It was found that knockdown of MZB1
resulted in inhibition of anchorage-independent growth of the
RPMI-8226 cells, indicating that MZB1 might regulate growth
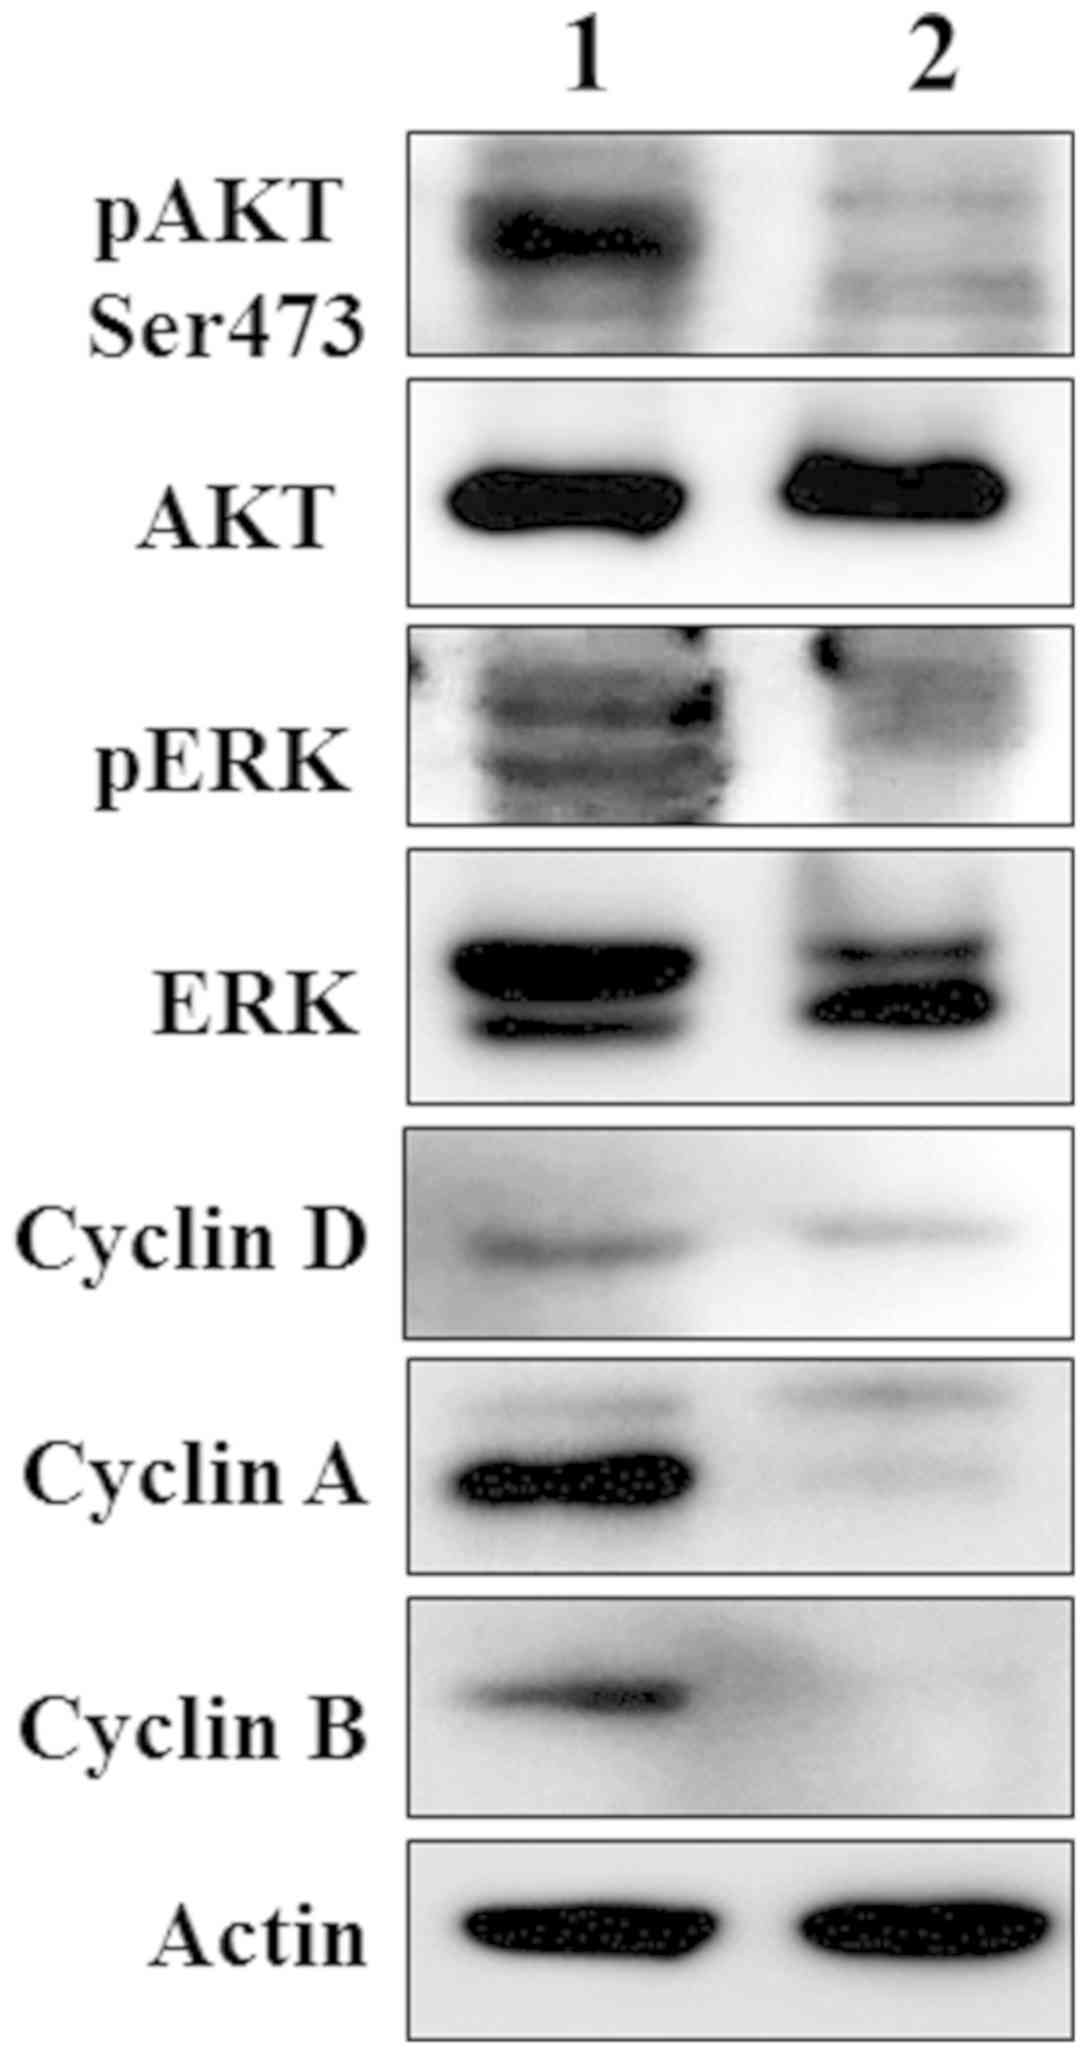
proliferation-associated proteins (Fig. 5). Therefore, the proteins
associated with the cell cycle progression in the control and MZB1
knockdown cells were investigated. WB results revealed that the
expression of numerous proteins that are associated with promoting
cell cycle progression (37-41)
were reduced in MZB1 knockdown RPMI‑8226 cells (Fig. 6). For example, the phosphorylated
forms of AKT and MAPK proteins were markedly inhibited in MZB1
knockdown RPMI‑8226 cells. Similarly, cyclins involved in
G1 phase (cyclin D1), S phase (cyclin A) and
G2/M phase (cyclin A and cyclin B) were markedly reduced
in MZB1 knockdown RPMI‑8226 cells, suggesting that MZB1 is
important for proliferation of MM. Taken together, the results of
the present study suggest that the elevated level of the MZB1 plays
a crucial role in MM.
Discussion
Worldwide, MM, the second most prevalent
hematological malignancy, is comprised of deformed plasma cells,
which leads to overproduction of antibodies (1). MM accounts for nearly 13% of all
known hematologic malignancies (42). In developing countries, such as
India, 4/100,000 individuals are diagnosed with MM (43). Approximately 24,280 to 30,330 new
MM cases were detected and 12,650 deaths occured in 2016 in the
United States (44). Although few
approaches are available for treatment of MM, it is still
considered as an incurable disease globally. Therefore, the
identification and validation of potential MM targets would be
beneficial for the diagnosis and treatment of MM. In the present
study, proteome alterations of MNCs from patients with MM were
compared with MNCs from patients with non-hematological
malignancies, as controls. Using LFQ based label‑free proteomic
analysis, 192 DE proteins were identified in MNCs from patients
with MM compared with that in MNCs from patients with
non-hematological malignancies. It was found that the protein and
mRNA expression levels of MZB1 were significantly increased in the
MNCs from patients with MM. Therefore, it was interesting to
investigate the correlation between the accumulation of MZB1 and MM
pathogenesis.
MZB1, also known as plasma cell induced endoplasmic
reticulum protein, has been reported to have a role in the assembly
and secretion of IgM antibodies from plasma cells (34,45).
MZB1 was also found to be involved in the integrin-mediated
adhesion, endoplasmic reticulum calcium storage and calcium
homeostasis (35). In addition,
MZB1 was reported to be a highly expressed protein in patients with
systemic lupus erythematosus (SLE) and has been reported as a
potential therapeutic target for SLE (46). MZB1 acts as a tumor suppressor
protein in some solid cancers, such as hepatocellular cancer and
gastric cancer, and suppression of MZB1 lead to increase in
proliferation and invasion of the cancerous cells (47,48).
In contrast, high levels of MZB1 are associated with adverse
prognosis in hematological malignancies, such as chronic
lymphocytic leukemia, follicular lymphoma and diffuse large cell
lymphoma (49). MZB1 is associated
with IgM heavy and light chains and promotes IgM assembly, as well
as secretion. MZB1 is a GRP94 co-chaperone that enables
biosynthesis of IgM heavy chain and is also involved in the
association of the IgM heavy chain with the Ig surrogate light
chains (45). Therefore it may
play a key role in B cell neoplasms, such as MM. As with other
hematological malignancies, the present study revealed that mRNA
and protein expression levels of MZB1 were increased in patients
with MM and functional studies revealed that high expression levels
of MZB1 are associated with the malignant potential of MM.
Furthermore, isolation of different types of cells (T cells, B
cells, dendritic cells and natural killer cells) from the bone
marrow aspiration samples in patients with MM to examine MZB1
expression however the number of cells obtained was too few to
perform proteomics or WB analysis. However, following a literature
review to investigate the protein expression levels of MZB1 in
various cell types (T cells, B cells, dendritic cells and natural
killer cells), it was found that the MZB1 protein is primarily
expressed in B cells, as well as dendritic cells (50). As plasma cells are the derivative
cells of B cells, we hypothesize that MZB1 would be expressed in
all types of plasma cells. STRING analysis of the 79 upregulated
proteins identified in the present study revealed the direct
interaction of MZB1 with IGJ. A previous study reported that MZB1
is involved in IgM heavy and light chain assembly and secretion
(45). Furthermore, the protein
expression level of MZB1 is reported to be increased during the
differentiation of plasma cells and aids in the oxidative folding
of Ig heavy chains (34). In the
present study, Ig chain-related protein, such as IGJ, was found to
be upregulated and had strong interactions with MZB1. High
expression of IGJ protein has been reported to be associated with
the poor survival in patients with acute lymphoblastic leukemia and
of Hispanic descent (51).
Furthermore, it was found that the knockdown of MZB1 reduced the
proliferation of MM cells. Therefore, the high expression levels of
MZB1, and IGJ, as well as their interactions together might be
involved in the malignancy of MM.
The IPA network analysis revealed that MZB1
interacts with Ig, such as IGHM, IgA, IgG, IgM, IGHG3, JCHAIN,
IgG1, IgG3 and IGHG2. These results are strongly correlated with
characteristics of MM i.e., overproduction of antibodies. Notably,
the majority of the antibodies found in the present study were
found to be upregulated. Furthermore, MZB1 also showed strong
interactions with CLU, which plays a key role in cancer metastasis
(52). Moreover, IPA based
toxicology functions of MNCs dysregulated proteins from patients
with MM revealed their involvement in the elevation of creatinine
levels, as well as decreased levels of albumin, which are basic
pathological characteristic features of MM (53,54).
To verify the expression levels of MZB1 in MM, the
protein levels in serum and BMIF from patients with MM was
invetsigated. The results from WB analysis were consistent with the
quantitative proteomic data of MNCs. Furthermore, functional
studies using the MM RPMI-8226 cell line model was performed to
understand the role of this protein in the pathogenesis of MM.
Functional assays, such as cell proliferation assay, flow
cytometry‑based cell cycle analysis and soft agar colony formation
assays revealed the involvement of MZB1 protein in the progression
of MM. The cell proliferation assay demonstrated that the knockdown
of MZB1 slowed the proliferation of RPMI-8226 cells.
Several studies have demonstrated that AKT is
constitutively activated in MM, and activation of AKT signaling
pathway plays an important role in the survival, proliferation and
migration of MM cells (55,56).
Notably, the results from the present study revealed that MZB1
plays a crucial role in the activation of the AKT pathway and could
be involved in the pathogenesis of MM. Likewise, the MAPK signaling
pathway is important in the pathogenesis of MM, as it mediates MM
cell growth as well as survival and upregulation of the MAPK
signalling molecules leading to increased proliferation of MM cells
(38,57). The present study also demonstrated
that MZB1 has an important role in the activation of the MAPK
pathway. Therefore, the knockdown of MZB1 results in marked
inactivation of AKT, as well as the MAPK pathways. Hence, MZB1
promotes the proliferation of MM cells, in part, through
controlling the activation of AKT and MAPK pathways.
Cell cycle progression is associated with the
expression levels of different cyclins, such as cyclin D1, cyclin A
and cyclin B (39–41). It was found that MZB1 augments the
protein expression levels of cyclin D1, cyclin A and cyclin B
(Fig. 6). Cyclin D1 forms a
complex with CDK4/CDK6 and monitors the progression of the
G1 phase of the cell cycle. Likewise, cyclin A forms
complex with CDK2/CDK1 to facilitate the progression of S phase,
G2 phase and early mitosis and cyclin B forms a complex
with CDK1 and thereby controls the progression of prometaphase to
anaphase of the cell cycle (49-51).
Previous studies have shown that high expression levels of the
aforementioned cyclins promotes the progression of MM plasma cells
in the cell cycle (58‑60). Therefore, MZB1, at least in part,
could accelerate the cell cycle progression of MM plasma cells and
lead to malignancy. Overall, the results from the present study
reveals that the MZB1 protein could be a potential diagnostic or
therapeutic target for MM, however, the use of a single MM cell
line is one of the limitations and further investigations in
additional MM cell lines is required to validate the findings.
In summary, quantitative proteomic profiling of the
MNCs from patients with MM compared with that in patients with
non-hematological malignant revealed that 192 proteins are DE.
Knockdown of MZB1 results in inhibition of MM cell proliferation,
anchorage-independent growth potential and induction of apoptosis
suggesting that MZB1 is associated with progression of MM.
Therefore, MZB1 could function as a putative oncogene in the
pathogenesis of MM and might be a potential biomarker. Further
studies are required to validate the findings from the present
study in an animal model, as well as in a large cohort of MM
samples, to establish the role of MZB1 in MM, which could be
translated into the efficient and successful clinical management of
MM in the future.
Supplementary Data
Funding
This research was supported by the National Centre
for Cell Science intramural funding, and the Department of
Biotechnology, Government of India (grant no. BT/PR10855/
BRB/10/1330/2014).
Availability of data and materials
MS proteomics data have been deposited to the
ProteomeXchange Consortium via the PRIDE (61) partner repository with the dataset
identifier PXD015598. The datasets generated and/or analyzed during
the current study are available in the [PRIDE] repository
(https://www.ebi.ac.uk/pride/archive/).
Authors' contributions
VC, MKS and SR conceived the study. VC, DP, SS, TC,
MKS and SR designed the study. VC, DP and SI performed the
experiments. VC, DP, KT, AS,SI and SR analyzed the data. VC, DP,
KT, AS and SR analyzed the proteomics data, performed the
statistical analysis and bioinformatics. VC, DP, KT, SS, TC, AS,
MKS and SR drafted the manuscript. SR provided chemicals and
reagents. All authors have read and approved the final
manuscript.
Ethics approval and consent to
participate
This study was approved by the Ethical Committee of
National Centre for Cell Science (Pune, India) and Armed Forces
Medical College (Pune, India; Insitutional Review Board no.
NCCS/IEC/2016-I/8. Written informed consent was provided from all
patients prior to collection of bone marrow aspirate and serum
samples.
Patient consent for publication
Not applicable.
Competing interests
The authors confirm that they have no competing
interests.
Acknowledgments
The authors would like to thank Professor Michael R.
Green (Department of Molecular, Cell and Cancer Biology, University
of Massachusetts Medical School, Worcester, MA, USA) for the 293T
cells.
References
|
1
|
Hideshima T, Bergsagel PL, Kuehl WM and
Anderson KC: Advances in biology of multiple myeloma: Clinical
applications. Blood. 104:607–618. 2004. View Article : Google Scholar : PubMed/NCBI
|
|
2
|
Ge F, Tao S, Bi L, Zhang Z and Zhang X:
Proteomics: Addressing the challenges of multiple myeloma. Acta
Biochim Biophys Sin (Shanghai). 43:89–95. 2011. View Article : Google Scholar
|
|
3
|
Minnema MC, van der Spek E, van de Donk NW
and Lokhorst HM: New developments in the treatment of patients with
multiple myeloma. Neth J Med. 68:24–32. 2010.PubMed/NCBI
|
|
4
|
Hussein MA: Multiple myeloma: Most common
end-organ damage and management. J Natl Compr Canc Netw. 5:170–178.
2007. View Article : Google Scholar : PubMed/NCBI
|
|
5
|
Doshi M, Lahoti A, Danesh FR, Batuman V
and Sanders PW; American Society of Nephrology Onco-Nephrology
Forum: Paraprotein-Related Kidney Disease: Kidney Injury from
Paraproteins-What Determines the Site of Injury? Clin J Am Soc
Nephrol. 11:2288–2294. 2016. View Article : Google Scholar : PubMed/NCBI
|
|
6
|
Rajkumar SV, Dimopoulos MA, Palumbo A,
Blade J, Merlini G, Mateos MV, Kumar S, Hillengass J, Kastritis E,
Richardson P, et al: International Myeloma Working Group updated
criteria for the diagnosis of multiple myeloma. Lancet Oncol.
15:e538–e548. 2014. View Article : Google Scholar : PubMed/NCBI
|
|
7
|
Avet-Loiseau H, Malard F, Campion L,
Magrangeas F, Sebban C, Lioure B, Decaux O, Lamy T, Legros L,
Fuzibet JG, et al Intergroupe Francophone du Myélome: Translocation
t(14;16) and multiple myeloma: Is it really an independent
prognostic factor? Blood. 117:2009–2011. 2011. View Article : Google Scholar
|
|
8
|
Corre J, Munshi N and Avet-Loiseau H:
Genetics of multiple myeloma: Another heterogeneity level? Blood.
125:1870–1876. 2015. View Article : Google Scholar : PubMed/NCBI
|
|
9
|
Smadja NV, Fruchart C, Isnard F, Louvet C,
Dutel JL, Cheron N, Grange MJ, Monconduit M and Bastard C:
Chromosomal analysis in multiple myeloma: Cytogenetic evidence of
two different diseases. Leukemia. 12:960–969. 1998. View Article : Google Scholar : PubMed/NCBI
|
|
10
|
Tremblay D: Novel targets in multiple
myeloma. Am J Hematol Oncol. 12:18–25. 2017.
|
|
11
|
Hanbali A, Hassanein M, Rasheed W, Aljurf
M and Alsharif F: The evolution of prognostic factors in multiple
myeloma. Adv Hematol. 2017:48126372017. View Article : Google Scholar : PubMed/NCBI
|
|
12
|
Alaoui-Jamali MA and Xu YJ: Proteomic
technology for biomarker profiling in cancer: An update. J Zhejiang
Univ Sci B. 7:411–420. 2006. View Article : Google Scholar : PubMed/NCBI
|
|
13
|
Gholami AM, Hahne H, Wu Z, Auer FJ, Meng
C, Wilhelm M and Kuster B: Global proteome analysis of the NCI-60
cell line panel. Cell Rep. 4:609–620. 2013. View Article : Google Scholar : PubMed/NCBI
|
|
14
|
Aslam B, Basit M, Nisar MA, Khurshid M and
Rasool MH: Proteomics: Technologies and their applications. J
Chromatogr Sci. 55:182–196. 2017. View Article : Google Scholar : PubMed/NCBI
|
|
15
|
Chanukuppa V, Taware R, Chatterjee T,
Sharma S, More TH, Taunk K, Kumar S, Santra MK and Rapole S:
Current Understanding of the Potential of Proteomics and
Metabolomics Approaches in Cancer Chemoresistance: A Focus on
Multiple Myeloma. Curr Top Med Chem. 18:2584–2598. 2018. View Article : Google Scholar : PubMed/NCBI
|
|
16
|
Amaya M, Baer A, Voss K, Campbell C,
Mueller C, Bailey C, Kehn-Hall K, Petricoin E III and Narayanan A:
Proteomic strategies for the discovery of novel diagnostic and
therapeutic targets for infectious diseases. Pathog Dis.
71:177–189. 2014. View Article : Google Scholar : PubMed/NCBI
|
|
17
|
Nagaraj NS, Singh OV and Merchant NB:
Proteomics: A strategy to understand the novel targets in protein
misfolding and cancer therapy. Expert Rev Proteomics. 7:613–623.
2010. View Article : Google Scholar : PubMed/NCBI
|
|
18
|
Moseley FL, Bicknell KA, Marber MS and
Brooks G: The use of proteomics to identify novel therapeutic
targets for the treatment of disease. J Pharm Pharmacol.
59:609–628. 2007. View Article : Google Scholar : PubMed/NCBI
|
|
19
|
Ma TZ, Piao Z, Jin SY and Kwak YG:
Differential expression of serum proteins in multiple myeloma. Exp
Ther Med. 17:649–656. 2019.PubMed/NCBI
|
|
20
|
Bai J, Yang Y, Wang J, Zhang L, Wang F and
He A: Variability of serum novel serum peptide biomarkers
correlates with the disease states of multiple myeloma. Clin
Proteomics. 16:172019. View Article : Google Scholar : PubMed/NCBI
|
|
21
|
Fernando RC, de Carvalho F, Mazzotti DR,
Evangelista AF, Braga WMT, de Lourdes Chauffaille M, Leme AFP and
Colleoni GWB: Multiple myeloma cell lines and primary tumors
proteoma: Protein biosynthesis and immune system as potential
therapeutic targets. Genes Cancer. 6:462–471. 2015.
|
|
22
|
Sasikala P, Harsha C, Bajaj J, Sharma R,
Pandey A and Krishna S: Quantitative Proteomic Profiling Unravels
Dynamic Changes in the Myeloma Cell Proteome Treated with Valproic
Acid (VPA). Blood. 118:18472011. View Article : Google Scholar
|
|
23
|
Chanukuppa V, Paul D, Taunk K, Chatterjee
T, Sharma S, Kumar S, Santra MK and Rapole S: XPO1 is a critical
player for bortezomib resistance in multiple myeloma: A
quantitative proteomic approach. J Proteomics. 209:1035042019.
View Article : Google Scholar : PubMed/NCBI
|
|
24
|
Tripathy S: The role of serum protein
electrophoresis in the detection of multiple myeloma: An experience
of a corporate hospital. J Clin Diagn Res. 6:1458–1461. 2012.
|
|
25
|
Tosi P, Tomassetti S, Merli A and Polli V:
Serum free light-chain assay for the detection and monitoring of
multiple myeloma and related conditions. Ther Adv Hematol. 4:37–41.
2013. View Article : Google Scholar : PubMed/NCBI
|
|
26
|
Gerecke C, Fuhrmann S, Strifler S,
Schmidt‑Hieber M, Einsele H and Knop S: The diagnosis and treatment
of multiple myeloma. Dtsch Arztebl Int. 113:470–476.
2016.PubMed/NCBI
|
|
27
|
Rajkumar SV and Kyle RA: Multiple myeloma:
diagnosis and treatment. In: Mayo Clinic Proceedings; 80. Elsevier;
pp. 1371–1382. 2005
|
|
28
|
Gajendra S, Jha B, Goel S, Sahni T, Sharma
R, Shariq M, Jaiswal S and Sachdev R: Leishman and Giemsa stain: A
new reliable staining technique for blood/bone marrow smears. Int J
Lab Hematol. 37:774–782. 2015. View Article : Google Scholar : PubMed/NCBI
|
|
29
|
Livak KJ and Schmittgen TD: Analysis of
relative gene expression data using real-time quantitative PCR and
the 2-ΔΔCT method. Methods. 25:402–408. 2001. View Article : Google Scholar
|
|
30
|
Gajbhiye A, Dabhi R, Taunk K,
Jagadeeshaprasad MG, RoyChoudhury S, Mane A, Bayatigeri S,
Chaudhury K, Santra MK and Rapole S: Multipronged quantitative
proteomics reveals serum proteome alterations in breast cancer
intrinsic subtypes. J Proteomics. 163:1–13. 2017. View Article : Google Scholar : PubMed/NCBI
|
|
31
|
Takata T, Ishigaki Y, Shimasaki T,
Tsuchida H, Motoo Y, Hayashi A and Tomosugi N: Characterization of
proteins secreted by pancreatic cancer cells with anticancer drug
treatment in vitro. Oncol Rep. 28:1968–1976. 2012. View Article : Google Scholar : PubMed/NCBI
|
|
32
|
Tennant JR: Evaluation of the trypan blue
technique for determination of cell viability. Transplantation.
2:685–694. 1964. View Article : Google Scholar : PubMed/NCBI
|
|
33
|
Courtenay VD: A soft agar colony assay for
Lewis lung tumour and B16 melanoma taken directly from the mouse.
Br J Cancer. 34:39–45. 1976. View Article : Google Scholar : PubMed/NCBI
|
|
34
|
Shimizu Y, Meunier L and Hendershot LM:
pERp1 is significantly up-regulated during plasma cell
differentiation and contributes to the oxidative folding of
immunoglobulin. Proc Natl Acad Sci USA. 106:17013–17018. 2009.
View Article : Google Scholar : PubMed/NCBI
|
|
35
|
Flach H, Rosenbaum M, Duchniewicz M, Kim
S, Zhang SL, Cahalan MD, Mittler G and Grosschedl R: Mzb1 protein
regulates calcium homeostasis, antibody secretion, and integrin
activation in innate-like B cells. Immunity. 33:723–735. 2010.
View Article : Google Scholar : PubMed/NCBI
|
|
36
|
Mori S, Chang JT, Andrechek ER, Matsumura
N, Baba T, Yao G, Kim JW, Gatza M, Murphy S and Nevins JR:
Anchorage‑independent cell growth signature identifies tumors with
metastatic potential. Oncogene. 28:2796–2805. 2009. View Article : Google Scholar : PubMed/NCBI
|
|
37
|
Younes H, Leleu X, Hatjiharissi E, Moreau
AS, Hideshima T, Richardson P, Anderson KC and Ghobrial IM:
Targeting the phosphatidylinositol 3-kinase pathway in multiple
myeloma. Clin Cancer Res. 13:3771–3775. 2007. View Article : Google Scholar : PubMed/NCBI
|
|
38
|
Jin Y and Dai Z: USO1 promotes tumor
progression via activating Erk pathway in multiple myeloma cells.
Biomed Pharmacother. 78:264–271. 2016. View Article : Google Scholar : PubMed/NCBI
|
|
39
|
Alao JP: The regulation of cyclin D1
degradation: Roles in cancer development and the potential for
therapeutic invention. Mol Cancer. 6:242007. View Article : Google Scholar : PubMed/NCBI
|
|
40
|
Desdouets C, Matesic G, Molina CA, Foulkes
NS, Sassone-Corsi P, Brechot C and Sobczak-Thepot J: Cell cycle
regulation of cyclin A gene expression by the cyclic AMP-responsive
transcription factors CREB and CREM. Mol Cell Biol. 15:3301–3309.
1995. View Article : Google Scholar : PubMed/NCBI
|
|
41
|
Hershko A: Mechanisms and regulation of
the degradation of cyclin B. Philos Trans R Soc Lond B Biol Sci.
354:1571–1575; discussion 1575-1576. 1999. View Article : Google Scholar : PubMed/NCBI
|
|
42
|
Landgren O and Weiss BM: Patterns of
monoclonal gammopathy of undetermined significance and multiple
myeloma in various ethnic/racial groups: Support for genetic
factors in pathogenesis. Leukemia. 23:1691–1697. 2009. View Article : Google Scholar : PubMed/NCBI
|
|
43
|
Rajkumar SV and Kyle RA: Treatment of
multiple myeloma and related disorders. Cambridge University Press;
2008, View Article : Google Scholar
|
|
44
|
Teras LR, DeSantis CE, Cerhan JR, Morton
LM, Jemal A and Flowers CR: 2016 US lymphoid malignancy statistics
by World Health Organization subtypes. CA Cancer J Clin.
66:443–459. 2016. View Article : Google Scholar : PubMed/NCBI
|
|
45
|
van Anken E, Pena F, Hafkemeijer N,
Christis C, Romijn EP, Grauschopf U, Oorschot VM, Pertel T, Engels
S, Ora A, et al: Efficient IgM assembly and secretion require the
plasma cell induced endoplasmic reticulum protein pERp1. Proc Natl
Acad Sci USA. 106:17019–17024. 2009. View Article : Google Scholar : PubMed/NCBI
|
|
46
|
Miyagawa-Hayashino A, Yoshifuji H,
Kitagori K, Ito S, Oku T, Hirayama Y, Salah A, Nakajima T, Kiso K,
Yamada N, et al: Increase of MZB1 in B cells in systemic lupus
erythematosus: Proteomic analysis of biopsied lymph nodes.
Arthritis Res Ther. 20:132018. View Article : Google Scholar : PubMed/NCBI
|
|
47
|
Matsumura S, Imoto I, Kozaki K, Matsui T,
Muramatsu T, Furuta M, Tanaka S, Sakamoto M, Arii S and Inazawa J:
Integrative array‑based approach identifies MZB1 as a frequently
methylated putative tumor suppressor in hepatocellular carcinoma.
Clin Cancer Res. 18:3541–3551. 2012. View Article : Google Scholar : PubMed/NCBI
|
|
48
|
Kanda M, Tanaka C, Kobayashi D, Tanaka H,
Shimizu D, Shibata M, Takami H, Hayashi M, Iwata N, Niwa Y, et al:
Epigenetic suppression of the immunoregulator MZB1 is associated
with the malignant phenotype of gastric cancer. Int J Cancer.
139:2290–2298. 2016. View Article : Google Scholar : PubMed/NCBI
|
|
49
|
Herold T, Mulaw MA, Jurinovic V, Seiler T,
Metzeler KH, Dufour A, Schneider S, Kakadia PM, Spiekermann K,
Mansmann U, et al: High expression of MZB1 predicts adverse
prognosis in chronic lymphocytic leukemia, follicular lymphoma and
diffuse large B-cell lymphoma and is associated with a unique gene
expression signature. Leuk Lymphoma. 54:1652–1657. 2013. View Article : Google Scholar
|
|
50
|
Uhlén M, Fagerberg L, Hallström BM,
Lindskog C, Oksvold P, Mardinoglu A, Sivertsson Å, Kampf C,
Sjöstedt E, Asplund A, et al: Proteomics. Tissue-based map of the
human proteome. Science. 347:12604192015. View Article : Google Scholar : PubMed/NCBI
|
|
51
|
Cruz‑Rodriguez N, Combita AL, Enciso LJ,
Quijano SM, Pinzon PL, Lozano OC, Castillo JS, Li L, Bareño J,
Cardozo C, et al: High expression of ID family and IGJ genes
signature as predictor of low induction treatment response and
worst survival in adult Hispanic patients with B-acute
lympho-blastic leukemia. J Exp Clin Cancer Res. 35:642016.
View Article : Google Scholar
|
|
52
|
Peng M, Deng J, Zhou S, Tao T, Su Q and
Yang X and Yang X: The role of Clusterin in cancer metastasis.
Cancer Manag Res. 11:2405–2414. 2019. View Article : Google Scholar : PubMed/NCBI
|
|
53
|
Faiman B, Tariman JD, Mangan PA and Spong
J: Renal complications in multiple myeloma and related disorders:
Survivorship care plan of the IMF Nurse Leadership Board. Clin J
Oncol Nurs. 15:66–76. 2011. View Article : Google Scholar
|
|
54
|
Kim JE, Yoo C, Lee DH, Kim SW, Lee JS and
Suh C: Serum albumin level is a significant prognostic factor
reflecting disease severity in symptomatic multiple myeloma. Ann
Hematol. 89:391–397. 2010. View Article : Google Scholar
|
|
55
|
Zhu J, Wang M, Cao B, Hou T and Mao X:
Targeting the phosphatidylinositol 3-kinase/AKT pathway for the
treatment of multiple myeloma. Curr Med Chem. 21:3173–3187. 2014.
View Article : Google Scholar : PubMed/NCBI
|
|
56
|
Xu H, Li J and Zhou ZG: NEAT1 promotes
cell proliferation in multiple myeloma by activating PI3K/AKT
pathway. Eur Rev Med Pharmacol Sci. 22:6403–6411. 2018.PubMed/NCBI
|
|
57
|
Ohguchi H, Harada T, Sagawa M, Kikuchi S,
Tai YT, Richardson PG, Hideshima T and Anderson KC: KDM6B modulates
MAPK pathway mediating multiple myeloma cell growth and survival.
Leukemia. 31:2661–2669. 2017. View Article : Google Scholar : PubMed/NCBI
|
|
58
|
Kubiczková L, Dúcka M, Sedlaříková L,
Kryukov F, Hájek R and Ševčíková S: Cyclins D in regulation and
dysregulation of the cell cycle in multiple myeloma. Klin Onkol.
26:313–318. 2013.In Czech. View Article : Google Scholar
|
|
59
|
Quinn J, Glassford J, Percy L, Munson P,
Marafioti T, Rodriguez-Justo M and Yong K: APRIL promotes
cell-cycle progression in primary multiple myeloma cells: Influence
of D-type cyclin group and translocation status. Blood.
117:890–901. 2011. View Article : Google Scholar
|
|
60
|
Ettari R, Pallio G, Pizzino G, Irrera N,
Zappalà M, Maiorana S, Di Chio C, Altavilla D, Squadrito F and
Bitto A: Non-covalent immunoproteasome inhibitors induce cell cycle
arrest in multiple myeloma MM.1R cells. J Enzyme Inhib Med Chem.
34:1307–1313. 2019. View Article : Google Scholar : PubMed/NCBI
|
|
61
|
Vizcaíno JA, Csordas A, del‑Toro N, Dianes
JA, Griss J, Lavidas I, Mayer G, Perez-Riverol Y, Reisinger F,
Ternent T, et al: 2016 update of the PRIDE database and its related
tools. Nucleic Acids Res. 44(D1): D447–D456. 2016. View Article : Google Scholar :
|