Introduction
Glioma is a primary brain tumor that originates
histologically from normal glial cells or precursor cells,
accounting for >70% of malignant brain tumors in the United
States in 2009-2013, and it is the most prevalent primary tumor of
the brain and spinal cord (1).
Glioma is a lethal tumor characterized by diffuse infiltration in
the brain and high resistance to conventional cancer therapies
(1). Despite relevant progress in
conventional treatments, the prognosis in patients with glioma
remains almost invariably dismal.
The genesis of gliomas is a complex, multistep
process that includes cellular neoplastic transformation,
resistance to apoptosis, loss of cell cycle control, angiogenesis
and the acquisition of invasive properties (2). Among a number of different
biomolecular events, associations between inflammation and the
development of this type of cancer have been demon-strated
(2,3). As a self-limiting process, the acute
inflammatory response can be anti-tumorigenic and serve a role in
tumor suppression (4). However,
chronic inflammation frequently leads to various chronic diseases,
including cancer (5,6), and is associated with various phases
of tumorigenesis, including cell proliferation, neoplastic
transformation, apoptosis evasion, loss of cell cycle control,
angiogenesis and metastasis (7,8).
During the process of chronic inflammation, a number of
proinflammatory molecules can be synthesized by resident brain
cells and lymphocytes that invade the affected brain tissue, such
as IL-6, IL-1β, TNFα, inducible nitric oxide synthase,
hypoxia-inducible factor-1α (HIF-1α), STAT3, chemokines and
prostaglandins (2,7). The collective activity of these
molecules is largely responsible for the pro-tumorigenic effects
(9). In addition, free radicals
and aldehydes generated during chronic inflammation, such as
reactive oxygen species (ROS) and reactive nitrogen species, can
induce DNA damage and increase the deleterious DNA mutation rate
(7,10). Accordingly, chronic inflammation is
a major cause of cancer (11).
Mitochondria serve key roles in cellular energy
metabolism, generation of free radicals and apoptosis (12). They are biosensors that allow cells
to adapt to environmental stress (13). Since tumorigenesis requires
flexibility for the tumors to adapt to cellular and environmental
alterations, it is not surprising that mitochondria serve a key
role in this process (14).
Mitochondrial abnormalities have been recognized in numerous types
of tumor, such as endometrial cancer (14), cervical cancer (15), breast cancer (16), epithelial ovarian cancer (17) and glioma (18). Mitochondrial dysfunction in glioma
involves abnormalities in energy metabolism, changes in
mitochondrial membrane potential (ΔΨm) regulation, disruption of
apoptotic signaling pathways (19,20)
and mutations in the tricarboxylic acid (TCA) cycle enzyme
isocitrate dehydrogenase (21,22).
The characterization of the full extent of mitochondrial
abnormalities in glioma is a rapidly expanding area of
investigation. In tumors, the most common mitochondria-associated
effect is known as the 'Warburg effect', during which cancer cells
fuel mitochondrial respiration via aerobic glycolysis rather than
via complete glucose oxidation (23). Otto Warburg suggested that this
phenomenon may be caused by an impaired mitochondrial respiratory
capacity in these cells (24). In
addition to energy production, mitochondria perform numerous other
roles, such as ROS generation, production of redox molecules and
metabolites, and regulation of their own biogenesis and turnover,
and fission and fusion dynamics, as well as influencing cell
signaling and cell death (25).
These multifaceted functions of mitochondria impart the tumor cells
with considerable flexibility for growth and survival under harsh
conditions, including hypoxia, cancer treatment and nutrient
depletion (25). Furthermore,
cells have developed mitochondrial quality control mechanisms
(mitophagy) that clear damaged mitochondria caused by pathological
conditions; whether mitophagy is beneficial or harmful to cancer
depends on tumor type and stage (26). During tumorigenesis, decreased
mitophagy may lead to the persistence of damaged mitochondria in
cells, which may result in higher levels of tumor-promoting ROS or
other mitochondrial signals (25).
By contrast, established tumors may require mitophagy for stress
adaptation and survival (25,27,28).
Despite the multitude of mechanisms that have been proposed to
explain the mitochondrial dynamics in tumor cells, the effects of
inflammation on this cellular event in glioma remain
uncharacterized. The present study aimed to explore the
inflammation in glioma using glioma cell lines, clinical samples
and bioinformatics, paying particular attention to the effects of
inflammation on the mitochondria dynamics in glioma.
Materials and methods
Histological samples
A total of 24 paraffin-embedded glioma tissue
sections (5-µm-thick; 12 males and 12 females; age range,
36-74 years; median age of patients, 50.3 years) and 3 normal brain
tissue sections (derived from decompression operations;
5-µm-thick) were obtained between January 2017 and December
2018 from the Department of Histology of the 988 Hospital of Joint
Logistic Support Force (Zhengzhou, China). All samples were fixed
with 4% paraformaldehyde for 24 h at 4°C and evaluated by the
experienced clinical pathologists at the aforementioned hospital
according to the 2016 World Health Organization classification
(29). Among the 24 glioma
samples, 16 samples of paraneoplastic tissues (para-NT; ~2 cm away
from the tumor) were also collected. Additionally, one case of
glioblastoma tissue (evaluated according to the aforementioned
classification; male; 66 years) derived from the Department of
Neurosurgery of the aforementioned hospital was used to perform the
transmission electron microscopy (TEM) analysis. All patients had
not received any other treatment prior to surgery, including
radiotherapy and chemotherapy. The detailed information about the
demo-graphic parameters of patients is listed in Table SI. The present study was approved
by the Life Science Ethics Committee of Zhengzhou University
(Zhengzhou, China) according to the principles expressed in the
Declaration of Helsinki. Written informed consent was provided by
all patients with glioma. Additionally, written informed consent
was obtained from the families of three patients with traumatic
brain injury who underwent the decompression operations.
Furthermore, mRNA microarray expression data was downloaded from
the Chinese Glioma Genome Atlas (CGGA) database [http://www.cgga.org.cn; 290 adult glioma, 165
low-grade glioma (LGG) and 125 glioblastoma (GBM) samples] and The
Cancer Genome Atlas (TCGA) database (https://tcga-data.nci.nih.gov; 512 adult glioma, 26
LGG and 486 GBM samples). The date of access for the two datasets
was 6/30/2019, and the data downloaded from the CGGA dataset was
not normalized.
Hematoxylin and eosin (H&E)
staining
First, deparaffination was performed using 100%
xylene (twice for 5 min) and rehydrated using a gradient ethanol
series (100% twice for 5 min; 95% twice for 5 min; 90% for 5 min;
and 80% for 5 min) at room temperature (RT). After washing with
distilled water for 5 min, the sections were stained using
hematoxylin solution for 5 min at RT and then washed with running
tap water for 1-3 sec. Subsequently, the sections were
differentiated using 1% hydrochloric acid (in 70% ethanol) for 1-3
sec. After washing with running tap water for 10-30 sec and
distilled water for 1-2 sec, the sections were stained in the
working eosin Y solution (0.5% in water) for 3 min at RT. After
washing with distilled water for 1-2 sec, the sections were
dehydrated using a gradient ethanol series (95% twice for 2-3 sec
and 100% twice for 2 min) and then cleared with three washes of
xylene (2 min per wash). Finally, the sections were mounted with
neutral resin. Images were captured and analyzed using a light
microscope (magnification, ×40; IX53; Olympus Corporation).
Cell lines and reagents
The U87-MG (GBM of unknown origin) and U118-MG (GBM
of unknown origin) cell lines were obtained from The Cell Bank of
Type Culture Collection of the Chinese Academy of Sciences. The
cell lines were authenticated via STR profiling. Cells were
cultured in high-glucose DMEM (cat. no. 04-052-1ACS; Biological
Industries), containing 10% FBS (cat. no. 04-001-1ACS; Biological
Industries) and 1% penicillin-streptomycin (cat. no. P1400; Beijing
Solarbio Science & Technology Co., Ltd.) at 37°C in a
humidified incubator with 5% CO2.
Reagents included lipopolysaccharide (LPS; 4
µg/ml; cat. no. L7770; Sigma-Aldrich; Merck KGaA) and human
recombinant IFN-γ (40 ng/ml; cat. no. 11725-HNAS; Sino Biological,
Inc.). Glioma cells were stimulated with LPS and IFN-γ at 37°C in a
humidified incubator with 5% CO2 for 0, 4, 8 or 24
h.
Immunohistochemistry (IHC)
IHC was performed on the aforementioned tissue
sections. First, deparaffination was performed using 100% xylene
(twice for 5 min) and rehydrated using a gradient ethanol series
(100% twice for 5 min; 95% twice for 5 min; 90% for 5 min; and 80%
for 5 min) at RT. Subsequently, antigen retrieval was performed
using a citrate solution (pH 6.0) at 95°C for 15 min. The
endogenous peroxidase activity was quenched by incubating the
slides with 3% hydrogen peroxide at RT for 30 min, followed by
washing in PBS three times for 5 min each. The sections were
incubated for 1 h at RT with blocking solution [5% bovine serum
albumin (cat. no. A8020; Beijing Solarbio Science & Technology
Co., Ltd.) plus 0.3% Triton X-100 in PBS] and subsequently
incubated at 4°C overnight with the following primary antibodies:
Polyclonal goat anti-human ionized calcium binding adapter molecule
1 (Iba1) antibody (Abcam; cat. no. ab5076; 1:500), monoclonal mouse
anti-human IL-6 antibody (Abcam; cat. no. ab9324; 1:500),
polyclonal rabbit anti-human high mobility group box 1 protein
(HMGB1) anti-body (Abcam; cat. no. ab18256; 1:1,000), monoclonal
rabbit anti-human cytochrome C oxidase subunit VIb (COX6B1)
antibody (Abcam; cat. no. ab131277; 1:100), monoclonal mouse
anti-iron-sulfur protein subunit of succinate dehydrogenase (SDHB)
antibody (Abcam; cat. no. ab14714; 1:200) and polyclonal rabbit
anti-human nicotinamide adenine dinucleotide (NADH) dehydrogenase
subunit 6 antibody (Abcam; cat. no. ab81212; 1:400). Subsequently,
the sections were rinsed with PBS and incubated with the
appropriate secondary antibodies for 2 h at RT. For the
3,3′-diamino-benzidine (DAB) staining (HMGB1), the sections were
incubated with horseradish peroxidase-conjugated goat anti-rabbit
IgG polyclonal antibody (1:1,000; ZSGB-BIO, Inc.; cat. no. ZB-23)
for 2 h at RT. Subsequently, DAB was dropped onto the slides, which
were then incubated at 37°C for 3 min. The sections were then
counterstained using haematoxylin, washed with distilled water,
differentiated using 1% hydrochloric acid (in 70% ethanol) and
mounted with neutral resin. For the fluorescence-labelled reaction,
the secondary antibodies used were as follows:
Fluorescein-conjugated goat anti-rabbit IgG (ZSGB-BIO, Inc.; cat.
no. ZF-0311; 1:100), Alexa Fluor 488 donkey anti-rabbit IgG (Abcam;
cat. no. ab150073; 1:1,000), rhodamine-conjugated goat anti-mouse
IgG (ZSGB-BIO, Inc.; cat. no. ZF-0313; 1:100) and Cy3-labeled
donkey anti-goat IgG (Beyotime Institute of Biotechnology; cat. no.
A0502; 1:1,000). The nuclei were stained with DAPI (Beijing
Solarbio Science & Technology Co., Ltd.; cat. no. C0060;
1:5,000) at RT for 15 min. Images were acquired using an OLYMPUS
confocal microscope (magnification, ×40; U-TBI90; Olympus
Corporation) and analyzed using Adobe Photoshop CS6 (Adobe Systems,
Inc.) and Image-Pro Plus (v6.0; Media Cybernetics, Inc.).
Evaluation of the staining reactions was performed based on the
immunoreactive score (IRS)=staining intensity x percentage of
positive cells (30). The staining
intensity was determined as: 0, negative; 1, weak (light brown
staining); 2, moderate (brown staining); and 3, strong (dark brown
staining). The percentage of positive cells was determined as: 0,
no positive cells; 1, ≤10% positive cells; 2, 11-50% positive
cells; 3, 51-80% positive cells; and 4, >80% positive cells. At
least three visual fields from different areas of each tumor
specimen were used for the IRS evaluation.
Immunocytochemistry (ICC)
U87-MG and U118-MG glioma cells were grown on glass
coverslips in 6-well plates. After the appropriate treatments with
LPS (4 µg/ml) and IFN-γ (40 ng/ml) for 0, 4, 8 or 24 h at
37°C, cells were washed twice with ice-cold PBS and fixed with
freshly prepared 4% paraformaldehyde in PBS at RT for 15 min,
followed by permeabilization with 0.3% Triton X-100 in PBS for 20
min. Subsequently, the cells were blocked with blocking solution
(as aforementioned for IHC) for 1 h at RT and incubated with the
following primary antibodies at 4°C overnight: Monoclonal mouse
anti-4-hydroxynonenal (HNE) antibody (Abcam; cat. no. ab48506;
1:500), mono-clonal rabbit anti-human lysosomal associated membrane
protein 1 (LAMP1) antibody (Cell Signaling Technology, Inc.; cat.
no. 9091; 1:200) and monoclonal rabbit anti-LC3B antibody (Cell
Signaling Technology, Inc.; cat. no. 3868; 1:200). Subsequently,
the cells were washed three times with PBS and stained with the
appropriate fluorescently conjugated secondary antibodies (as
aforementioned for IHC) for 2 h at RT. The nuclei were
counterstained with DAPI at RT for 15 min. In some experiments,
cells were preloaded with Mitotracker Red (Invitrogen; Thermo
Fisher Scientific, Inc.; cat. no. M7512; 200 nM) at 37°C for 25 min
before fixation. Finally, the coverslips were mounted in 50%
glycerol-PBS anti-fade mounting medium. Images were acquired using
an OLYMPUS confocal microscope (magnification, ×100) and analyzed
with Adobe Photoshop CS6 and Image-Pro Plus (v6.0; Media
Cybernetics, Inc.).
Evaluation of various types of mitochondria was
based on the ratio between the major axis and minor axis ('Aspect'
function in the 'measurements' of the Image-Pro Plus for each
mitochondrion) (31). If the ratio
was between 1.0 and 1.5, the mitochondrion was categorized into the
'spherical (or ring-like)' group. If the ratio was >1.5, the
mitochondrion was categorized into the 'rod or tubular' group
(31). The ratio of cells with
fragment, intermediate or tubular mitochondria was analyzed as
determined by the presence of these two types of mitochondria:
>60% of spherical (or ring-like) mitochondria represented a cell
with fragment mitochondria; >60% of rod or tubular mitochondria
represented a cell with tubular mitochondria; 40-60% of both types
of mitochondria represented a cell with intermediate mitochondria.
A total of 50-150 cells were analyzed for each time point
treatment.
To quantify the autophagic cells, the ratio of
autophagic cells was analyzed as determined by the presence of LC3B
puncta (>10 puncta indicated a positive cell). A total of 50-150
cells were analyzed for each time point treatment.
Cell transfection
Glioma cells were cultured to 80% confluence in
sixwell culture plates, and then transfected with 2 µg
GFP-LC3 plasmid (provided by Professor Shuping Zhang, State Key
Laboratory of Biomembrane and Membrane Biotechnology, School of
Life Sciences, Tsinghua University, Beijing, China) using
SimpleFect Transfection Reagent (Zhengzhou Kebang Biological
Technology Co., Ltd.; cat. no. profect-01) according to the
manufacturer's protocol at 37°C for 16 h. Subsequent
experimentations were performed ~12 h after transfection.
Western blotting
Cells were lysed in RIPA buffer (Beijing Solarbio
Science & Technology Co., Ltd.; cat. no. R0010) and incubated
on ice for ≥30 min. The lysates were cleared by centrifugation at
15,294 × g at 4°C for 15 min, and the supernatant fractions were
collected. The protein amounts in the whole-cell lysates were
determined using the BCA Protein Assay kit (Beijing Solarbio
Science & Technology Co., Ltd.; cat. no. PC0020). Equal amounts
of proteins (20 µg/lane) were separated via 10-12% SDS-PAGE,
and the proteins were then transferred to PVDF membranes (EMD
Millipore; cat. no. IPVH00010). Blocking was performed for 1 h at
RT using 5% non-fat dry milk in TBS with 1% Tween 20 (TBST) at RT.
The blots were incubated with primary antibodies overnight at 4°C,
followed by washing three times with TBST and incubation with
peroxidase-conjugated goat anti-mouse or anti-rabbit IgG secondary
antibodies (ZSGB-BIO, Inc.; cat. no. ZB-2305 or ZB-2301,
respectively; 1:5,000) for 2 h at RT. The primary antibodies used
were as follows: Monoclonal rabbit anti-human hexokinase 1 (HK1)
antibody (Cell Signaling Technology, Inc.; cat. no. 2024; 1:1,000),
monoclonal rabbit anti-human citrate synthase (CS) antibody (Cell
Signaling Technology, Inc.; cat. no. 14309; 1:1,000), monoclonal
rabbit anti-human lactate dehydrogenase A (LDHA) antibody (Cell
Signaling Technology, Inc.; cat. no. 3582; 1:1,000), monoclonal
rabbit anti-human COX6B1 antibody (Abcam; cat. no. ab131277;
1:1,500), monoclonal mouse anti-SDHB antibody (Abcam; cat. no.
ab14714; 1:200), monoclonal mouse anti-human β-Actin (ZSGB-BIO,
Inc.; cat. no. TA-09; 1:2,000), mono-clonal rabbit anti-LC3B
antibody (Cell Signaling Technology, Inc.; cat. no. 3868; 1:500)
and polyclonal rabbit anti-GAPDH antibody (Hangzhou Xianzhi
Biological Technology Co., Ltd.; cat. no. AB-P-R 001; 1:1,000). The
blots were visualized using ECL luminescence reagent (Dalian Meilun
Biotechnology Co., Ltd.; cat. no. MA0186-Sep-25D) and analyzed
using ImageJ v1.46r (National Institutes of Health).
TEM
The glioma tissues and the LPS- and IFN-γ-pretreated
glioma cells were quickly fixed in 4% glutaraldehyde in 0.1 M
phosphate buffer (pH 7.4) at 4°C for 2 h and then harvested with a
rubber scraper. After centrifugation at 106 × g for 5 min at 4°C,
cell pellets immersed in 4% glutaraldehyde in 0.1 M phosphate
buffer (pH 7.4) were sent to Wuhan Servicebio Technology Co., Ltd.,
or to the electron microscopy center of Henan University of Chinese
Medicine (Zhengzhou, China) where the remaining procedures were
performed. Sections were examined using a JEM-1400 electron
microscope (JEOL, Ltd.).
Flow cytometric analyses
To measure the total cellular ROS (ceROS) levels,
the LPS and IFN-γ-treated U87-MG cells were collected via
centrifugation at 4°C at 106 × g for 10 min and dissociated into a
single-cell suspension using Accutase reagents (Beijing Solarbio
Science & Technology Co., Ltd.) according to the manufacturer's
protocol. Subsequently, the cells were resuspended in prewarmed
DMEM containing freshly prepared 2′,7′-dichlorodihydrofluorescein
diacetate (DCFH-DA; Beyotime Institute of Biotechnology; cat. no.
S0033) according to the manufacturer's protocol. After incubation
at 37°C for 20 min, the cells were washed twice with DMEM and then
subjected to flow cytometry analyses (Accuri C6; BD Biosciences
Co., Ltd). To measure the mitochondrial ROS (mtROS) levels, treated
U87-MG cells were stained with MitoSOX-Red (2 µM; Molecular
Probes; Thermo Fisher Scientific, Inc.) at 37°C for 20 min and
washed twice with prewarmed PBS. At the end of the washing steps,
the cells were analyzed via flow cytometry (Accuri C6; BD
Biosciences Co., Ltd) after being collected and resuspended in
prewarmed PBS as a single-cell suspension. To measure the ΔΨm,
treated glioma cells were collected and resuspended as a
single-cell suspension in 1 ml culture medium, followed by
incubation with the JC-1 staining solution (Beyotime Institute of
Biotechnology; cat. no. C2006) for 20 min at 37°C. After
incubation, the cells were washed twice with JC-1 staining buffer
and then analyzed via flow cytometry (Accuri C6; BD Biosciences
Co., Ltd). Apoptosis was measured according to the manufacturer's
protocol of the Annexin V-FITC Apoptosis Analysis kit (Tianjin
Sungene Biotech Co., Ltd.; cat. no. AO2001-02P-G). Briefly, treated
U87-MG cells were collected and resuspended in 1 ml 1X binding
buffer. Subsequently, 5 µl Annexin V-FITC was added to the
cells, followed by incubation for 10 min at RT in the dark.
Finally, 5 µl PI solution was added, followed by incubation
for 5 min at RT. The early and late apoptotic cells were then
analyzed via flow cytometry (Accuri C6; BD Biosciences Co., Ltd).
The software used for flow cytometric analyses was FlowJo 10.0.7
(FlowJo LLC).
Cell Counting Kit-8 (CCK-8) assay
Cell viability was assessed using CCK-8 assays
(Dojindo Molecular Technologies, Inc.; cat. no. 347-07621), which
were performed in 96-well plates according to the manufacturer's
protocol. Briefly, cells were added to 96-well plates and grown to
80% confluence. The CCK-8 reagent (10 µl/well) was added to
glioma cells at 0, 4, 8 and 24 h after LPS and IFN-γ treatment. The
reaction system was incubated for 2 h at 37°C in a humidified
incubator with 5% CO2, after which the absorbance
readings were obtained at 450 nm.
ELISA
The glioma cell culture supernatants were collected
at 4°C at 106 × g for 10 min after LPS and IFN-γ treatment and then
to measure the secreted inflammatory mediator IL-6 using IL-6 ELISA
kits (Neobioscience; cat. no. EHC007) according to the
manufacturer's protocol. Absorbance was measured at 450 nm, and
concentrations of IL-6 were calculated according to standard
curves.
Statistical analysis
All experiments were repeated at least three times,
and the statistical results were expressed as the mean ± SEM.
Histograms and significance were obtained with Origin 9 (OriginLab)
and GraphPad Prism 5.0 (GraphPad Software, Inc.) using Student's
t-test or one-way ANOVA followed by Tukey's multiple comparison
test. Unpaired Student's t-test was used for comparisons between
the normal and glioma groups, and between the LGG and GBM groups,
while paired Student's t-test was used for comparisons between the
para-NT and glioma groups. ANOVA was used for comparisons among
multiple groups. P<0.05 was considered to indicate a
statistically significant difference.
Results
Inflammation in glioma
A major stimulus that triggers the hallmarks of
cancer cells within solid tumors is the activation of inflammatory
cells and the subsequent local release of proinflammatory cytokines
(2,11). Therefore, the present study first
examined inflammatory cell activation and proinflammatory cytokine
expression in glioma samples. The results revealed that locally
recruited inflammatory cells and Iba1+ microglia were
highly enriched in the glioma samples (Fig. 1A and B). Additionally, the
Iba1+ processes of microglia in glioma samples were
markedly shortened and the cell bodies were enlarged compared with
those in para-NT samples, indicating microglia activation (Fig. 1A and B). Furthermore, the glioma
tissues were highly immunoreactive with IL-6 (Fig. 1C), which is one of the major
proinflammatory cytokines released from gliomas (30). Additionally, a number of
HMGB1+ inflammatory cells were observed in glioma
samples (Fig. 1D). It has been
previously demon-strated that HMGB1 can be released by inflammatory
cells into the extracellular matrix, where it participates in the
inflammatory process (32).
Subsequently, the gene expression data for other inflammatory
factors were analyzed in the CGGA dataset. The results revealed
that the expression levels of the proinflammatory cytokines
IL-6, IL-8, HIF-1α, STAT3, NF-κB1 and
NF-κB2 were significantly upregulated in GBM compared with
in LGG samples (Fig. 1E). Overall,
the present results demonstrated the presence of inflammation in
glioma.
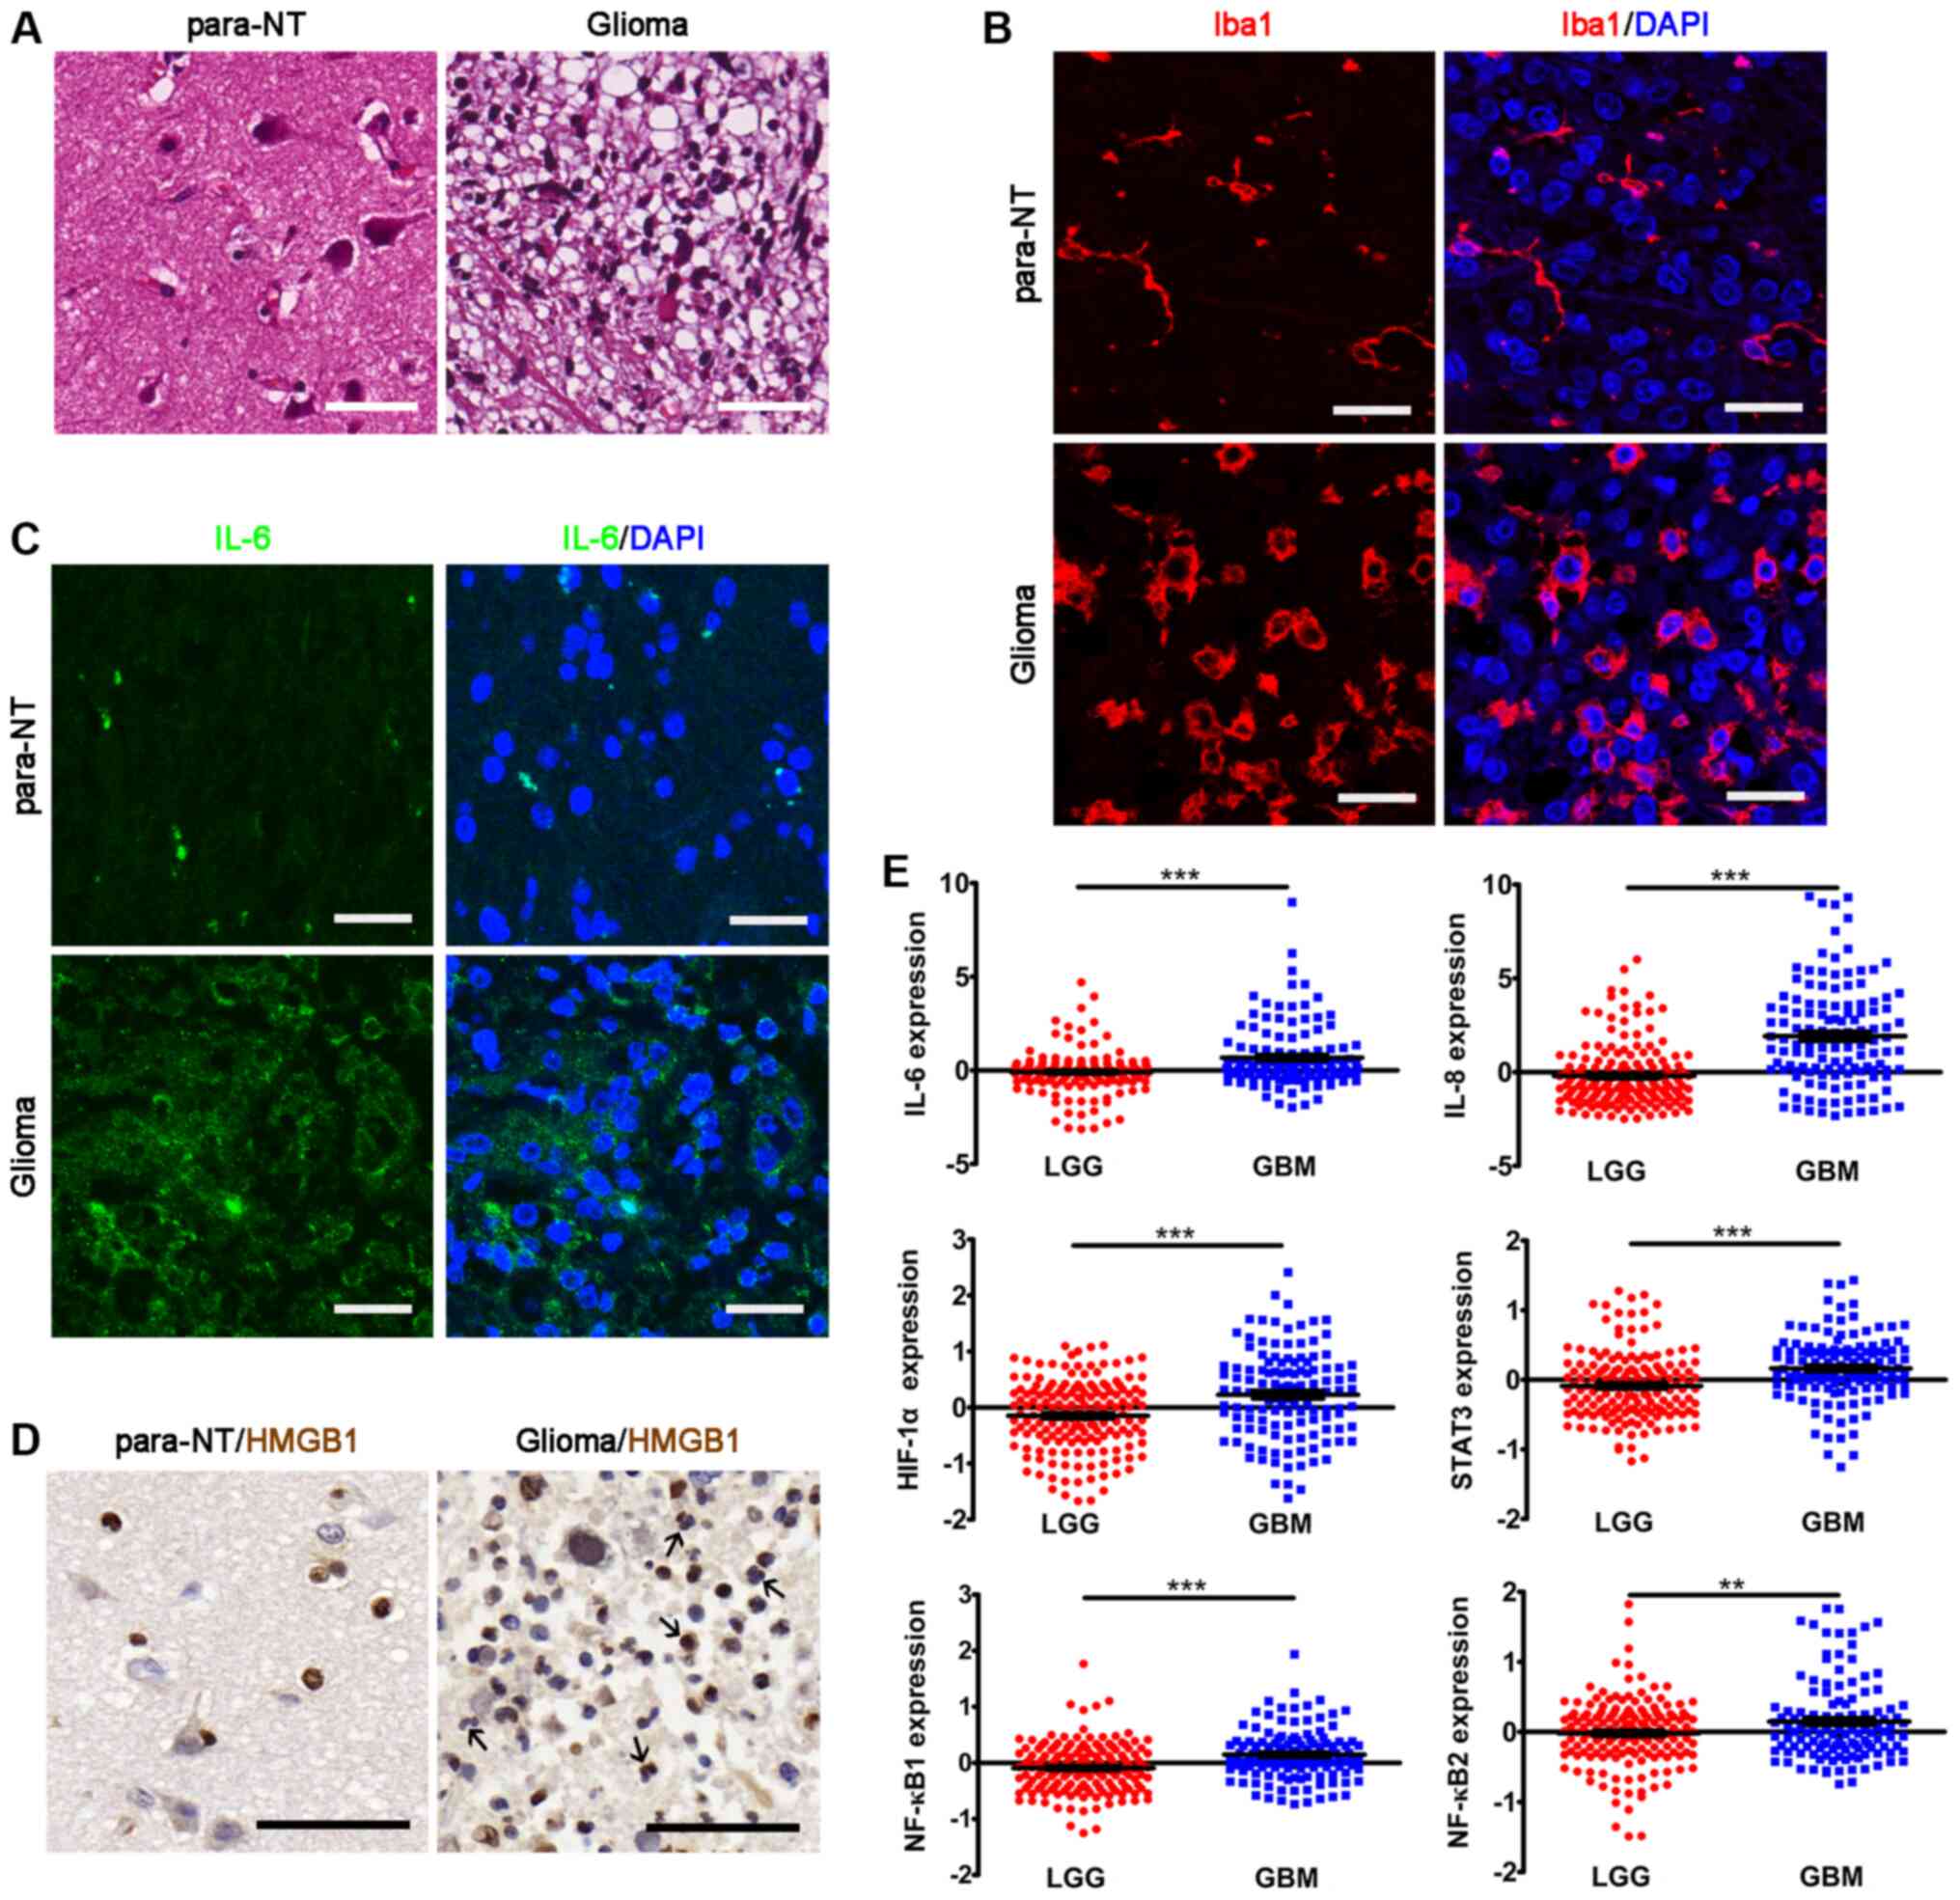 | Figure 1Inflammation in glioma. (A)
Hematoxylin and eosin staining of glioma tissues and para-NTs.
Scale bar, 50 µm.(B) IHC of Iba1 showing the microglia in
glioma tissues and para-NTs. Scale bar, 25 µm. (C) IHC of
IL-6 in glioma tissues and para-NTs. DAPI was used for nuclear
visualization. Scale bar, 25 µm. (D) IHC of HMGB1 in glioma
tissues and para-NTs. HMGB1+ inflammatory cells are
indicated by black arrows. Scale bar, 50 µm. (E) Analyses of
the mRNA expression levels of proinflammatory factors in the
Chinese Glioma Genome Atlas dataset. The statistical significance
was evaluated via unpaired Student's t-test.
**P<0.01; ***P<0.001. para-NTs,
para-neoplastic tissues; LGG, low grade glioma; GBM, glioblastoma;
IHC, immunohistochemistry; HMGB1, high mobility group box 1; Iba1,
ionized calcium binding adapter molecule 1; HIF-1α,
hypoxia-inducible factor-1α. |
Defects in mitochondrial structure and
metabolism in glioma
Subsequently, the mitochondrial structure in a
sample from a GBM case (male; 66 years) was examined via TEM.
Abnormal mitochondrial structure was observed in the glioma sample,
including swelling associated with disarrangement of the cristae
and partial or total cristolysis (Fig.
2A). Due to the damaged mitochondrial structure, the present
study then examined whether the electron transfer chain (ETC)
complexes were also affected. The expression levels of NADH
dehydrogenase subunit 6, SDHB and COX6B1 were analyzed, which all
participate in mitochondria oxidative phosphorylation (OXPHOS)
(33-35). The IHC results revealed that,
compared with in normal tissues, the levels of NADH dehydrogenase
subunit 6 and SDHB in glioma tissues were significantly lower,
while COX6B1 expression in glioma tissues was significantly higher
compared with that in para-NTs (Fig.
2B and C). The gene expression data in the CGGA revealed that
the expression levels of the glycolysis enzymes HK1,
LDHA and GAPDH were significantly upregulated in GBM
compared with in LGG samples (Fig.
2D). Furthermore, both the expression levels of the OXPHOS
enzyme ATP synthase (ATP5A1) and the rate-limiting enzyme of
the TCA cycle CS were significantly downregulated in GBM
compared with in LGG samples in TCGA dataset (Fig. 2E). Overall, the current results
revealed an abnormal mitochondrial structure and metabolic
reprogramming in glioma.
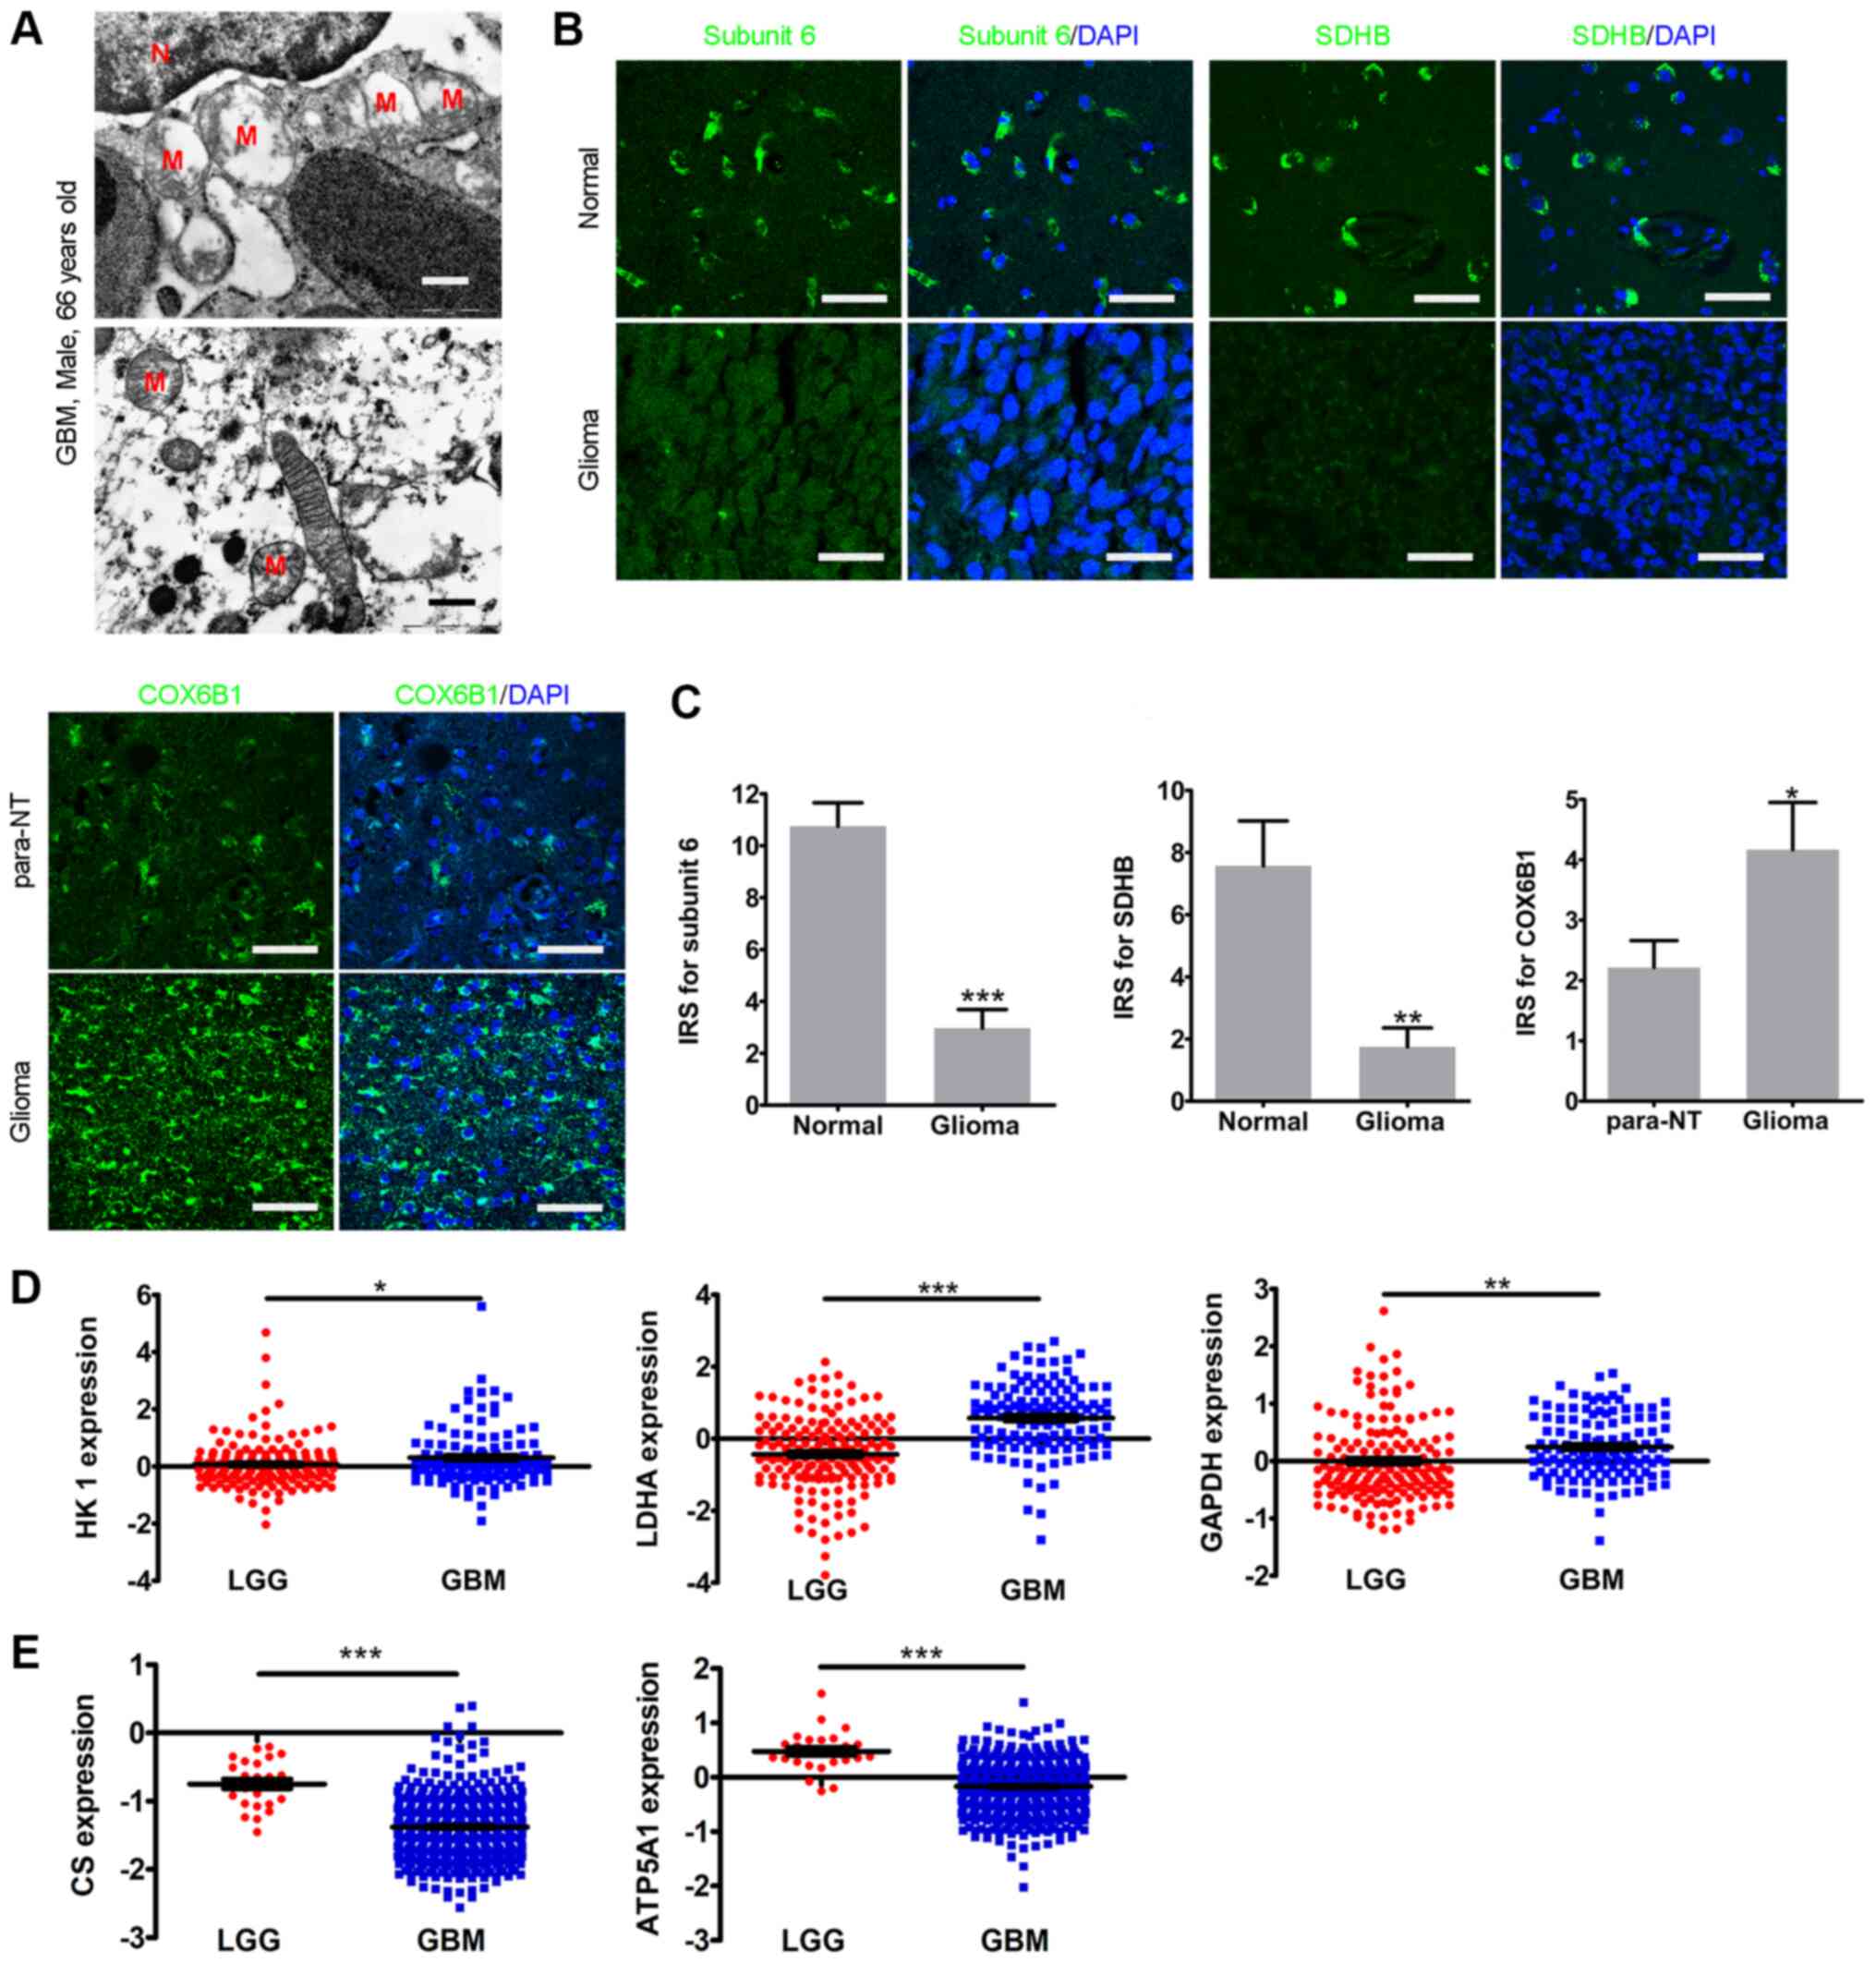 | Figure 2Mitochondrial defects in glioma. (A)
Representative transmission electron microscopy images of a case of
GBM (male, 66 years). Scale bar, 500 nm. (B) Immunohistochemistry
of subunit 6, SDHB and COX6B1 in glioma tissues and normal or
para-NTs. DAPI was used for nuclear visualization. Scale bar, 25
µm. (C) Histograms of the statistical analyses of the IRSs
of subunit 6, SDHB and COX6B1. (D) Expression levels of HK1,
LDHA and GAPDH in the Chinese Glioma Genome Atlas.
(E) Expression levels of CS and ATP5A1 in The Cancer
Genome Atlas. The statistical significance was evaluated via
unpaired Student's t-test, except for COX6B1 (paired Student's
t-test). *P<0.05; **P<0.01;
***P<0.001. Subunit 6, NADH dehydrogenase subunit 6;
M, mitochondria; N, nucleus; GBM, glioblastoma; LGG, low-grade
glioma; para-NTs, para-neoplastic tissues; IRS, immunoreactive
score; SDHB, iron-sulfur protein subunit of succinate
dehydrogenase; COX6B1, cytochrome C oxidase subunit VIb; HK1,
hexokinase 1; CS, citrate synthase; LDHA, lactate dehydrogenase A;
ATP5A1, ATP synthase. |
Inflammation induces mitochondrial
network remodeling and mitochondrial dysfunction in glioma
cells
To investigate the effect of inflammation on the
mitochondrial network in glioma, glioma cells were analyzed in
vitro following direct stimulation with LPS and IFN-γ, a
well-established combination of factors that mimic the inflammatory
response in vitro (36).
The ELISA assay indicated that the secretion of IL-6, the major
proinflammatory cytokines released from gliomas (30), was significantly increased at 8 and
24 h in U87-MG cells and at 4, 8 and 24 h in U118-MG cells after
the stimulation of LPS and IFN-γ (Fig. S1), indicating the inflammatory
response in glioma cells. By labeling the mitochondria with
Mitotracker Red, it was revealed that the ratio of glioma cells
with fragmented mitochondria was significantly increased at 4 and 8
h after LPS and IFN-γ stimulation (Figs. 3A and S2Aa-f). Compared with the 0 h group, the
ratio of cells with fragmented mitochondria in U87-MG was decreased
at 24 h after the proinflammatory stimulation, while it was still
high at 24 h in U118-MG cells (Figs.
3A and S2Aa-f). Notably, the
fragmented mitochondria revealed spherical or ring-like
morphologies after exposure to the proinflammatory stimuli
(Figs. 3A and S2Aa-f). The TEM examination revealed
that these enlarged mitochondria were swollen and contained
vacuoles, and that the cristae were absent (Figs. 3B and S2Ag-h). Furthermore, ring-like
mitochondria were observed (Fig.
3B). The present results indicated that the fragmentation and
formation of enlarged mitochondria may represent a mitochondrial
stress response to inflammation stimuli.
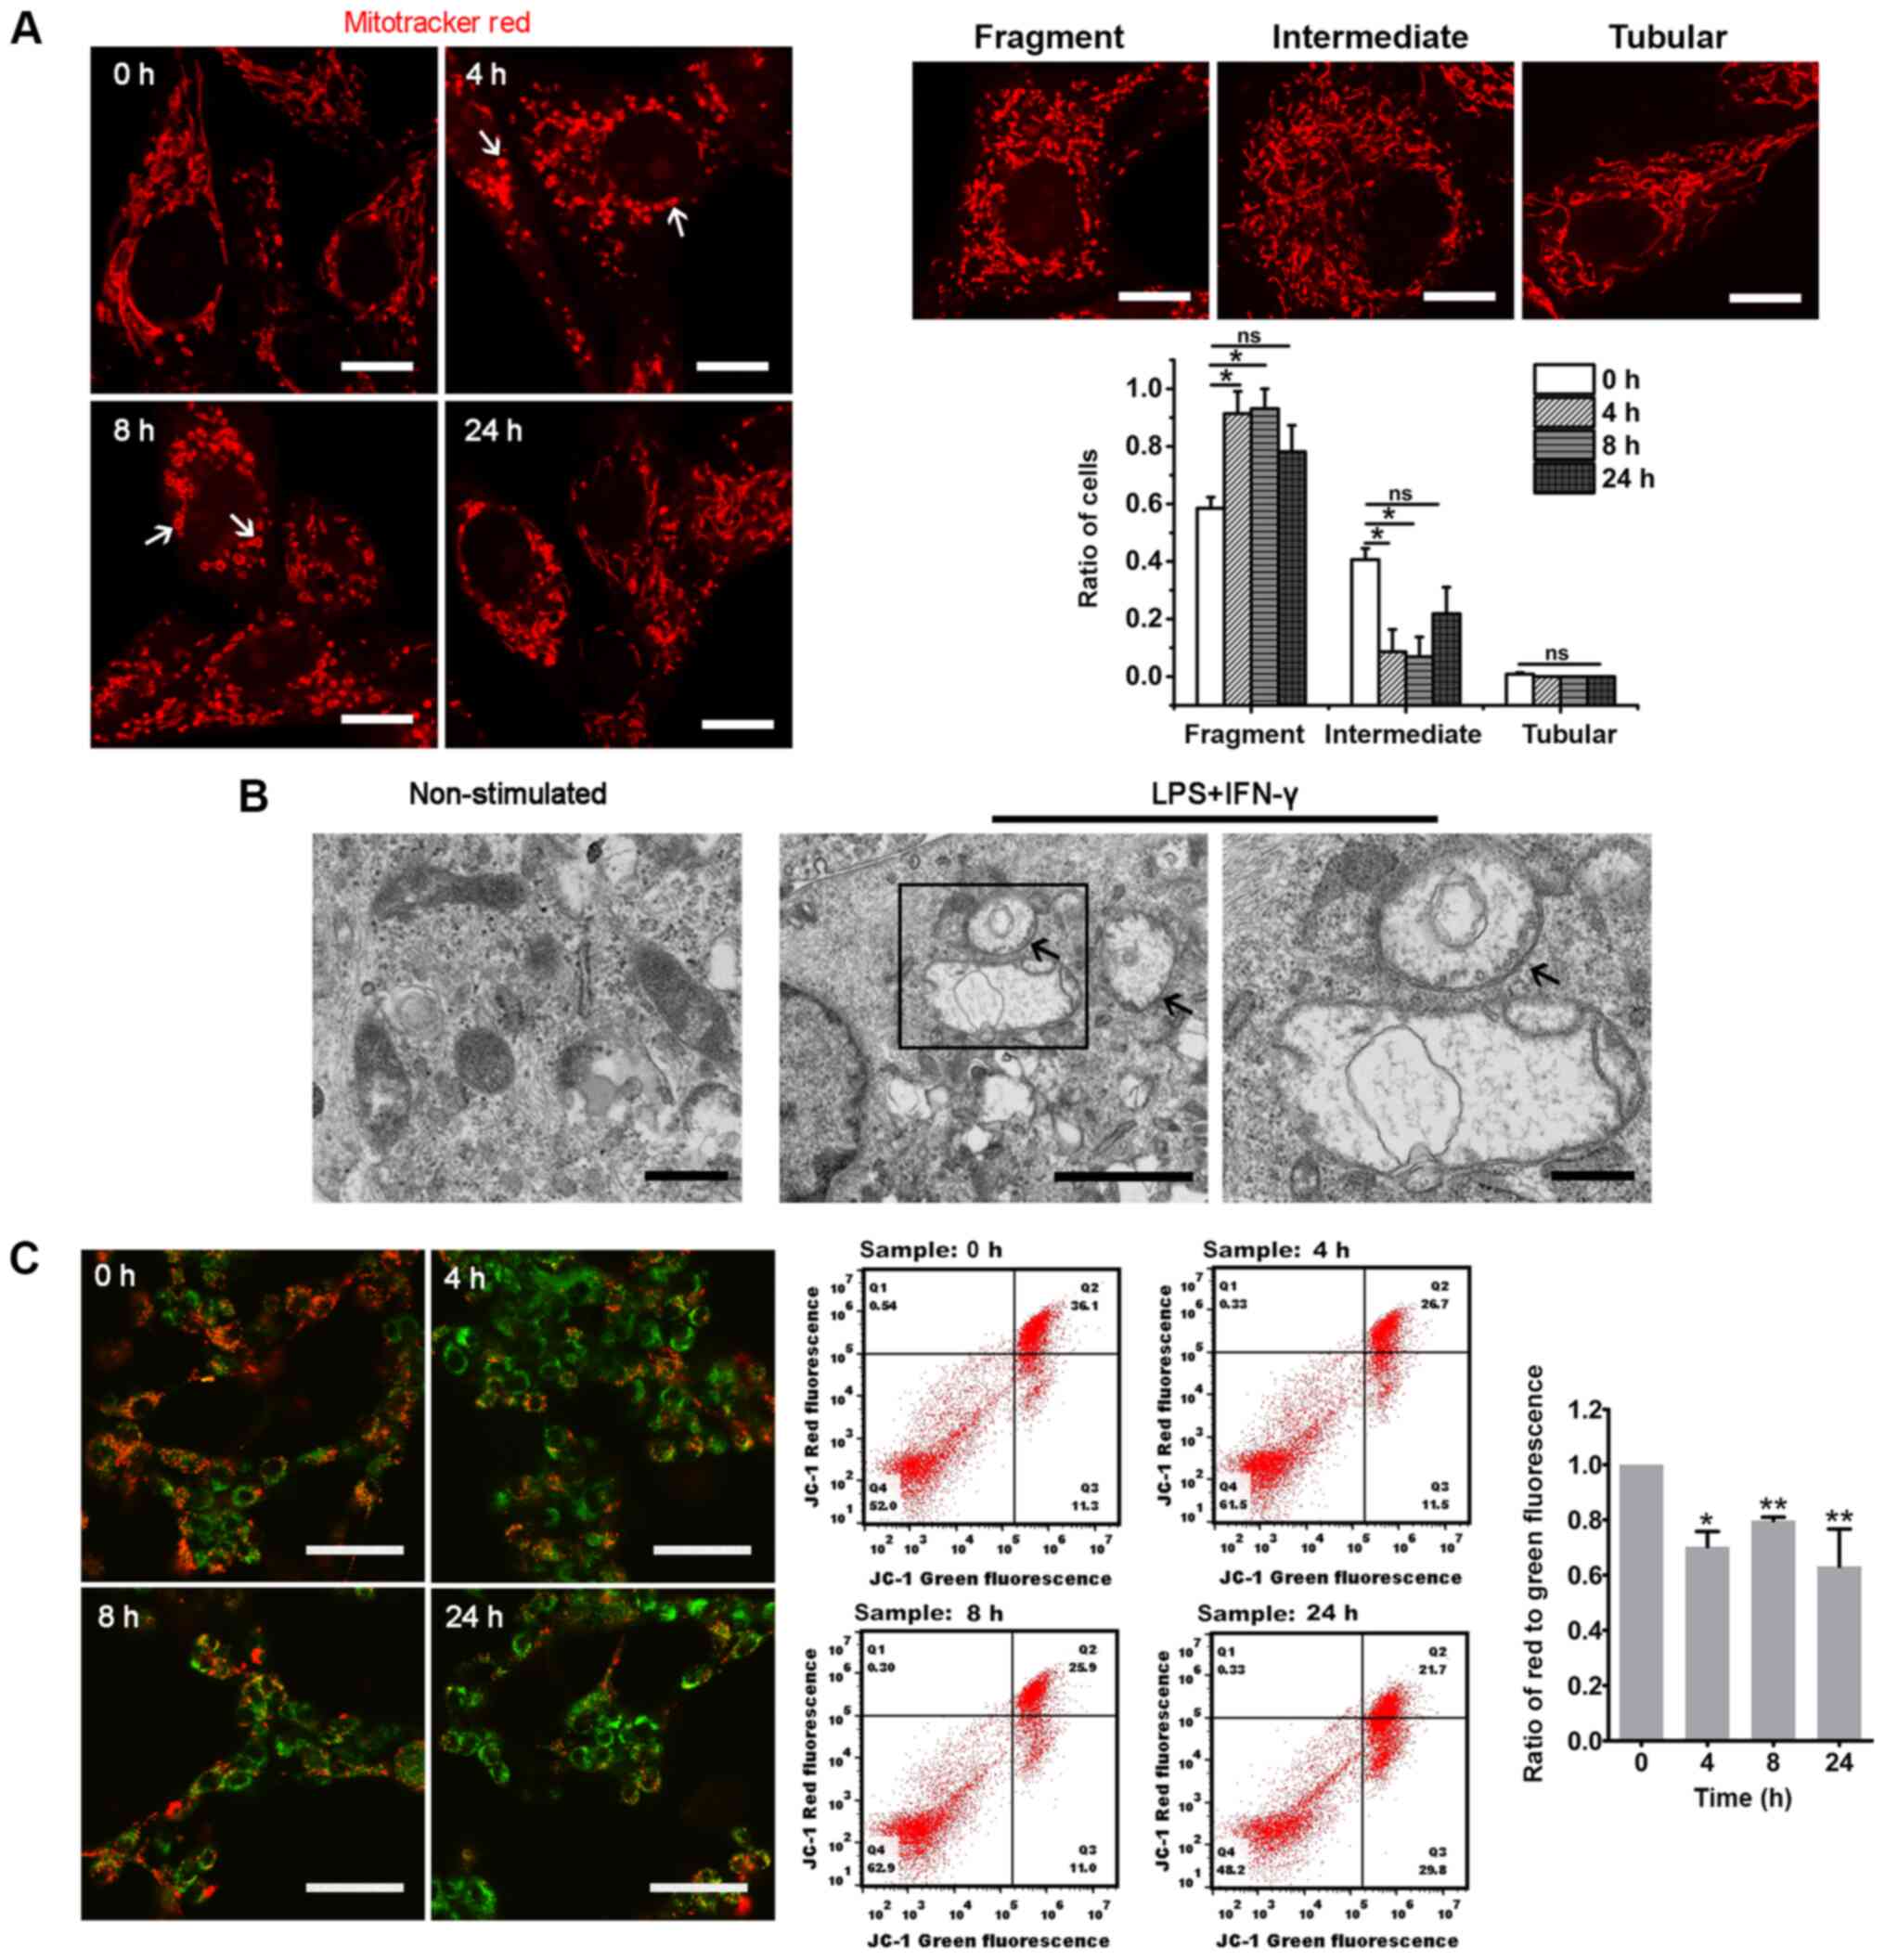 | Figure 3Proinflammatory stimuli induce
mitochondrial network remodeling in glioma cells. (A)
Representative images of mitochondria in U87-MG cells at different
time points after LPS and IFN-γ stimulation. Mitotracker Red served
as the mitochondrial probe. The white arrows indicate the spherical
or ring-like mitochondria. The histogram represents the statistical
analyses of the ratios of glioma cells with fragmented,
intermediate or tubular mitochondria (n=4; 50-150 cells per time
point). The upper right three images are representative of glioma
cells with fragmented, intermediate or tubular mitochondria. Scale
bar, 10 µm. (B) Representative transmission electron
microscopy images of mitochondria in U87-MG cells before
(non-stimulated; left panel; scale bar, 500 nm) and after LPS and
IFN-γ treatment (middle panel; scale bar, 2 µm). The black
arrows indicate the ring-like mitochondria. The rectangular area
was enlarged in the right panel (scale bar, 500 nm). (C)
Fluorescent images were acquired via confocal microscopy after
U87-MG cells were treated with the JC-1 staining solution (scale
bar, 50 µm). A change from red to green reflects decreased
ΔΨm, which was also analyzed via flow cytometry. The histogram
presents the statistical analysis of the ΔΨm after LPS and IFN-γ
treatment (n=3). The statistical significance was evaluated via
one-way ANOVA followed by Tukey's post hoc test.
*P<0.05; **P<0.01; ns, not significant;
LPS, lipopolysaccharide; ΔΨm, mitochondrial membrane potential;
fluor, fluorescence. |
Inflammation causes mitochondrial
dysfunction in glioma cells
The aforementioned alterations in the mitochondrial
dynamics strongly suggested that these alterations may contribute
to the mitochondrial dysfunction in glioma. As expected, the
proinflammatory stimuli caused a significant decrease in ΔΨm in
glioma cells indicated by a decrease of the ratio of red to green
JC-1 fluorescence (Figs. 3C and
S2B). Furthermore, the
mitochondria metabolic profile was potentially affected. First, ROS
measurements in stimulated U87-MG cells were performed. DCFH-DA and
MitoSOX-Red were used to examine the ceROS and mtROS levels,
respec-tively. After 4 h of treatment with LPS and IFN-γ, the
levels of ceROS and mtROS production were significantly increased
compared with those in non-stimulated glioma cells, and the high
ROS levels persisted until 8 h after treatment; notably, mtROS
production decreased at 24 h, but ceROS production was unchanged
(Fig. 4A and B). Therefore,
proinflammatory stimuli may lead to transient ROS production by
mitochondria as they undergo structural disruption in U87-MG cells.
ROS levels in U118-MG cells were also evaluated, but there was no
statistically significant difference (data not shown). The
spherical or ring-like mitochondria in the present experiment were
similar to those in oxidatively damaged cultured cardiomyocytes
(37). Due to this similarity, the
present study next examined whether the mitochondrial membrane
proteins and lipids were oxidized in glioma cells. Notably, ICC
staining with an antibody to HNE, which recognizes oxidized
proteins and lipids, did not specifically colocalize with the
mitochondria, indicating that there was no oxidative damage of the
mitochondrial membrane after the stimulation with LPS and IFN-γ
(Figs. 4C and S3). Subsequently, the mitochondrial
metabolic profile was analyzed, revealing that stimulated U87-MG
glioma cells exhibited marked increases in their expression levels
of HK1 and LDHA, which are both glycolysis enzymes (Fig. 4D). By contrast, the expression
levels of the ETC complexes COX6B1 and SDHB were significantly
downregulated in cells after 8 h of stimulation, consistent with
OXPHOS alterations (Fig. 4D).
However, the expression levels of the rate-limiting enzyme of the
TCA cycle CS were significantly upregulated in the stimulated
glioma cells, which was inconsistent with the bioinformatics
results, indicating a possible discrimination between glioma cells
in vitro and glioma tissues (Fig. 4D). Notably, the mitochondrial
metabolic profile in U118-MG cells was not significantly changed
after proinflammatory stimuli (data not shown). Overall, the
current results revealed that inflammation may lead to defective
mitochondrial function and metabolic reprogramming in glioma cells
in vitro.
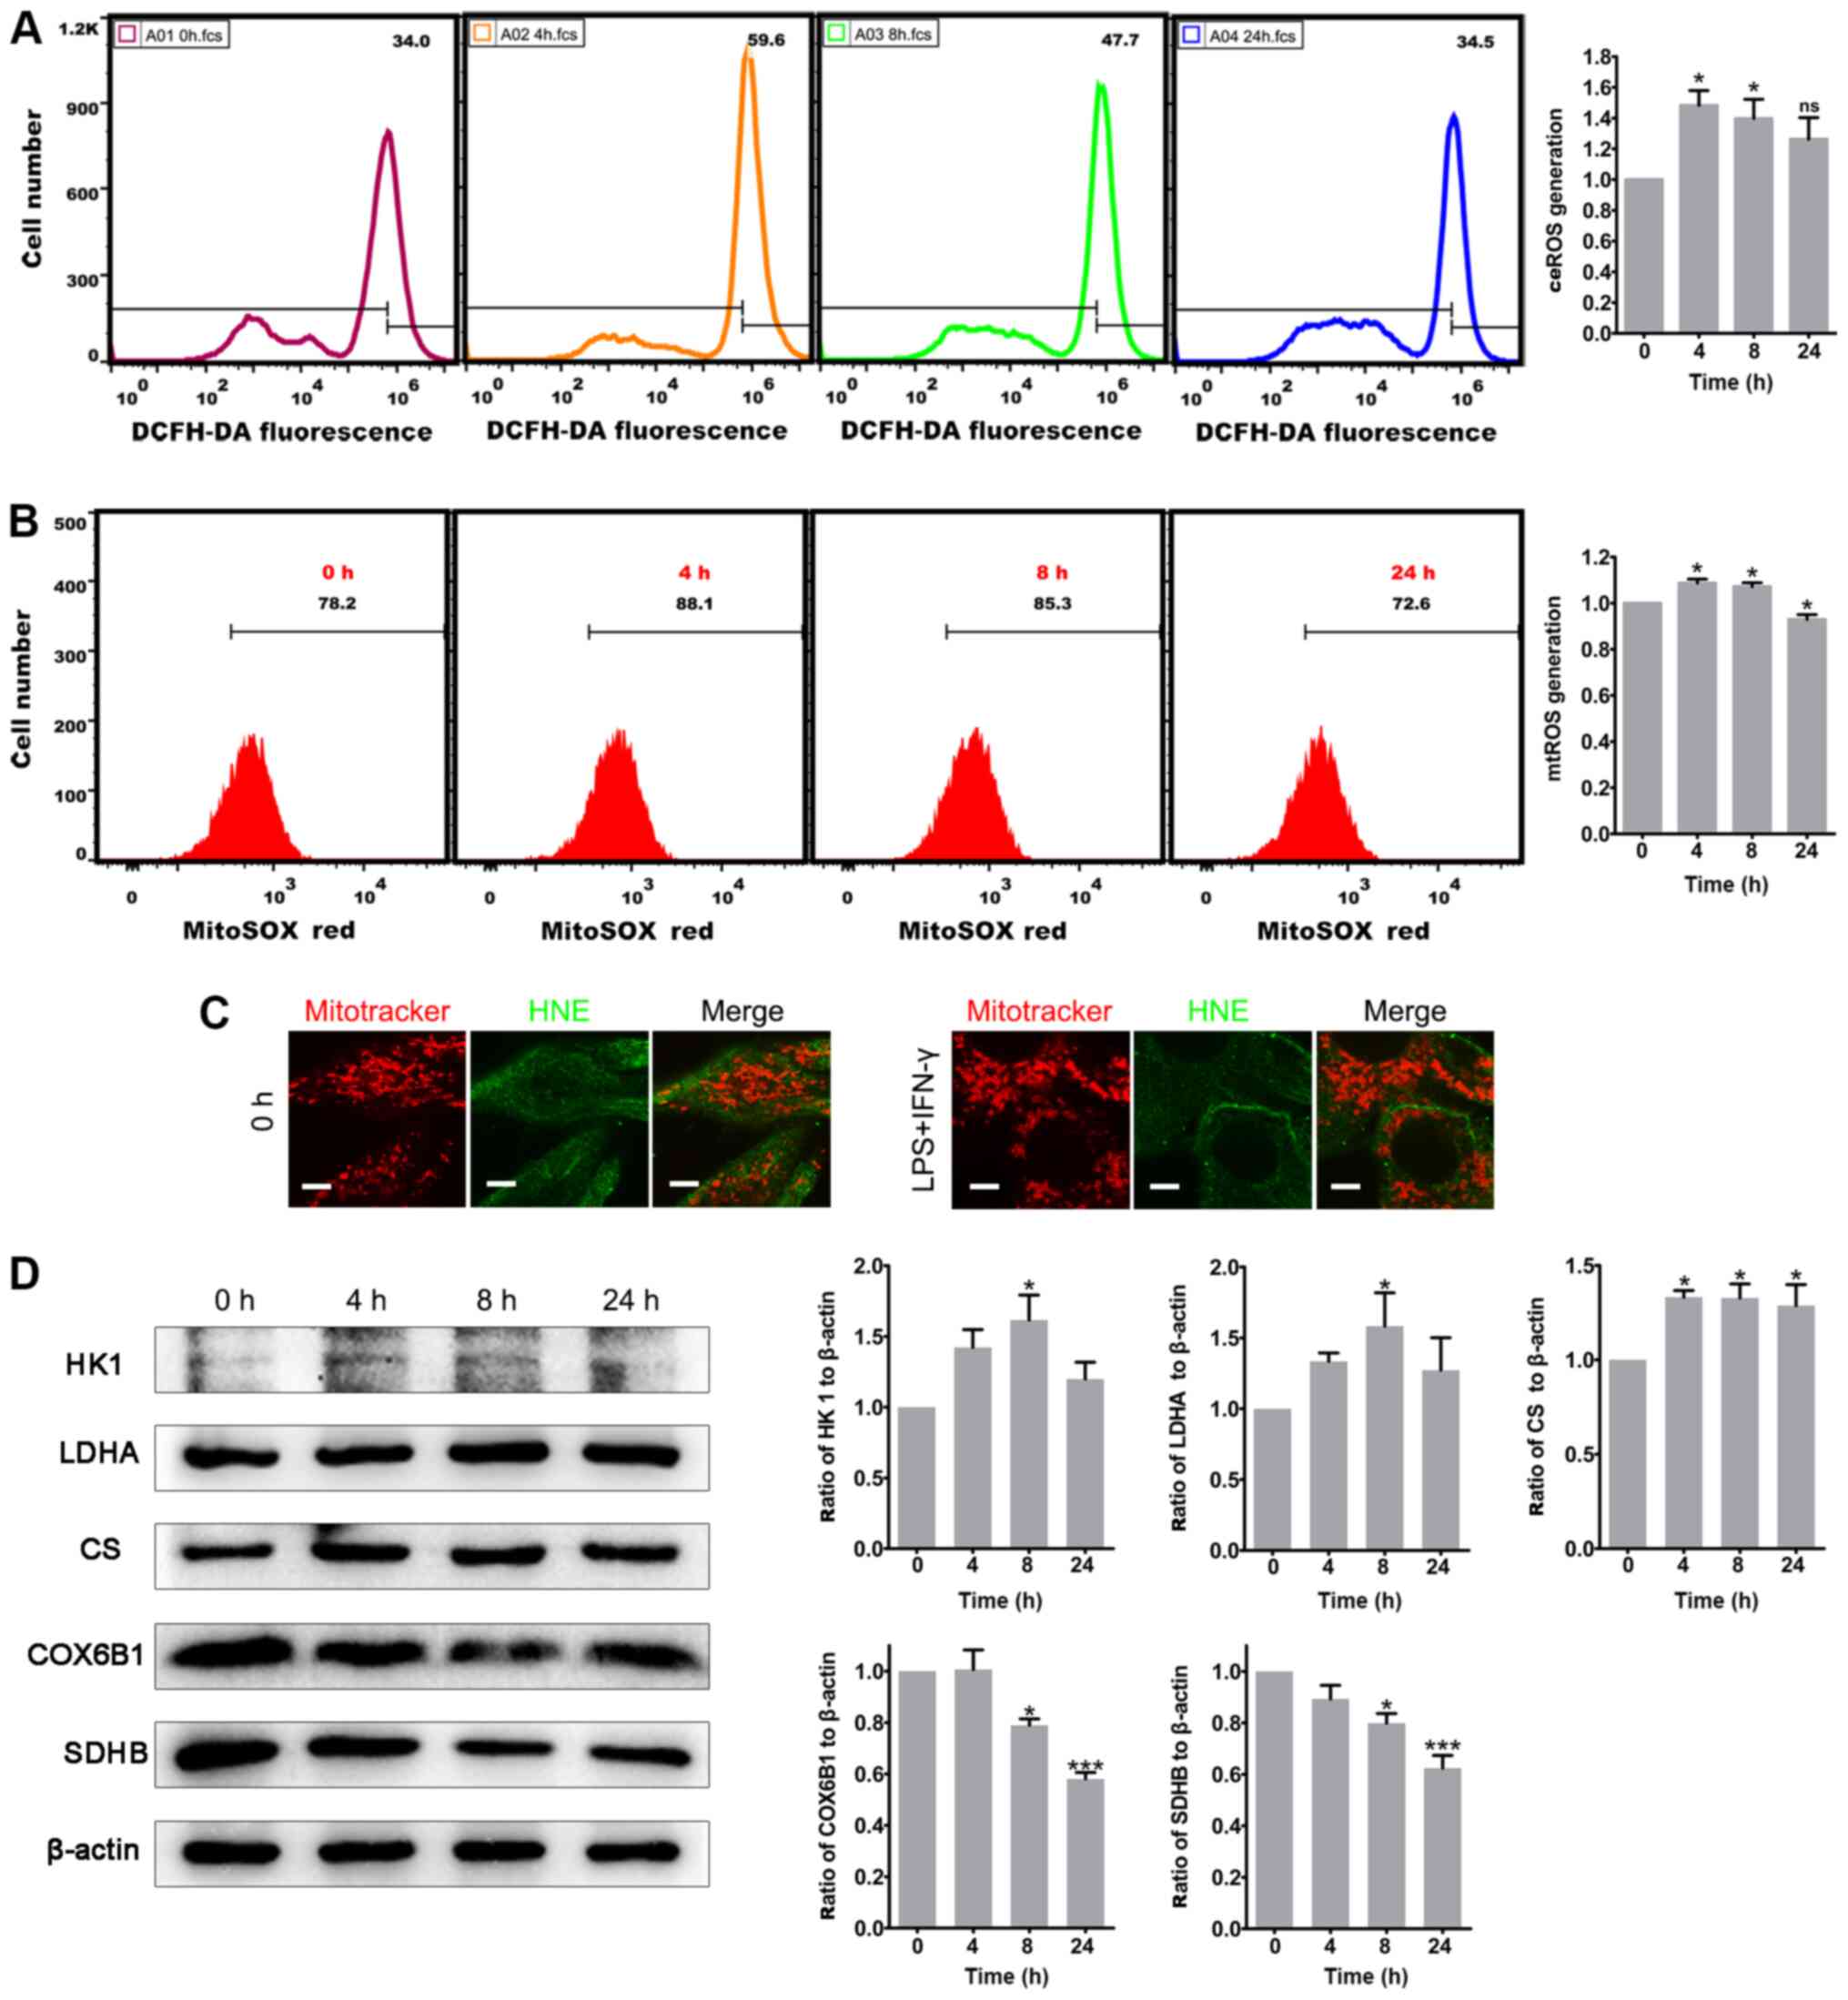 | Figure 4Proinflammatory stimuli induce ROS
generation and metabolic remodeling in glioma cells. (A) Total
ceROS in U87-MG cells was measured by staining with DCFH-DA and
flow cytometry. The histogram presents the statistical analysis of
ceROS generation after LPS and IFN-γ treatment (n=5). (B) mtROS in
U87-MG cells was measured by staining with MitoSOX-Red and flow
cytometry. The histogram presents the statistical analysis of mtROS
generation after LPS and IFN-γ treatment (n=4). (C) Double-labeling
of U87-MG cells with Mitotracker Red and HNE. Scale bar, 5
µm. (D) Protein expression levels of HK1, LDHA, CS, COX6B1
and SDHB in control (0 h) and LPS and IFN-γ-treated U87-MG cells.
The histograms show the statistical analyses of the ratios of HK1,
LDHA, CS, COX6B1 and SDHB to β-actin (n=3). The statistical
significance was evaluated via one-way ANOVA followed by Tukey's
post hoc test. *P<0.05; ***P<0.001; ns,
not significant; LPS, lipopolysaccharide: ROS; reactive oxygen
species; ceROS, cellular ROS; mtROS, mitochondrial ROS; HNE,
4-hydroxynonenal; DCFH-DA, 2′,7′-dichlorodihydrofluorescein
diacetate; SDHB, iron-sulfur protein subunit of succinate
dehydrogenase; COX6B1, cytochrome C oxidase subunit VIb; HK1,
hexokinase 1; CS, citrate synthase; LDHA, lactate dehydrogenase
A. |
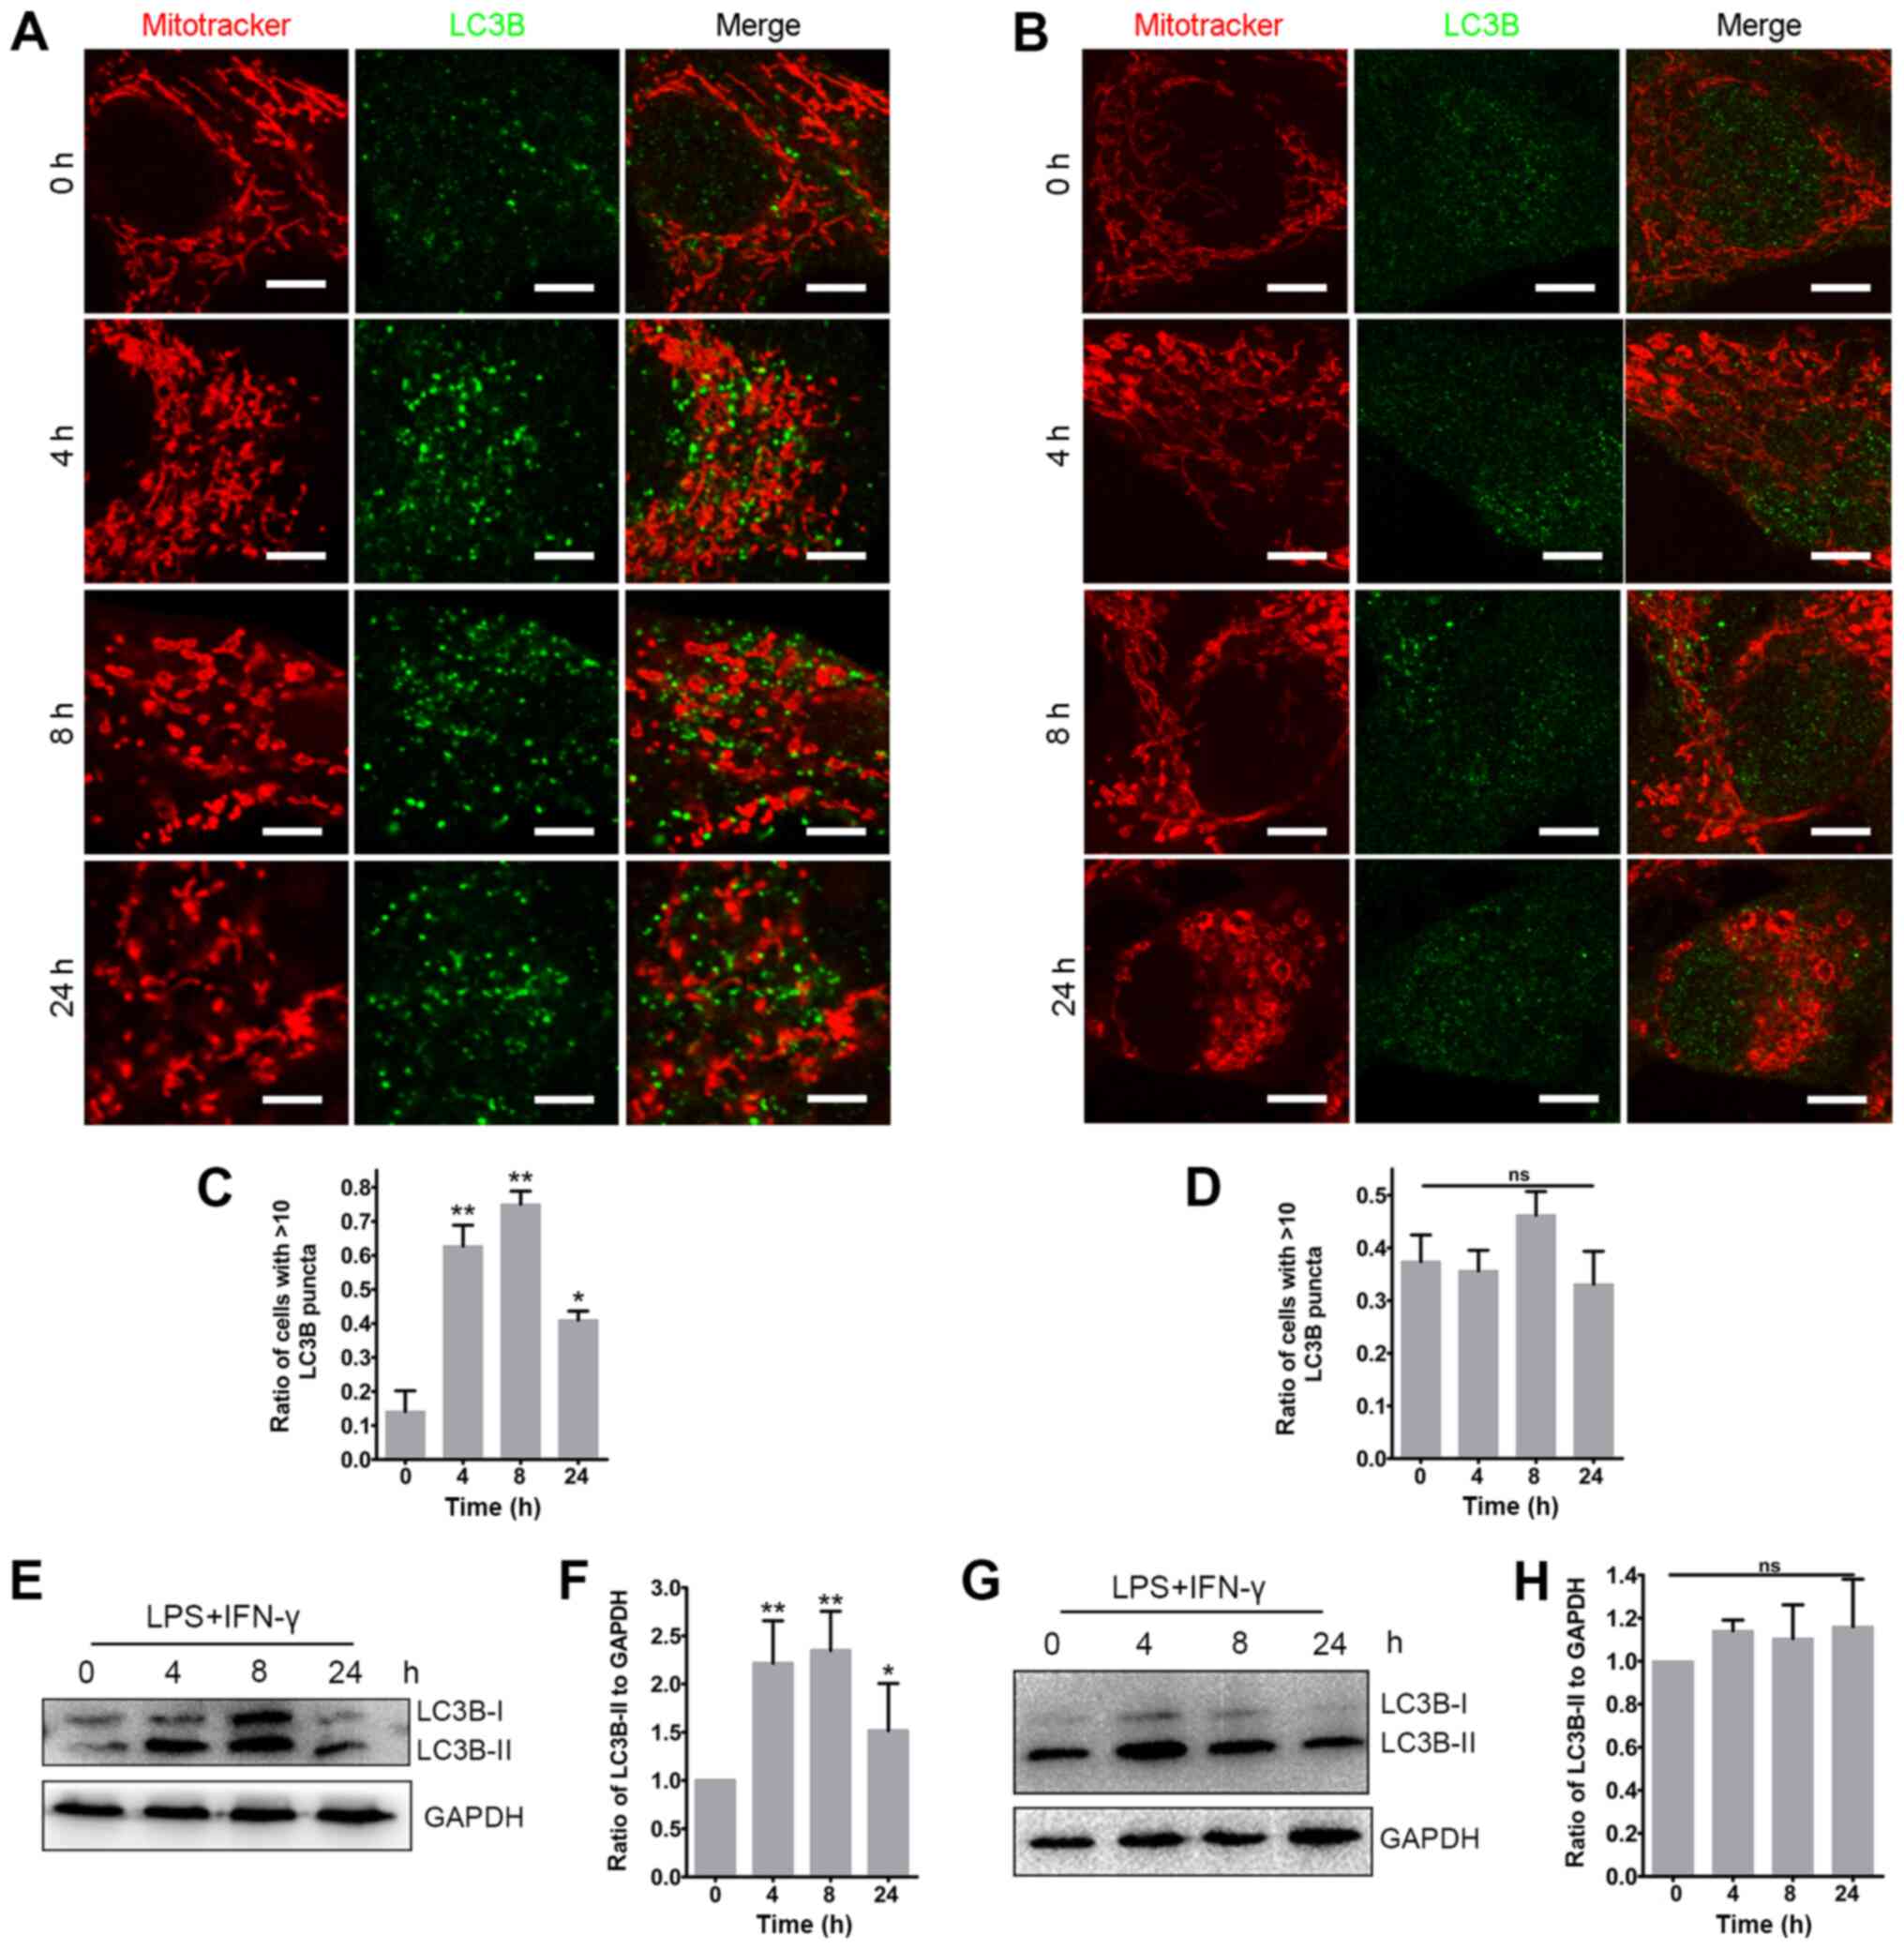
Dysfunctional mitochondria are not
cleared via mitophagy
Considering the nature of the mitochondrial defects
observed following inflammatory stimuli, the present study focused
on possible mechanisms that may mediate its resolution. One of the
possibilities may involve the clearance of the damaged mitochondria
via autophagy, a form of quality control considered to be important
for maintaining the functionality of mitochondrial networks known
as mitophagy (36,38). Therefore, the present study
examined whether autophagy was induced following exposure to
proinflammatory stimuli by evaluating the lipidation of the
autophagy-associated protein LC3B. LC3B abundance and its
conversion from the cytosolic isoform LC3B-I to the
autophagosomal-associated isoform LC3B-II was examined in glioma
cells via ICC and western blotting. The results revealed that the
proinflammatory stimuli caused a significant increase in LC3B
puncta and LC3B-II abundance in U87-MG cells (Fig. 5A, C, E and F), but not in U118-MG
cells (Fig. 5B, D, G and H).
However, there was no detectable change in mitophagy (determined as
the colocalization of mitochondria with the LC3B positive signals)
at any time point in both glioma cells. A similar result was
observed after transfecting a GFP-LC3 plasmid into the U87-MG cells
(Fig. S4A). To further track the
fate of the dysfunctional mitochondria, the current study explored
whether they could also interact with acidic compartments. However,
no distinct colocalization of mitochondria with the lysosomal
marker LAMP1 was observed after exposure to the proinflammatory
stimuli in U87-MG cells (Fig.
S4B). The present results indicated that the dysfunctional
mitochondria resulting from the proinflammatory stimuli were not
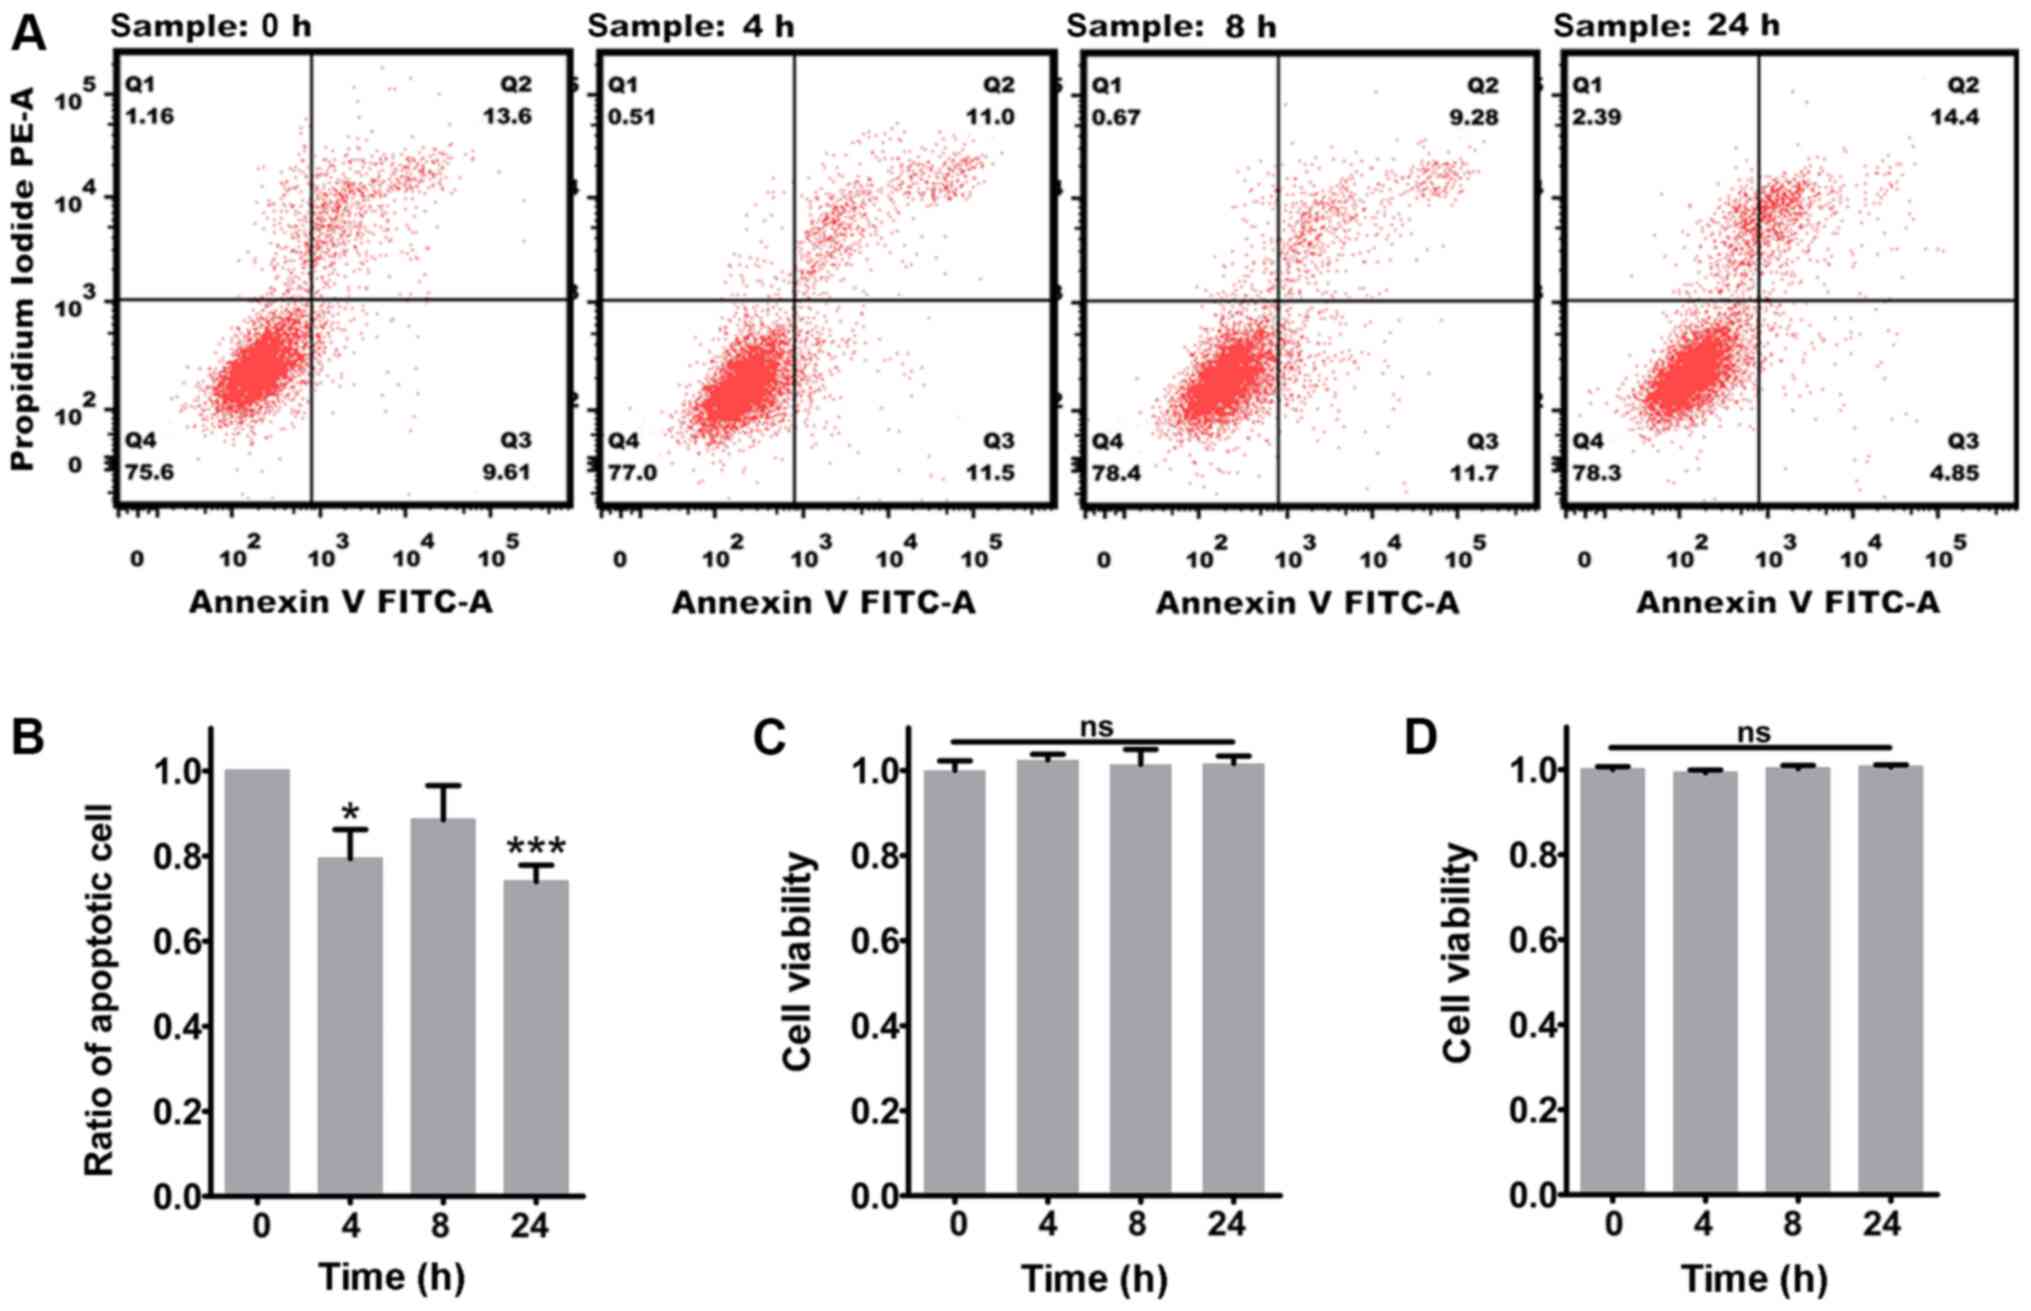
being cleared via mitophagy. Finally, the effect of the persistence
of the damaged mitochondria on glioma cell survival was examined.
The results revealed that exposure to the proinflammatory stimuli
markedly decreased the apoptosis of U87-MG cells (Fig. 6A and B), while the apoptosis of
U118-MG cells was not influenced by the proinflammatory stimuli
(data not shown). Additionally, the CCK-8 assay demonstrated that
the viability of glioma cells was not affected by the mitochondrial
dysfunction caused by the proinflammatory stimuli (Fig. 6C and D). Overall, the
aforementioned results demonstrated that inflammation increased the
tolerance of glioma cells to dysfunctional mitochondria.
Discussion
Inflammation is a common condition that occurs in
solid tumors due to the activation and recruitment of local and
circulating proinflammatory cells, and secretion of inflammatory
factors (11). In the present
study, recruitment of inflammatory cells, microglial reactions and
upregulation of proinflamma-tory factors were observed in glioma
tissue samples, indicating the presence of an inflammatory inner
environment in glioma. Mitochondrial dysfunction in tumors has been
associated with abnormalities in mitochondrial energy metabolism,
marked by a metabolic shift from oxidative phosphorylation to
glycolysis (known as the 'Warburg effect'), disturbances in ΔΨm
regulation and apoptotic signaling (21). The present experiments demonstrated
that mitochondrial network remodeling manifested as swelling and
damaged cristae and altered expression levels of ETC complexes in
glioma. In addition, upregulation of glycolytic enzymes and
downregulation of OXPHOS enzymes were observed in glioma. The
current results provide strong evidence for the presence of
mitochondrial dysfunction and metabolic reprogramming in glioma,
which has been reviewed by Strickland and Stoll (21).
To address the influence of inflammation on the
mitochondria in glioma cells, the present study examined how the
mitochondrial dynamics changed in glioma cells directly exposed to
proinflammatory stimuli in vitro. Stimulation with LPS and
IFN-γ is a well-established combination of factors that mimic the
inflammatory response in vitro (36). In our previous study, glioma cells
were stimulated with 1 µg/ml LPS and 10 ng/ml IFN-γ
(36); however, no marked changes
were observed in the mitochondria of glioma cells. Therefore, the
concentrations of LPS and IFN-γ were increased in the present
study, revealing that a combination of 4 µg/ml LPS and 40
ng/ml IFN-γ was able to induce a significant remodeling of the
mitochondrial network. Additionally, this combination of LPS and
IFN-γ induced the secretion of the inflammatory cytokine IL-6 in
glioma cells, which is one of the major proinflammatory cytokines
released from gliomas (30). The
current results revealed that proinflammatory stimuli induced rapid
and profound changes in the mitochondrial network, leading to its
fragmentation, the appearance of spherical or ring-like
morphologies, and damaged ultrastructure in glioma cells. This
structural disruption of the mitochondria resulted in a significant
decrease in the ΔΨm, indicating impaired mitochondria function
after exposure to inflammatory stimuli. Mitochondria are the main
cellular source of ROS (39).
Numerous studies have investigated the roles of ROS as a
tumor-promoting or tumor-suppressing agent, and there is abundant
evidence supporting both possibilities (25,40-44).
In the present study, significant increases in both the ceROS and
mtROS levels in glioma cells were detected after 4 and 8 h of
treatment. By contrast, these levels were lower at 24 h, consistent
with a partial recovery of the mitochondrial network. The HNE ICC
results revealed that ROS did not induce oxidative damage to the
mitochondrial membranes, indicating that the mitochondria can
tolerate the ROS induced by inflammation in glioma cells.
Furthermore, the mitochondrial network remodeling may reveal forms
of mitochondrial plasticity that are important for adjusting the
metabolic state of the glioma to cope with the metabolic challenges
induced by inflammatory stress. Indeed, the levels of the
glycolytic enzymes HK1 and LDHA were substantially increased, while
the levels of the ETC complexes COX6B1 and SDHB were decreased.
Notably, the levels of CS, the rate-limiting enzyme in the TCA
cycle, were significantly increased in proinflammatory-stimulated
glioma cells. Previous studies have demonstrated an aberrant
function of the TCA cycle in cancer (45,46).
CS catalyzes the first committed step of the TCA cycle and its
expression has been reported to be upregulated in several types of
cancer (47-49). For example, upregulated CS
expression has been associated with cell proliferation, invasion
and migration in human ovarian carcinoma (47). Consistently, the upregulation of CS
expression observed in the present study may reflect a type of
metabolic reprogramming in inflammation-stimulated glioma cells. In
light of the widely accepted belief that cancer cells primarily
utilize aerobic glycolysis, the role of the TCA cycle in glioma
metabolism and tumorigenesis should be further investigated. In
addition, COX6B1 expression was observed to be upregulated in
glioma tissues compared with in para-NT. As a cytochrome oxidase
subunit, COX6B1 is encoded in the nuclear genome and serves
critical roles in energy metabolism and regulation (50). It has been demonstrated that COX6B1
overexpression inhibits apoptosis and induces mitochondrial
respiration and stress resistance (35,51).
Accordingly, COX6B1 upregulation in glioma may be a response of the
glioma cells to increase their resistance to a harsh environment.
However, the in vitro results indicated the opposite, since
COX6B1 expression was downregulated after 8 and 24 h of exposure to
proinflammatory stimuli. It was speculated that this effect may be
due to differences between in vitro and in vivo
conditions. The tumor microenvironment is more complicated than
that under in vitro conditions; therefore, the increased
levels of COX6B1 in glioma may result from a number of unknown
factors. From this perspective, the in vitro results may
more accurately reflect the effects of inflammation on mitochondria
in glioma cells.
An important mechanism of mitochondria clearance is
mitophagy, which has been reported in several studies (52-54).
Mitochondrial fragmentation and a decline in the ΔΨm are essential
conditions for mitophagy (55-57).
In the present study, the mitochondrial network was partially
recovered 24 h after treatment, as was the production of ceROS and
mtROS. However, no marked alteration in the colocalization of
Mitotracker Red and LC3B (indicating mitophagy) was observed at any
point. Furthermore, the dysfunctional mitochondria were not
engulfed by lysosomes. Therefore, the present results suggested
that the damaged mitochondria induced by inflammation were not
cleared via mitophagy. Future studies should investigate how
abnormal mitochondria induced by inflammatory stress achieve
effective quality control. A possibility may be that these
mitochondria are not 'bad enough' that they must be cleared and are
'salvageable; thus, the mitochondria activate the relevant
self-help mechanisms to normalize the network (58). It has been reported that reduction
or ablation of the ΔΨm can induce nuclear translocation of
activating transcription factor associated with stress-1, where it
initiates the mitochondrial unfolded protein response, which is a
mitochondria self-help mechanism (59). Whether the mitochondria observed in
the present study initiated this self-help mechanism remains to be
further investigated. Additionally, it is possible that the
formation of spherical or ring-like mitochondrial structures may
reflect a response to environmental conditions that have functional
consequences. Mitochondria gradually adapt to the inflammatory
environment, becoming more tolerant to inflammation and less
sensitive to the environmental conditions (60,61).
Therefore, the fragmented, spherical or ring-like mitochondria
gradually recovered, and the altered mitochondrial morphology may
represent a response to inflammatory stress. Furthermore, in
certain stages of tumorigenesis, decreased mitophagy may allow for
a permissive threshold for the persistence of dysfunctional
mitochondria, which then generate increased tumor-promoting ROS or
other tumorigenic mitochondrial signals (25). Accordingly, a decrease in apoptosis
was observed in the present study; therefore, the persistence of
dysfunctional mitochondria may help glioma cells to survive in
inflammatory environments.
However, there are some limitations in the present
study. For example, the lack of normalization of the data
downloaded from the CGGA dataset generated negative values during
the statistical analysis. Additionally, isocitrate dehydrogenase
mutation status may dramatically affect the function of
mitochondria (62). Therefore, the
lack of mutation experiments is another potential limitation.
Furthermore, the expression levels of proteins (such as IL-6, IL-8,
HIF-1α, STAT3, NF-κB1 and NF-κB2) in the inflammatory
microenvironment in glioma should be further evaluated using IHC
staining or western blotting.
In conclusion, the current results identified a
direct association between inflammation and changes in
mitochondrial dynamics in glioma, revealing that inflammation may
induce mitochondrial dysfunction in glioma, including
fragmentation, swelling, structural and ΔΨm disruption, and ROS
generation. Finally, metabolic reprogramming may result in
increased aerobic glycolysis, a defective TCA cycle and OXPHOS
(Fig. 7). Although the recovery or
biogenesis of the mitochondria, and the role of the TCA cycle in
glioma after proinflammatory stimuli should be further
investigated, the present results demonstrated that the dysfunction
of these organelles did not affect the viability but decreased the
apoptosis of glioma cells (Fig.
7). Further insight into how inflammatory processes impact
local bioenergetics within glioma tissues may lead to the
identification of novel routes for understanding the association
between inflammation and solid tumors.
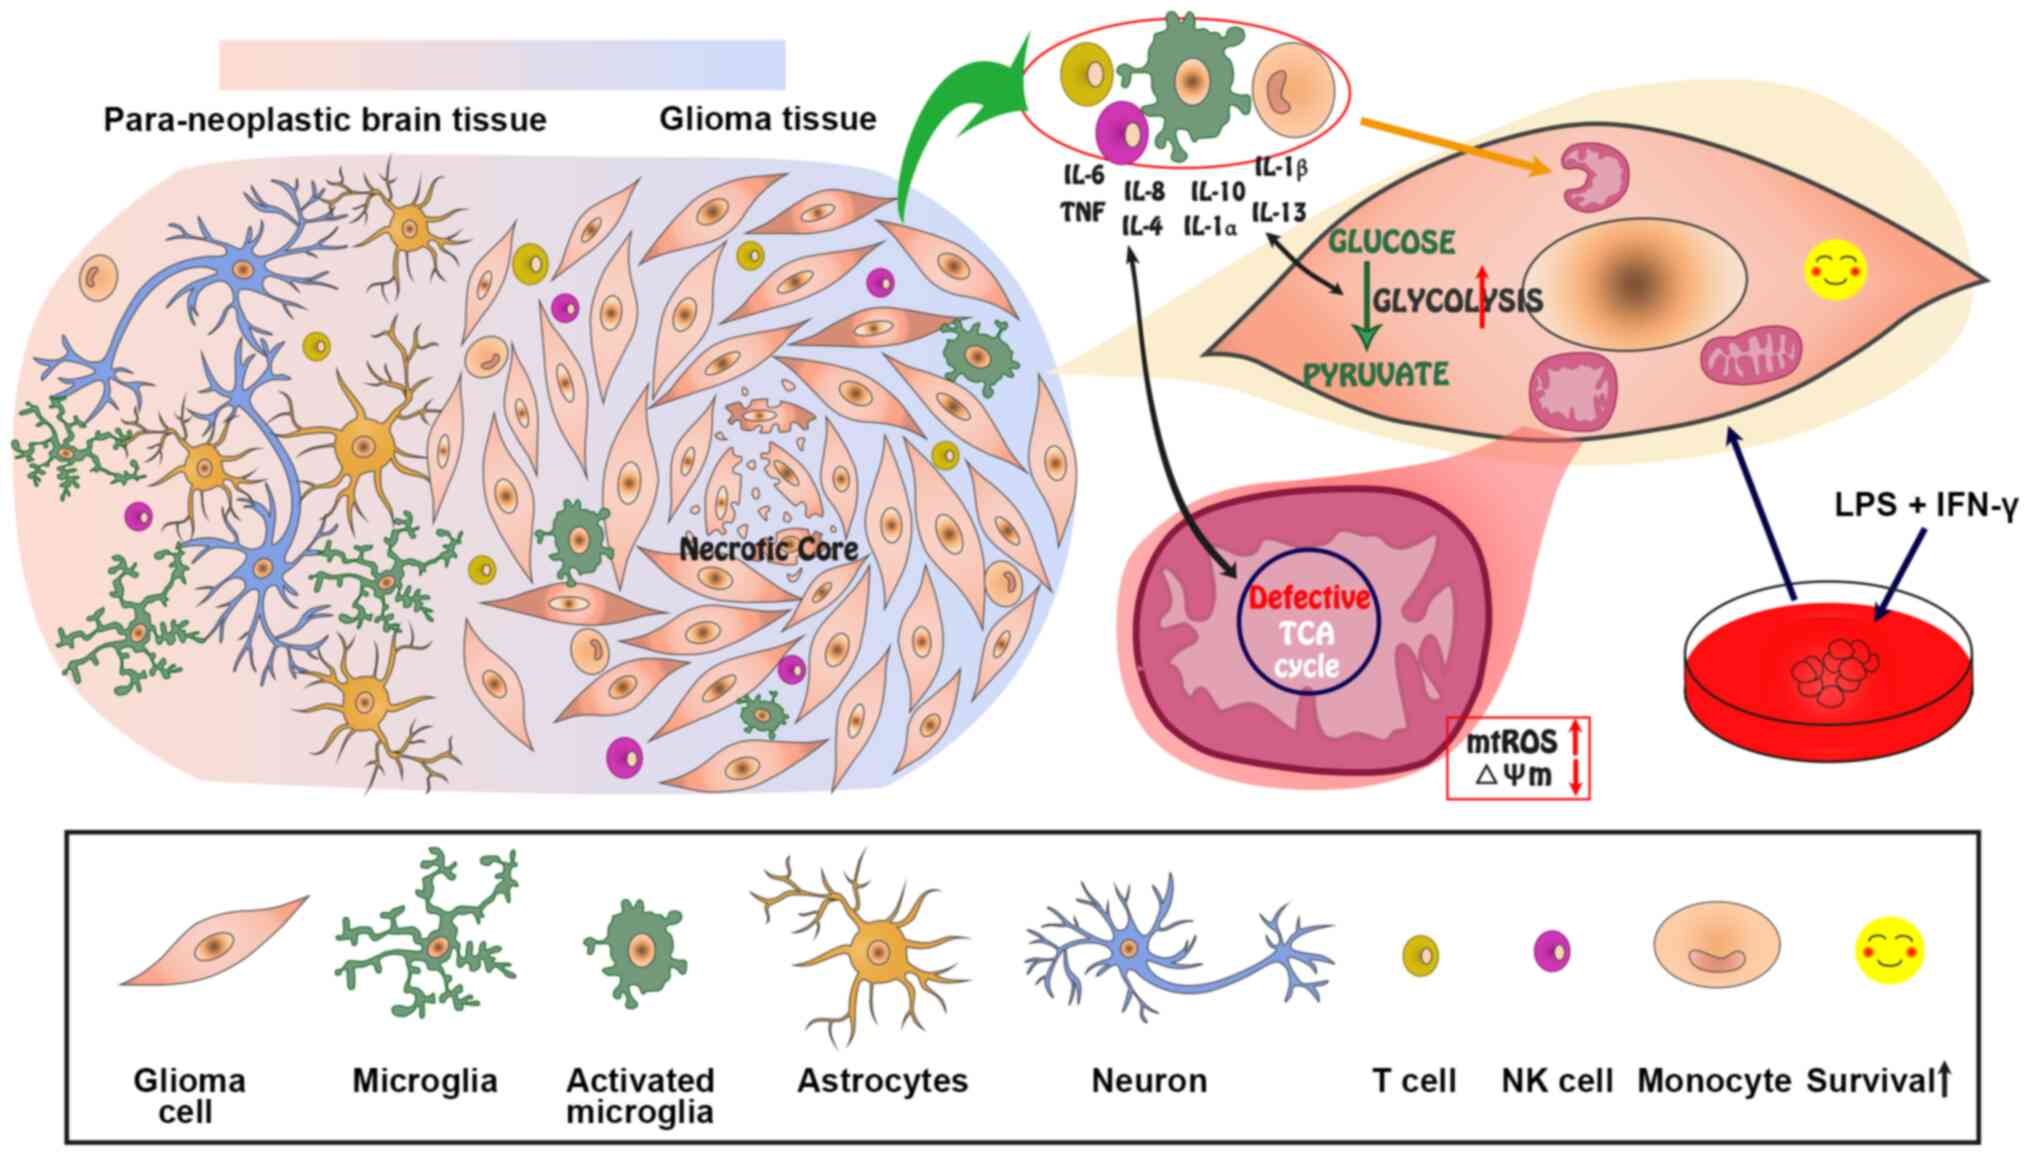 | Figure 7Model and hypothesis for the effect
of inflammation on the mitochondrial dynamics in glioma.
Inflammation induced by the infiltration of inflammatory cells and
secretion of proinflammatory factors may cause mitochondrial
fragmentation, swelling, vacuolation, disrupted ΔΨm, and increased
ROS levels. Additionally, the mitochondrial metabolism may be
remodeled by inflammation, resulting in increased glycolysis and a
defective TCA cycle. The dysfunctional mitochondria are not cleared
via mitophagy, but rather persist in the glioma cells to improve
their survival. ΔΨm, mitochondrial membrane potential; ROS,
reactive oxygen species; mtROS, mitochondrial ROS; TCA,
tricarboxylic acid; HIF-1α, hypoxia-inducible factor-1α; LPS,
lipopolysaccharide; NK, natural killer. |
Supplementary Data
Acknowledgments
The authors would like to sincerely thank Professor
Shuping Zhang (State Key Laboratory of Biomembrane and Membrane
Biotechnology, School of Life Sciences, Tsinghua University,
Beijing, China) for providing the GFP-LC3 constructs.
Abbreviations:
|
HIF-1α
|
hypoxia-inducible factor-1α
|
|
HMGB1
|
high-mobility group box 1 protein
|
|
Iba1
|
ionized calcium binding adapter
molecule 1
|
|
LAMP1
|
lysosomal associated membrane protein
1
|
|
SDHB
|
iron-sulfur protein subunit of
succinate dehydrogenase
|
|
COX6B1
|
cytochrome C oxidase subunit VIb
|
|
HK1
|
hexokinase 1
|
|
CS
|
citrate synthase
|
|
LDHA
|
lactate dehydrogenase A
|
|
ROS
|
reactive oxygen species
|
|
ceROS
|
cellular ROS
|
|
mtROS
|
mitochondrial ROS
|
|
ETC
|
electron transfer chain
|
|
OXPHOS
|
oxidative phosphorylation
|
|
TCA
|
tricarboxylic acid
|
|
ΔΨm
|
mitochondrial membrane potential
|
|
HNE
|
4-hydroxynonenal
|
|
DCFH-DA
|
2′,7′-dichlorodihydrofluorescein
diacetate
|
|
LPS
|
lipopolysaccharide
|
|
para-NT
|
paraneoplastic tissues
|
|
LGG
|
low-grade glioma
|
|
GBM
|
glioblastoma
|
|
IRS
|
immunoreactive score
|
|
CGGA
|
Chinese Glioma Genome Atlas
|
|
TCGA
|
The Cancer Genome Atlas
|
Funding
The present study was supported by the National
Natural Science Foundation of China (grant no. 81402455) and the
Key Scientific Research Projects of Higher Education Institutions
in Henan Province (grant no. 20A310020). The funding sources had no
involvement in the design of the study and collection, analysis and
interpretation of data, and in writing the manuscript.
Availability of data and materials
All data generated or analyzed during this study are
included in this published article.
Authors' contributions
LJ acquired funding. WF, XC, ZR, YS, PL and HS
acquired the data. LJ, WF, XC, ZR and YS analyzed and interpreted
the data. WF, XC, ZR and YS statistically analyzed the data. LJ
wrote the manuscript. All authors read and approved the final
manuscript.
Ethics approval and consent to
participate
Life Science Ethics Committee of Zhengzhou
University (Zhengzhou, China) reviewed and approved the study
according to the principles expressed in the Declaration of
Helsinki. Written informed consent was provided by each participant
or their families.
Patient consent for publication
Not applicable.
Competing interests
The authors declare that they have no competing
interests.
References
|
1
|
Ostrom QT, Gittleman H, Xu J, Kromer C,
Wolinsky Y, Kruchko C and Barnholtz-Sloan JS: CBTRUS statistical
report: Primary brain and other central nervous system tumors
diagnosed in the United States in 2009-2013. Neuro Oncol. 18(Suppl
5): v1–v75. 2016. View Article : Google Scholar
|
|
2
|
Conti A, Gulì C, La Torre D, Tomasello C,
Angileri FF and Aguennouz M: Role of inflammation and oxidative
stress mediators in gliomas. Cancers (Basel). 2:693–712. 2010.
View Article : Google Scholar
|
|
3
|
Ham SW, Jeon HY, Jin X, Kim EJ, Kim JK,
Shin YJ, Lee Y, Kim SH, Lee SY, Seo S, et al: TP53 gain-of-function
mutation promotes inflammation in glioblastoma. Cell Death Differ.
26:409–425. 2019. View Article : Google Scholar :
|
|
4
|
Philip M, Rowley DA and Schreiber H:
Inflammation as a tumor promoter in cancer induction. Semin Cancer
Biol. 14:433–439. 2004. View Article : Google Scholar : PubMed/NCBI
|
|
5
|
Aggarwal BB, Vijayalekshmi RV and Sung B:
Targeting inflammatory pathways for prevention and therapy of
cancer: Short-term friend, long-term foe. Clin Cancer Res.
15:425–430. 2009. View Article : Google Scholar : PubMed/NCBI
|
|
6
|
Grivennikov SI and Karin M: Inflammation
and oncogenesis: A vicious connection. Curr Opin Genet Dev.
20:65–71. 2010. View Article : Google Scholar :
|
|
7
|
Samadi AK, Bilsland A, Georgakilas AG,
Amedei A, Amin A, Bishayee A, Azmi AS, Lokeshwar BL, Grue B, Panis
C, et al: A multi-targeted approach to suppress tumor-promoting
inflammation. Semin Cancer Biol. 35:S151–S184. 2015. View Article : Google Scholar : PubMed/NCBI
|
|
8
|
Mantovani A, Allavena P, Sica A and
Balkwill F: Cancer-related inflammation. Nature. 454:436–444. 2008.
View Article : Google Scholar : PubMed/NCBI
|
|
9
|
Colotta F, Allavena P, Sica A, Garlanda C
and Mantovani A: Cancer-related inflammation, the seventh hallmark
of cancer: Links to genetic instability. Carcinogenesis.
30:1073–1081. 2009. View Article : Google Scholar : PubMed/NCBI
|
|
10
|
Hussain SP, Hofseth LJ and Harris CC:
Radical causes of cancer. Nat Rev Cancer. 3:276–285. 2003.
View Article : Google Scholar : PubMed/NCBI
|
|
11
|
Schetter AJ, Heegaard NH and Harris CC:
Inflammation and cancer: Interweaving microRNA, free radical,
cytokine and p53 pathways. Carcinogenesis. 31:37–49. 2010.
View Article : Google Scholar :
|
|
12
|
Kembro JM, Cortassa S, Lloyd D, Sollott SJ
and Aon MA: Mitochondrial chaotic dynamics: Redox-energetic
behavior at the edge of stability. Sci Rep. 8:154222018. View Article : Google Scholar : PubMed/NCBI
|
|
13
|
Blajszczak C and Bonini MG: Mitochondria
targeting by environmental stressors: Implications for redox
cellular signaling. Toxicology. 391:84–89. 2017. View Article : Google Scholar : PubMed/NCBI
|
|
14
|
Altieri DC: Mitochondria on the move:
Emerging paradigms of organelle trafficking in tumour plasticity
and metastasis. Br J Cancer. 117:301–305. 2017. View Article : Google Scholar : PubMed/NCBI
|
|
15
|
Zhai K, Chang L, Zhang Q, Liu B and Wu Y:
Mitochondrial C150T polymorphism increases the risk of cervical
cancer and HPV infection. Mitochondrion. 11:559–563. 2011.
View Article : Google Scholar : PubMed/NCBI
|
|
16
|
Canter JA, Kallianpur AR, Parl FF and
Millikan RC: Mitochondrial DNA G10398A polymorphism and invasive
breast cancer in African-American women. Cancer Res. 65:8028–8033.
2005. View Article : Google Scholar : PubMed/NCBI
|
|
17
|
Permuth-Wey J, Chen YA, Tsai YY, Chen Z,
Qu X, Lancaster JM, Stockwell H, Dagne G, Iversen E, Risch H, et
al: Inherited vari-ants in mitochondrial biogenesis genes may
influence epithelial ovarian cancer risk. Cancer Epidemiol
Biomarkers Prev. 20:1131–1145. 2011. View Article : Google Scholar : PubMed/NCBI
|
|
18
|
Katsetos CD, Anni H and Draber P:
Mitochondrial dysfunction in gliomas. Semin Pediatr Neurol.
20:216–227. 2013. View Article : Google Scholar : PubMed/NCBI
|
|
19
|
Arismendi-Morillo GJ and
Castellano-Ramirez AV: Ultrastructural mitochondrial pathology in
human astrocytic tumors: Potentials implications protherapeutics
strategies. J Electron Microsc (Tokyo). 57:33–39. 2008. View Article : Google Scholar
|
|
20
|
Guntuku L, Naidu VG and Yerra VG:
Mitochondrial dysfunction in gliomas: Pharmacotherapeutic potential
of natural compounds. Curr Neuropharmacol. 14:567–583. 2016.
View Article : Google Scholar : PubMed/NCBI
|
|
21
|
Strickland M and Stoll EA: Metabolic
reprogramming in glioma. Front Cell Dev Biol. 5:432017. View Article : Google Scholar : PubMed/NCBI
|
|
22
|
Waitkus MS, Diplas BH and Yan H:
Isocitrate dehydrogenase mutations in gliomas. Neuro Oncol.
18:16–26. 2016. View Article : Google Scholar
|
|
23
|
Warburg O: On the origin of cancer cells.
Science. 123:309–314. 1956. View Article : Google Scholar : PubMed/NCBI
|
|
24
|
Modica-Napolitano JS and Weissig V:
Treatment strategies that enhance the efficacy and selectivity of
mitochondria-targeted anticancer agents. Int J Mol Sci.
16:17394–17421. 2015. View Article : Google Scholar : PubMed/NCBI
|
|
25
|
Vyas S, Zaganjor E and Haigis MC:
Mitochondria and cancer. Cell. 166:555–566. 2016. View Article : Google Scholar : PubMed/NCBI
|
|
26
|
Mancias JD and Kimmelman AC: Mechanisms of
selective autophagy in normal physiology and cancer. J Mol Biol.
428:1659–1680. 2016. View Article : Google Scholar : PubMed/NCBI
|
|
27
|
Sun H, Zhang M, Cheng K, Li P, Han S, Li
R, Su M, Zeng W, Liu J, Guo J, et al: Resistance of glioma cells to
nutrient-deprived microenvironment can be enhanced by
CD133-mediated autophagy. Oncotarget. 7:76238–76249. 2016.
View Article : Google Scholar : PubMed/NCBI
|
|
28
|
Isakovic AM, Dulovic M, Markovic I,
Kravic-Stevovic T, Bumbasirevic V, Trajkovic V and Isakovic A:
Autophagy suppression sensitizes glioma cells to IMP dehydrogenase
inhibition-induced apoptotic death. Exp Cell Res. 350:32–40. 2017.
View Article : Google Scholar
|
|
29
|
Louis DN, Perry A, Reifenberger G, von
Deimling A, Figarella-Branger D, Cavenee WK, Ohgaki H, Wiestler OD,
Kleihues P and Ellison DW: The 2016 world health organization
classification of tumors of the central nervous system: A summary.
Acta Neuropathol. 131:803–820. 2016. View Article : Google Scholar : PubMed/NCBI
|
|
30
|
Xue H, Yuan G, Guo X, Liu Q, Zhang J, Gao
X, Guo X, Xu S, Li T, Shao Q, et al: A novel tumor-promoting
mechanism of IL6 and the therapeutic efficacy of tocilizumab:
Hypoxia-induced IL6 is a potent autophagy initiator in glioblastoma
via the p-STAT3-MIR155-3p-CREBRF pathway. Autophagy. 12:1129–1152.
2016. View Article : Google Scholar : PubMed/NCBI
|
|
31
|
Jia L, Liang T, Yu X, Ma C and Zhang S:
MGARP regulates mouse neocortical development via mitochondrial
positioning. Mol Neurobiol. 49:1293–1308. 2014. View Article : Google Scholar
|
|
32
|
Weber DJ, Allette YM, Wilkes DS and White
FA: The HMGB1-RAGE inflammatory pathway: Implications for brain
injury-induced pulmonary dysfunction. Antioxid Redox Signal.
23:1316–1328. 2015. View Article : Google Scholar : PubMed/NCBI
|
|
33
|
Bai Y and Attardi G: The mtDNA-encoded ND6
subunit of mitochondrial NADH dehydrogenase is essential for the
assembly of the membrane arm and the respiratory function of the
enzyme. EMBO J. 17:4848–4858. 1998. View Article : Google Scholar : PubMed/NCBI
|
|
34
|
Wang H, Luo J, Tian W, Yan W, Ge S, Zhang
Y and Sun W: γ-tocotrienol inhibits oxidative phosphorylation and
triggers apoptosis by inhibiting mitochondrial complex I subunit
NDUFB8 and complex II subunit SDHB. Toxicology. 417:42–53. 2019.
View Article : Google Scholar : PubMed/NCBI
|
|
35
|
Kim SE, Mori R, Komatsu T, Chiba T,
Hayashi H, Park S, Sugawa MD, Dencher NA and Shimokawa I:
Upregulation of cytochrome c oxidase subunit 6b1 (Cox6b1) and
formation of mitochondrial supercomplexes: Implication of Cox6b1 in
the effect of calorie restriction. Age (Dordr). 37:97872015.
View Article : Google Scholar
|
|
36
|
Motori E, Puyal J, Toni N, Ghanem A,
Angeloni C, Malaguti M, Cantelli-Forti G, Berninger B, Conzelmann
KK, Götz M, et al: Inflammation-induced alteration of astrocyte
mitochondrial dynamics requires autophagy for mitochondrial network
maintenance. Cell Metab. 18:844–859. 2013.PubMed/NCBI
|
|
37
|
Kageyama Y, Hoshijima M, Seo K, Bedja D,
Sysa-Shah P, Andrabi SA, Chen W, Höke A, Dawson VL, Dawson TM, et
al: Parkin-independent mitophagy requires Drp1 and maintains the
integrity of mammalian heart and brain. EMBO J. 33:2798–2813.
2014.PubMed/NCBI
|
|
38
|
Williams JA and Ding WX: Mechanisms,
pathophysiological roles and methods for analyzing mitophagy-recent
insights. Biol Chem. 399:147–178. 2018.
|
|
39
|
Dan Dunn J, Alvarez LA, Zhang X and
Soldati T: Reactive oxygen species and mitochondria: A nexus of
cellular homeostasis. Redox Biol. 6:472–485. 2015.PubMed/NCBI
|
|
40
|
Chio IIC and Tuveson DA: ROS in cancer:
The burning question. Trends Mol Med. 23:411–429. 2017.PubMed/NCBI
|
|
41
|
Shadel GS and Horvath TL: Mitochondrial
ROS signaling in organismal homeostasis. Cell. 163:560–569. 2015.
View Article : Google Scholar : PubMed/NCBI
|
|
42
|
Sullivan LB and Chandel NS: Mitochondrial
reactive oxygen species and cancer. Cancer Metab. 2:172014.
View Article : Google Scholar
|
|
43
|
Jin L, Li D, Alesi GN, Fan J, Kang HB, Lu
Z, Boggon TJ, Jin P, Yi H, Wright ER, et al: Glutamate
dehydrogenase 1 signals through antioxidant glutathione peroxidase
1 to regulate redox homeostasis and tumor growth. Cancer Cell.
27:257–270. 2015. View Article : Google Scholar : PubMed/NCBI
|
|
44
|
DeNicola GM, Karreth FA, Humpton TJ,
Gopinathan A, Wei C, Frese K, Mangal D, Yu KH, Yeo CJ, Calhoun ES,
et al: Oncogene-induced Nrf2 transcription promotes ROS
detoxification and tumorigenesis. Nature. 475:106–109. 2011.
View Article : Google Scholar : PubMed/NCBI
|
|
45
|
Gaude E and Frezza C: Defects in
mitochondrial metabolism and cancer. Cancer Metab. 2:102014.
View Article : Google Scholar : PubMed/NCBI
|
|
46
|
Anderson NM, Mucka P, Kern JG and Feng H:
The emerging role and targetability of the TCA cycle in cancer
metabolism. Protein Cell. 9:216–237. 2018. View Article : Google Scholar :
|
|
47
|
Chen L, Liu T, Zhou J, Wang Y, Wang X, Di
W and Zhang S: Citrate synthase expression affects tumor phenotype
and drug resistance in human ovarian carcinoma. PLoS One.
9:e1157082014. View Article : Google Scholar : PubMed/NCBI
|
|
48
|
Schlichtholz B, Turyn J, Goyke E,
Biernacki M, Jaskiewicz K, Sledzinski Z and Swierczynski J:
Enhanced citrate synthase activity in human pancreatic cancer.
Pancreas. 30:99–104. 2005. View Article : Google Scholar : PubMed/NCBI
|
|
49
|
Lin CC, Cheng TL, Tsai WH, Tsai HJ, Hu KH,
Chang HC, Yeh CW, Chen YC, Liao CC and Chang WT: Loss of the
respiratory enzyme citrate synthase directly links the Warburg
effect to tumor malignancy. Sci Rep. 2:7852012. View Article : Google Scholar : PubMed/NCBI
|
|
50
|
Sinkler CA, Kalpage H, Shay J, Lee I,
Malek MH, Grossman LI and Hüttemann M: Tissue- and
condition-specific isoforms of mammalian cytochrome c oxidase
subunits: From function to human disease. Oxid Med Cell Longev.
2017:15340562017. View Article : Google Scholar :
|
|
51
|
Zhang W, Wang Y, Wan J, Zhang P and Pei F:
COX6B1 relieves hypoxia/reoxygenation injury of neonatal rat
cardiomyocytes by regulating mitochondrial function. Biotechnol
Lett. 41:59–68. 2019. View Article : Google Scholar :
|
|
52
|
Um JH and Yun J: Emerging role of
mitophagy in human diseases and physiology. BMB Rep. 50:299–307.
2017. View Article : Google Scholar : PubMed/NCBI
|
|
53
|
Kulikov AV, Luchkina EA, Gogvadze V and
Zhivotovsky B: Mitophagy: Link to cancer development and therapy.
Biochem Biophys Res Commun. 482:432–439. 2017. View Article : Google Scholar : PubMed/NCBI
|
|
54
|
Ney PA: Mitochondrial autophagy: Origins,
significance, and role of BNIP3 and NIX. Biochim Biophys Acta.
1853:2775–2783. 2015. View Article : Google Scholar : PubMed/NCBI
|
|
55
|
Arnoult D, Rismanchi N, Grodet A, Roberts
RG, Seeburg DP, Estaquier J, Sheng M and Blackstone C:
Bax/Bak-dependent release of DDP/TIMM8a promotes Drp1-mediated
mitochondrial fission and mitoptosis during programmed cell death.
Curr Biol. 15:2112–2118. 2005. View Article : Google Scholar : PubMed/NCBI
|
|
56
|
Dengjel J and Abeliovich H: Roles of
mitophagy in cellular physiology and development. Cell Tissue Res.
367:95–109. 2017. View Article : Google Scholar
|
|
57
|
Eiyama A and Okamoto K:
PINK1/Parkin-mediated mitophagy in mammalian cells. Curr Opin Cell
Biol. 33:95–101. 2015. View Article : Google Scholar : PubMed/NCBI
|
|
58
|
Kornmann B: Quality control in
mitochondria: Use it, break it, fix it, trash it. F1000Prime Rep.
6:152014. View
Article : Google Scholar : PubMed/NCBI
|
|
59
|
Deng P and Haynes CM: Mitochondrial
dysfunction in cancer: Potential roles of ATF5 and the
mitochondrial UPR. Semin Cancer Biol. 47:43–49. 2017. View Article : Google Scholar : PubMed/NCBI
|
|
60
|
Ding WX, Li M, Biazik JM, Morgan DG, Guo
F, Ni HM, Goheen M, Eskelinen EL and Yin XM: Electron microscopic
analysis of a spherical mitochondrial structure. J Biol Chem.
287:42373–42378. 2012. View Article : Google Scholar : PubMed/NCBI
|
|
61
|
Ding WX, Guo FL, Ni HM, Bockus A, Manley
S, Stolz DB, Eskelinen EL, Jaeschke H and Yin XM: Parkin and
mitofusins reciprocally regulate mitophagy and mitochondrial
spheroid formation. J Biol Chem. 287:42379–42388. 2012.PubMed/NCBI
|
|
62
|
Findlay AS, Carter RN, Starbuck B, McKie
L, Nováková K, Budd PS, Keighren MA, Marsh JA, Cross SH, Simon MM,
et al: Mouse Idh3a mutations cause retinal degeneration and reduced
mitochondrial function. Dis Model Mech. 11:2018.
|