Introduction
Squamous cell carcinoma (SCC) arising from the oral
cavity mucosa, tongue, gingiva and pharynx is the most common type
of oral cancer. There are still a number of critical issues in the
treatment of SCC, such as frequent metastasis to head/neck regions,
including lymph nodes and lungs at the advanced stages, and local
recurrence (1). Treatments based
on the novel molecular findings of these SCCs are yet to be
elucidated (2). Therefore, it is
necessary to focus on the development of potential therapeutic
targets to overcome cancer progression, invasiveness and
metastasis.
Hydroxylation of substrates catalyzed by
2-oxoglutarate-dependent oxygenases is an essential reaction for
biological processes, such as transcription, splicing, translation
and protein stability (3-5). Notably, during tumor progression,
research has focused on the prolyl 4-hydroxylase family for
collagen hydroxylation (6,7),
hypoxia-inducible factor-1α (HIF-1α) stabilization (8-10)
and the lysine demethylase family for histone demethylation
(11,12).
Procollagen-lysine 2-oxoglutarate 5-dioxygenase 2
(PLOD2) is a member of the PLOD family, which is involved in the
lysyl hydroxylation of collagen molecules, the only target molecule
identified to date. PLOD2 is considered to be an essential enzyme
for the crosslinking reaction between collagen molecules outside
the cell (13,14). Furthermore, previous studies
revealed that PLOD2 is transcriptionally regulated by
activation of HIF-1α under hypoxic conditions and recruitment of
specificity protein 1 (Sp1) and mothers against decapentaplegic
homolog 3 (SMAD3) following transforming growth factor-β1 (TGF-1β)
stimulation in the tumor stroma, cancer cells, sarcoma and skin
fibroblasts (15-18). PLOD2 in breast cancer cells is
also upregulated by adipocyte-derived interleukin (IL)-6 and leptin
(19). Additional studies have
reported that the promoter region of PLOD2 contains the
binding sites of transcriptional factors, such as HIF-1α, SMAD3 and
signal transducer and activator of transcription 3 (STAT3)
(14). HIF-1α- and STAT3-induced
PLOD2 expression have been demonstrated in the murine PLOD2
promoter-reporter system (14).
Therefore, PLOD2 expression is modulated by the activation of
several transcription factors in the tumor microenvironment (TME)
(14,17,18).
Invasion and metastasis of cancer cells is affected
by changes in the TME, which includes extracellular matrix (ECM)
molecules, such as collagens (20). The TME is composed of numerous
types of cells, including stromal fibroblasts, endothelial cells,
immune cells and myeloid cells. These cellular communications via
cell-cell attachments or soluble secretory factors, such as growth
factors, cytokines and chemokines, promote a variety of cellular
events, growth, migration, invasion and metastasis of cancer cells.
Among TME cells, CD163-positive M2-type tumor-associated
macrophages (TAMs) tend to increase in various cases of oral SCC
tissues at the advanced malignant stages (21). According to the increased number
of TAMs, the levels of TAM-mediated specific cytokines and
chemokines will increase, and therefore abundant secretory factors
from TAMs in the TME contribute to rearrangement of the tumor
matrix architecture and tumor progression (22). In addition to TAMs, numerous types
of TME cells may potentially modify the tumor matrix architecture
and promote tumor progression. Several experimental contexts
imitate the TME (including co-culture systems composed of
hepatocellular carcinoma cells and cancer-associated fibroblasts;
breast cancer cells and adipocytes) and induce aggressive invasion
of each type of co-cultured cancer cells via upregulation of PLOD2
in the cancer cells (14,19). The results suggest that soluble
factors produced in the co-cultures induce PLOD2 together with
extracellular matrices so that integrin β1 on cancer cells becomes
activated (23), eventually
leading to increased invasiveness through an active interaction
with the enriched collagen matrices in the extracellular space. The
soluble factors that cause PLOD2 induction in cancer cells at
significant levels are unknown. Inflammatory cytokines, such as
IL-6 and IL-8, are detected in both the saliva and serum of
patients with oral cancer, and are thus potential biomarkers to
diagnose oral cancer (24,25).
In addition to cytokines, numerous types of cancer, including oral
SCC exhibit high expression of chemokine (CC motif) ligand 2 (CCL2)
(26,27). However, the relationship between
PLOD2-mediated tumor invasion and metastasis, and TME factors such
as IL-6, IL-8 and CCL2 in refractory cancers, including those of
the oral cavity and throat, remains unclear.
The present study focused on elucidating the
unidentified induction machinery of PLOD2 in the TME and its role
in oral cancer cells. The data indicated the possibility that
targeting the identified signaling axis, IL-6-STAT3-PLOD2-integrin
β1, may have clinical utility for therapeutic regulation of oral
cancer metastasis.
Materials and methods
Cell lines and cell culture
The human oral cancer cell lines (HSC-2, HSC-3,
Ca9-22) used in this study were purchased from the Japanese
Collection of Research Bioresources Cell Bank. Cells were
maintained in RPMI-1640 medium (FUJIFILM Wako Pure Chemical
Corporation) containing 10% fetal bovine serum (FBS; HyClone;
Cytiva) with 100 U/ml penicillin and 0.1 mg/ml streptomycin (Thermo
Fisher Scientific, Inc.) at 37°C in 5% CO2.
PLOD2-knockout (PLOD2-KO) HSC-2 cell clones were generated
with clustered regularly interspaced short palindromic repeats
(CRISPR)/CRISPR associated protein 9 (Cas9)-based genome
engineering technology as previously described (23), which were compared to the intact
parental HSC-2 cells as the control [PLOD2-wild-type
(PLOD2-WT)]. Briefly, the 23-base of gRNA
(5′-CCAGGATAATGATGATGATCAGC-3′) containing the sequence of
protospacer adjacent motif for PLOD2 targeting sequence
(5′-GCTGATCATCATCATTATCC-3′) was determined from the CRISPRdirect
website (http://crispr.dbcls.jp/). The target
site corresponded to the Exon 5 of PLOD2 (latest NCBI RefSeq
number, NM_000935.3), which located the N-terminal protein domain
of unknown function. The plasmids hCas9 (cat. no. 41815) and gRNA
Cloning Vector (cat. no. 41824) were purchased from Addgene, Inc.
The genotype of PLOD2-KO cells was confirmed by Sanger DNA
sequencing using ABI BigDye™ Terminator v3.1 Cycle Sequencing Kit
and 3130 Genetic Analyzer (Applied Biosystem; Thermo Fisher
Scientific, Inc.) according to the manufacturer's instructions. The
type of mutations induced by PLOD2 knockdown was an
insertion mutation (frameshift mutation disrupting open reading
frames) and heterozygous mutant. The stable clone expressing green
fluorescence protein was selected in 0.4 mg/ml geneticin (G418;
Thermo Fisher Scientific, Inc.).
To identify possible cross-contamination with other
cell lines, short tandem repeat (STR) analysis of oral cancer cells
used in this study was performed by Takara Bio, Inc. Results
confirmed that these cells were the same as the cells registered in
Japanese Collection of Research Bioresources (JCRB) Cell Bank or
RIKEN BioResource Center by comparison with the database of JCRB
Cell Bank or RIKEN BioResource Center (Table SI). The evaluation values
(28) were calculated for all
cell lines in this study. Ca9-22 cells (Fig. S1 and Table SI) do not include the
MSK-922 cells of head and neck SCC origin (29).
Construction of plasmids
The transcriptional start site for PLOD2 was
predicted using the DataBase of Transcriptional Start Sites
(https://dbtss.hgc.jp). The symbols of minus (-)
and plus (+) represent the upstream and downstream sides of the
transcriptional start site, respectively. The human PLOD2
promoter (bp -1,498 to +170, position from transcriptional start
site +1; nucleotides of 1,668 bp) was amplified with PCR from
genomic DNA of HSC-2 oral cancer cells using KOD Fx Neo DNA
polymerase (Toyobo Life Science) and ligated into the pGL4.10 Luc2
vector (Promega Corporation), which encoded the Firefly luciferase
reporter gene, at the KpnI-NheI site. Firefly luciferase reporter
constructs containing the 5′-deleted PLOD2 promoter (-1,187
to +170, -315 to +170) were isolated using a PCR-based method. The
thermocycling conditions for the amplification of PLOD2
promoter region were as follows: 94°C for 2 min, two-step for 40
cycles (98°C for 10 sec and 68°C for 60 sec), 68°C for 5 min. The
forward and reverse primer sequences for PLOD2 promoter region were
as follows: p1498-Luc forward, 5′-TTGGGTACCACGAGTCTC
ACAGCACAGAT-3′; p1187-Luc forward,
5′-TTGGGTACCACTCAGAGGACTGATGCTGT-3′; p315-Luc forward, 5′-TTG
GGTACCGAGTCTAAGGCTCTCTTGGCA-3′; p1498-Luc, p1187-Luc and p315-Luc
reverse, 5′-CCTACTAGTCACG TCTGGACTGTTTGCTC-3′. Wild-type STAT3 was
cloned from the cDNA of normal human dermal fibroblast cells (cat.
no. C-12302; PromoCell GmbH) using KOD Fx Neo and ligated into the
pcDNA 3.1(+) vector (Invitrogen; Thermo Fisher Scientific, Inc.) at
the EcoRV-XhoI site, and referred to as WT-STAT3. The
PCR conditions were performed as described above and the primers
were as follows: STAT3 forward, 5′-GTGCAGATATCCAATGGCCCAATGGAAT
CAGCTA-3′ and reverse, 5′-ATATCTCGAGTCACATGG GGGAGGTAGCGC-3′. The
constitutively active form of the STAT3 mutant (A661C, N663C;
alanine residue at position 661 and asparagine residue at position
663 were substituted to cysteine residues) was generated using the
QuikChange Site-Directed Mutagenesis Kit (Stratagene; Agilent
Technologies, Inc.) following the manufacturer's protocol, and
referred to as CA-STAT3. The primer (5′-AAGATCATGGATTGTACCTGT
ATCCTGGTGTCTCC-3′) for STAT3 mutagenesis was used. The nucleotide
sequences of all constructs obtained with PCR were confirmed by
Sanger DNA sequencing using ABI BigDye™ Terminator v3.1 Cycle
Sequencing Kit and 3130 Genetic Analyzer (Applied Biosystem; Thermo
Fisher Scientific, Inc.), according to the manufacturer's
instructions.
Dual-luciferase reporter assay
Ca9-22 cells were cultured in 24-well plates (1×10
cells/well) for 24 h. The following day, cells were co-transfected
with the Firefly luciferase reporter plasmid containing a
PLOD2 promoter (250 ng) and the control reporter vector
expressing Renilla luciferase (pRL-TK, 25 ng; Promega
Corporation) as an internal control for normalization of Firefly
luciferase activity in comparison with Renilla luciferase
activity. Transfections were performed using
Lipofectamine® 3000 reagent (Thermo Fisher Scientific,
Inc.) according to the manufacturer's instructions. After 16 h of
transfection, 0.5 ng/ml recombinant human IL-6 (cat. no.
206-IL-010; R&D Systems, Inc.) was added to the medium, and
cells were cultured at 37°C for 24 h. Luciferase activity was
measured with the Dual-Luciferase Reporter Assay System (Promega
Corporation), according to the manufacturer's protocol. The
luminescence was detected with a Centro XS3 LB 960 luminometer
(Titertek-Berthold).
Cell invasion and migration analysis
PLOD2 small interfering (si)RNA (siPLOD2;
ON-TARGETplus SMART pool; cat. no. L-004285-01-0005; Horizon
Discovery, Ltd.) and Control siRNA (siControl; ON-TARGETplus
Non-targeting Control pool; cat. no. D-001810-10-05; Horizon
Discovery, Ltd.) was transfected into green fluorescence protein
(GFP)-expressing oral cancer cell lines using
Lipofectamine® RNAiMAX reagent (Thermo Fisher
Scientific, Inc.) according to the manufacturer's protocol. After
each siRNA (25 nM) transfection for 24 h, siPLOD2 and
siControl-transfected cells (5×10⁵ cells/well in
RPMI-1640 medium) were cultured at 37°C for 24 h into the upper
chambers (0.5% FBS) of the Transwell chambers (Corning, Inc.)
coated with 0.1 mg/ml Matrigel (37°C for 2 h; BD Biosciences) and
allowed to invade toward the lower chambers that contained 10% FBS
with or without IL-6. After 24 h of incubation, invaded
GFP-expressing cells were detected with a fluorescence microscope
(Olympus IX71; Olympus Corporation) using the 4X objective lens,
and the number of cells was counted in the fields using cellSens
standard software version 1.4 (Olympus Corporation). Cell migration
with IL-6 treatment was detected with a wound healing assay using a
24-well plate coated with COL-I (Corning, Inc.). When the
confluence of GFP-expressing oral cancer cells reached ~90-100% in
RPMI-1640 medium with 10% FBS (30,31), scratch wounds were created in each
well. After scratching, the debris was removed and IL-6 was added,
the cell images were obtained after 0, 6, 12 h of incubation at
37°C and the migration of GFP-expressing cells were detected with
an Olympus IX71 fluorescence microscope (Olympus Corporation) using
the 2X objective lens. Migration was calculated as the relative
percentage of scratch area to the area at 0 h (% of wound closure)
using cellSens standard software version 1.4 (Olympus
Corporation).
Reverse transcription
(RT)-semi-quantitative PCR
Total RNA was extracted from prepared cells using
the RNeasy Plus Mini Kit (Qiagen, Inc.) according to the
manufacturer's protocol. For analysis of mRNA, cDNA was synthesized
from 1 µg total RNA using ReverTra Ace™ (Toyobo Life
Science) according to the manufacturer's protocol. cDNA was
amplified by PCR with Z-Taq DNA Polymerase (Takara Bio, Inc.). The
thermocycling conditions for PCR were as follows: 94°C for 150 sec,
two-step for 35 cycles (98°C for 2 sec and 68°C for 5 sec), 72°C
for 5 min. All the RT-PCR products obtained were analyzed by gel
electrophoresis using 2% agarose gel (cat. no. 1613102; Bio-Rad
Laboratories, Inc.) containing ethidium bromide (cat. no. 15585011;
Invitrogen; Thermo Fisher Scientific, Inc.). β-actin was used as a
positive control and for the normalization of RT-PCR products. PCR
primer sets were previously described by Ueki et al
(23). The PCR products were
detected using a ChemiDoc™ Touch Imaging System (Bio-Rad
Laboratories, Inc.) and band intensity was analyzed using Image Lab
software version 5.2 (Bio-Rad Laboratories, Inc.).
Immunoblotting
The cell pellets were lysed with 100 ml RIPA buffer
[50 mM Tris/HCl (pH 7.5), 150 mM NaCl, 0.5% sodium deoxycholate, 1%
NP-40, 0.1% SDS] containing Complete Mini Protease Inhibitor (Roche
Diagnostics) and with sonication for 30 sec. The supernatant was
collected as soluble sample by centrifugation at 16,900 × g for 30
min at 4°C. The sample was diluted with 2 volumes of 2X Laemmli
sample buffer (cat. no. 161-0737; Bio-Rad Laboratories, Inc.) and
boiled at 98°C for 5 min. Then, 20 ml protein sample per lane was
resolved via SDS-PAGE on a 10% gel. Separated proteins were then
transferred to a nitrocellulose membrane and the membranes were
blocked for 1 h at room temperature with 5% skimmed milk (FUJIFILM
Wako Pure Chemical Corporation) in TBS with Tween-20 (TBST; 50 mM
Tris-HCl pH 7.2, 140 mM NaCl, 0.05% Tween-20). The following
primary antibodies were diluted in TBST containing 5% skimmed milk
and incubated overnight at 4°C: Rabbit anti-PLOD2 (1:1,000; cat.
no. 21214-1-AP; ProteinTech Group, Inc.), rabbit anti-integrin β1
(1:1,000; cat. no. 9699; Cell Signaling Technology, Inc.) and mouse
anti-human β-actin antibody (1:5,000; cat. no. MAB1501; EMD
Millipore). Membranes were then incubated for 1 h at room
temperature with horseradish peroxidase-conjugated anti-mouse
(1:10,000; cat. no. 62-6520; Thermo Fisher Scientific, Inc.) or
anti-rabbit IgG secondary antibodies (1:10,000; cat. no. 65-6120;
Thermo Fisher Scientific, Inc.). Positive signals were enhanced
with a chemiluminescence system (Supersignal West Pico substrate;
Thermo Fisher Scientific, Inc.) and visualized using the ChemiDoc™
Touch Imaging System.
Immunocytochemistry
Oral cancer cell lines (HSC-2, HSC-3, Ca9-22)
treated with or without IL-6 were fixed for 30 min at room
temperature with 4% paraformaldehyde in phosphate-buffered saline
(PBS) and permeabilized with 0.1% Triton X-100 (cat. no. T8787;
Sigma-Aldrich; Merck KGaA) in PBS for 3 min at room temperature.
After blocking with 3% BSA (cat. no. A7030; Sigma-Aldrich; Merck
KGaA) in TBST, these cells were incubated with primary antibodies
in 3% BSA/TBST overnight at 4°C. PLOD2 expression was detected by
staining with a rabbit anti-PLOD2 primary antibody (1:500; cat. no.
21214-1-AP; ProteinTech Group, Inc.), and integrin β1 expression
was detected by staining with mouse anti-integrin β1 primary
antibody (1:500; cat. no. ab3167; Abcam). Cells were washed three
times with 3% BSA/TBST and incubated for 1 h at room temperature
with secondary antibodies in 3% BSA/PBST, and then washed three
times with PBS. The secondary antibodies used were Cy3-labeled goat
anti-rabbit (H+L) antibody (1:500; cat. no. 111-167-003; Jackson
ImmunoResearch Laboratories, Inc.) and Alexa Fluor 555-labeled goat
anti-mouse IgG (H+L) anti-body (1:500; cat. no. A28180; Thermo
Fisher Scientific, Inc.). Cell nuclei were counterstained with
4′,6-diamidino-2-phenylindole (1:1,000; Hoechst 33342 dye:
Molecular Probes; Thermo Fisher Scientific, Inc.) for 1 min at room
temperature. CellLight® ER-GFP BacMam 2.0 (Thermo Fisher
Scientific, Inc.) was used as an endoplasmic reticulum (ER) marker.
The fluorescence signals were detected with an Olympus IX71
fluorescence microscope and analyzed using cellSens Standard
software version 1.4 (Olympus Corporation).
Immunohistochemistry and
immunofluorescence staining
The use of patient-derived tissues was approved by
the ethics committees of Niigata University Graduate School of
Medical and Dental Sciences (approval no. 2019-0173; Niigata,
Japan). The cohort comprised 15 patients >20 years of age with
histopathologically-confirmed head and neck cancer, including oral
cancer, who had been surgically treated at the Niigata University
Hospital (Niigata, Japan) between January 2015 and June 2019.
Consent was not obtained from each patient, however the patients
were notified of the details of the study by opt-out consent and
had the right to refuse participation in the study. Human oral and
laryngeal carcinoma tissues were fixed in 10% buffered formalin
solution for 24 h at room temperature. Paraffin-embedded sections
(5 mm) were deparaffinized, and antigen retrieval was performed by
autoclaving (Pascal S2800; Dako; Agilent Technologies, Inc.) in
sodium citrate buffer. Endogenous peroxidase activity was quenched
by incubation in 0.3% hydrogen peroxide (Kanto Chemical Co., Inc.)
for 20 min at room temperature. Sections were blocked with 1% BSA
in PBS for 30 min at room temperature, and then incubated with
rabbit anti-IL-6 (1:200; cat. no. 21865-1-AP; ProteinTech Group,
Inc.) and mouse anti-CD163 (1:500; cat. no. NCL-L-CD163; Leica
Biosystems) primary antibodies overnight at 4°C. After the sections
were washed with PBS, they were subjected to the diaminobenzidine
detection system (EnVision+ Kit/horseradish peroxidase; Dako;
Agilent Technologies, Inc.) according to the manufacturer's
protocol. For fluorescence immunostaining of tissues, primary
antibodies were used against IL-6 and CD163, and tissues were
incubated for 1 h at room temperature with Cy3-conjugated goat
anti-rabbit IgG (H+L) secondary antibody (1:500; cat. no.
111-167-003; Jackson ImmunoResearch Laboratories, Inc.) and Alexa
Fluor 488-conjugated goat anti-mouse IgG (H+L) secondary antibody
(1:500; cat. no. A-11017; Thermo Fisher Scientific, Inc.). The
nuclei were stained with Hoechst 33258 (1:1,000) for 1 min at room
temperature. The images were detected with an Olympus IX71
fluorescence microscope (Olympus Corporation) using the 20X
objective lens and a sCMOS camera (Zyla 4.2 Plus; Andor Technology,
Ltd.).
Statistical analysis
Data are shown as the mean ± standard deviation from
three independent experiments. Comparisons between two groups were
carried out using a paired Student's t-test (Microsoft Excel
version 2102; Microsoft Corporation). For multiple comparisons,
one-way analysis of variance followed by Tukey's post hoc test was
performed using Excel statistical software (32,33) (BellCurve for Excel version 3.21,
http://bellcurve.jp/; Social Survey Research
Information Co., Ltd.). P<0.05 was considered to indicate a
statistically significant difference.
Results
PLOD2 induction by IL-6 in oral cancer
cells
By searching the genomic sequence of human
PLOD2, the STAT3 binding motif was predicted within the
promoter region (Fig. 1A). Thus,
the IL-6-STAT3 pathway may be involved in oral cancer progression
(34). According to this
hypothesis, it was next examined whether PLOD2 expression was
altered in the presence of IL-6. As shown in Fig. 1B, the mRNA levels of PLOD2
in oral SCC (HSC-2, HSC-3 and Ca9-22) cells were notably elevated
in response to IL-6. On the other hand, no marked changes in
PLOD1 or PLOD3 mRNA levels was observed following
treatment with IL-6. To examine IL-6-induced PLOD2
expression in detail, a luciferase reporter assay was performed in
which luciferase was driven by the human PLOD2 promoter
based on 1,498 bp that includes three intrinsic STAT3 binding sites
(top) or deletion promoters based on 1,187 bp (middle) and 315 bp
(bottom) that lack one and all STAT3 binding elements (Fig. 1A). Using this approach, it was
found that the expression of PLOD2 promoter-reporter
constructs, p1498-Luc and p1187-Luc, that contain the indicated
STAT3 binding sites (three for p1498-Luc and two for p1187-Luc)
were both upregulated by IL-6 stimulation, but their expression
levels were different (Fig. 1C).
However, the PLOD2 promoter construct, p315-Luc, which lacks
all STAT3-binding cis-elements showed almost no response to IL-6.
Furthermore, forced expression of an expression vector carrying
CA-STAT3, but not WT-STAT3, significantly induced the expression of
the luciferase reporter gene from co-transfected reporter
constructs (Fig. 1D). However,
even in the presence of CA-STAT3, the expression levels of
luciferase following transfection of p315-Luc were comparable to
levels in the presence of IL-6 (Fig.
1C). As shown in Fig. 1D, the
overexpression of CA-STAT3, but not WT-STAT3, notably upregulated
endogenous PLOD2 in the transfected cells that were not
treated with IL-6 (Fig. 1E).
These results indicated that PLOD2 expression is positively
regulated by the IL-6-mediated canonical pathway, IL-6-STAT3, in
oral cancer cells.
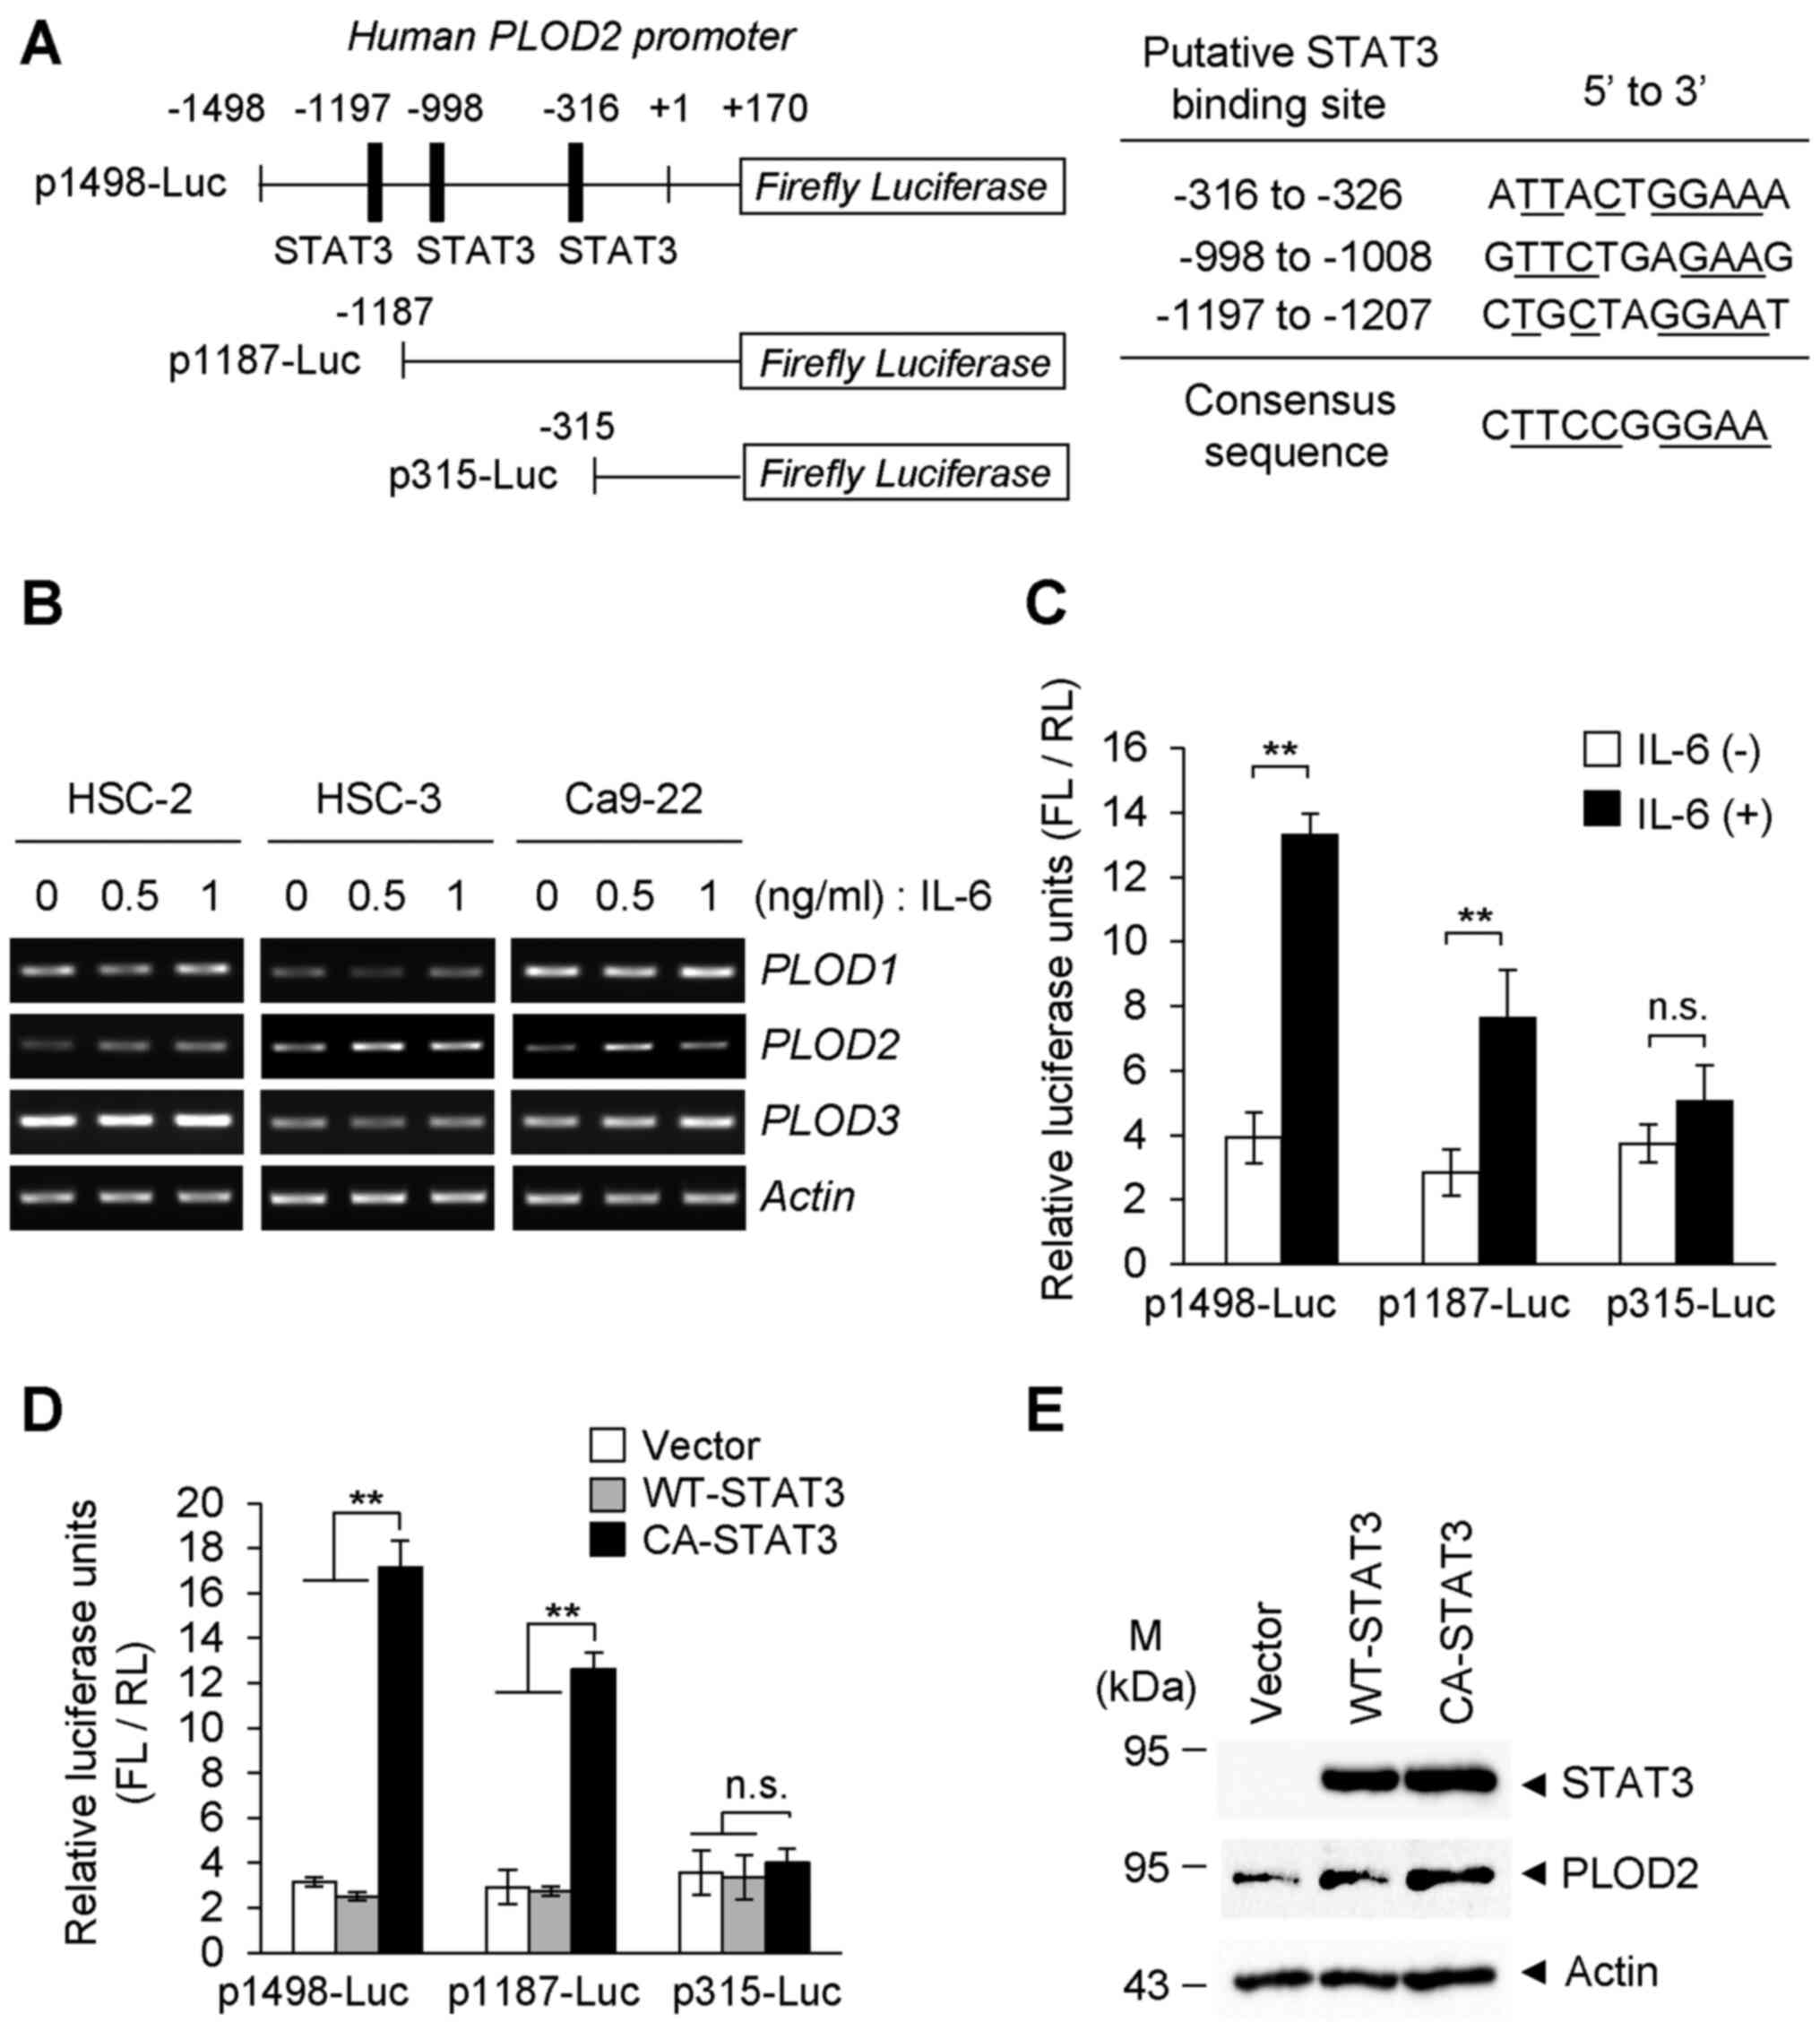 | Figure 1PLOD2 induction of oral cancer cells
by IL-6 stimulation. (A) Construction of the human PLOD2
promoter-reporter system and the deletion mutants of STAT3-binding
elements in the PLOD2 promoter are shown. Sequences and
positions of putative STAT3 binding sites on the PLOD2
promoter are shown. (B) Oral cancer cells (HSC-2, HSC-3 and Ca9-22)
were stimulated with IL-6 at the indicated concentrations for 48 h,
and the mRNA levels of PLOD family members were detected via
reverse transcription-semi-quantitative PCR. (C) Ca9-22 cells were
co-transfected with the PLOD2 promoter-reporter plasmid
(p1498-Luc, p1187-Luc and p315-Luc) and the RL vector as an
internal control. Cells were treated with or without IL-6 (0.5
ng/ml) for 24 h, and the expression levels of FL and RL were
measured with a luminometer. Each experiment was performed in
triplicate and normalized to RL expression (n=3).
**P<0.01. (D) Ca9-22 cells were co-transfected with
the reporter plasmid and the RL vector. Then, 24 h after induction
of reporter genes, cells were further transfected with WT-STAT3 or
CA-STAT3. FL activity was normalized to RL expression as an
internal control. Data are presented as the mean ± SD from three
independent experiments (n=3). **P<0.01. ANOVA
followed by a Tukey's test. (E) Plasmid with WT-STAT3 or CA-STAT3
was transiently transfected into Ca9-22 cells. The expression of
PLOD2 was detected via immunoblotting. PLOD2, procollagen-lysine
2-oxoglutarate 5-dioxygenase 2; IL-, interleukin; STAT3, signal
transducer and activator of transcription 3; n.s., not significant;
WT, wild-type; CA, constitutively activate; FL, Firefly luciferase;
RL, Renilla luciferase. |
Integrin β1 activation via the
IL-6/STAT3/PLOD2 signaling axis
In the cell invasion assay using a Matrigel-coated
Transwell chamber, IL-6 stimulation of oral SCC cells increased
their invasiveness. Conversely, transfection with siPLOD2
significantly suppressed cell invasion and migration, even in the
presence of IL-6 (Figs. 2A and
S2A and B). We previously
reported that PLOD2 increases cancer metastasis through
stabilization of integrin β1 protein on the cancer cell surface via
PLOD2-catalyzed lysyl hydroxylation (23). Therefore, the present study
assessed whether the integrin β1 state is affected by PLOD2 itself
and IL-6 treatment. As shown in Fig.
2B, the protein levels of integrin β1 in all three cell lines
were efficiently downregulated following transfection with siPLOD2.
In addition, the integrin β1 content in individual cells was
elevated with the increase in PLOD2 levels in response to IL-6
stimulation (Fig. 2C). However,
no significant alteration in integrin β1 mRNA expression
with or without IL-6 stimulation was detected in oral SCC cells
(Fig. 2D). Therefore, IL-6 in
these conditions did not affect induction of integrin β1
mRNA. The results suggested that integrin β1 protein is regulated
by PLOD2 in tumor cells.
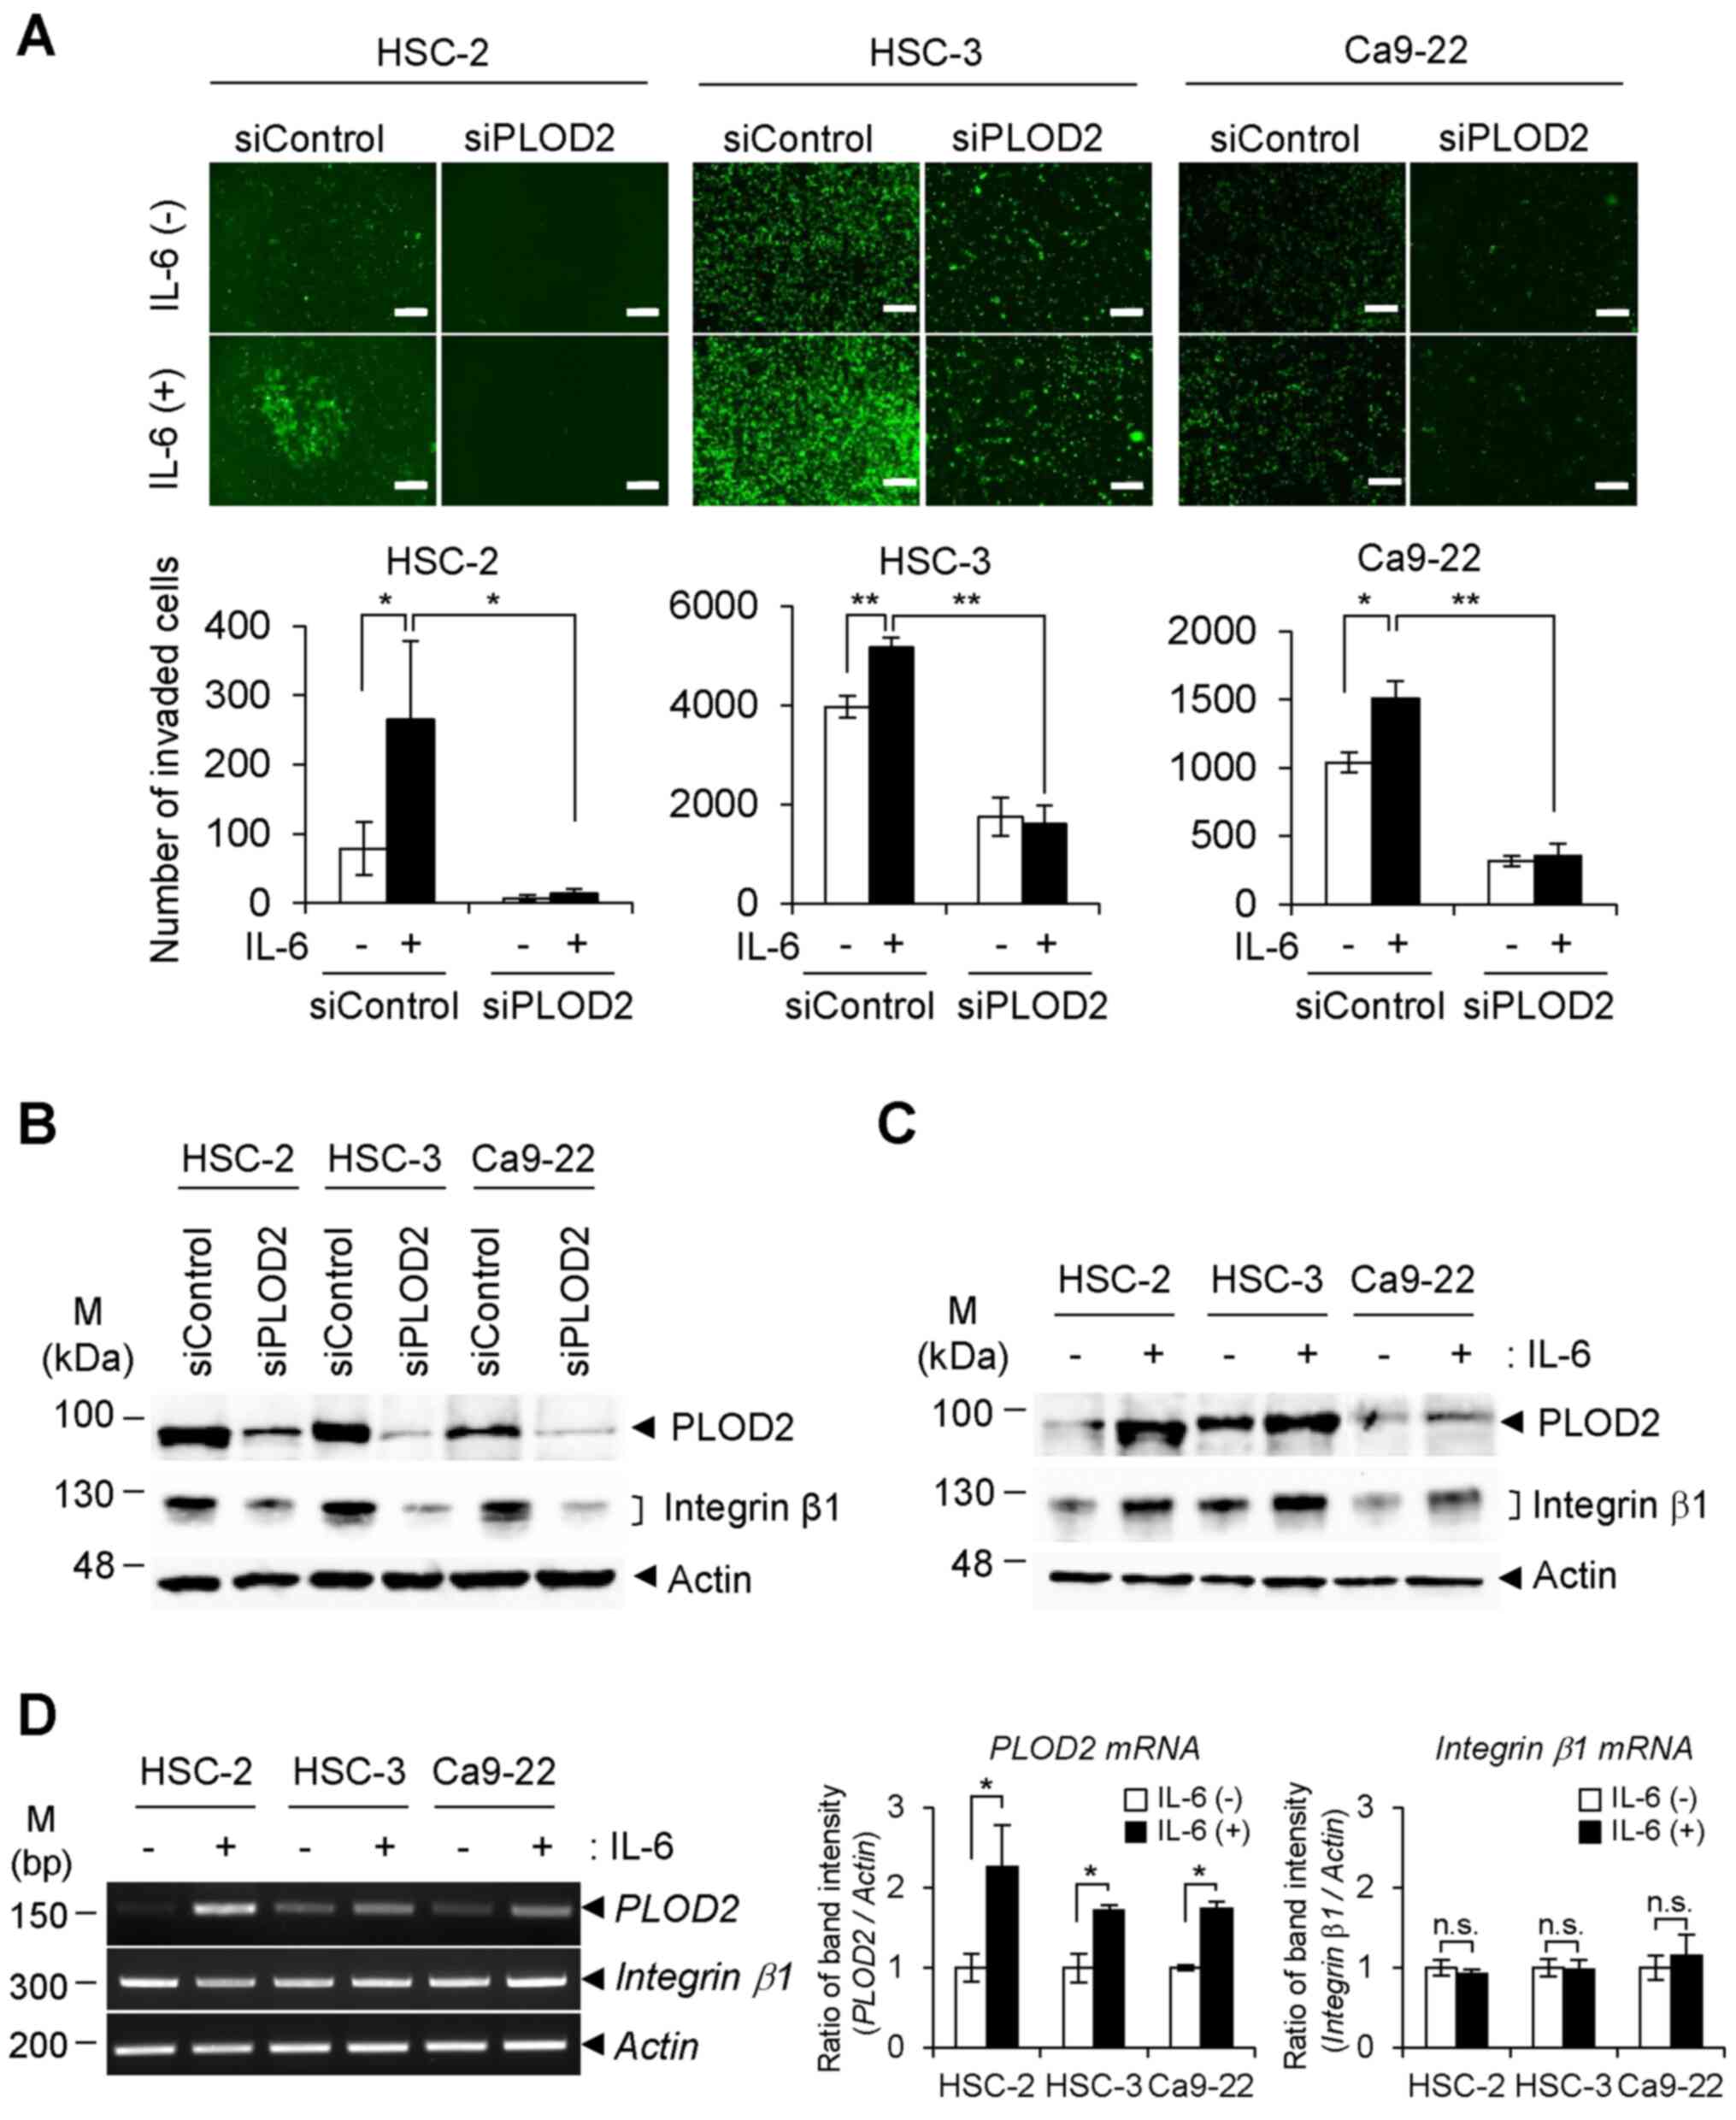 | Figure 2Invasion of oral cancer cells in
response to IL-6. (A) siPLOD2 and siControl-transfected oral cancer
cells (HSC-2, HSC-3 and Ca9-22, green fluorescence protein-positive
cells) were seeded into the upper chamber of a Matrigel-coated
Transwell plate. The cells were treated with or without IL-6 for 24
h, and then cells that had migrated to the lower chamber were
observed with fluorescence microscopy (upper panels). The number of
migrated cells was calculated from the fluorescence image (lower
panels) (n=3). *P<0.05, **P<0.01. ANOVA
followed by a Tukey's test. Data are presented as the mean ± SD
from three independent experiments. Scale bar, 200 µm. (B)
Expression levels of integrin β1 in siPLOD2-transfected cells were
detected with immunoblotting. (C) Oral cancer cells were stimulated
with IL-6 (0.5 ng/ml) for 48 h, and the expression levels of PLOD2
and integrin β1 were detected via immunoblotting. (D) Transcript
levels of PLOD2 and integrin β1 with or without IL-6
were determined via reverse transcription-semi-quantitative PCR
(left panels). The band intensity of PCR products was
semi-quantified by densitometric analysis and normalized to
β-actin band intensity (right panels). Data are presented as
the mean ± SD from three independent experiments (n=3).
*P<0.05. PLOD2, procollagen-lysine 2-oxoglutarate
5-dioxygenase 2; IL-, interleukin; siRNA/si, small interfering;
n.s., not significant. |
Intracellular localization of PLOD2 and
integrin β1 by IL-6
Although the ER localization of PLOD2 was not
changed in the absence of IL-6 compared with the presence of IL-6
(Fig. 3A), integrin β1 was
actively recruited to the plasma membrane in response to IL-6. It
was further confirmed that the IL-6-enhanced plasma membrane
localization of integrin β1 was notably downregulated by
transfection with siPLOD2 (Fig.
3B). Therefore, these results indicated that the localization
of integrin β1 was influenced by the ER localization of PLOD2.
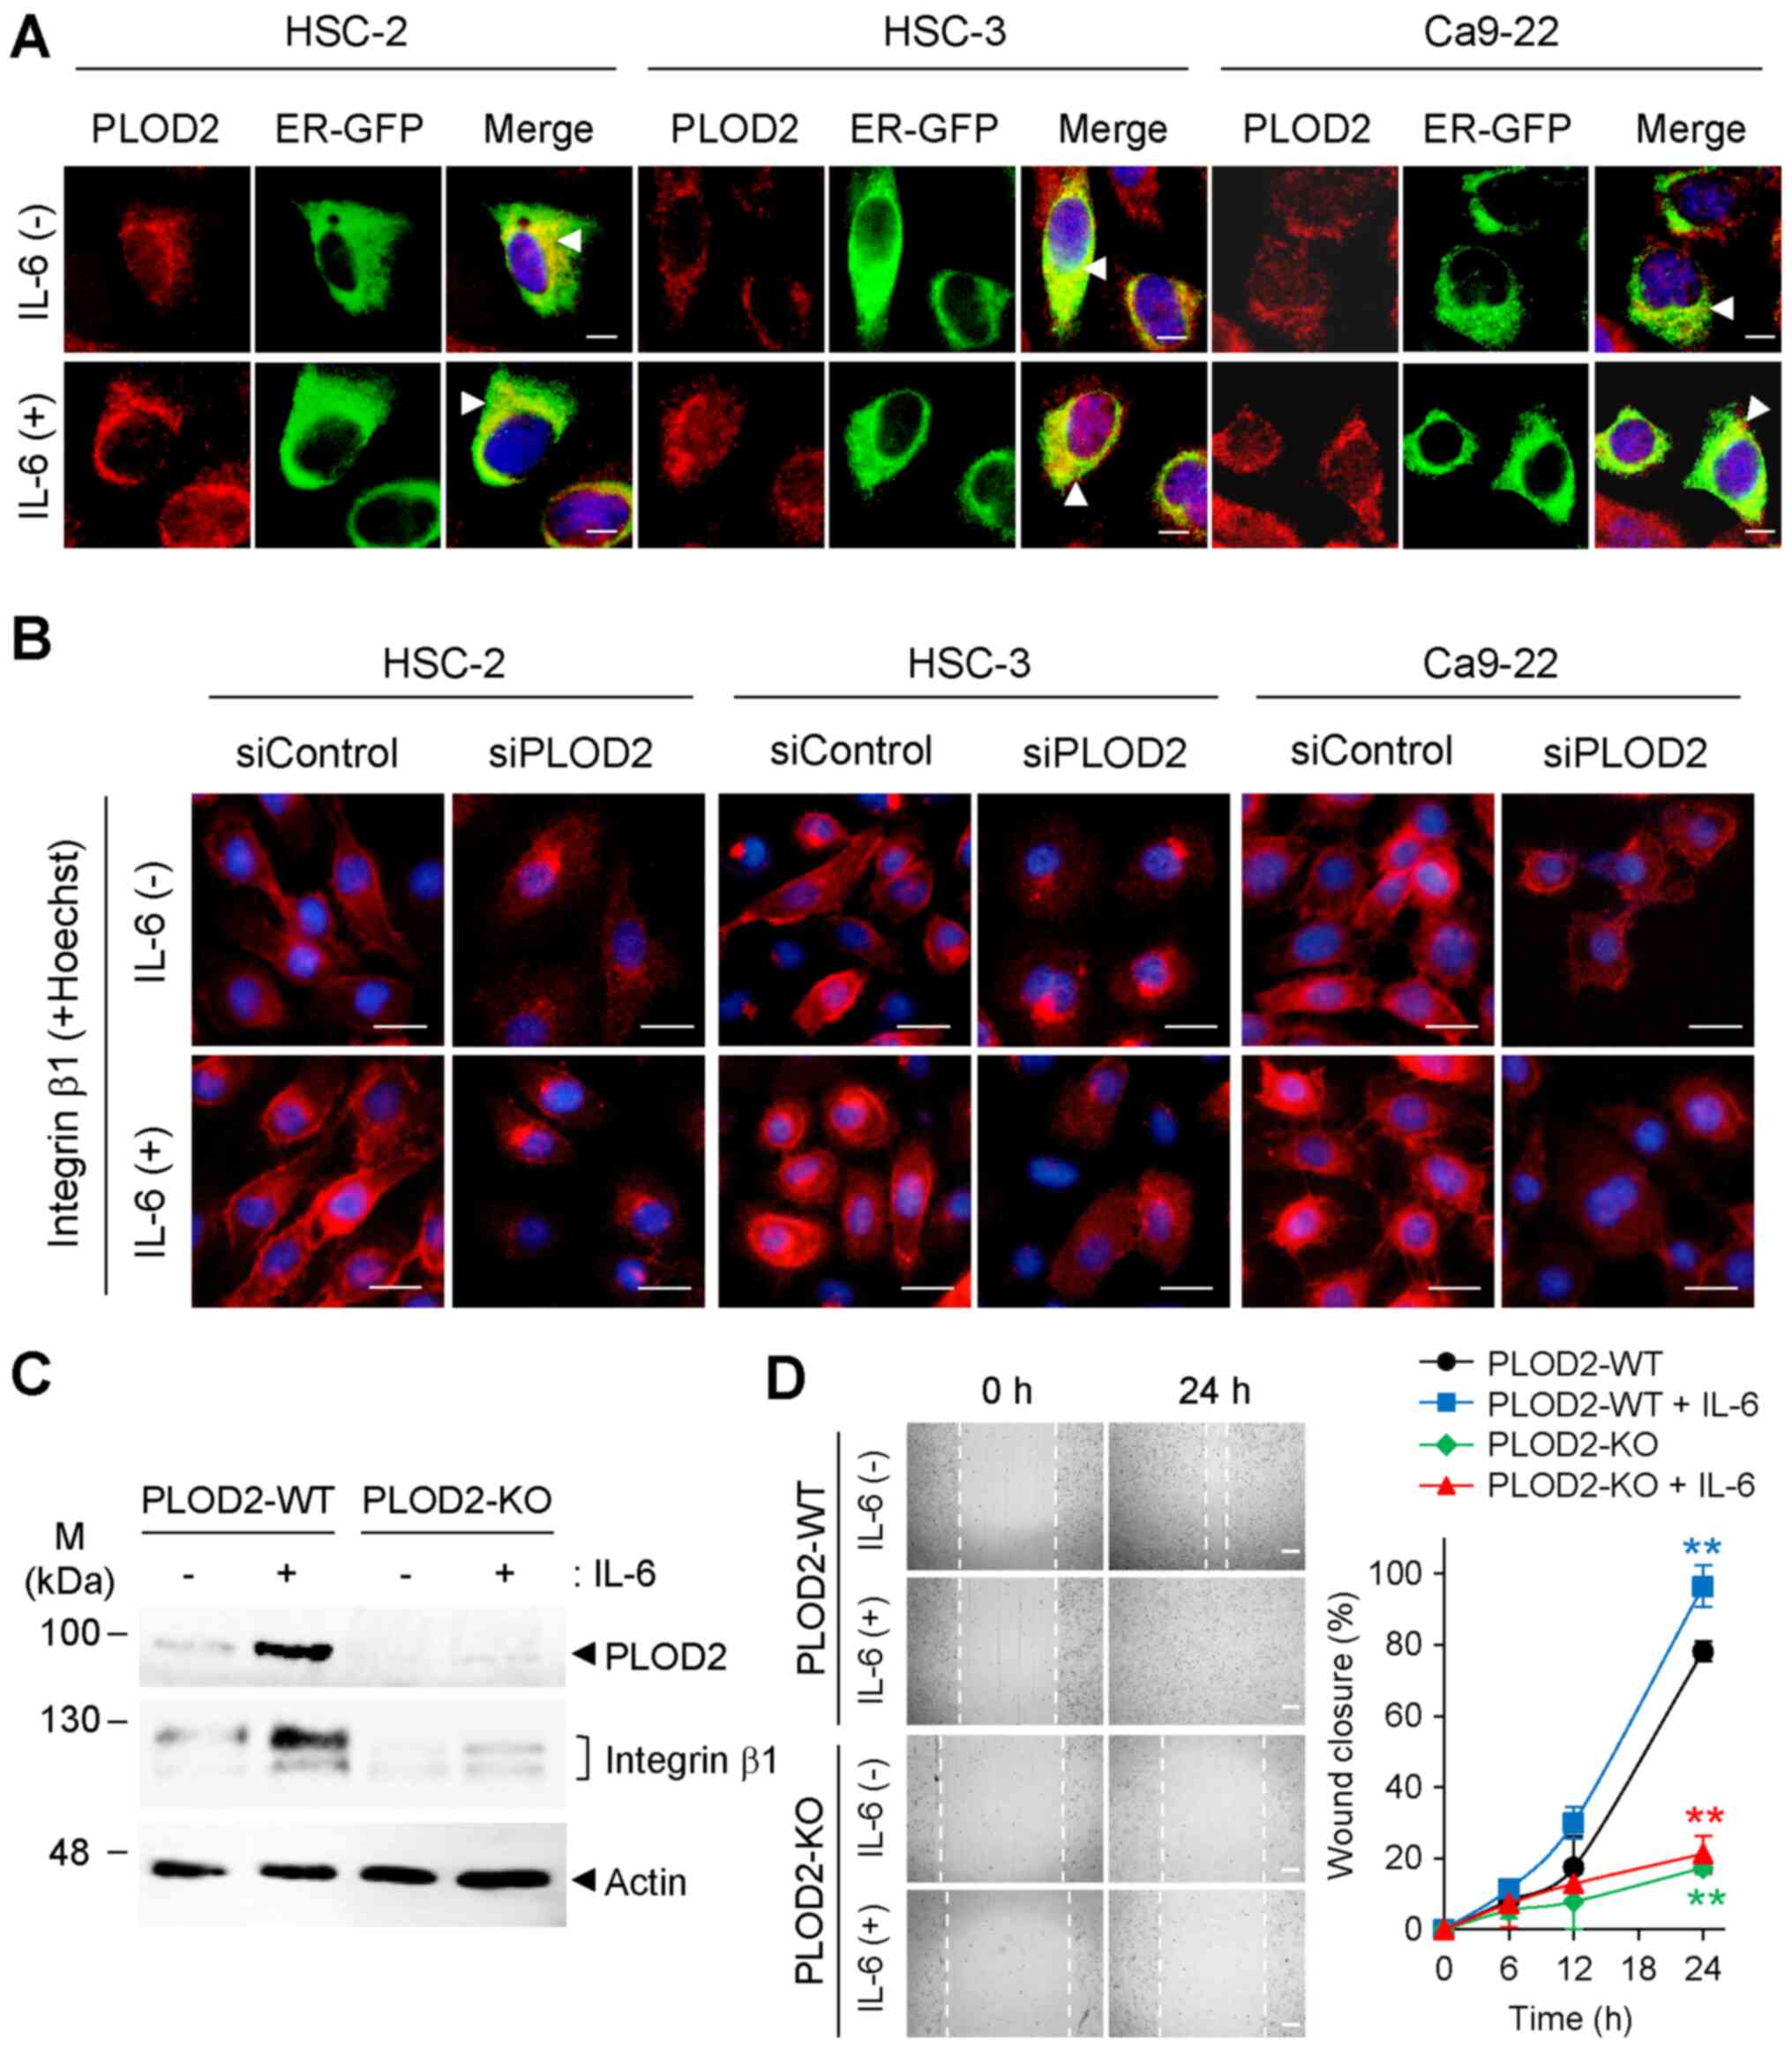 | Figure 3PLOD2-dependent intracellular
localization of integrin β1. (A) Intracellular localization of
PLOD2 (red) with or without IL-6 treatment was observed with
immunostaining. Localization of PLOD2 was merged with the ER
marker, ER-GFP (arrowhead). Nuclei were stained with Hoechst 33258.
Scale bar, 10 µm. (B) Localization and expression of
integrin β1 (red) were observed with immunocytochemistry staining
48 h after IL-6 and siPLOD2 stimulation. Nuclei (blue) were stained
with Hoechst 33258. Scale bar, 20 µm. (C) Expression levels
of PLOD2 and integrin β1 in PLOD2-KO HSC-2 cells were detected with
immunoblot analysis. (D) Cell migration of PLOD2-KO cell lines with
or without IL-6 treatment (0.5 ng/ml) was detected with a wound
healing assay using a 24-well plate. Images were taken 0 and 24 h
after wound formation (scale bar, 400 µm), and the wound
width was estimated using microscopic images. Data are presented as
the mean ± SD (n=3). ANOVA followed by a Tukey's test.
**P<0.01 vs. PLOD2-WT without IL-6 treatment group.
PLOD2, procollagen-lysine 2-oxoglutarate 5-dioxygenase 2; IL-,
interleukin; siRNA/si, small interfering; GFP, green fluorescence
protein; ER, endoplasmic reticulum; KO, knockout; WT,
wild-type. |
To examine whether IL-6 induces a functional, mature
form of integrin β1 on the plasma membrane, western blotting was
performed to detect the mature form of the protein, which has a
molecular weight of 125 kDa. IL-6 induced the upregulation of
PLOD2, which was followed by an increase in the mature form of
integrin β1 (upper band) in cells expressing PLOD2-WT (Fig. 3C). On the other hand, the mature
form of integrin β1 in PLOD2-KO cell lines was expressed at lower
levels than that of integrin β1 in PLOD2-WT. The lower generation
of the mature form of integrin β1 in PLOD2-KO resulted in a
reduction in cell migration regardless of IL-6 treatment (Fig. 3D). Taken together, these results
indicated that the PLOD2-integrin β1 axis in which PLOD2 induces
maturation and membrane localization of integrin β1 increases cell
migration and invasion in oral cancer cells and is triggered by
extracellular IL-6.
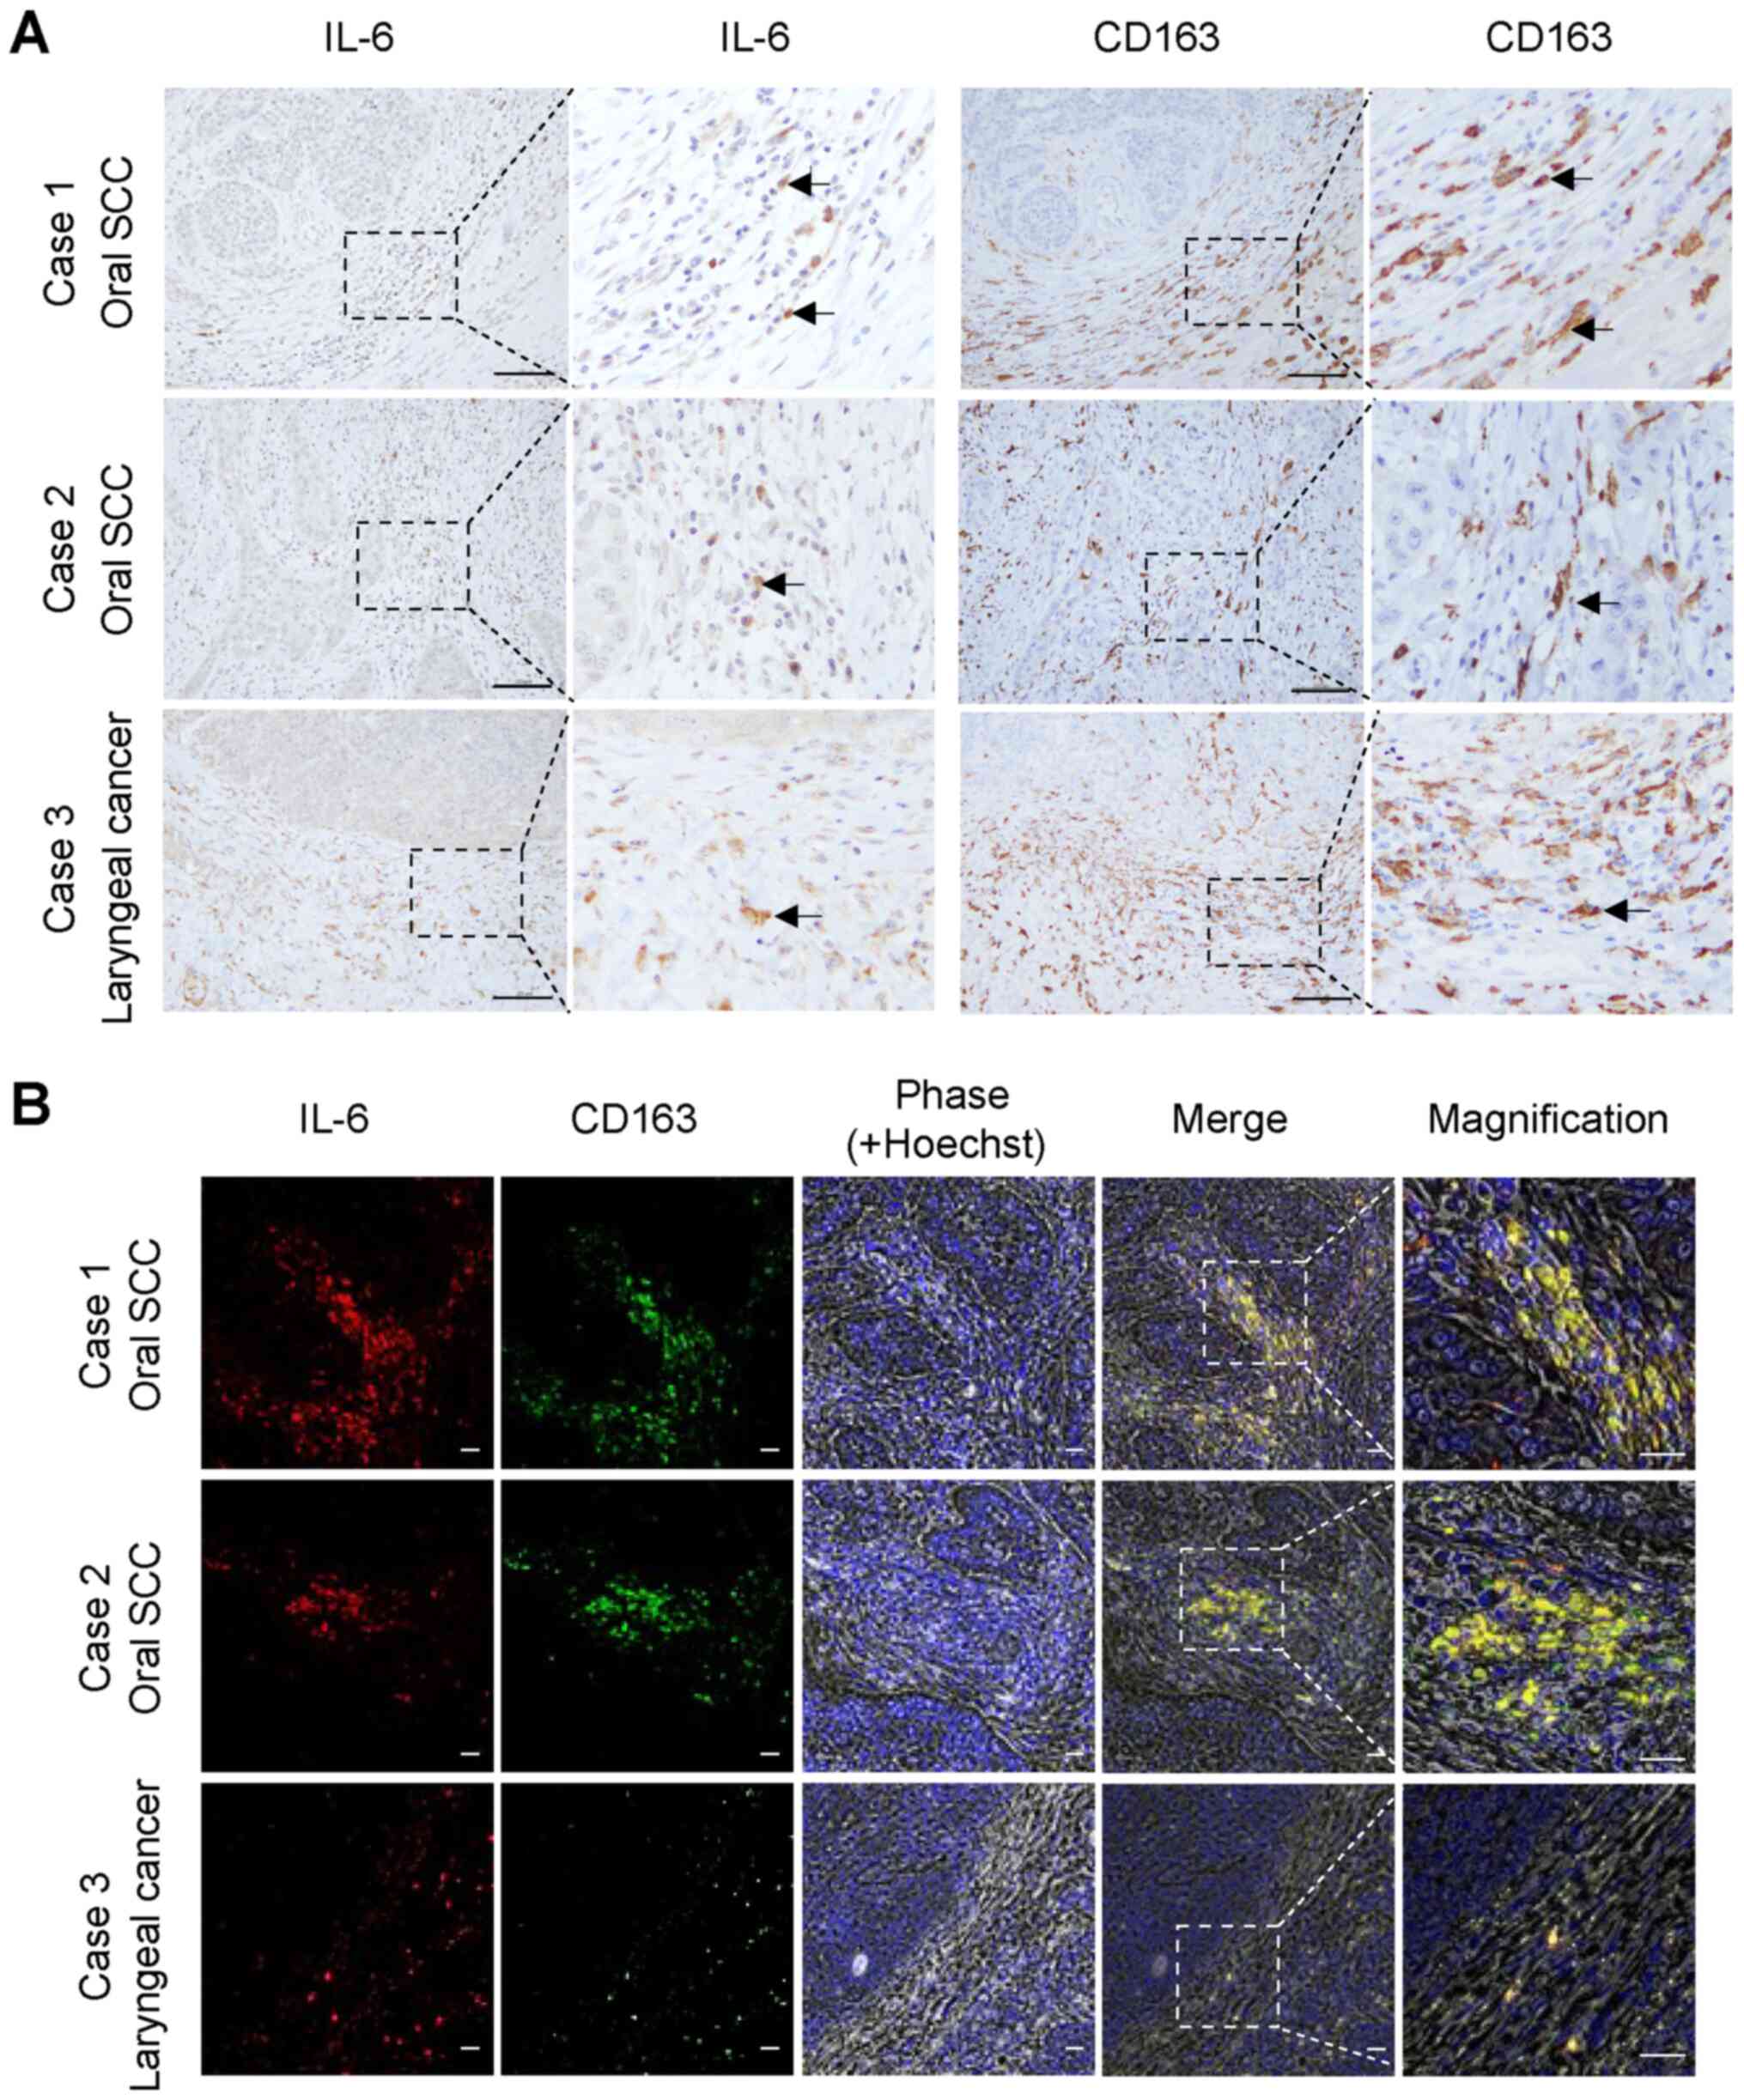
Endogenous IL-6 expression in oral and
neck SCC tissues
To identify the main source of IL-6 in the oral TME,
the in situ distribution of IL-6 expression was investigated
in tissue sections prepared from surgically resected specimens of
oral and laryngeal SCCs. IL-6 was highly expressed in the tumor
stroma and co-localized with CD163-positive M2 macrophages
(Fig. 4A, arrows). The
co-localization of IL-6 and CD163 was confirmed with
double-immunofluorescence staining (Fig. 4B). The staining patterns of IL-6
were highly similar to those of CD163 in the tumor stromal areas in
all oral SCC tissues examined. Overall, it was observed that
CD163-positive M2 macrophages in the oral TME likely secrete IL-6,
which activates oral cancer cells and increases their migratory and
invasive capabilities via the PLOD2-integrin β1 signaling axis.
Discussion
Accumulating evidence indicates that PLOD2 is highly
expressed in cancer cells, and collagen molecules that mainly
comprise the tumor ECM have been identified as its major substrate
(13,14,35). Therefore, at present, research on
PLOD2 in cancer biology has focused on the regulation of the tumor
ECM via the interaction of PLOD2 with extracellular collagens in
the TME. We recently reported that integrin β1 is an important
substrate for PLOD2 in cancer cells that plays a role in cancer
progression (23). This previous
study demonstrated that PLOD2 directly catalyzes the hydroxylation
of integrin β1, which leads to increased stability, plasma membrane
recruitment and conversion into the mature, active form of integrin
β1. Mature integrin β1 readily interacts with tumor ECM collagens,
resulting in accelerated cancer invasion and metastasis of oral SCC
cells (23). Thus, we considered
that PLOD2 facilitates cancer metastasis via two functions: Effects
on the tumor ECM in the tumor stroma and on integrin β1 in cancer
cells.
PLOD2 plays an unusual role in inducing metastasis
of cancer cells. In the present study, it was hypothesized how
PLOD2 expression is regulated in cancer cells. PLOD2 expression in
breast cancer cells is induced by hypoxic conditions or
co-cultivation with adipocytes (19,35). Based on murine Plod2
promoter analysis, HIF-1α and STAT3 transcription factors may play
an important role in the induction of PLOD2 expression (14). IL-6-mediated activation of STAT3
is required for the induction of PLOD2 in oral cancer cells
(23). Thus, the IL-6-STAT3 and
hypoxia-HIF-1α pathways may work together to induce PLOD2
expression. We are investigating this idea further.
In patients with oral SCC, IL-6 is enriched in the
oral TME and works to activate cancer cells. Thus, IL-6 may become
a potential biomarker to diagnose tumor progression (24-27). Because the IL-6-STAT3 signaling
axis in cancer cells plays a significant part in cancer progression
(34), targeting IL-6 itself or
the main source of IL-6 may be meaningful to prevent oral cancer
progression. Based on this idea, we revealed overlap of IL-6 and
CD163-positive macrophages in the stroma area of oral SCC tissues.
CD163-positive macrophages may be TAMs with the M2 phenotype, which
are closely correlated with poor prognosis in not only oral cancer,
but also a variety of other cancer types, such as glioma, breast
cancer, colorectal cancer and melanoma (36,37). The number of TAMs increases in
cases with higher grades of oral SCC (38). In particular, the M2 phenotype of
TAMs is tightly associated with the induction of several cancer
events, such as angiogenesis, growth, invasion and metastasis,
through active production and secretion of numerous cytokines and
chemokines, including IL-6. These findings combined with the
current results suggest that IL-6 is actively produced and secreted
from TAMs with the M2 phenotype that are present in the stroma area
of oral SCC. IL-6 may promote cancer invasion and metastasis by
enhancing the PLOD2-integrin β1 signaling pathway in oral SCC
cells.
We previously reported that PLOD2 signaling in oral
SCC cells is involved in collective-cell migration, which occurs
regardless of the expression state of E-cadherin or Snail (23). PLOD2 may also promote EMT in
glioma (25). Because of the
multiple mechanisms involved in cellular migration and invasion due
to tumor heterogeneity and cancer cell plasticity (39), PLOD2 may have other substrates in
addition to collagens and integrin β1. Further studies of PLOD2
that include comprehensive identification of PLOD2 substrates and
binding partners will increase our understanding of cancer invasion
and metastasis, as well as the signaling crosstalk between the
tumor and tumor stroma.
Supplementary Data
Availability of data and materials
The datasets used and/or analyzed in the present
study are available from the corresponding author on reasonable
request.
Authors' contributions
KS designed the outline of the study. KS, AM, IWS
and YY conducted the experiments and contributed to data
interpretation and manuscript preparation. KS and AM confirmed the
authenticity of all the raw data. KS wrote the manuscript. MS and
EK supervised the study and contributed to data interpretation and
manuscript preparation/revision. All authors read and approved the
final version of this manuscript.
Ethics approval and consent to
participate
The use of patient-derived tissues was approved by
the ethics committees of Niigata University Graduate School of
Medical and Dental Sciences (approval no. 2019-0173). Consent was
not obtained from each patient, however the patients were notified
of the details of the study by opt-out consent and have the right
to refuse participation in the study. This is a method widely used
in Japan. All study procedures adhered to the principles of the
Declaration of Helsinki.
Patient consent for publication
Not applicable.
Competing interests
The authors declare that they have no competing
interests.
Acknowledgments
We would like to thank Dr Homma and Dr Kawasaki
(Niigata Cancer Center Hospital, Niigata, Japan) and Dr Ueki
(Department of Otolaryngology, Head and Neck Surgery, Niigata
University, Niigata, Japan) for providing the pathological findings
for the grade origin and local invasiveness of oral squamous cell
carcinoma.
Funding
This work was supported by Niigata Medical Association (Yujin
Memorial Grant for 2020).
References
|
1
|
Bettendorf O, Piffkò J and Bànkfalvi A:
Prognostic and predictive factors in oral squamous cell cancer:
Important tools for planning individual therapy? Oral Oncol.
40:110–119. 2004. View Article : Google Scholar
|
|
2
|
Fong D, Spizzo G, Gostner JM, Gastl G,
Moser P, Krammel C, Gerhard S, Rasse M and Laimer K: TROP2: A novel
prognostic marker in squamous cell carcinoma of the oral cavity.
Mod Pathol. 21:186–191. 2008. View Article : Google Scholar
|
|
3
|
Markolovic S, Wilkins SE and Schofield CJ:
Protein hydroxylation Catalyzed by 2-oxoglutarate-dependent
oxygenases. J Biol Chem. 290:20712–20722. 2015. View Article : Google Scholar : PubMed/NCBI
|
|
4
|
Ploumakis A and Coleman ML: OH, the places
you'll go! hydroxylation, gene expression, and cancer. Mol Cell.
58:729–741. 2015. View Article : Google Scholar : PubMed/NCBI
|
|
5
|
Klose RJ, Kallin EM and Zhang Y:
JmjC-domain-containing proteins and histone demethylation. Nat Rev
Genet. 7:715–727. 2006. View
Article : Google Scholar : PubMed/NCBI
|
|
6
|
Gilkes DM, Chaturvedi P, Bajpai S, Wong
CC, Wei H, Pitcairn S, Hubbi ME, Wirtz D and Semenza GL: Collagen
prolyl hydroxylases are essential for breast cancer metastasis.
Cancer Res. 73:3285–3296. 2013. View Article : Google Scholar : PubMed/NCBI
|
|
7
|
Myllyharju J: Prolyl 4-hydroxylases, the
key enzymes of collagen biosynthesis. Matrix Biol. 22:15–24. 2003.
View Article : Google Scholar : PubMed/NCBI
|
|
8
|
Lee KA, Lynd JD, O'Reilly S, Kiupel M,
McCormick JJ and LaPres JJ: The biphasic role of the
hypoxia-inducible factor prolyl-4-hydroxylase, PHD2, in modulating
tumor-forming potential. Mol Cancer Res. 6:829–842. 2008.
View Article : Google Scholar
|
|
9
|
Epstein AC, Gleadle JM, McNeill LA,
Hewitson KS, O'Rourke J, Mole DR, Mukherji M, Metzen E, Wilson MI,
Dhanda A, et al: C. elegans EGL-9 and mammalian homologs define a
family of dioxygenases that regulate HIF by prolyl hydroxylation.
Cell. 107:43–54. 2001. View Article : Google Scholar : PubMed/NCBI
|
|
10
|
Bruick RK and McKnight SL: A conserved
family of prolyl-4-hydroxylases that modify HIF. Science.
294:1337–1340. 2001. View Article : Google Scholar : PubMed/NCBI
|
|
11
|
Højfeldt JW, Agger K and Helin K: Histone
lysine demethylases as targets for anticancer therapy. Nat Rev Drug
Discov. 12:917–930. 2013. View
Article : Google Scholar : PubMed/NCBI
|
|
12
|
Black JC, Manning AL, Van Rechem C, Kim J,
Ladd B, Cho J, Pineda CM, Murphy N, Daniels DL, Montagna C, et al:
KDM4A lysine demethylase induces site-specific copy gain and
rereplication of regions amplified in tumors. Cell. 154:541–555.
2013. View Article : Google Scholar : PubMed/NCBI
|
|
13
|
Takaluoma K, Lantto J and Myllyharju J:
Lysyl hydroxylase 2 is a specific telopeptide hydroxylase, while
all three isoenzymes hydroxylate collagenous sequences. Matrix
Biol. 26:396–403. 2007. View Article : Google Scholar : PubMed/NCBI
|
|
14
|
Chen Y, Terajima M, Yang Y, Sun L, Ahn YH,
Pankova D, Puperi DS, Watanabe T, Kim MP, Blackmon SH, et al: Lysyl
hydroxylase 2 induces a collagen cross-link switch in tumor stroma.
J Clin Invest. 125:1147–1162. 2015. View
Article : Google Scholar : PubMed/NCBI
|
|
15
|
Gilkes DM, Bajpai S, Wong CC, Chaturvedi
P, Hubbi ME, Wirtz D and Semenza GL: Procollagen lysyl hydroxylase
2 is essential for hypoxia-induced breast cancer metastasis. Mol
Cancer Res. 11:456–466. 2013. View Article : Google Scholar : PubMed/NCBI
|
|
16
|
Gilkes DM, Bajpai S, Chaturvedi P, Wirtz D
and Semenza GL: Hypoxia-inducible factor 1 (HIF-1) promotes
extracellular matrix remodeling under hypoxic conditions by
inducing P4HA1, P4HA2, and PLOD2 expression in fibroblasts. J Biol
Chem. 288:10819–10829. 2013. View Article : Google Scholar : PubMed/NCBI
|
|
17
|
Gjaltema RAF, de Rond S, Rots MG and Bank
RA: Procollagen lysyl hydroxylase 2 expression is regulated by an
alternative downstream transforming growth factor b-1 activation
mechanism. J Biol Chem. 290:28465–28476. 2015. View Article : Google Scholar : PubMed/NCBI
|
|
18
|
Noda T, Yamamoto H, Takemasa I, Yamada D,
Uemura M, Wada H, Kobayashi S, Marubashi S, Eguchi H, Tanemura M,
et al: PLOD2 induced under hypoxia is a novel prognostic factor for
hepatocellular carcinoma after curative resection. Liver Int.
32:110–118. 2012. View Article : Google Scholar
|
|
19
|
He JY, Wei XH, Li SJ, Liu Y, Hu HL, Li ZZ,
Kuang XH, Wang L, Shi X, Yuan ST, et al: Adipocyte-derived IL-6 and
leptin promote breast cancer metastasis via upregulation of lysyl
hydroxylase-2 expression. Cell Commun Signal. 16:100–118. 2018.
View Article : Google Scholar : PubMed/NCBI
|
|
20
|
Levental KR, Yu H, Kass L, Lakins JN,
Egeblad M, Erler JT, Fong SF, Csiszar K, Giaccia A, Weninger W, et
al: Matrix crosslinking forces tumor progression by enhancing
integrin signaling. Cell. 139:891–906. 2009. View Article : Google Scholar : PubMed/NCBI
|
|
21
|
Li Z, Liu FY and Kirkwood KL: The
p38/MKP-1 signaling axis in oral cancer: Impact of tumor-associated
macrophages. Oral Oncol. 103:104591–104599. 2020. View Article : Google Scholar : PubMed/NCBI
|
|
22
|
Solinas G, Germano G, Mantovani A and
Allavena P: Tumor-associated macrophages (TAM) as major players of
the cancer-related inflammation. J Leukoc Biol. 86:1065–1073. 2009.
View Article : Google Scholar : PubMed/NCBI
|
|
23
|
Ueki Y, Saito K, Iioka H, Sakamoto I,
Kanda Y, Sakaguchi M, Horii A and Kondo E: PLOD2 Is Essential to
functional activation of integrin β1 for invasion/metastasis in
head and neck squamous cell carcinomas. iScience. 23:1008502020.
View Article : Google Scholar
|
|
24
|
St John MA, Li Y, Zhou X, Denny P, Ho CM,
Montemagno C, Shi W, Qi F, Wu B, Sinha U, et al: Interleukin 6 and
interleukin 8 as potential biomarkers for oral cavity and
oropharyngeal squamous cell carcinoma. Arch Otolaryngol Head Neck
Surg. 130:929–935. 2004. View Article : Google Scholar : PubMed/NCBI
|
|
25
|
Malhotra R, Patel V, Vaqué JP, Gutkind JS
and Rusling JF: Ultrasensitive electrochemical immunosensor for
oral cancer biomarker IL-6 using carbon nanotube forest electrodes
and multilabel amplification. Anal Chem. 82:3118–3123. 2010.
View Article : Google Scholar : PubMed/NCBI
|
|
26
|
Ferreira FO, Ribeiro FL, Batista AC, Leles
CR, de Cássia Gonçalves Alencar R and Silva TA: Association of CCL2
with lymph node metastasis and macrophage infiltration in oral
cavity and lip squamous cell carcinoma. Tumour Biol. 29:114–121.
2008. View Article : Google Scholar : PubMed/NCBI
|
|
27
|
Sriuranpong V, Park JI, Amornphimoltham P,
Patel V, Nelkin BD and Gutkind JS: Epidermal growth factor
receptor-independent constitutive activation of STAT3 in head and
neck squamous cell carcinoma is mediated by the autocrine/paracrine
stimulation of the interleukin 6/gp130 cytokine system. Cancer Res.
63:2948–2956. 2003.PubMed/NCBI
|
|
28
|
Tanabe H, Takada Y, Minegishi D, Kurematsu
M, Masui T and Mizusawa H: Cell line individualization by STR
multiplex system in the cell bank found cross contamination between
ECV304 and EJ-1/T24. Tissue Cult Res Commun. 18:329–338. 1999.
|
|
29
|
Zhao M, Sano D, Pickering CR, Jasser SA,
Henderson YC, Clayman GL, Sturgis EM, Ow TJ, Lotan R, Carey TE, et
al: Assembly and initial characterization of a panel of 85
genomically validated cell lines from diverse head and neck tumor
sites. Clin Cancer Res. 17:7248–7264. 2011. View Article : Google Scholar : PubMed/NCBI
|
|
30
|
Razidlo GL, Burton KM and McNiven MA:
Interleukin-6 promotes pancreatic cancer cell migration by rapidly
activating the small GTPase CDC42. J Biol Chem. 293:11143–11153.
2018. View Article : Google Scholar : PubMed/NCBI
|
|
31
|
Liu T, Ma H, Shi W, Duan J, Wang Y, Zhang
C, Li C, Lin J, Li S, Lv J, et al: Inhibition of STAT3 signaling
pathway by ursolic acid suppresses growth of hepatocellular
carcinoma. Int J Oncol. 51:555–562. 2017. View Article : Google Scholar : PubMed/NCBI
|
|
32
|
Misumi Y, Okamoto H, Sasaki J, Masuda N,
Ishii M, Shimokawa T, Hosomi Y, Okuma Y, Nagamata M, Ogura T, et
al: Phase I/II study of induction chemotherapy using carboplatin
plus irinotecan and sequential thoracic radiotherapy (TRT) for
elderly patients with limited-disease small-cell lung cancer
(LD-SCLC): TORG 0604. BMC Cancer. 17:377–385. 2017. View Article : Google Scholar : PubMed/NCBI
|
|
33
|
Tominaga H, Setoguchi T, Shimada H, Nagano
S, Sasaki H, Ishidou Y, Sato M, Mizuno K, Inoue H and Komiya S:
Prognostic factors in patients with skeletal-related events at
non-small-cell lung cancer diagnosis. Mol Clin Oncol. 7:897–902.
2017. View Article : Google Scholar : PubMed/NCBI
|
|
34
|
Johnson DE, O'Keefe RA and Grandis JR:
Targeting the IL-6/JAK/STAT3 signalling axis in cancer. Nat Rev
Clin Oncol. 15:234–248. 2018. View Article : Google Scholar : PubMed/NCBI
|
|
35
|
Song Y, Zheng S, Wang J, Long H, Fang L,
Wang G, Li Z, Que T, Liu Y, Li Y, et al: Hypoxia-induced PLOD2
promotes proliferation, migration and invasion via PI3K/Akt
signaling in glioma. Oncotarget. 8:41947–41962. 2017. View Article : Google Scholar : PubMed/NCBI
|
|
36
|
Hu Y, He MY, Zhu LF, Yang CC, Zhou ML,
Wang Q, Zhang W, Zheng YY, Wang DM, Xu ZQ, et al: Tumor-associated
macrophages correlate with the clinicopathological features and
poor outcomes via inducing epithelial to mesenchymal transition in
oral squamous cell carcinoma. J Exp Clin Cancer Res. 35:12–30.
2016. View Article : Google Scholar : PubMed/NCBI
|
|
37
|
Komohara Y, Jinushi M and Takeya M:
Clinical significance of macrophage heterogeneity in human
malignant tumors. Cancer Sci. 105:1–8. 2014. View Article : Google Scholar
|
|
38
|
Mori K, Hiroi M, Shimada J and Ohmori Y:
Infiltration of m2 tumor-associated macrophages in oral squamous
cell carcinoma correlates with tumor malignancy. Cancers (Basel).
3:3726–3739. 2011. View Article : Google Scholar
|
|
39
|
Pastushenko I, Brisebarre A, Sifrim A,
Fioramonti M, Revenco T, Boumahdi S, Van Keymeulen A, Brown D,
Moers V, Lemaire S, et al: Identification of the tumour transition
states occurring during EMT. Nature. 556:463–468. 2018. View Article : Google Scholar : PubMed/NCBI
|