Introduction
Mechanistic target of Rapamycin (mTOR; also known as
Mammalian Target of Rapamycin) is a 289 kDa serine-threonine
protein kinase that belongs to the phosphoinositide
3-kinase-related kinase (PI3K) family with homologs in all
eukaryotes (1,2). mTOR forms two distinct multiprotein
complexes, mTOR complex (mTORC)1 and mTORC2, which exert control on
cell growth, mRNA translation, differentiation, apoptosis,
autophagy, motility and metabolism (2-5).
mTORC1 and mTORC2 are each characterized by discrete binding
partners to render distinct functions. The mTOR complex 1 (mTORC1)
consists of Rapamycin-sensitive adapter protein of mTOR (Raptor),
and LST8 (6). As a crucial
regulator of cellular metabolism, mTORC1 induces protein and lipid
synthesis as well as cell growth. mTORC1 regulates protein
translation through activation of p70 S6 Kinase (p70 S6K) leading
to enhanced RNA translation via S6 ribosomal protein and inhibition
of eukaryotic initiation factor 4E binding protein (4E-BP1)
(7,8). The phosphorylation of 4E-BP1 and
S6K1 has been shown to control several functions including mRNA
translation, growth and proliferation (9,10).
Furthermore, activation of S6K1 is known to play a role in the
inhibition of the insulin-signaling pathway (9). Such feedback is intercepted
following acute inhibition of mTORC1, and results in activation of
Insulin Receptor Substrate (IRS) and subsequent recruitment of PI3K
to the cell membrane. Moreover, hyperactivation of mTOR signaling
can also be achieved by genetic alterations in several signaling
components due to mutation or chromosomal deletion. Some of these
include phosphatase and tensin homologue (PTEN), tuberous sclerosis
1/2 (TSC1/2), neurofibromin 1/2, or oncogenic mutations in KRAS,
PIK3CA or V-akt murine thymoma viral oncogene homolog (AKT).
Studies have shown that mTORC1 phosphorylates UNC-51-like kinase 1
(ULK1) to regulate autophagy (11).
Proline rich AKT substrate of 40 kDa (PRAS40), a
substrate for AKT that functions at the juncture of the AKT and
mTOR mediated signaling pathways, serves as a component as well as
substrate of mTORC1 (12).
Regulation of PRAS40 and its interaction with mTORC1 is considered
a complex process. Activation of PI3K phosphorylates
PIP2 to form PIP3. PIP3 then binds
to the pleckstrin homology domains of phosphoinositide-dependent
kinase 1(PDK1)/AKT to mediate the phosphorylation of
AKTThr308. The phosphorylation of AKTSer473
however, is facilitated by the activation of mTORC2, which in turn
can phosphorylate Thr246 on PRAS40. Activation of mTORC1 is
achieved via AKT, which inhibits the TSC1/TSC2 complex, resulting
in increased GTP-bound Rheb levels. Activated mTORC1 phosphorylates
PRAS40, which then dissociates the mTORC1 complex by detaching
itself from mTORC1; this way, PRAS40 exerts its negative influence
on this complex (12).
Conversely, PRAS40 phosphorylation on Ser183 is regulated by
several stimuli that control the activation of mTORC1 (12). Thus, PRAS40, a substrate of AKT,
remains an integral part of mTORC1 in addition to being its
substrate.
Components of mTORC2 include rapamycin-insensitive
companion of mTOR (Rictor), along with stress-activated protein
kinase-interacting protein 1 and protein-binding Rictor, amongst
others (5,13-15). The role of mTORC2 primarily
involves reorganization of the cytoskeletal structure and cell
survival governed by AKT (5). AKT
and members of the serine/threonine-protein kinase family are the
key substrates of mTORC2. The physiological roles of mTORC2
consists of regulation of various cellular functions including
metabolism and motility (16).
Activation of mTORC2 is mediated by growth factor stimulation;
however, ribosomal association has also been linked with activation
of this complex (7,13).
Glioblastoma (GB) is uniformly a fatal primary brain
tumor in humans. The incidence of GB is ~10,000 cases/year in the
United States (17). The
relatively recent development of a classification system by The
Cancer Genome Atlas (TCGA) network identifies GB into four subtypes
(proneural, neural, classical and mesenchymal transcriptomic),
based on specific genetic alterations (18-21). The signal transduction cascade of
epidermal growth factor receptor (EGFR) is frequently altered in
these tumors (19). In fact,
according to studies performed using extensive genomic analyses of
human GB samples, genetic alterations of the EGFR are seen in ~57%
of patients (20). Furthermore,
mutations in the tumor suppressing protein phosphatase and tensin
homolog (PTEN) were observed in ~36% of GB tumors (19). The activation of PI3K, which leads
to stimulation of downstream AKT/mTOR, is most often achieved via
abnormal EGFR signaling as well as loss of PTEN. Further genetic
studies using TCGA Network demonstrated that in 206 GBs samples,
86% displayed activation of Receptor Tyrosine Kinase/PI3K, which
acts in opposition to PTEN. Consequently, loss of PTEN resulted in
an increase in the activation of the AKT/mTOR pathway (19). Increased activity of the AKT/mTOR
pathway has been shown to promote cellular growth, proliferation,
survival and migration, which are the major hallmarks of GB cells
(7). Aberrant mTOR signaling is
shown to occur in GB, which is the main cause of its characteristic
relentless growth and dissemination (21-23).
Several current clinical trials for patients with GB
include mTOR inhibitors. This suppression of mTOR activity is
achieved by rapamycin (sirolimus) and rapalogues, including RAD001
(everolimus) and CCI-779 (temsirolimus), through an allosteric
mechanism. Structurally, the allosteric site remains at a distance
from the ATP binding catalytic site (23). These inhibitors specifically
inhibit mTORC1 by forming complexes with Binding Protein 12
(FKBP12), which binds to the FK506-rapamycin binding (FRB) domain
of mTOR (6,24). The major disadvantage of
persistent treatment with rapamycin and other related compounds, is
that it leads to suppression of mTORC1, activity which then results
in suppression of S6K levels. Low levels of S6K then break a
negative feedback loop, which leads to activation of IRS, causing
sustained activation of PI3K/AKT and Ras/MEK/ERK signaling
pathways, resulting in tenacious tumor growth and spread (14,25).
In previous years, novel small ATP binding site
molecules that directly inhibit mTOR have been identified (26). These second-generation mTOR kinase
inhibitors (TORKi) function through allosteric interactions with
the ATP-binding pocket of mTOR kinase (26,27). Additionally, ATP-binding
compounds, such as pyrazolopyrimidines, have been shown to inhibit
mTOR over PI3K. Various compounds, such as, AZD 3147, KU0063794,
eCF309 and PP242, are ATP-competitive inhibitors of mTOR, which
prompt potent inhibition of mTORC1 and mTORC2 (26,27). Torin1 is an ATP-competitive mTOR
inhibitor of the quinoline class, which inhibits phosphorylation of
both mTORC1 and mTORC2 (28,29). However, it is metabolized quickly
by the liver with a relatively shorter half-life and poor
bioavailability, and it is also insoluble in water. Therefore,
Torin2 was created by Liu et al (30), which displayed a longer half-life
and improved water-solubility with better oral bioavailability.
Furthermore, Torin2 has been shown to be a selective and potent
inhibitor of mTOR (30). The more
recently discovered compound XL388, which is a direct mTOR
inhibitor of the benzoxazepine class, targets similar ATP-binding
sites as that of Torin1 and Torin2. The benefits of this drug
include selectivity of mTOR over PI3K, its oral bioavailability and
effectiveness at low concentrations (31). In the present study, the efficacy
of these three potent and selective inhibitors of mTORC1 and
mTORC2, namely, Torin1, Torin2 and XL388 were assessed and
compared.
Materials and methods
Cell lines and cell culture
The GB cell line LN-18 was purchased from ATCC, and
was used to examine the effects of ATP-competitive binding
inhibitors Torin1 (tricyclic benzonaphthyridinone inhibitor),
Torin2
(9-(6-Amino-3-pyridinyl)-1-[3-(trifluoromethyl)phenyl]-benzo[h]-1,6-naphthyridin-2(1H)-one)
and XL388
([7-(6-Amino-3-pyridinyl)-2,3-dihydro-1,4-benzoxazepin-4(5H)-yl][3-fluoro-2-methyl-4-(methylsulfonyl)
phenyl]-methanone)], all of which were purchased from Tocris
Bioscience. Their efficacy in suppressing the mTOR pathway, and
thereby inhibiting cell growth and migration was assessed
specifically. Genetically, a p53 mutation on codon 238 converting
TGT (Cys) to TCT (Ser) is present in the LN-18 cell line and the
status of PTEN is wild-type. LN18 cells were maintained in DMEM
(Invitrogen; Thermo Fisher Scientific, Inc.) supplemented with 10%
(Invitrogen; Thermo Fisher Scientific, Inc.) FBS and 1%
penicillin/streptomycin/amphotericin (Invitrogen; Thermo Fisher
Scientific, Inc.) at 37°C in a humidified incubator with 5%
CO2.
Western blotting
Serum starved cells were treated with 100, 500,
1,000, 1,500 or 2,000 nM Torin1, Torin2 or XL388. The concentration
of these compounds used were determined based on Feldman et
al (26). Control LN18 cells
were treated with the vehicle (DMSO). Whole cell lysis buffer
prepared using 1% Triton X-100, 10 mM Tris-HCl, pH 7.5, 150 mM NaCl
and 5 mM EDTA supplemented with 1% phosphatase and protease
inhibitors (Sigma-Aldrich; Merck KGaA) and 0.1 mM
phenylmethylsulphonyl fluoride was used to extract proteins from
cells. A colorimetric method was used to determine the
concentrations of protein using the improved Lowry method (Bio-Rad
Laboratories, Inc.). A total of 50 µg protein per lane was
loaded on 10% gels and resolved by SDS-PAGE.
Subsequently, resolved proteins were
electrotransferred onto nitrocellulose membranes, and membranes
were blocked with 5% non-fat milk in 0.1% Tween, Tris-HCl (pH 7.8)
for 1 h at room temperature on a rocker. Next, the blots were
incubated overnight at 4°C with primary antibodies at a dilution of
1:1,000 in 5% BSA for detection of phosphorylated proteins or 5%
milk for detection of non-phosphorylated proteins. Phosphorylated
and total S6 (cat. nos. #4858 and #2217, respectively), 4E-BP (cat.
nos. #2855 and #9452, respectively), PRAS40 (cat. nos. #2997 and
#2691, respectively) and AKT (cat. nos. #4060 and #12620) (Cell
Signaling Technology, Inc.) were used in the present study. Bands
were detected by chemiluminescence using Pierce ECL Western
Blotting Substrate (Thermo Fisher Scientific, Inc.). Blots were
stripped with a stripping solution (Merck KGaA) and re-probed with
their respective total antibodies, which was used as a loading
control. ImageJ (version 1.52; National Institutes of Health) was
used for densitometry analysis, and density was normalized to the
respective density of the loading control. Experiments were
repeated three times.
Cell viability
Cell viability was measured using an MTT assay
according to the manufacturer's protocol (United Chemicon, Inc.).
Cells (~3×10³ cells/well) were seeded onto a 96-well
plate. Quiescence was induced by culturing cells in serum free
media for 24 h prior to performing the assay. Torin1, Torin2 and
XL388 (300 and 1,000 nM) was given to cells in serum-free media for
24 h. Cell proliferation was performed by separately averaging the
two lowest concentrations, which were 300 and 1,000 nM of Torin 1
and Torin 2, to observe the effects of low and high concentrations.
After completion of treatment, fresh media (90 µl) with MTT
(10 µl) reagent/well was added and plates were incubated at
37°C for 4 h. The reaction was stopped by adding DMSO and
absorbance at 595 and 630 nm was measured using a Multiskan™ FC
Microplate Reader (Thermo Fisher Scientific, Inc.).
S-phase entry analysis using an EdU
incorporation assay
Cell cycle analysis was performed using a Click-iT
EdU Imaging kit (Invitrogen; Thermo Fisher Scientific, Inc.).
Briefly, serum starved cells were treated with regular media,
starved media, or media containing one of the following
platelet-derived growth factor (PDGF; Sigma-Aldrich; Merck KGaA; 5
ng/ml), Torin1 (500 nM), Torin2 (500 nM), and XL388 (500 nM) for 4
h, and thereafter, 10 µM EdU was added and cells were
incubated for a further 4 h. Following termination of experiments,
cells were fixed in 4% paraformaldehyde for 15 min at room
temperature and permeabilized for 15 min in 0.1% Triton X-100 in
PBS. The incorporation of EdU was performed by incubation with a
reaction cocktail (provided in kit) containing Alexa 488-Click-iT
at room temperature for 30 min. S-phase cell cycle entry was
assessed by reporting the signal intensity of Alexa 488. DAPI
staining was performed using VECTASHIELD® Vibrance™
Antifade Mounting Medium with DAPI (Vector Laboratories, Inc.). The
degree maps of the cell proliferation were generated from
fluorescence images using a fluorescence microscope (Axiovert 200;
Carl Zeiss, AG) (magnification, ×10) and AxioVision software 4.7.2
Carl Zeiss microImaging GmbH Carl Zeiss, AG and analyzed using
ImageJ. The number of Alexa 488 (green) labelled cells are
presented as a percentage of the DAPI labelled cells (blue) to
define entry into S-phase. Slides were kept stored at -20°C.
Scratch migration
Cells were plated until they reached 100%
confluence. Cells were next serum starved for 24 h, after which the
monolayer of cells was scratched using a pipette tip, and the cells
were treated with Torin1, Torin2 and XL388. Migration assays were
performed using a lower concentration of 50 nM, in addition to 300
and 1,000 nM of each drug, to detect the dose-dependent effects of
these drugs on glioblastoma cell migration. Migration was measured
0, 1, 2 and 3 days after scratching using AxioVision and analyzed
using ImageJ.
Drug resistance assay
The GB cells were treated with Torin1, Torin2, XL388
and Rapamycin (500 nM) for 5 days, after which media was removed
and drug-free media was added for 24 h. Next media supplemented
with drugs was added for a further 5 days. This process was
continued for 4-5 cycles, until week 5. Images were taken at the
beginning and end of the experimental period using AxioVision and
analyzed using ImageJ.
Statistical analysis
Statistically significant differences between
multiple treatment groups in all experiments was determined using a
one-way ANOVA followed by a post-hoc Tukey's test in STATA
(StataCorp LP version 16.1), and plotted using Microsoft PowerPoint
(Microsoft Office 365; Microsoft Corporation) and Adobe Photoshop
(Creative Suite 4; Adobe Systems, Inc.). P<0.05 was considered
to indicate a statistically significant difference. Data are
presented as the means ± the standard error of the mean and graphs
were plotted using Microsoft PowerPoint and Adobe Pro DC 2021.
Results
Effect of Torin1, Torin2 and XL388 in
targeting mTORC1 and mTORC2 in GB cells
To investigate the effect of the novel TORKis in
suppressing the mTOR pathway, GB cells were treated to 100, 500,
1,000, 1,500 and 2,000 nM Torin1, Torin2 and XL388, and the levels
of activation of mTORC1 substrates, S6, 4E-BP1, mTORC2 substrate
and AKT were assessed. The results demonstrated that S6
phosphorylation at serine 235/236 was modestly suppressed by Torin1
at all doses assessed, with the least suppression observed at the
lowest dose of 100 nM, whereas doses in the 500-2,000 nM range
exhibited similar suppression of phosphorylation of S6; expression
of total S6 remained constant in all treatments, including vehicle
treated controls. Torin2 treated cells showed a dose-dependent
suppression of phosphorylation of S6 with complete
dephosphorylation of S6 at concentrations of 1,500 and 2,000 nM.
Densitometry analysis confirmed these findings revealing the
highest level of phosphorylation at 100 nM with significant
suppression at doses of 500 and 1,000 nM (P<0.05), and complete
inhibition at 1,500 and 2,000 nM (P<0.05) (Fig. 1A). To investigate whether these
TORKis also suppressed the activation of mTORC2, the effects of
treatment on phosphorylation of the mTORC2 substrate, AKT serine
473 were assessed. Torin1 and Torin2 exhibited complete
dephosphorylation of AKT at all doses, suggesting that these
compounds effectively and completely suppressed mTORC2 activity.
Total AKT expression, confirmed equal loading of protein in all
treatments (Fig. 1A, bottom
panel). The phosphorylation of 4E-BP1, a downstream substrate of
mTORC1 that regulates protein translation, following treatment with
Torin1 and Torin2, was also studied. Torin1 reduced phosphorylation
of 4E-BP1 at 100 nM (P<0.05), whereas complete dephosphorylation
was observed at doses ≥500 nM (P<0.05). Phosphorylation of
4E-BP1 was also suppressed by Torin2 at 100 nM (P<0.05), but to
a greater extent than Torin1. Torin2 also completely suppressed
phosphorylation at all doses >500nM (P<0.05). The intensity
of phosphorylated proteins was calculated by densitometry analysis,
measuring the phosphorylated 4E-BP1 serine 37/46 as a ratio of
total 4E-BP1. Expression of total 4E-BP1 remained constant in all
treatments including vehicle treated cells (Fig. 1B). The levels of activation of
pPRAS40 threonine 246, a substrate of AKT serine 473, that
regulates mTORC1 activation via binding to Raptor was assessed.
Torin1 significantly suppressed the phosphorylation of PRAS40 at
all doses, as seen by the densitometry analysis of phosphorylated
PRAS40 threonine 246 in relation to total PRAS40 (P<0.05).
Similarly, Torin2 suppressed the phosphorylation of PRAS40 at 100
nM, and completely abolished the phosphorylation at doses >500
nM, as evident by the expression and densitometry analysis of
phosphorylated PRAS40 threonine 246 relative to total PRAS40
(Fig. 1C; P<0.05). Next, the
effects of the novel compound XL388, a highly potent and selective
ATP-competitive binding inhibitor of mTOR, on the activation of
PRAS40 were assessed. Complete inhibition of phosphorylation of
PRAS40 at threonine 246 occurred only at the higher doses of 1,500
and 2,000 nM. Moderate suppression was observed at 1,000 nM,
whereas no change in the levels of PRAS40 phosphorylation were seen
at 100 and 500 nM. Total PRAS40 expression was equal at all
treatment doses. Densitometry analysis of pPRAS40 threonine 246
over total PRAS40 demonstrated the levels of phosphorylation as
shown by the bar graphs (Fig.
1C).
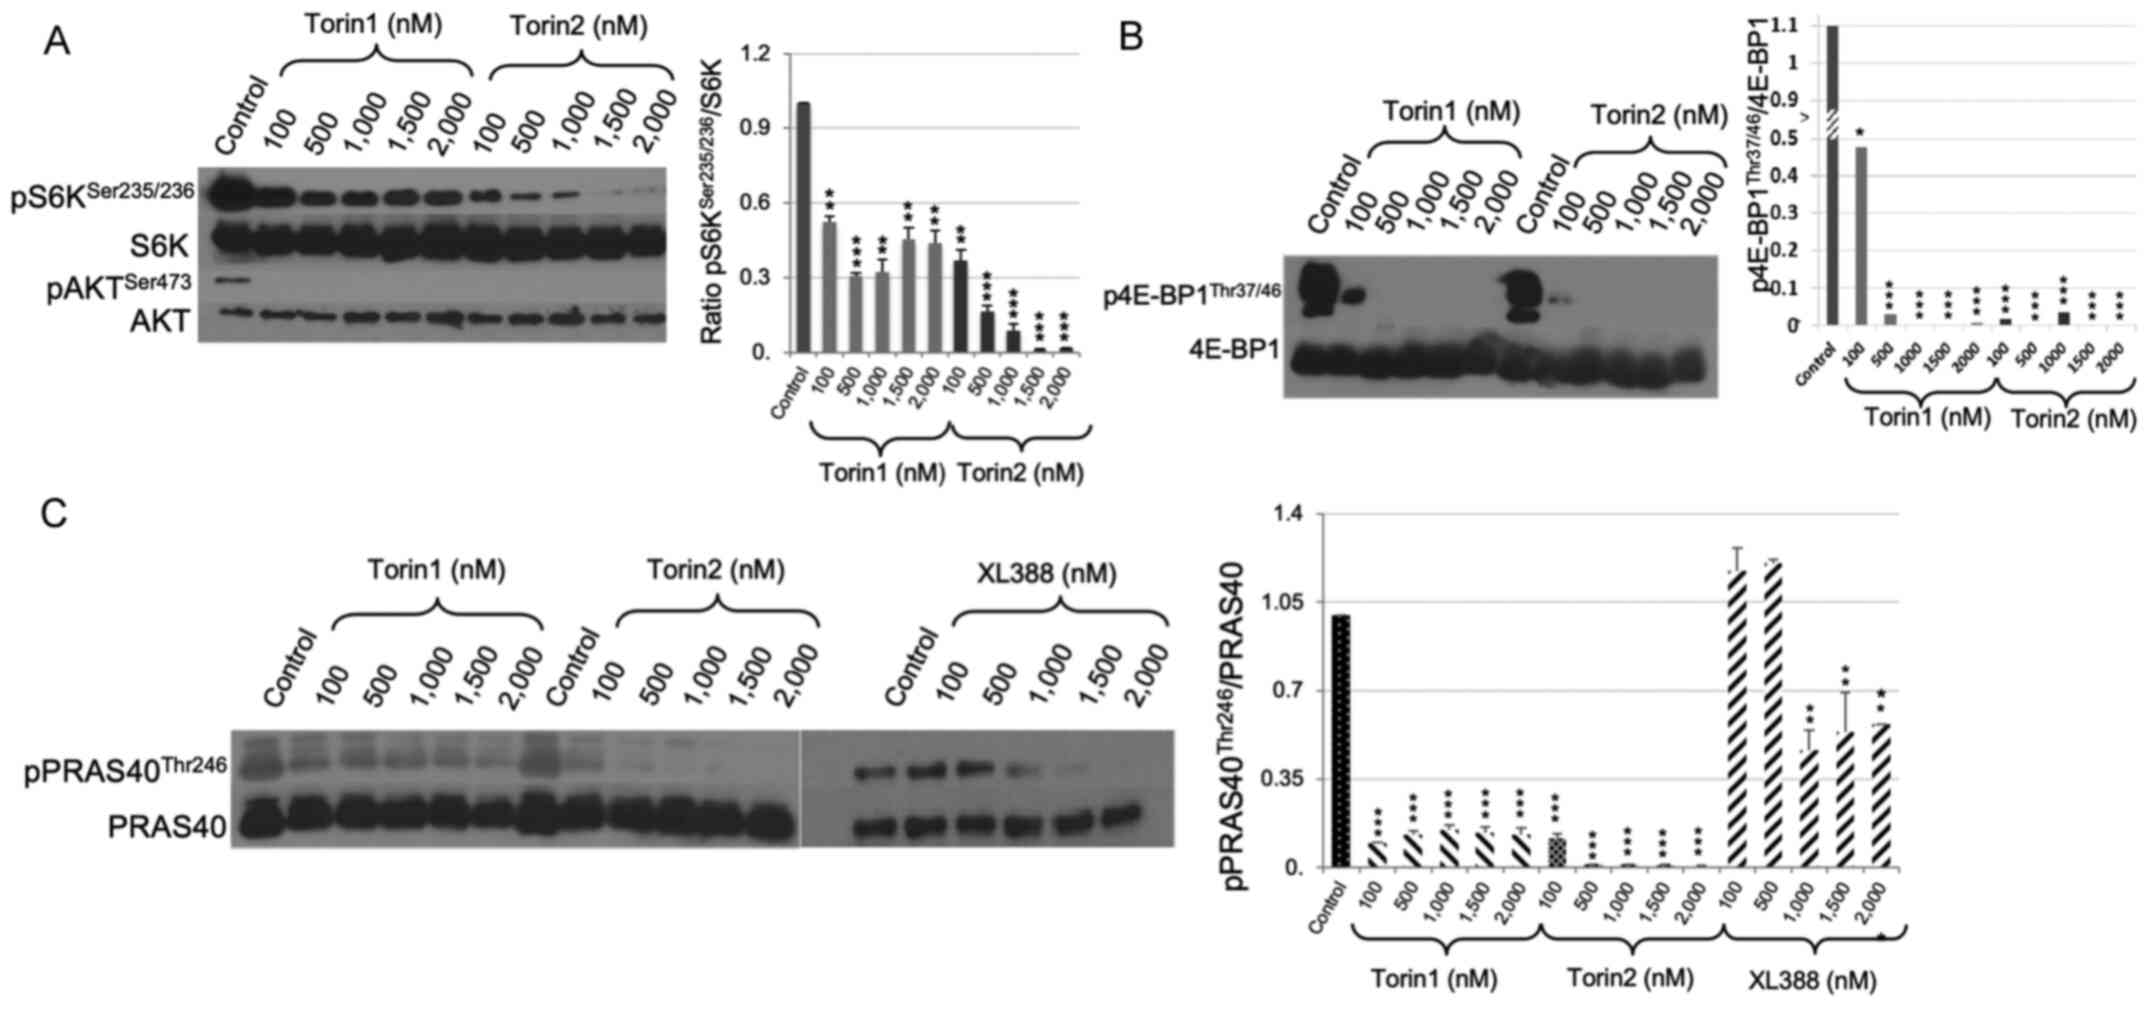 | Figure 1Effect of Torin1, Torin2 and XL388 on
mTORC1 and mTORC2. (A) Western blot analysis of downstream targets
of mTORC1 and mTORC2, including p-S6KSer235/236, total
S6K, and p-AKTSer473. GB cells were treated with 100,
500, 1,000, 1,500 or 2,000 nM Torin1 or Torin2 for 24 h. A
dose-dependent suppression of S6K phosphorylation by Torin1 and
Torin2 was seen. Densitometry analysis of
p-S6KSer235/236 relative to total S6K expression (Right
panel). Phosphorylation of AKTSer473 was totally
abolished by treatment with Torin1 and Torin2 at all doses
assessed. (B) Western blot analysis of downstream targets of
mTORC1, p-4EBP1Thr37/46 and total 4E-BP1, following the
treatment of GB cells with 100, 500, 1,000, 1,500 and 2,000 nM
Torin1 or Torin2 for 24 h. A dose-dependent suppression in
p-4E-BP1Thr37/46 levels was observed following treatment
with Torin1 or Torin2 as shown by densitometry analysis (Right
panel). (C) Western blot analysis of p-PRAS40Thr246 and
total PRAS40 following treatment with 100, 500, 1,000, 1,500, and
2,000 nM Torin1, Torin2 or XL388 for 24 h. Torin1 significantly
suppressed the phosphorylation of PRAS40 at all doses assessed,
whereas Torin2 reduced the phosphorylation of PRAS40 at the lowest
dose (100 nM), and completely abolished it at 500, 1,000, 1,500 and
2,000 nM. XL388 completely inhibited phosphorylation of PRAS40 only
at higher doses of 1,500 and 2,000 nM, a modest suppression was
observed at 1,000 nM, and no changes in the levels of PRAS40
phosphorylation was noted at 100 and 500 nM. Densitometry analysis
of p-PRAS40Thr246 relative to total PRAS40 confirms
these results (Right panel). Data are presented as the mean ± the
standard error of the mean. *P<0.05,
**P<0.01, ***P<0.001 vs. Control.
mTORC, mTOR, mechanistic target of rapamycin complex; S6K,
ribosomal protein S6 kinase; p-, phosphorylated-; 4E-BP1,
4E-binding protein 1; PRAS40, The proline-rich AKT substrate of 40
kDa; GB, glioblastoma. |
Effect of Torin1, Torin2 and XL388 on
cell proliferation, S-phase entry and migration in GB cells
To investigate the effect of the novel TORKi in
suppressing GB cell proliferation, the cells were subjected to two
doses (300 and 1,000 nM) of Torin1, Torin2 and XL388 for 24 h. Cell
proliferation was then subsequently measured using an MTT assay.
Cell proliferation was significantly inhibited by Torin1 and Torin2
(P<0.05) in both treatments in a dose-dependent manner.
Conversely, XL388 was able to suppress cell growth only at a higher
dose of 1,000 nM (P<0.05), though to a lesser degree when
compared with Torin1 and Torin2 (Fig.
2A).
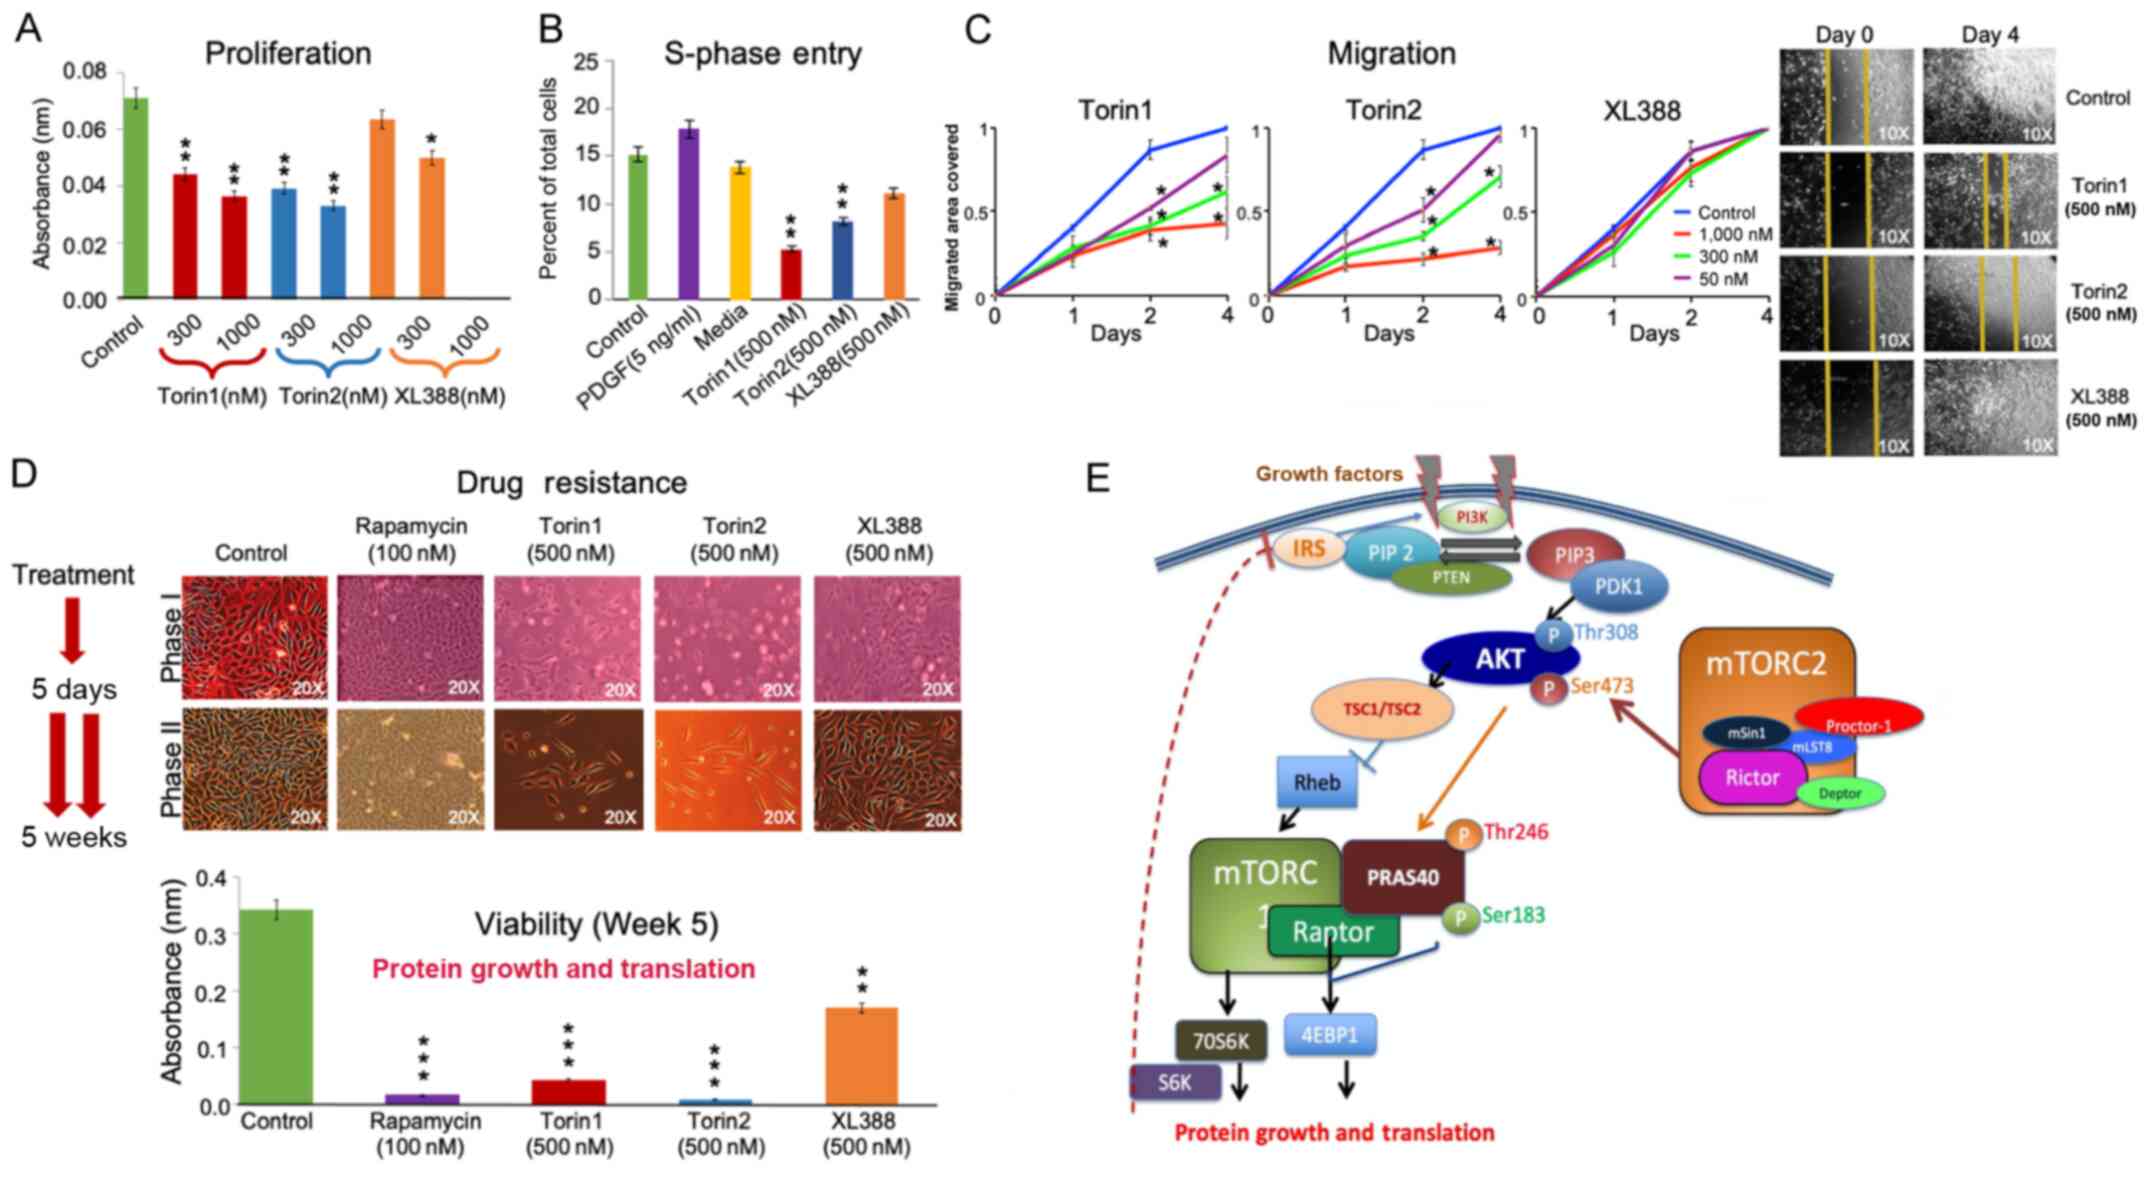 | Figure 2Effect of Torin1, Torin2 and XL388 on
cell proliferation, S-phase entry, cell migration and drug
resistance. (A) Cell proliferation was measured following treatment
of GB cells with two doses (300 and 1,000 nM) of Torin1, Torin2 or
XL388 for 24 h followed by an MTT assay. Torin1 and Torin2
significantly inhibited cell proliferation in a dose-dependent
manner. XL388 modestly suppressed cell growth only at the higher
dose of 1,000 nM. (B) S-phase entry was examined following
treatment with Torin1, Torin2 or XL388, by counting EdU-positive
cells, which represent the cells in the S-phase. Cells were also
treated with control (FBS), PDGF or serum starved media. Cells
cultured in the control media or media supplemented with PDGF
showed higher counts of EdU-positive cells. Torin1 and Torin2
inhibited S-phase entry as determined by the lower counts of
EdU-positive cells. XL388 treatment modestly reduced the counts of
EdU-positive cells. (C) Scratch wound migration analysis was
performed after treatment of cells with 50, 300 or 1,000 nM Torin1,
Torin2 or XL388 over a period of 4 days. Torin1 and Torin2
displayed a dose-dependent suppression of cell migration, where
Torin2 exhibited a more potent effect in reducing migration.
Treatment with XL388 failed to suppress GB cell migration at all
doses as compared to the controls. (D) Drug resistance was analyzed
by subjecting GB cells to multiple cycles of exposure to treatment
drugs over 5 weeks. Images showed no appreciable difference between
start and the conclusion of the experiment when cells were treated
with rapamycin, Torin1, Torin2 or XL388. Rapamycin or Torin1
treatment marginally suppressed the cell count by week 5. XL388
treatment moderately suppressed cell counts. Torin2 treatment
completely eradicated the GB cell population (Top panel).
Quantitative analysis using MTT assay revealed that rapamycin or
Torin1 treatment resulted in only 2 and 5% viable cells,
respectively. Torin2 showed almost complete obliteration of GB
cells, leaving <1% viable cells at the end of the experiment.
XL388 treated cells resulted in 15% viable cells remaining (Bottom
panel). (E) Schematic representation of mTORC1 and mTORC2 signaling
pathways depicting regulation of PRAS40 phosphorylation by AKT and
mTORC1. Activated PI3K phosphorylates PIP2 to form
PIP3. PIP3 binds to the pleckstrin homology
domains of PDK1/AKT to mediate the phosphorylation of AKT.
Phosphorylation of AKT is facilitated by activation of mTORC2.
Activated AKT then promotes the phosphorylation of PRAS40 on
Thr246. Activation of mTORC1 is achieved via AKT which inhibits the
activity of the TSC1/TSC2 complex, resulting in increased GTP-bound
Rheb levels. Activated mTORC1 then phosphorylates multiple protein
substrates, including 4E-BP1, S6K and PRAS40. Phosphorylation of
PRAS40 dissociates the mTORC1 complex by detaching it from the
complex. Phosphorylation of 4E-BP1 and S6K regulates numerous
functions including mRNA translation, growth and proliferation.
Furthermore, S6K has been linked to the inhibition of the
insulin-signaling pathway. This feedback is broken following acute
inhibition of mTORC1, leading to activation of IRS and subsequently
PI3K. PRAS40 phosphorylation on Ser183 is regulated by
several stimuli that control the activation of mTORC1. Data are
presented as the mean ± the standard error of the mean.
*P<0.05, **P<0.01,
***P<0.001 vs. Control. GB, glioblastoma; PDGF,
platelet-derived growth factor; mTORC, mTOR, mechanistic target of
rapamycin complex; p-, phosphorylated-; PRAS40, The proline-rich
AKT substrate of 40 kDa; PIP2, phosphoinositol
bisphosphate; PIP3, PIP trisphosphate; PDK1,
phosphoinositide-dependent kinase 1; S6K, ribosomal protein S6
kinase; TSC, tuberous sclerosis complex; Rictor,
rapamycin-insensitive companion of mTOR; Raptor,
rapamycin-sensitive adapter protein of mTOR; IRS, insulin receptor
substrate; Proctor, stress-activated protein kinase-interacting
protein 1 and protein-binding Rictor; mSin1, mammalian
stress-activated protein kinase-interacting protein 1; mLST8,
mammalian lethal with SEC13 protein 8; Deptor, DEP-domain
containing mTOR-interacting protein. |
Additionally, the effect of Torin1, Torin2 and XL388
on GB cell S-phase entry was assessed by analyzing cells treated
with regular media (control), PDGF and starved media, and comparing
them to cells treated with Torin1, Torin2 and XL388 (Fig. 2B). Cells given regular media
showed a baseline S-phase entry of ~15% of total cells. PDGF
treatment facilitated S-phase entry of cells, showing an increase
to 18% of total cells, whereas serum starved cells slightly halted
S-phase entry to ~14% of total cells. In cells treated with Torin1,
significant suppression of S-phase entry was observed, resulting in
only ~5% of total cells in the S-phase (P<0.05). Torin2 also
substantially inhibited S-phase entry, showing S-phase entry in ~8%
of total cells (P<0.05). Out of the three novel inhibitors,
XL388 resulted in the least suppression of S-phase entry, showing
12% of total cells in S-phase (Fig.
2B).
Cell motility was determined by using the scratch
wound migration assay. Migration patterns were analyzed in
quiescent (serum deprived) cells treated with Torin1, Torin2 or
XL388 at doses of 50, 300 and 1,000 nM. Torin1 dose-dependently
suppressed migration, showing a stepwise increase in suppression
with significant inhibition seen at the highest dose of 1,000 nM
(P<0.05). GB cells treated with Torin2 also showed an even
greater reduction in migration for 3 days at the highest dose of
1,000 nM (P<0.05). The lowest dose of Torin2 (50 nM) showed
initial suppression of migration, but that effect was largely
absent by day 3. In contrast to these effects, XL388 showed no
suppression of migration at all doses when compared to the control,
showing uninhibited migration of cells for the 3 days (Fig. 2C).
Effect of Torin1, Torin2 and XL388 on
drug resistance in GB cells
Drug resistance was analyzed by subjecting GB cells
to multiple cycles of on and off exposure to treatment drugs for
4-5 weeks. Every 5 days fresh media with inhibitors was added.
Analysis of the images showed no appreciable difference between the
start and conclusion of the experiment when cells were treated with
Rapamycin or Torin1. However, treatment with XL388 showed a greater
density of cells at the conclusion of the experiment than at the
commencement, suggesting that XL388 is susceptible to resistance by
GB cells. Treatment with Torin2 completely eradicated the tumor
cell population (Fig. 2E; top
panel). The drug's susceptibility to resistance was quantified by
the percent of viable cells at the end of the treatment regimen.
Drug resistance analysis of Rapamycin was compared with the novel
TORKis; Rapamycin did not confer resistance, abolishing the
percentage of viable cells to <2%. Torin1 significantly
suppressed cell viability, reducing the percentage of viable cells
to ~5% (P<0.05). Torin2 showed almost complete eradication of GB
cells, leaving <1% of viable cells at the end of the experiment
(P<0.05). In contrast, XL388 was less effective in reducing the
viable cell count, with >15% of viable cells remaining (Fig. 2D).
Discussion
The results of the present study clearly
demonstrated that the dual inhibitors of mTORC1 and mTORC2, Torin1
and Torin2, effectively suppressed both complexes. These inhibitors
suppressed the phosphorylation of mTORC1 substrate 4E-BP1 and
PRAS40 in a dose-dependent manner. Whereas Torin2 abolished the
phosphorylation of mTORC1 substrate 4E-BP1 and PRAS40, Torin1 and
Torin2 suppressed phosphorylation of AKTSer473. These
results also showed that the ATP-binding inhibitor XL-388 reduced
the activation of mTORC1 substrate only at higher doses. Torin1 and
Torin2 were more effective in suppressing GB cell proliferation as
well as S-phase entry. Cell migration was suppressed by Torin1 and
Torin2, but not by XL-388. Both rapamycin- and Torin1 treated cells
showed marked suppression of cell growth in drug-resistance
analyses, but Torin2 completely eradicated the GB cell populations.
GB cells showed partial drug resistance to XL388 treatment. Torin
1, Torin2 and XL388 showed highly specific inhibition of mTORC1 and
mTORC2. GB cell proliferation and migration was suppressed by
Torin2, which effectively inhibited both mTORC1 and mTORC2.
Molecular-targeted therapy has garnered increasing
attention in the treatment of GB (23,28,30). The mTOR pathway, which regulates
cell survival and cell growth, has been actively investigated as a
target for therapies in GB. Rapamycin and its chemically related
compounds (commonly known as rapalogues) are used in clinical
trials for the treatment of cancer due to their inhibitory effects
on the mTOR pathway (32).
Clinical trials using rapamycin and its analogs
(CCI-779/temsirolimus, RAD001/everolimus, AP23573 and others) have
shown promising yet challenging results in the treatment of
numerous tumors, including GB (33-35). A clinical trial of PTEN-negative
recurrent GBs were treated with rapamycin pre- and postoperatively
and demonstrated a reduction in the proliferative index after the
second surgery. As shown in Fig.
2E, increased AKT signaling due to loss of negative feedback
resulted in increased activation of PRAS40, leading to enhanced
mTORC1 activity (36). It was
shown that the activation of the AKT pathway may be the result of a
negative feedback loop produced by mTOR effector molecule S6K1,
causing phosphorylation of IRS1 (37). Inhibition of mTOR by rapamycin can
negate this negative feedback and activate AKT as seen in GB
(36), but the clinical
implications remain to be seen. Interestingly, a human trial in
patients with GB using rapamycin showed activation of AKT at the
Ser473 site, which was associated with activation of PRAS40 at
Thr246. PRAS40 was previously shown to inhibit mTOR, and this
inhibition was relieved by AKT phosphorylation (38,39). Importantly however, PRAS40
contains an mTOR signaling motif, and its overexpression can
potentially result in competition with other mTORC1 targets for
phosphorylation (40).
Rapamycin (sirolimus) and its analogs, including
RAD001 (everolimus) and CCI-779 (temsirolimus), suppress mTOR
activity through an allosteric mechanism that acts at a distinct
site away from the ATP binding catalytic site. These compounds are
partial inhibitors of downstream effectors of mTORC1, primarily
4E-BP (33-36). Additionally, use of rapalogues to
target the PI3K/AKT/mTOR-pathway resulted in development of
resistance with long-term treatment. These drugs target only mTORC1
and reactivate AKT and mTORC2, leading to the reactivation of other
oncogenic pathways (14,25). With the discovery of novel small
ATP-binding site inhibitors, it has become possible to directly
inhibit both mTORCs (26).
Additionally, several ATP-binding site inhibitors with
pyrazolopyrimidines exhibit improved selectivity of suppression of
mTOR over PI3K (15,26). Various compounds, such as AZD3147,
KU0063794, eCF309 and PP242 are ATP-competitive inhibitors of mTOR,
and they exhibit potent and selective inhibition of mTORC1 and
mTORC2 (15,26,28). These molecules are often referred
to as 'TORKi', given their ability to inhibit TOR kinase (26,28). In previous years, several small
molecules have been identified, which directly inhibit mTOR by
targeting the ATP binding site, and these include PP242, PI-103 and
NVP-BEZ235. Of these, PP242 and PP30, are the first potent and
selective ATP-competitive inhibitors of mTOR. Unlike Rapamycin,
these molecules inhibit both mTORC1 and mTORC2, and similarly in
contrast to the PI3K family of inhibitors, including LY294002,
these molecules inhibit mTOR with a higher degree of selectivity.
Notably, the mTORC1/2 inhibitor KU-0063794 was more effective than
the PI3-K inhibitor, LY294002, or the PI3-K/mTORC1 inhibitor,
PI-103, in suppressing cell cycle progression and proliferation
(22,41). In addition, using everolimus and
other rapalogues to target the PI3K/AKT/mTOR-pathway may result in
the development of drug resistance following prolonged treatment,
as these drugs only target mTORC1. Furthermore, rapamycin and other
related compounds suppress mTORC1-mediated S6K inhibition, thus
blocking a negative feedback loop and leading to activation of
PI3K/AKT and Ras/MEK/ERK signaling pathways, in-turn promoting cell
survival and growth (25). The
third generation of mTOR inhibitors, such as RapaLink-1, which was
designed by linking rapamycin to the ATP-competitive inhibitor
MLN0128, overcomes the mTOR-mutant induced resistance to the
rapalogues or TORKi (42,43). RapaLink-1 treatment effectively
overcomes resistance in MCF-7 breast cancer cells which harbor
three somatic mutations in mTOR within the FRB-FKBP1 and kinase
domain (42). RapaLink-1 potently
inhibited the mTORC1 pathway by inhibiting the phosphorylation of
4E-BP1 and thus impeded cell/tumor growth both in vitro and
in vivo (43), signifying
that RapaLink-1 may be a suitable treatment for inhibition of mTOR
pathway in GB as well (44).
Torin1 is an ATP-competitive mTOR inhibitor of the
quinoline class, which inhibits the phosphorylation of both mTORC1
and mTORC2 (26,28). However, it is metabolized quickly
by the liver and is not water-soluble. Therefore, Torin2 was
designed by Liu et al (30), with a longer half-life and
improved water-solubility for better oral bioavailability, as well
improved selectivity for mTOR over PI3K (30). Torin2 also exhibited potent
biochemical and cellular activity against the
phosphatidylinositol-3 kinase-like kinase (PIKK) family of kinases
including Ataxia-telangiectasia mutated, at a nanomolar range
(45). Torin2 was shown to have
anti-tumor activity in several tumor types (46). Torin2 inhibited growth and
metastasis of anaplastic thyroid cancer in an in vivo study
(47). A recent study comparing 3
drugs for their cytotoxicity and cell cycle inhibitory response
demonstrated that the preclinical mTOR-PIKK inhibitor, Torin2 was
highly potent, exhibiting its effects in the nanomolar range as
compared to the phase 3 PI3K p110 pan-isoform inhibitor buparlisib
and the phase 1 PI3K-mTOR inhibitor Omipalisib in triple-negative
breast cancer cells (48).
Furthermore, investigators have also found that Torin2 was
effectively cytotoxic against tumor cells and not cytotoxic to the
non-malignant cells. Pre-treatment with Torin2 enhanced the
efficacy of radiotherapy in breast cancer cells (49). Consistent with these findings, the
results of the present study showed a significant effect of both
Torin1 and Torin2 in suppressing cell growth and proliferation,
with Torin2 demonstrating a higher degree of efficacy.
Another novel dual mTOR inhibitor is XL388, a
benzoxazepine class of compound, which targets ATP-binding sites in
a similar manner to Torin1 and Torin2 (31). The major advantages of this drug
include selectivity to mTOR over PI3K, improved oral
bioavailability and improved effectiveness at lower concentrations.
It is also highly potent and selective with favorable
pharmacokinetics (31).
Furthermore, studies have revealed that XL388 effectively
suppressed cell viability and was shown to be pro-apoptotic in
renal cell carcinoma and osteosarcoma (50,51). XL388 inhibited the survival and
proliferation of renal cell carcinoma cell lines in vitro
and in vivo, and was more efficient than the typical mTORC1
inhibitors rapamycin and its analogs (51). In the present study however, XL388
remained ineffective, as it modestly suppressed cell proliferation
only at a higher dose of 1,000 nM and failed to inhibit migration,
suggesting a modest effect of XL388 in GB cells. This may be due to
its inability to suppress targets of mTORC1 and mTORC2, only
suppressing the phosphorylation of PRAS40 at higher doses. These
results showed, for the first time, that Torin2 is most suitable
for suppression of mTORC1 and mTORC2, which in turn inhibit
proliferation and migration. Importantly, it was demonstrated that
Torin2 could overcome drug resistance. The phosphorylation of
PRAS40Thr246 is used as an important biomarker for
assessing the effects of inhibitors that are used in targeting the
PTEN/PI3K/AKT/mTOR-mediated signaling pathways in human cancers.
The PRAS40Thr246 phosphorylation state is an excellent
predictor of hyperactivation of the PTEN/PI3K/AKT pathway and their
sensitivity to inhibitors of components of these signaling
pathways, as was demonstrated here and shown by Cloughesy et
al (36).
In summary, the selectivity of Torin2-like compounds
appears promising as they inhibit cell proliferation, migration and
block S-phase entry. Most importantly, Torin2 eradicated
drug-resistant tumor cells, inhibited the phosphorylation of PRAS40
and effectively inhibited the downstream effectors of the mTOR
pathway (4E-BP1 and S6K). Torin2 also markedly suppressed the
phosphorylation of AKT, an important signaling (PI3K/AKT/mTOR)
pathway in GB cells. These results underscore the use of Torin2 in
targeting the mTOR pathway for treatment of GB.
Availability of data and materials
The datasets used and/or analyzed during the present
study are available from the corresponding author on reasonable
request.
Authors' contributions
MJU conceived and designed the project, interpreted
the results and wrote the manuscript. CDG and RM conceived and
designed the project and assisted in writing the manuscript. AGA,
SWJ and JLG designed and performed the experiments. TS performed
the statistical analysis, created the figures, and wrote and edited
the manuscript. MJU, AGA and JLG confirmed the authenticity of the
raw data, All Authors have read and approved the final
manuscript.
Ethics approval and consent to
participate
Not applicable.
Patient consent for publication
Not applicable.
Competing interests
The authors declare that they have no competing
interests.
Acknowledgements
Not applicable.
Abbreviations:
|
PI3K
|
phosphatidylinositol 3′-kinase
|
|
PIP2
|
phosphatidylinositol-4,5-biphosphate
|
|
PIP3
|
phosphatidylinositol-3,4,5-triphosphate
|
|
PDK1
|
phosphoinositide-dependent kinase
1
|
|
TSC
|
tuberous sclerosis complex
|
|
mTOR
|
mechanistic target of rapamycin
|
|
mTORC
|
mTOR complex
|
|
Raptor
|
rapamycin-sensitive adapter protein of
mTOR
|
|
4E-BP1
|
4E-binding protein 1
|
|
S6K1
|
ribosomal protein S6 kinase 1
|
|
PRAS40
|
The proline-rich AKT substrate of 40
kDa
|
|
IRS
|
Insulin Receptor substrate
|
References
|
1
|
Russell RC, Fang C and Guan KL: An
emerging role for TOR signaling in mammalian tissue and stem cell
physiology. Development. 138:3343–3356. 2011. View Article : Google Scholar
|
|
2
|
Laplante M and Sabatini DM: mTOR signaling
in growth control and disease. Cell. 149:274–293. 2012. View Article : Google Scholar
|
|
3
|
Saxton RA and Sabatini DM: mTOR signaling
in growth, metabolism, and disease. Cell. 168:960–976. 2017.
View Article : Google Scholar
|
|
4
|
Guertin DA and Sabatini DM: The
pharmacology of mTOR inhibition. Sci Signal. 2:pe242009. View Article : Google Scholar
|
|
5
|
Jacinto E, Loewith R, Schmidt A, Lin S,
Rüegg MA, Hall A and Hall MN: Mammalian TOR complex 2 controls the
actin cytoskeleton and is rapamycin insensitive. Nat Cell Biol.
6:1122–1128. 2004. View
Article : Google Scholar
|
|
6
|
Loewith R, Jacinto E, Wullschleger S,
Lorberg A, Crespo JL, Bonenfant D, Oppliger W, Jenoe P and Hall MN:
Two TOR complexes, only one of which is rapamycin sensitive, have
distinct roles in cell growth control. Mol Cell. 10:457–468. 2002.
View Article : Google Scholar
|
|
7
|
Sabatini DM: mTOR and cancer: Insights
into a complex relationship. Nat Rev Cancer. 6:729–734. 2006.
View Article : Google Scholar
|
|
8
|
Volarević S and Thomas G: Role of S6
phosphorylation and S6 kinase in cell growth. Prog Nucleic Acid Res
Mol Biol. 65:101–127. 2001. View Article : Google Scholar
|
|
9
|
Sato T, Nakashima A, Guo L, Coffman K and
Tamanoi F: Single amino-acid changes that confer constitutive
activation of mTOR are discovered in human cancer. Oncogene.
29:2746–2752. 2010. View Article : Google Scholar
|
|
10
|
Musa J, Orth MF, Dallmayer M, Baldauf M,
Pardo C, Rotblat B, Kirchner T, Leprivier G and Grünewald TG:
Eukaryotic initiation factor 4E-binding protein 1 (4E-BP1): A
master regulator of mRNA translation involved in tumorigenesis.
Oncogene. 35:4675–4688. 2016. View Article : Google Scholar
|
|
11
|
Ganley IG, Lam du H, Wang J, Ding X, Chen
S and Jiang X: ULK1.ATG13.FIP200 complex mediates mTOR signaling
and is essential for autophagy. J Biol Chem. 284:12297–12305. 2009.
View Article : Google Scholar
|
|
12
|
Wiza C, Nascimento EB and Ouwens DM: Role
of PRAS40 in Akt and mTOR signaling in health and disease. Am J
Physiol Endocrinol Metab. 302:E1453–E1460. 2012. View Article : Google Scholar
|
|
13
|
Sarbassov DD, Ali SM, Kim DH, Guertin DA,
Latek RR, Erdjument-Bromage H, Tempst P and Sabatini DM: Rictor, a
novel binding partner of mTOR, defines a rapamycin-insensitive and
raptor-independent pathway that regulates the cytoskeleton. Curr
Biol. 14:1296–1302. 2004. View Article : Google Scholar
|
|
14
|
Gulati N, Karsy M, Albert L, Murali R and
Jhanwar-Uniyal M: Involvement of mTORC1 and mTORC2 in regulation of
glioblastoma multiforme growth and motility. Int J Oncol.
35:731–740. 2009.
|
|
15
|
Jhanwar-Uniyal M, Jeevan D, Neil J,
Shannon C, Albert L and Murali R: Deconstructing mTOR complexes in
regulation of Glioblastoma Multiforme and its stem cells. Adv Biol
Regul. 53:202–210. 2013. View Article : Google Scholar
|
|
16
|
Guertin DA and Sabatini DM: Defining the
role of mTOR in cancer. Cancer Cell. 12:9–22. 2007. View Article : Google Scholar
|
|
17
|
Ostrom QT, Cioffi G, Gittleman H, Patil N,
Waite K, Kruchko C and Barnholtz-Sloan JS: CBTRUS statistical
report: Primary brain and other central nervous system tumors
diagnosed in the United States in 2012-2016. Neuro Oncol. 21(Suppl
5): v1–v100. 2019. View Article : Google Scholar
|
|
18
|
Brennan C, Momota H, Hambardzumyan D,
Ozawa T, Tandon A, Pedraza A and Holland E: Glioblastoma subclasses
can be defined by activity among signal transduction pathways and
associated genomic alterations. PLoS One. 4:e77522009. View Article : Google Scholar
|
|
19
|
Cancer Genome Atlas Research Network:
Comprehensive genomic characterization defines human glioblastoma
genes and core pathways. Nature. 455:1061–1068. 2008. View Article : Google Scholar
|
|
20
|
Brennan CW, Verhaak RG, McKenna A, Campos
B, Noushmehr H, Salama SR, Zheng S, Chakravarty D, Sanborn JZ,
Berman SH, et al: The somatic genomic landscape of glioblastoma.
Cell. 155:462–477. 2013. View Article : Google Scholar
|
|
21
|
Jhanwar-Uniyal M, Labagnara M, Friedman M,
Kwasnicki A and Murali R: Glioblastoma: Molecular pathways, stem
cells and therapeutic targets. Cancers (Basel). 7:538–555. 2015.
View Article : Google Scholar
|
|
22
|
Jhanwar-Uniyal M, Albert L, McKenna E,
Karsy M, Rajdev P, Braun A and Murali R: Deciphering the signaling
pathways of cancer stem cells of glioblastoma multiforme: Role of
Akt/mTOR and MAPK pathways. Adv Enzyme Regul. 51:164–170. 2011.
View Article : Google Scholar
|
|
23
|
Jhanwar-Uniyal M, Wainwright JV, Mohan AL,
Tobias ME, Murali R, Gandhi CD and Schmidt MH: Diverse signaling
mechanisms of mTOR complexes: mTORC1 and mTORC2 in forming a
formidable relationship. Adv Biol Regul. 72:51–62. 2019. View Article : Google Scholar
|
|
24
|
Chiu MI, Katz H and Berlin V: RAPT1, a
mammalian homolog of yeast Tor, interacts with the FKBP12/rapamycin
complex. Proc Natl Acad Sci USA. 91:12574–12578. 1994. View Article : Google Scholar
|
|
25
|
Albert L, Karsy M, Murali R and
Jhanwar-Uniyal M: Inhibition of mTOR activates the MAPK pathway in
glioblastoma multiforme. Cancer Genomics Proteomics. 6:255–261.
2009.
|
|
26
|
Feldman ME, Apsel B, Uotila A, Loewith R,
Knight ZA, Ruggero D and Shokat KM: Active-site inhibitors of mTOR
target rapamycin-resistant outputs of mTORC1 and mTORC2. PLoS Biol.
7:e382009. View Article : Google Scholar
|
|
27
|
Thoreen CC, Kang SA, Chang JW, Liu Q,
Zhang J, Gao Y, Reichling LJ, Sim T, Sabatini DM and Gray NS: An
ATP-competitive mammalian target of rapamycin inhibitor reveals
rapamycin-resistant functions of mTORC1. J Biol Chem.
284:8023–8032. 2009. View Article : Google Scholar
|
|
28
|
Liu Q, Chang JW, Wang J, Kang SA, Thoreen
CC, Markhard A, Hur W, Zhang J, Sim T, Sabatini DM and Gray NS:
Discovery of 1-(4-(4-propionylpiperazin-1-yl)-3-(trifluoromethyl)
phenyl)-9-(quinolin-3-yl)benzo[h][1,6]naphthyridin-2(1H)-one as a
highly potent, selective mammalian target of rapamycin (mTOR)
inhibitor for the treatment of cancer. J Med Chem. 53:7146–7155.
2010. View Article : Google Scholar
|
|
29
|
Liu Q, Kang SA, Thoreen CC, Hur W, Wang J,
Chang JW, Markhard A, Zhang J, Sim T, Sabatini DM and Gray NS:
Development of ATP-competitive mTOR inhibitors. Methods Mol Biol.
821:447–460. 2012. View Article : Google Scholar
|
|
30
|
Liu Q, Wang J, Kang SA, Thoreen CC, Hur W,
Ahmed T, Sabatini DM and Gray NS: Discovery of
9-(6-aminopyridin-3-yl)-1-(3-(trifluoromethyl)phenyl)benzo[h][1,6]naphthyridin-2(1H)-one
(Torin2) as a potent, selective, and orally available mammalian
target of rapamycin (mTOR) inhibitor for treatment of cancer. J Med
Chem. 54:1473–1480. 2011. View Article : Google Scholar
|
|
31
|
Takeuchi CS, Kim BG, Blazey CM, Ma S,
Johnson HW, Anand NK, Arcalas A, Baik TG, Buhr CA, Cannoy J, et al:
Discovery of a novel class of highly potent, selective,
ATP-competitive, and orally bioavailable inhibitors of the
mammalian target of rapamycin (mTOR). J Med Chem. 56:2218–2234.
2013. View Article : Google Scholar
|
|
32
|
Sokolosky ML, Stadelman KM, Chappell WH,
Abrams SL, Martelli AM, Stivala F, Libra M, Nicoletti F, Drobot LB,
Franklin RA, et al: Involvement of Akt-1 and mTOR in sensitivity of
breast cancer to targeted therapy. Oncotarget. 2:538–550. 2011.
View Article : Google Scholar
|
|
33
|
Sarkaria JN, Galanis E, Wu W, Peller PJ,
Giannini C, Brown PD, Uhm JH, McGraw S, Jaeckle KA and Buckner JC:
North Central Cancer Treatment Group Phase I trial N057K of
everolimus (RAD001) and temozolomide in combination with radiation
therapy in patients with newly diagnosed glioblastoma multiforme.
Int J Radiat Oncol Biol Phys. 81:468–475. 2011. View Article : Google Scholar
|
|
34
|
Hainsworth JD, Shih KC, Shepard GC,
Tillinghast GW, Brinker BT and Spigel DR: Phase II study of
concurrent radiation therapy, temozolomide, and bevacizumab
followed by bevacizumab/everolimus as first-line treatment for
patients with glioblastoma. Clin Adv Hematol Oncol. 10:240–246.
2012.
|
|
35
|
Galanis E, Buckner JC, Maurer MJ,
Kreisberg JI, Ballman K, Boni J, Peralba JM, Jenkins RB, Dakhil SR,
Morton RF, et al: Phase II trial of temsirolimus (CCI-779) in
recurrent glioblastoma multiforme: A North Central Cancer Treatment
Group Study. J Clin Oncol. 23:5294–5304. 2005. View Article : Google Scholar
|
|
36
|
Cloughesy TF, Yoshimoto K, Nghiemphu P,
Brown K, Dang J, Zhu S, Hsueh T, Chen Y, Wang W, Youngkin D, et al:
Antitumor activity of rapamycin in a Phase I trial for patients
with recurrent PTEN-deficient glioblastoma. PLoS Med. 5:e82008.
View Article : Google Scholar
|
|
37
|
Takano A, Usui I, Haruta T, Kawahara J,
Uno T, Iwata M and Kobayashi M: Mammalian target of rapamycin
pathway regulates insulin signaling via subcellular redistribution
of insulin receptor substrate 1 and integrates nutritional signals
and metabolic signals of insulin. Mol Cell Biol. 21:5050–5062.
2001. View Article : Google Scholar
|
|
38
|
Sancak Y, Thoreen CC, Peterson TR,
Lindquist RA, Kang SA, Spooner E, Carr SA and Sabatini DM: PRAS40
is an insulin-regulated inhibitor of the mTORC1 protein kinase. Mol
Cell. 25:903–915. 2007. View Article : Google Scholar
|
|
39
|
Kovacina KS, Park GY, Bae SS, Guzzetta AW,
Schaefer E, Birnbaum MJ and Roth RA: Identification of a
proline-rich Akt substrate as a 14-3-3 binding partner. J Biol
Chem. 278:10189–10194. 2003. View Article : Google Scholar
|
|
40
|
Laplante M and Sabatini DM: mTOR
signaling. Cold Spring Harb Perspect Biol. 4:a0115932012.
View Article : Google Scholar
|
|
41
|
Jhanwar-Uniyal M, Gillick JL, Neil J,
Tobias M, Thwing ZE and Murali R: Distinct signaling mechanisms of
mTORC1 and mTORC2 in glioblastoma multiforme: A tale of two
complexes. Adv Biol Regul. 57:64–74. 2015. View Article : Google Scholar
|
|
42
|
Rodrik-Outmezguine VS, Okaniwa M, Yao Z,
Novotny CJ, McWhirter C, Banaji A, Won H, Wong W, Berger M, de
Stanchina E, et al: Overcoming mTOR resistance mutations with a
new-generation mTOR inhibitor. Nature. 534:272–276. 2016.
View Article : Google Scholar
|
|
43
|
Fan Q, Aksoy O, Wong RA, Ilkhanizadeh S,
Novotny CJ, Gustafson WC, Truong AY, Cayanan G, Simonds EF,
Haas-Kogan D, et al: A kinase inhibitor targeted to mTORC1 drives
regression in glioblastoma. Cancer Cell. 31:424–435. 2017.
View Article : Google Scholar
|
|
44
|
Jhanwar-Uniyal M: Mighty RapaLink-1
vanquishes undruggable mutant mTOR in glioblastoma. Transl Cancer
Res. 6(Suppl 7): S1143–S1148. 2017. View Article : Google Scholar
|
|
45
|
Liu Q, Xu C, Kirubakaran S, Zhang X, Hur
W, Liu Y, Kwiatkowski NP, Wang J, Westover KD, Gao P, et al:
Characterization of Torin2, an ATP-competitive inhibitor of mTOR,
ATM, and ATR. Cancer Res. 73:2574–2586. 2013. View Article : Google Scholar
|
|
46
|
Watanabe T, Sato A, Kobayashi-Watanabe N,
Sueoka-Aragane N, Kimura S and Sueoka E: Torin2 potentiates
anticancer effects on adult T-cell leukemia/lymphoma by inhibiting
mammalian target of rapamycin. Anticancer Res. 36:95–102. 2016.
|
|
47
|
Sadowski SM, Boufraqech M, Zhang L, Mehta
A, Kapur P, Zhang Y, Li Z, Shen M and Kebebew E: Torin2 targets
dysregulated pathways in anaplastic thyroid cancer and inhibits
tumor growth and metastasis. Oncotarget. 6:18038–18049. 2015.
View Article : Google Scholar
|
|
48
|
Chopra SS, Jenney A, Palmer A, Niepel M,
Chung M, Mills C, Sivakumaren SC, Liu Q, Chen JY, Yapp C, et al:
Torin2 exploits replication and checkpoint vulnerabilities to cause
death of PI3K-activated triple-negative breast cancer cells. Cell
Syst. 10:66–81.e11. 2020. View Article : Google Scholar
|
|
49
|
Luo J, Pi G, Xiao H, Ye Y, Li Q, Zhao L,
Huang H, Luo H, Zhang Q, Wang D and Wang G: Torin2 enhances the
radiosensitivity of MCF-7 breast cancer cells by downregulating the
mTOR signaling pathway and ATM phosphorylation. Mol Med Rep.
17:366–373. 2018.
|
|
50
|
Zhu YR, Zhou XZ, Zhu LQ, Yao C, Fang JF,
Zhou F, Deng XW and Zhang YQ: The anti-cancer activity of the
mTORC1/2 dual inhibitor XL388 in preclinical osteosarcoma models.
Oncotarget. 7:49527–49538. 2016. View Article : Google Scholar
|
|
51
|
Xiong Z, Zang Y, Zhong S, Zou L, Wu Y, Liu
S, Fang Z, Shen Z, Ding Q and Chen S: The preclinical assessment of
XL388, a mTOR kinase inhibitor, as a promising anti-renal cell
carcinoma agent. Oncotarget. 8:30151–30161. 2017. View Article : Google Scholar
|


