Introduction
Despite significant advances in the prevention and
treatment of gastric cancer (GC) over the past few decades, there
are ~1 million new cases annually, making GC the fifth most
diagnosed cancer worldwide (1).
The etiology of this disease is multifactorial and includes the
combination of genetic predisposition and environmental factors
(2). GC still has a poor
prognosis due to metastasis. To develop more effective therapies
for advanced GC, there is a need to clarify the biological
mechanism behind this disease.
Although the development of molecular biology has
gradually deepened our understanding of GC, the molecular
mechanisms underlying its progression remain to be elucidated.
There is thus an urgent need to identify biomarkers that could
potentially serve as therapeutic targets or prognostic indicators
in patients with GC.
Similar to other solid tumors, GC causes widespread
hypoxia. Previous reports have shown that hypoxia is an important
microenvironmental factor in the promotion of tumor progression
(3,4). Hypoxia-inducible factor-1 (HIF-1) is
a heterodimeric transcription factor composed of a constitutively
expressed HIF-1β subunit and an O2 level-regulated
HIF-1α subunit (5,6). HIF-1α is a well-known master
regulator of invasion and metastasis in solid tumors, including GC,
via its upregulation of target genes under hypoxia (7–12).
In xenograft tumors, the manipulation of HIF-1α activity by genetic
or pharmacological methods has a significant effect on tumor growth
via changes in angiogenesis, glucose metabolism and cell survival
(13–16).
Matrix metalloproteinases (MMPs), a large family of
zinc-containing endopeptidases composed of 25 members (including
collagenase, gelatinase and stromelysin), are involved in the
tissue remodeling and degradation of the extracellular matrix
(17,18). The role of MMPs in cancer
progression is attributed to their ability to degrade the
extracellular matrix (19,20).
Recent studies have revealed that MMPs also degrade several other
biopolymers (21). MMP-1, also
known as collagenase-1, specifically degrades interstitial collagen
I, II and III and serves an important role in tumor cell
progression and metastasis (22).
High MMP1 expression has been identified in various types of cancer
and is involved in the incidence or invasion of cancers (23–34). Several reports have shown that the
increased expression of MMP-1 in different cancers is associated
with unfavorable clinical outcomes, but the relationship between
MMP-1 levels and patient outcomes in GC remains unclear (34–45).
The present study analyzed three GC cell lines:
58As9, MKN45 and MKN74. The 58As9 cell line exhibits
hypoxia-induced cancer invasion, whereas the other two GC cell
lines show limited invasiveness. MMP-1 was focused on as a
candidate for regulating 58As9 cell invasion because of its
hypoxia-dependent expression. Cells with knockdown of HIF-1α and
MMP-1 were analyzed to evaluate whether MMP-1 was responsible for
the hypoxia-induced invasiveness of 58As9 cells and it was
determined whether MMP-1 was an HIF-1α target gene. The effect of
MMP-1 knockdown was further investigated not only on cell
proliferation in vitro, but also on tumor growth and the
development of peritoneal dissemination in nude mice. Finally,
MMP-1 expression in 161 surgically resected GC tissues was
evaluated by immunohistochemistry (IHC) and the correlation between
MMP-1 levels and clinical outcomes in GC patients was assessed. In
this way, the present study aimed to clarify the role of MMP-1
expression in GC progression.
Materials and methods
Cell culture
The human GC cell lines 58As9, MKN45 and MKN74 were
investigated. The 58As9 cell line was provided by the National
Cancer Institute, Tokyo, Japan. MKN45 and MKN74 cells were
purchased from RIKEN BRC cell bank. The characteristics of the cell
lines are as follows: 58As9, signet-ring cell carcinoma; MKN45,
poorly differentiated adenocarcinoma; and MKN74, moderately
differentiated adenocarcinoma. The cell lines were grown in
complete culture medium [RPMI-1640 medium (Sigma-Aldrich; Merck
KGaA) supplemented with 10% fetal bovine serum (Biowest S.A.S.) and
100 µg/ml kanamycin (Meiji Seika Kaisha, Ltd.)] at 37°C in a
humidified atmosphere and maintained under conditions of either
normoxia (20% O2 and 5% CO2 air) or hypoxia
(1% O2, 5% CO2 and 94% N2).
Invasion assay
GC cells were resuspended in serum-free RPMI-1640
culture medium (1x10⁵ cells/500 µl) and seeded onto the
upper chambers of BioCoat Matrigel Invasion Chambers (cat. no.
354480; Corning, Inc.) in 24-well plates. Next, 750 µl aliquots of
the supernatant from cultures of MRC5 normal diploid fibroblasts
were placed on the bottom chambers. Plates were incubated at 37°C
for 24 h and then the non-invaded cells on the upper side of the
filter were gently removed with a cotton swab. The invaded cells on
the lower side of the filter were fixed in 4% paraformaldehyde for
15 min at room temperature and then stained with a 0.1% crystal
violet solution for 15 min at room temperature. Using a light
microscope, cells in three random fields were visualized and
counted with ImageJ software v1.53 (National Institutes of Health).
All experiments were performed in triplicate.
Western blotting (WB)
Whole-cell lysates from cultured cells and xenograft
tumors in mice were prepared by the resuspension of cells in lysis
buffer [150 mM NaCl, 50 mM Tris-HCl, pH 7.5, 2 mM EDTA, 1% Triton
X-100, 1% sodium deoxycholate, 2% sodium dodecyl sulfate, 28 µM
phenylmethylsulfonyl fluoride and a protease inhibitor cocktail mix
(Roche Diagnostics GmbH)].
For WB analysis, the protein concentration was
determined using Protein Assay Dye Reagent (cat. no. 5000006JA;
Bio-Rad Laboratories, Inc.) according to the manufacturer's
instructions. The samples were dissolved in NuPage LDS sample
buffer (Invitrogen; Thermo Fisher Scientific, Inc.) and 1 M
dithiothreitol and then heated for 5 min at 95°C. Briefly, 30 µg of
protein was separated on 5–20% Bis-Tris gels (Inter-Techno Co.,
Ltd.) and transferred to Hybond-ECL membranes (GE Healthcare;
Cytiva). Membranes were blocked with 5% skimmed milk at room
temperature for 30 min, and then incubated overnight at 4°C with
the following primary antibodies: Anti-MMP-1 (1:5,000; cat. no.
134184; Abcam), anti-HIF-1α (1:1,000; BD Biosciences), anti-CDK2
(1:1,000; cat. no. 32147; Abcam), anti-CDK6 (1:50,000; cat. no.
124821; Abcam), anti-cyclin B1 (1:2,000; cat. no. 181593; Abcam),
anti-cyclin D1 (1:10,000; cat. no. 134175; Abcam), anti-p21
(1:1,000; cat. no. 109199; Abcam), anti-p27 KIP1 (1:5,000; cat. no.
32034; Abcam) and anti-β-actin (1:10,000, cat. no. AC15;
Sigma-Aldrich; Merck KGaA). Membranes were then washed and
incubated with the corresponding secondary antibodies (Goat
Anti-Rabbit IgG; 1:5,000; cat. no. 4050–05; and Goat Anti-Mouse
IgG, 1:5,000; cat. no. 1031–05; both SouthernBiotech) for 30 min at
room temperature and the signal was developed using ECL Prime
Western Blotting Detection Reagent (GE Healthcare; Cytiva). Images
were acquired using a FUSION-FX7 imaging system (Vilber-Lourmat).
Densitometry was performed using Bio-1D software v15.08
(Vilber-Lourmat).
Extraction of RNA and
reverse-transcription quantitative (RT-q)PCR analysis
Cells were plated in 60 mm dishes and allowed to
grow to 60–70% confluence. Total RNA was extracted as previously
described (46). Total RNA was
extracted from cell lines using an Isogen RNA extraction kit
(Nippon Gene Co., Ltd.) according to the manufacturer's protocol.
RNA was converted into cDNA using a ReverTra Ace (Toyobo Life
Science) reverse transcription reaction kit according to the
manufacturer's protocol. RNA quantity and quality were measured
with a NanoDrop ND-1000 spectrophotometer (NanoDrop Technologies;
Thermo Fisher Scientific, Inc.). RT-qPCR was performed using the
CFX Connect Real-Time PCR Detection System (Bio-Rad Laboratories,
Inc.) with SsoAdvanced Universal SYBR Green Supermix (Bio-Rad
Laboratories, Inc.) according to the manufacturer′s protocol. After
performing a denaturation step at 95°C for 3 min, PCR amplification
was conducted with 50 cycles composed of denaturation for 15 sec at
95°C, annealing for 5 sec at 60°C and extension for 10 sec at 72°C.
Expression of the gene of interest was normalized to β-actin (ACTB)
mRNA levels by 2-ΔΔCq method (47). The following primers were used:
MMP-1: 5′-TCC CAA AAT CCT GTC CAG CC-3′ (forward) 5′-CCG GAC TTC
ATC TCT GTC GG-3′ (reverse); Ras homolog family member A (RHOA):
5′-GGT GAT GGA GCC TGT GGA AA-3′ (forward) 5′-TGT GTC CCA CAA AGC
CAA CT-3′ (reverse); S100A4: 5′-ACA GAT GAA GCT GCT TTC CAG A-3′
(forward) 5′-TTC TTC CTG GGC TGC TTA TCT G-3′ (reverse);
ρ-associated protein kinase 1 (ROCK1): 5′-CGA ACC CTT AAA ACA CAG
GCT G-3′ (forward) 5′-CTT GGT TGA GTT CCA GTT GCA G-3′ (reverse);
urokinase-type plasminogen activator receptor (UPAR): 5′-TAA GAC
CAA CGG GGA TTG CC-3′ (forward) 5′-AGG CTG GTG ATC TTC AAG CC-3′
(reverse); MMP-14: 5′-GGC TGC CTA CCG ACA AGA TT-3′ (forward)
5′-GGG AGA CTC AGG GAT CCC TT-3′ (reverse); lysyl oxidase-like 2
(LOXL2): 5′-AAG ACC TGG AAG CAG ATC TGT G-3′ (forward) 5′-ATT CTT
CAT GGG GTC CAG TGA C-3′ (reverse); autocrine motility factor
receptor (AMFR): 5′-CTG CAT GTT GGA CAG GAG GT-3′ (forward) 5′-GAG
GTG CAA CGT CGA ATT CG-3′ (reverse); c-Mesenchymal-epithelial
transition factor (C-MET): 5′-CCA GTG AAG TGG ATG GCT TT-3′
(forward) 5′-ATA TCC GGG ACA CCA GTT CA-3′ (reverse); MMP-7: 5′-GCA
AAG AGA TCC CCC TGC AT-3′ (forward) 5′-CCA GCG TTC ATC CTC ATC
GA-3′ (reverse); ACTB: 5′-ACG CCT CTG GCC GTA CCA CT-3′ (forward)
5′-TAA TGT CAC GCA CGA TTT CCC-3′ (reverse). All experiments were
performed in triplicate and independently repeated at least three
times.
RNA interference
Cells were plated in 6-well plates and allowed to
grow to 60–70% confluence. pKLO.1-puro plasmids encoding an
MMP-1-specific short hairpin (sh)RNA (cat. no. TRCN0000372996) or a
control scrambled shRNA (cat. no. SHC002) were purchased from
Sigma-Aldrich (Merck KGaA). The pBAsi-hU6 Pur DNA plasmid (Takara
Bio, Inc.) was used to construct an HIF-1α shRNA plasmid. The
sequences of shRNA targeting MMP-1, HIF-1α and control scrambled
shRNA were designed as follows: MMP-1 (5′-CTT GAA GCT GCT TAC GAA
TTT-3′), HIF-1α (5′-CCA CAT TCA CGT ATA TGA T-3′) and scrambled
(5′-CAA CAA GAT GAA GAG CAC CAA-3′). The 58As9 cells were
transfected with the plasmids (at a concentration of 2.5 µg/2 ml of
media) at 37°C for 48 h using Lipofectamine® 3000
(Thermo Fisher Scientific, Inc.) in accordance with the
manufacturer's instructions. Cells stably expressing MMP-1-shRNA,
HIF-1α-shRNA and control shRNA (referred to as SC) were selected
using puromycin. Transfected cells were used in the experiment
within 2 months.
Cell proliferation assay
Cell proliferation was assessed by growth curve
analysis. For each cell line, 5.0x10⁴ cells were
incubated at 37°C for 24, 48 and 72 h. The cells were trypsinized
and counted using a light microscope.
5-Aza-2-deoxycytidine (5-Aza-dC) and
trichostatin A (TSA) treatments
The GC cell lines were treated with the
demethylating agent 5-Aza-dC (Sigma-Aldrich; Merck KGaA) at 5 µM
for 72 h at 37°C, with drug replacement every 24 h. For the last 24
h, cells were also exposed to the histone deacetylase inhibitor TSA
(Sigma-Aldrich; Merck KGaA) at 500 nM. Cells were harvested and
used for RNA isolation.
Mouse studies
All methods were performed in accordance with the
relevant guidelines and regulations. All animal protocols were
approved by the Animal Care Committee of Saga University (approval
no. A2020–015–0). A total of 20 of five-week-old female BALB/c nude
mice were obtained from CLEA Japan, kept under
specific-pathogen-free conditions and given sterile food and
autoclaved water. The animals were maintained in an animal facility
in a 12-h light/dark cycle in a temperature (20°C) and humidity
(50%)-controlled environment. Food and water were freely available.
Body weights were also measured twice per week.
Humane endpoints were reached when the xenograft
tumor reached >10% of the animal body weight, the tumor diameter
was >20 mm, tumors metastasized or grew such that it led to
rapid body weight loss (>20%), or signs of immobility, a huddled
posture, inability to eat, ruffled fur, self-mutilation,
ulceration, infection or necrosis were observed. The mice that
reached study endpoints were sacrificed by cervical
dislocation.
Subcutaneous xenograft mouse models
The flanks of nude mice (as above; n=5) were
injected subcutaneously with 3x10⁶ 58As9-SC or
58As9-MMP-1 knockdown cells. Tumor volume was calculated as
follows: T = π/4 × a × b, where a (mm) is the shorter axis and b
(mm) is the longer axis.
Peritoneal dissemination of
xenografts
MMP-1 knockdown and SC cells (2x10⁶) were
suspended in 200 µl of PBS and injected on day 0 into the abdominal
cavity. A total of five mice per group were injected with each cell
line. Mice that accumulated a large amount of ascites, became
extremely debilitated, or lost a certain amount of weight were
sacrificed and all mice were sacrificed on day 28. The total
weights of the disseminated nodules in mice that were injected with
MMP-1 knockdown and SC cells were measured. Body weight was also
measured on days 3–24.
Patients
A total of 161 patients with advanced GC who
consecutively underwent curative surgery at the Department of
Surgery, Saga University Hospital (Saga, Japan), between June 2000
and December 2008 were enrolled in the present study. None of the
patients presented with hepatic, peritoneal, or distant metastasis
or tumor cells in the peritoneal fluid. Stage classification was
performed in accordance with the 8th edition of the UICC TNM
Classification (https://www.uicc.org/resources/tnm). The
clinicopathological characteristics of the patients were recorded
(Table I).
 | Table ICharacteristics of 161 patients and
the tumors. |
Table I
Characteristics of 161 patients and
the tumors.
| Characteristic | n (%) |
|---|
| Patients, n
(%) | 161 (100.0) |
| Age, years | |
| Median ± SD
(Range) | 69±11.1
(26–88) |
| Sex, n (%) | |
| Female | 54 (33.5) |
| Male | 107 (66.5) |
| Surgery, n (%) | |
| Distal | 69 (42.9) |
| Total | 91 (56.5) |
| Proximal | 1 (0.6) |
| Histology, n
(%) | |
|
Differentiated | 66 (41.0) |
|
Undifferentiated | 95 (59.0) |
| Tumor depth, n
(%) | |
| 2 | 42 (26.1) |
| 3 | 70 (43.5) |
| 4a | 43 (26.7) |
| 4b | 6 (3.7) |
| Lymph node
metastasis, n (%) | |
| 0 | 59 (36.6) |
| 1 | 34 (21.1) |
| 2 | 24 (14.9) |
| 3a | 16 (9.9) |
| 3b | 28 (17.4) |
| Lymphatic invasion,
n (%) | |
| No | 32 (19.9) |
| Yes | 129 (80.1) |
| Vascular invasion,
n (%) | |
| No | 84 (52.2) |
| Yes | 77 (47.8) |
| Stage, n (%) | |
| IB | 25 (15.5) |
| IIA | 36 (22.4) |
| IIB | 23 (14.3) |
| IIIA | 27 (16.8) |
| IIIB | 25 (15.5) |
| IIIC | 25 (15.5) |
| Adjuvant, n
(%) | |
| No | 98 (60.9) |
| Yes | 63 (39.1) |
| Recurrence, n
(%) | |
| No | 106 (65.8) |
| Yes | 55 (34.2) |
| Peritoneal
dissemination | 19 (11.8) |
| Liver | 18 (11.2) |
| Lymph node | 12 (7.5) |
| Lung | 2 (1.2) |
| Anastomosis | 2 (1.2) |
| Pleural
dissemination | 2 (1.2) |
| Remnant
Stomach | 2 (1.2) |
| Spleen | 1 (0.6) |
| Bone | 1 (0.6) |
| MMP-1 | |
| Low | 121 (75.2) |
| High | 40 (24.8) |
IHC analysis
For IHC, paraffin blocks (20x30 mm) were first
sectioned onto slides at a thickness of 4 µm. To remove the
paraffin, slides were soaked in xylene and then rehydrated in a
graded alcohol series. For antigen retrieval, the tissue sections
were treated with Heat Processor Solution pH9 (Nichirei Bioscience)
at 100°C for 40 min and then blocked with 5% skimmed milk at 20°C
for 20 min. IHC was performed automatically using an Autostainer
Plus (Dako; Agilent Technologies, Inc.). Antibodies against MMP-1
(dilution 1:200; cat. no. 52631; Abcam), Ki67 (dilution 1:2; cat.
no. IR626, Dako; Agilent Technologies, Inc.) and the
EnVision+® System (ready-to-use; cat. no. K5007; Dako;
Agilent Technologies, Inc.) were used at room temperature as the
primary and secondary antibodies, respectively. The slides were
visualized using 3,3′-diaminobenzidine tetrahydrochloride and
nuclei were counterstained with hematoxylin at room temperature for
2 min.
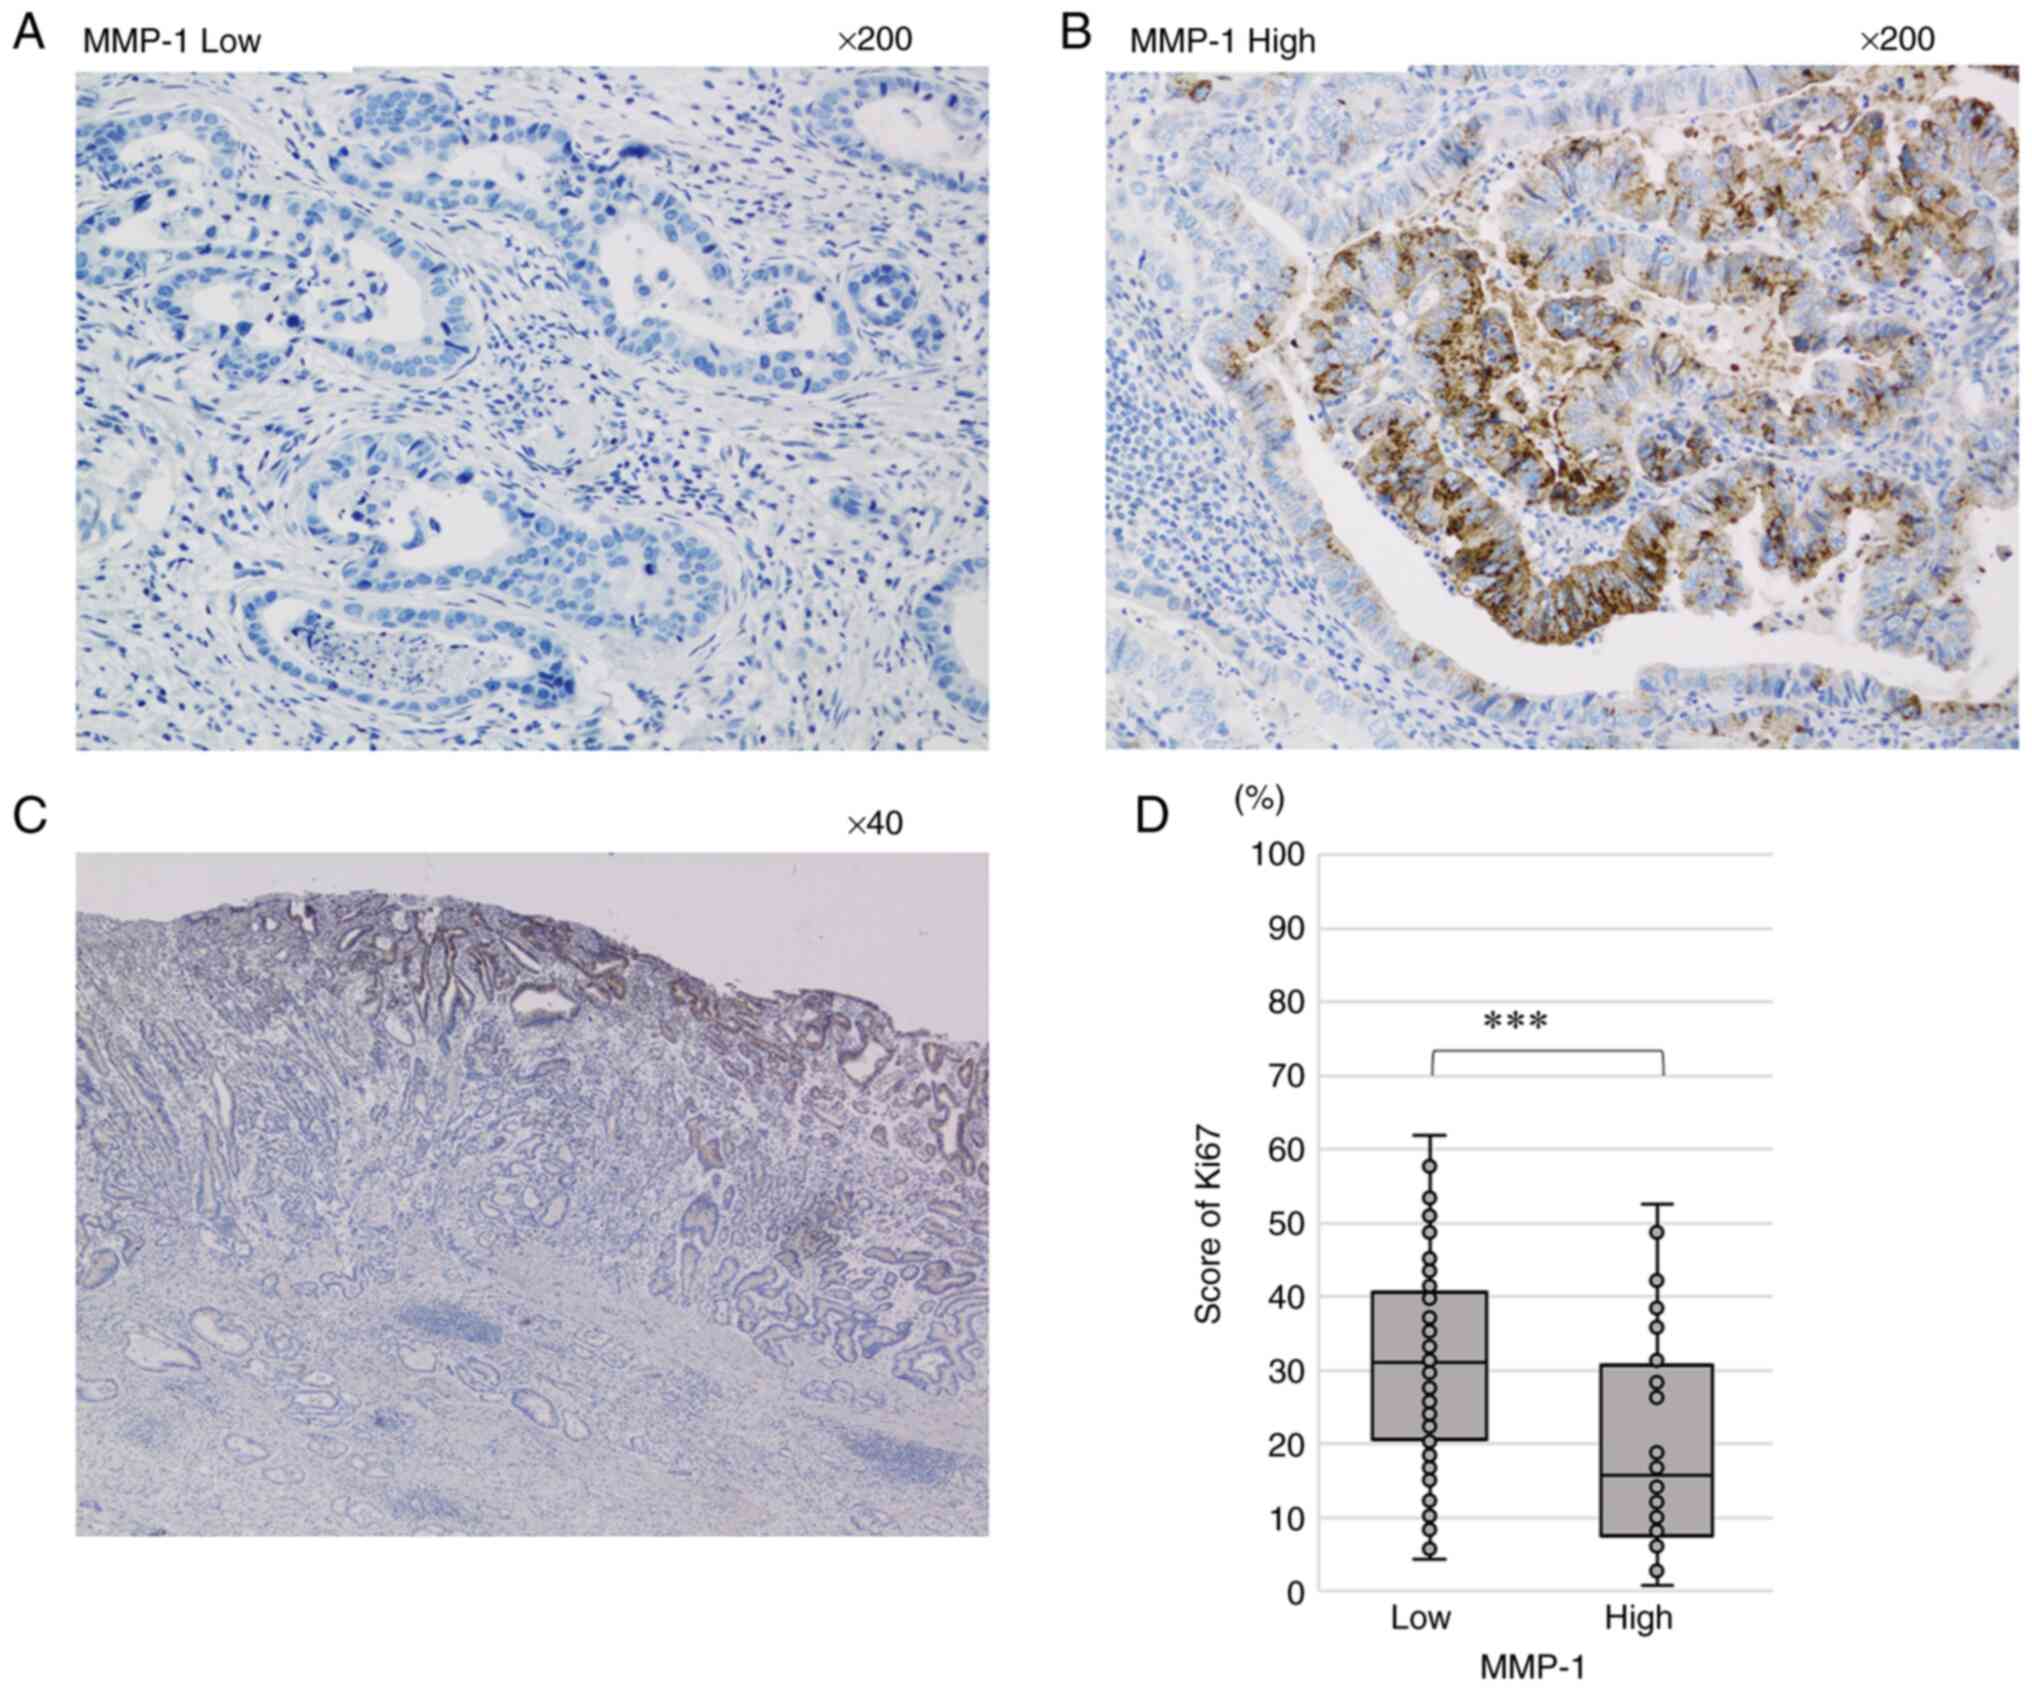
IHC analysis of MMP1 levels
The proportion of cells with positive MMP-1
cytoplasmic staining was assessed in the central region of the
tumors and semi-quantitatively scored by a certified pathologist.
The proportion of stained cells was evaluated in three fields of
hotspot areas at high power (magnification, x200), scored from
0–100% and classified into the low or high expression group with
30% as the threshold between them.
IHC analysis of Ki67 levels
Immunostained tissue slides were digitized using a
NanoZoomer 2.0HT digital slide scanner (Hamamatsu Photonics K.K.)
and the resulting whole-slide digital images in NDPI files were
visualized using NDP.view2 software (Hamamatsu Photonics K.K.).
NDPI files were converted to JPEG files using NDP. view 2 software
for imaging analysis. The rate of Ki67 positivity was automatically
calculated by image analysis software (Tissue Studio®
4.0; Definiens AG), using five fields (magnification, ×200) of
hotspot areas for surgically resected specimens and three fields
(magnification, ×200) for mouse specimens selected by a certified
pathologist.
Statistical analysis
All statistical analysis was performed using JMP Pro
version 14 (SAS Institute, Inc.). Data are expressed as the mean ±
standard error. In vitro studies were performed in
triplicate and repeated three times. Data were analyzed using
Student's t-test when comparing two groups. Comparisons among
multiple groups were analyzed using one-way ANOVA followed by
Tukey's post hoc test. χ2 analysis was used to analyze
the correlation between MMP1 expression in GC and
clinicopathological features and recurrences. A Cox proportional
hazards model was used in the univariate and multivariate analyses
of disease-free survival (DFS) and disease-specific survival (DSS).
Kaplan-Meier curves of patients with high or low MMP-1 levels were
plotted and log-rank tests were conducted. P<0.05 was considered
to indicate a statistically significant difference.
Results
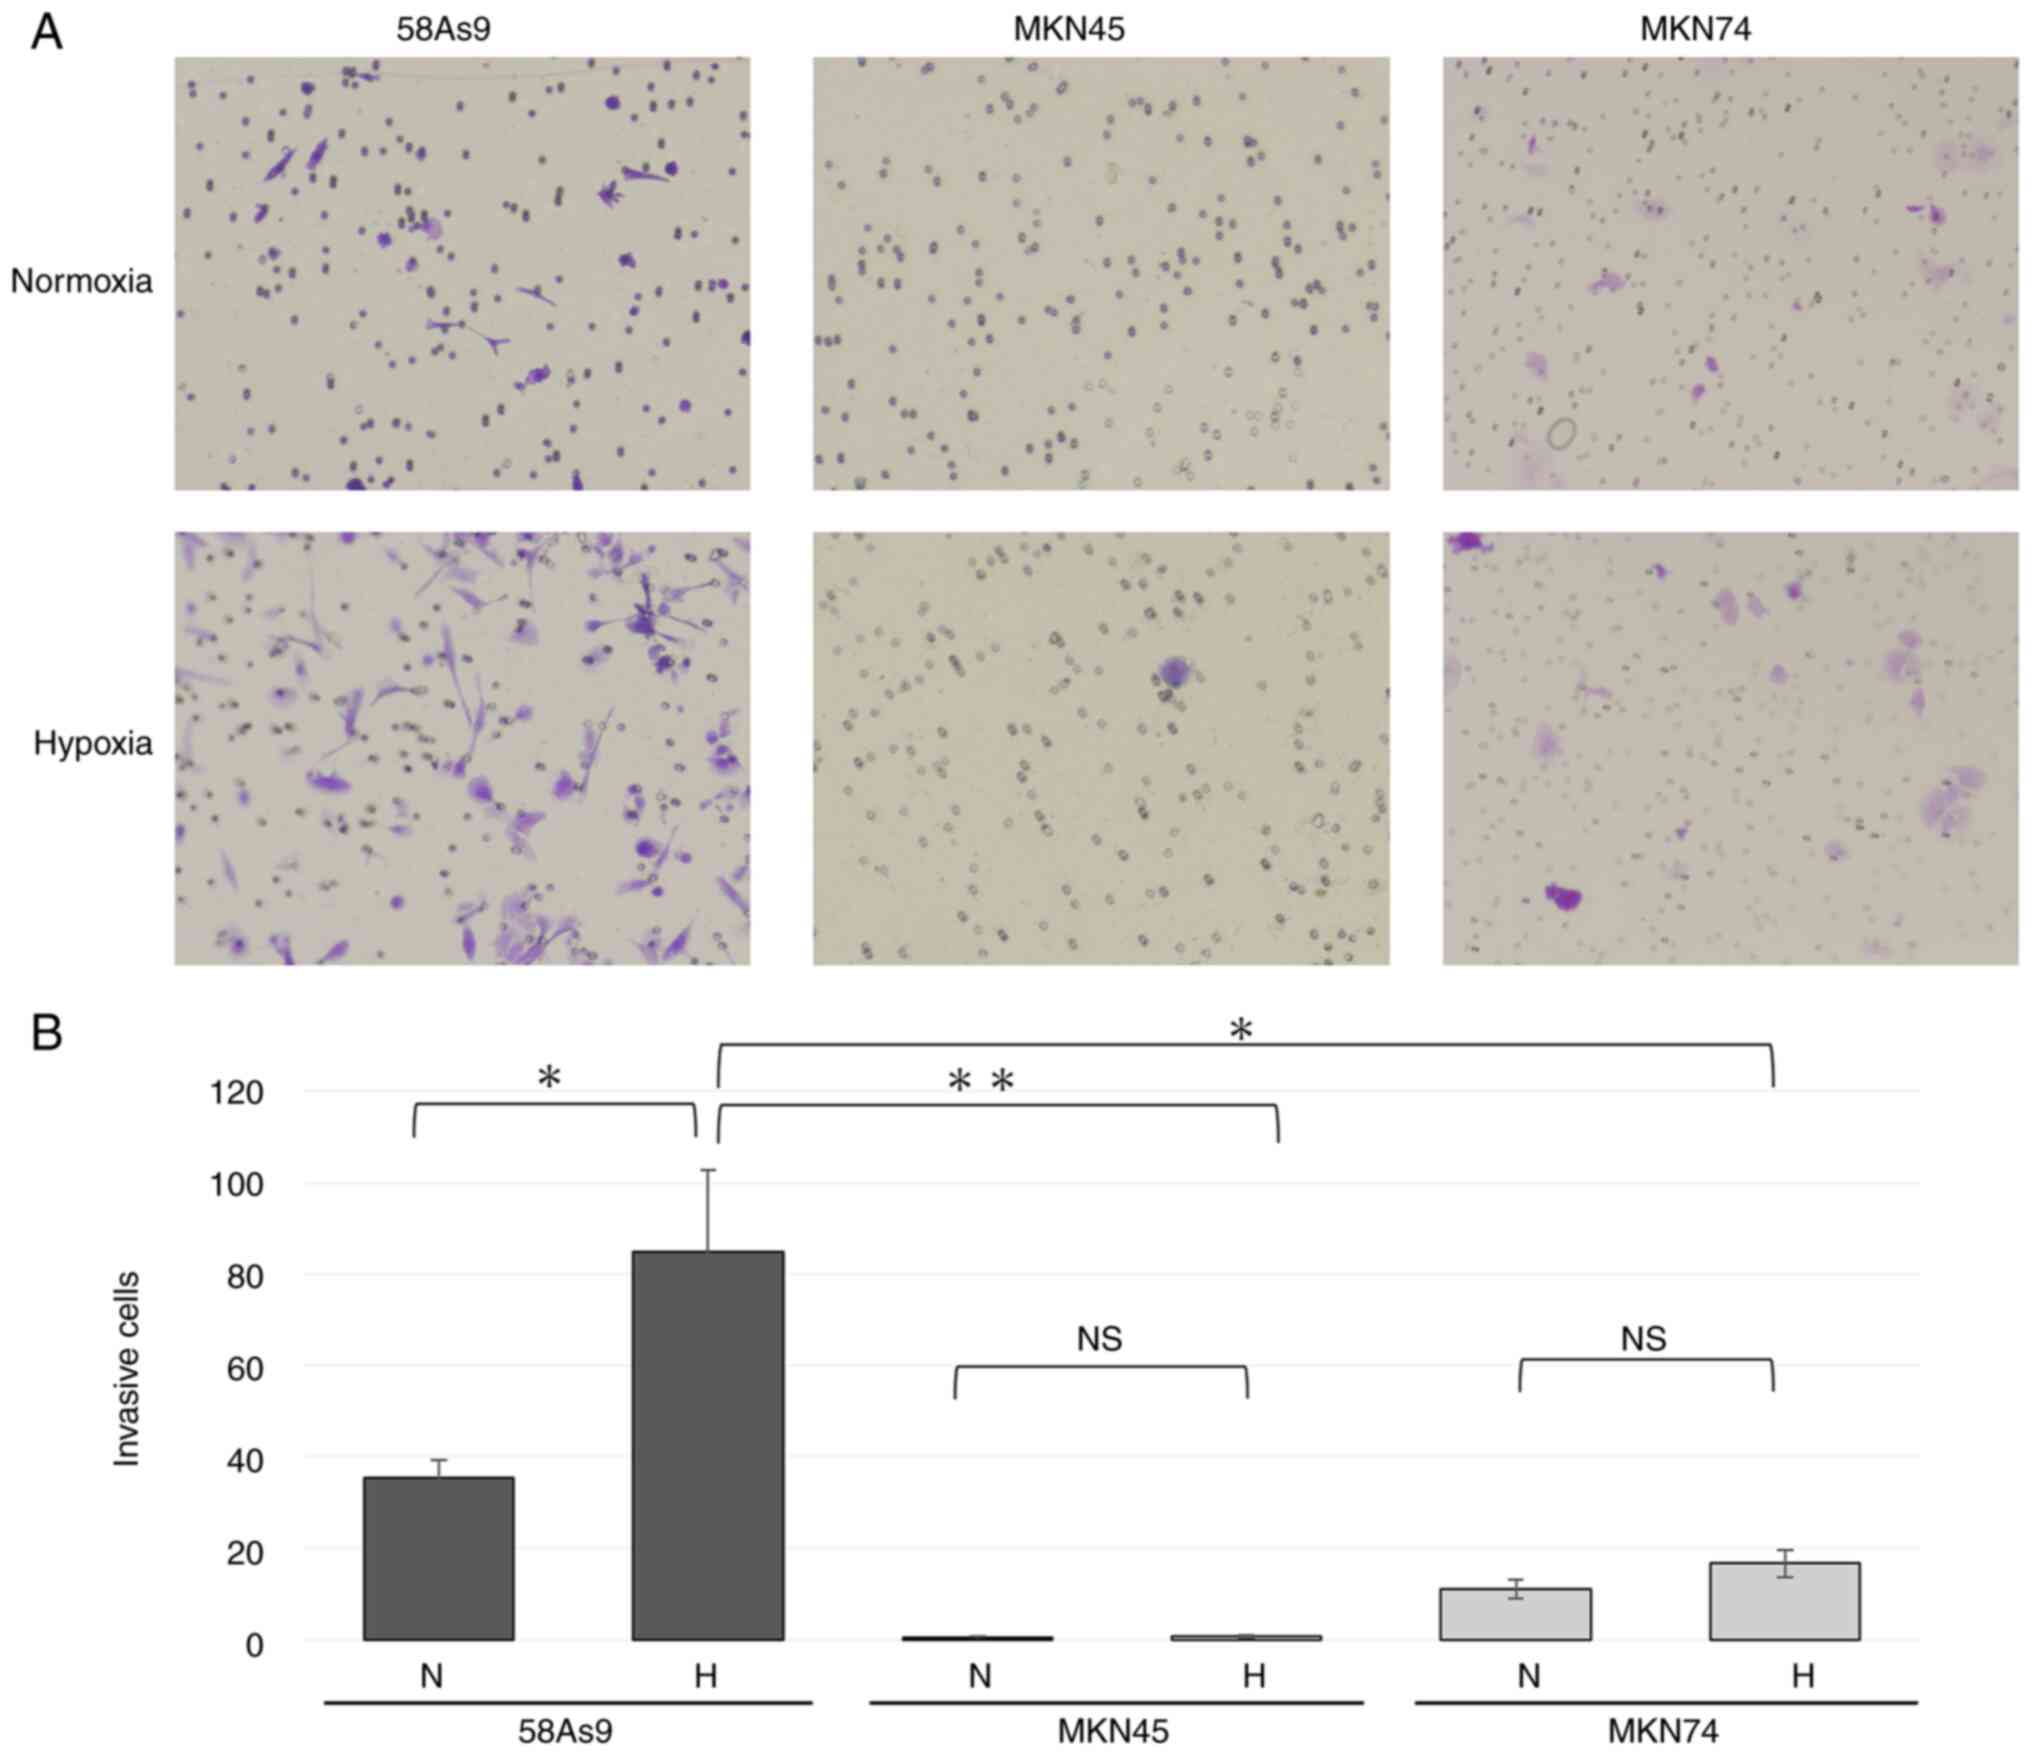
Invasiveness of GC cell lines
The invasiveness of 58As9, MKN45 and MKN74 GC cells
was evaluated by a Transwell invasion assay and compared. The
number of invaded 58As9 cells was significantly higher compared
with the other cell lines under normoxia. In addition, the number
of 58As9 cells was significantly elevated under hypoxia compared
with that under normoxia (Fig. 1A and
B). These results indicated that hypoxia increased the
invasiveness of the GC cell line 58As9, whereas the other two cell
lines exhibited limited invasiveness under both normoxia and
hypoxia.
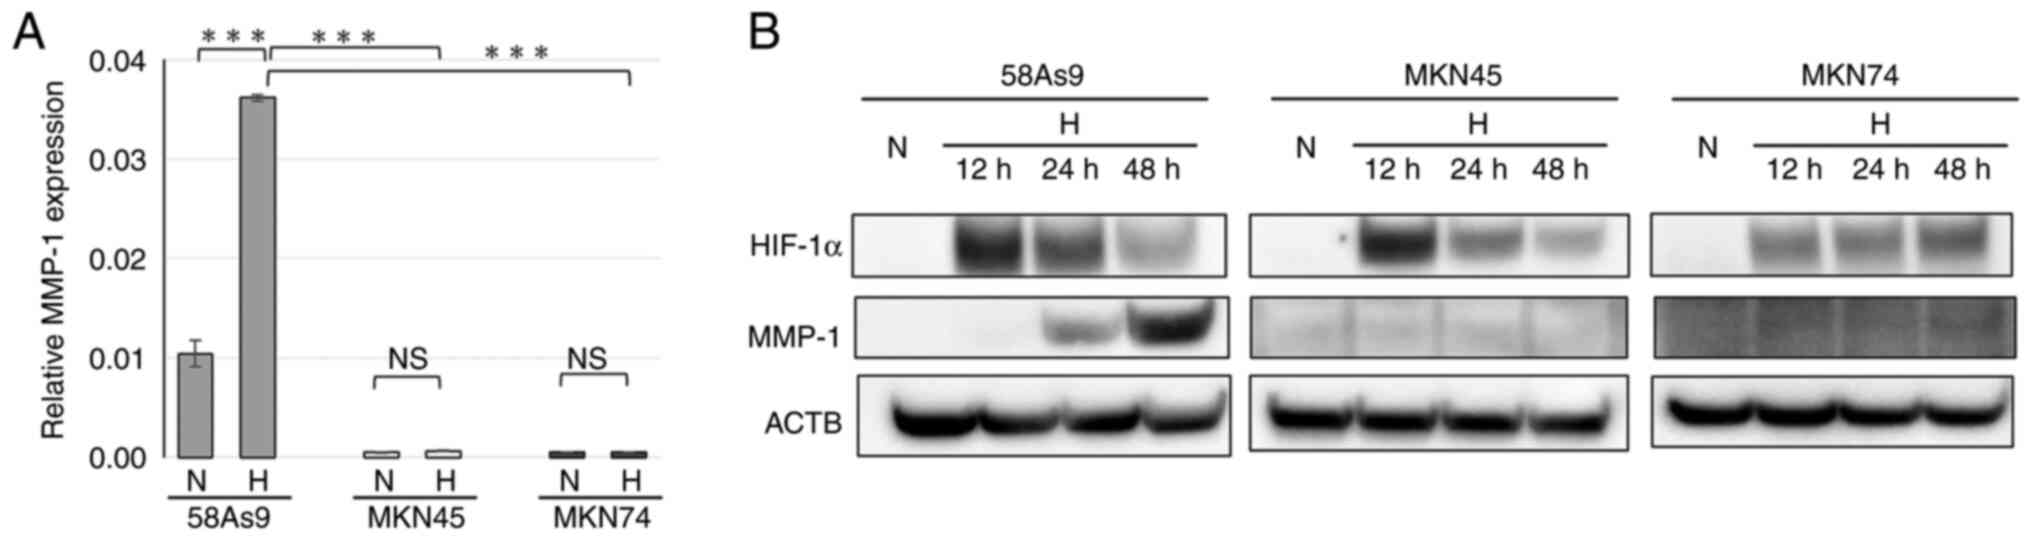
MMP-1 expression in GC cell lines
To clarify the mechanism of hypoxia-induced invasion
in 58As9 cells, the expression of the invasion-related enzyme MMP-1
was evaluated in 58As9, MKN45 and MKN75 cells by RT-qPCR analysis
(Fig. 2A). MMP-1 mRNA expression
was detected only in 58As9 cells under normoxia and the level was
significantly elevated under hypoxia (Fig. 2A). The protein expression of MMP1
and HIF-1α was next investigated by WB analysis (Fig. 2B). HIF-1α expression was induced
in all three cell lines under hypoxia for 12, 24 and 48 h, compared
with those under normoxia. By contrast, MMP1 expression was induced
in hypoxic 58As9 cells for 24 and 48 h; however, the expression was
undetectable in MKN45 or MKN74 cells under both normoxia and
hypoxia.
Regulation of MMP-1 expression in 58As9
cells
To investigate the regulation of hypoxia-induced
MMP-1 expression in 58As9 GC cells, both HIF-1α knockdown and MMP-1
knockdown cells were analyzed (Fig.
3A). The relative expression of MMP-1 mRNA was significantly
decreased in HIF-1α knockdown and MMP-1 knockdown cells under
hypoxia compared with that in SC cells. WB analysis revealed that
the hypoxia-induced expression of HIF-1α and MMP-1 was decreased in
HIF-1α knockdown cells compared with that in control SC cells.
Furthermore, MMP-1 expression was completely abolished in MMP-1
knockdown cells, whereas hypoxia-induced HIF-1α expression was
preserved in MMP-1 knockdown cells (Fig. 3B). Whether the HIF-1α inhibitor
YC-1 influences hypoxia-induced MMP-1 expression was next analyzed.
As shown in Fig. 3C, the
expression of both HIF-1α and MMP-1 was dose-dependently decreased
in YC-1-treated 58As9 cells under hypoxia. Taken together, these
results indicated that hypoxia-induced MMP-1 expression was
directly regulated by HIF-1α in 58As9 cells. To further investigate
the mechanisms underlying deficient MMP-1 expression in MKN45 and
MKN74 cells, the present study focused on epigenetic gene
silencing. Thus, whether MMP-1 expression was restored by treatment
with the demethylating agent 5-aza-dC and/or the histone
deacetylase inhibitor TSA in these cells was analyzed (Fig. 3D). In the two cell lines, MMP1
mRNA expression was significantly increased by either of these
treatments under normoxia and hypoxia compared with that in the
absence of treatment. In addition, combined treatment with 5-aza-dC
and TSA markedly increased MMP-1 expression compared with that upon
5-aza-dC or TSA treatment alone (Fig.
3D). However, the hypoxic induction of MMP-1 expression was not
observed in a series of experiments in the present study. In WB
analysis, combined 5-aza-dC and TSA treatments increased MMP-1
expression in MKN74 and MKN45 cells (Fig. 3E). This demonstrated that an
epigenetic mechanism is involved in the deficient MMP-1 expression
in MKN45 and MKN74 GC cells.
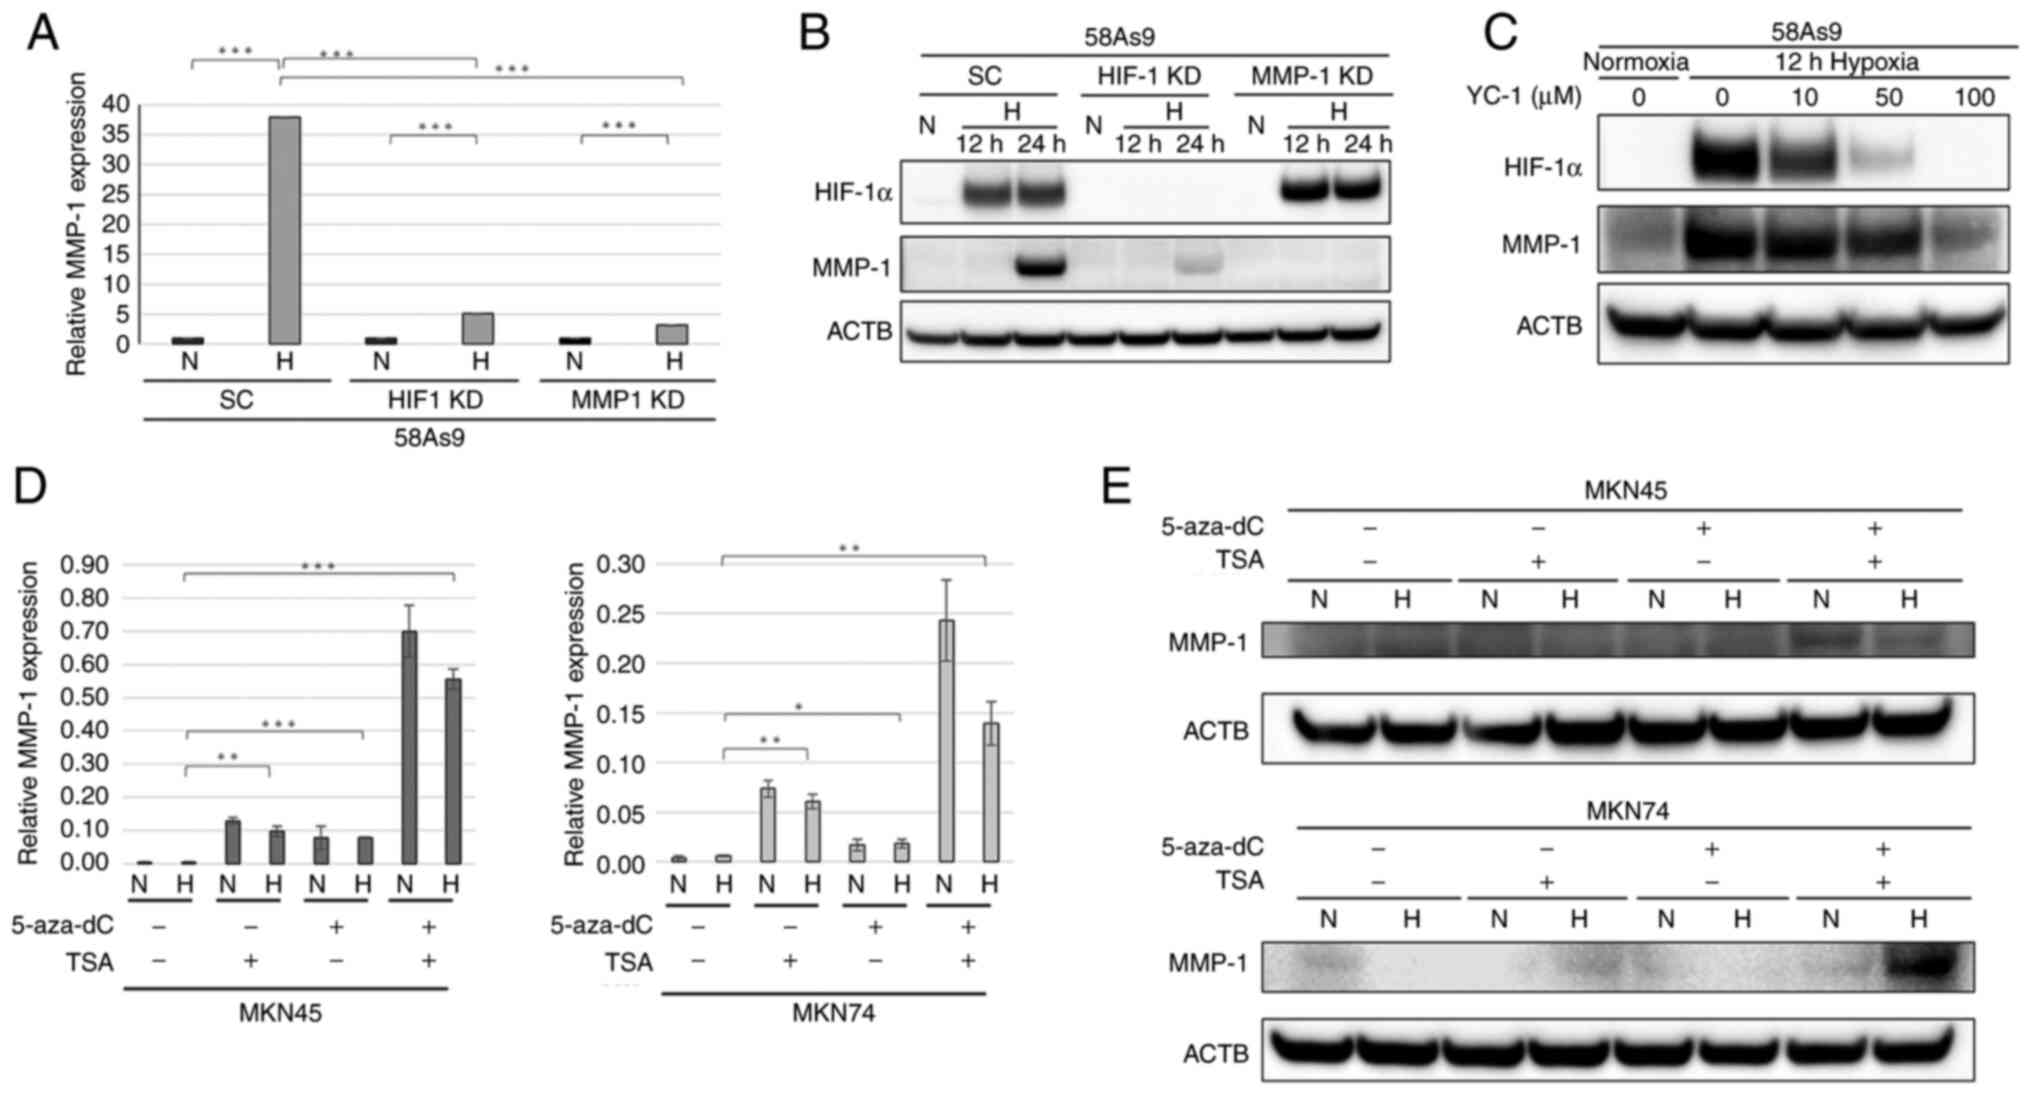 | Figure 3Assessment of MMP-1 expression in
HIF-1α knockdown and MMP-1 knockdown cells. (A) RT-qPCR of MMP-1 in
MMP-1 knockdown, HIF-1α knockdown and SC cells. (B) WB analysis of
MMP-1 and HIF-1α in MMP-1 knockdown and HIF-1α knockdown cells. SC
cells were used as a control. (C) WB analysis of HIF-1α and MMP-1
expression in 58As9 cells treated with YC-1 (0–100 µM) for 12 h
under normoxia and hypoxia. (D) RT-qPCR of MMP-1 in MKN45 and MKN74
cells treated with 5-Aza-dc (5 µM) for 72 h and/or TSA (500 nM) for
24 h. Mean ± standard error of the mean is plotted in the graph.
*P<0.05, **P<0.01,
***P<0.001. (E) WB analysis of MMP-1 expression in
MKN45 and MKN74 cells treated with 5-Aza-dc and/or TSA under
normoxia and hypoxia. MMP-1, matrix metalloproteinase-1; RT-qPCR,
reverse transcription-quantitative PCR; HIF-1α knockdown,
hypoxia-inducible factor-1α knockdown; WB, western blotting; SC,
scramble; N, normoxia; H, hypoxia; 5-aza-dC, 5-Aza-2-deoxycytidine;
TSA, Trichostatin A; ACTB, β-actin. |
Effects of MMP-1 knockdown on invasion
and proliferation of 58As9 cells
The effect of MMP-1 knockdown on cancer invasion and
proliferation was evaluated using MMP-1 knock- down and SC cells
(Fig. 4A). Hypoxia appeared to
increase the invasion of 58As9-SC cells (Fig. 4A). By contrast, the invasion of
MMP-1 knockdown cells was similar under normoxia and hypoxia
(Fig. 4A). Quantitatively, the
number of invaded SC cells was significantly elevated under hypoxia
compared with that under normoxia (Fig. 4B). However, the numbers of invaded
MMP-1 knockdown cells were similar under hypoxia and normoxia
(Fig. 4B). Consequently, the
number of invaded SC cells was significantly higher than that of
MMP-1 knockdown cells under hypoxia (Fig. 4B).
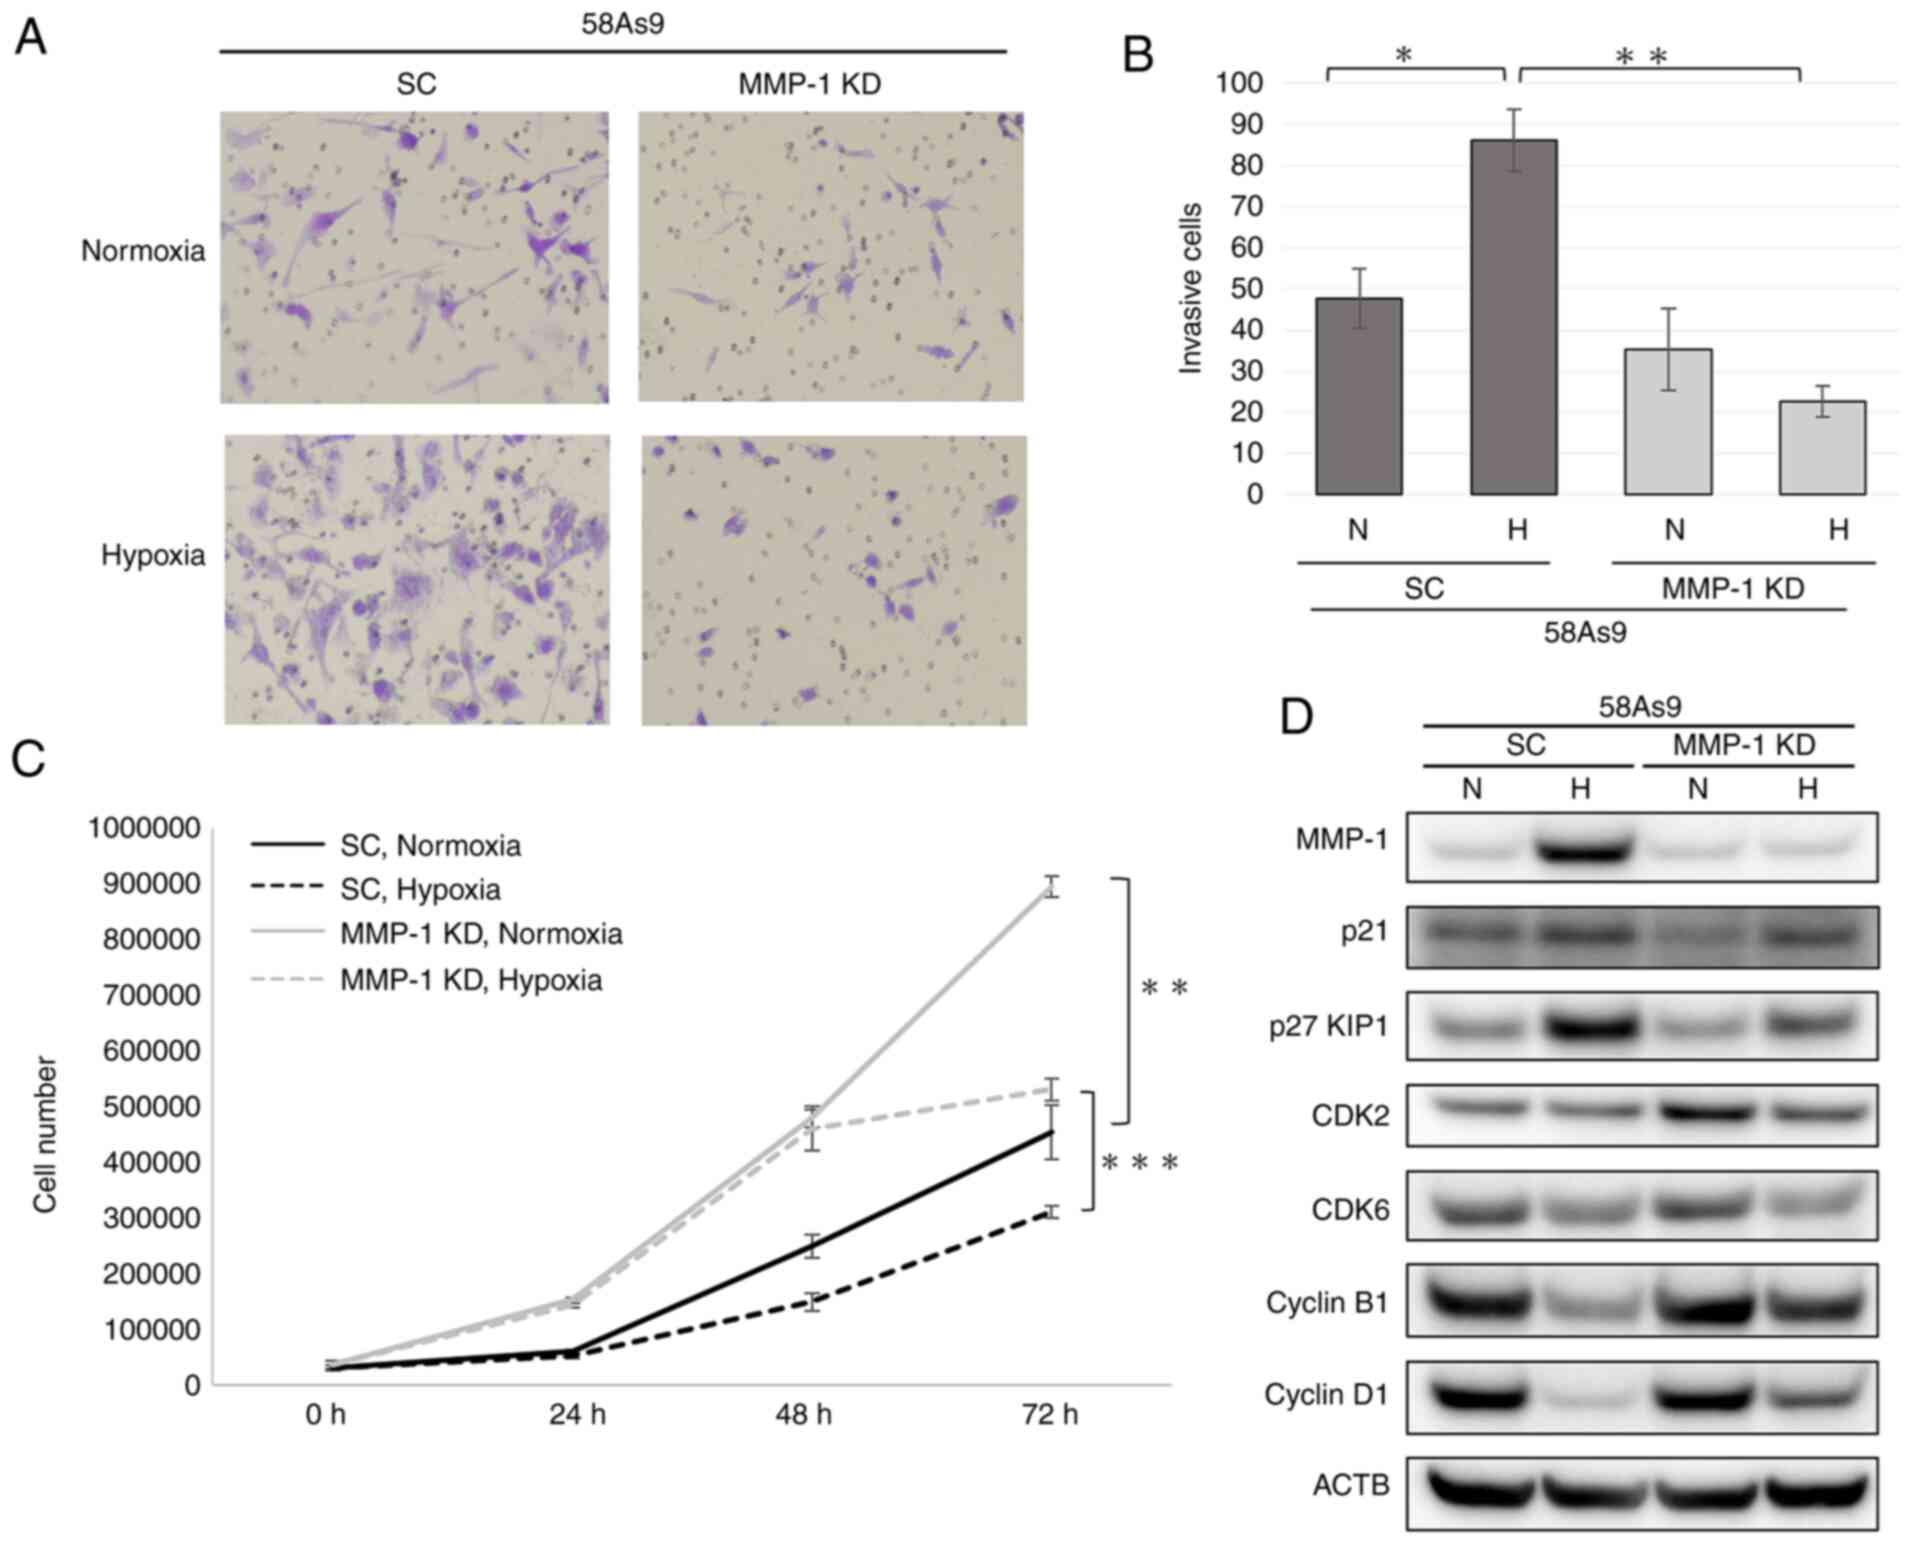 | Figure 4Assessment of the invasive and
proliferative abilities of MMP-1 knockdown cells. (A) Transwell
invasion assay of SC and MMP-1 knockdown cells after incubation
under normoxia or hypoxia for 24 h (magnification, ×20). (B)
Quantification of invaded cells. (C) Cell proliferation curve of SC
and MMP-1 knockdown cells. For each cell line, 5.0x10⁴
cells were incubated under normoxia or hypoxia for 24, 48 and 72 h.
Mean ± standard error of the mean was plotted in the graph.
*P<0.05, **P<0.01,
***P<0.001. (D) Western blot nalysis of cell
cycle-related proteins including p21, p27 KIP1, CDK2, CDK6, cyclin
B1 and cyclin D1 in MMP-1 knockdown and SC cells. MMP-1 expression
was confirmed in SC, but not in MMP-1 knockdown cells. MMP-1,
matrix metalloproteinase-1; SC, scramble; KD, knockdown; CDK,
cyclin-dependent kinase; N, normoxia; H, hypoxia; 5-aza-dC,
5-Aza-2-deoxycytidine; TSA, Trichostatin A; ACTB, β-actin. |
To evaluate the proliferative ability of SC and
MMP-1 knockdown cells, cell numbers were measured under normoxia
and hypoxia at 24, 48 and 72 h (Fig.
4C). At 72 h, the number of MMP-1 knockdown cells was
significantly higher than that of SC cells under both normoxia and
hypoxia (Fig. 4C).
To further investigate the difference of cell
proliferation between SC and MMP-1 knockdown cells, the expression
of cell cycle-related genes including p21, p27 KIP1,
cyclin-dependent kinase (CDK)2, CDK6, cyclin B1 and cyclin D1 was
assessed by WB (Fig. 4D). Under
normoxia, p21 expression was reduced in MMP-1 knockdown cells,
compared with that in SC cells. By contrast, CDK2 expression was
higher in MMP-1 knockdown compared with SC cells. Under hypoxia,
p27 KIP1 expression was attenuated in MMP-1 knockdown compared with
that in SC cells. However, the expression of cyclin B1 and cyclin
D1 was elevated in MMP-1 knockdown cells compared with that in SC
cells. These results indicated that the acceleration of cell growth
by MMP-1 knockdown may be due to the attenuation of p21 and
increased CDK2 expression under normoxia. Furthermore, reduced p27
KIP1 expression and increased cyclin B1 and cyclin D1 expression
may contribute to the higher growth of MMP-1 knockdown cells than
that of SC cells under hypoxia.
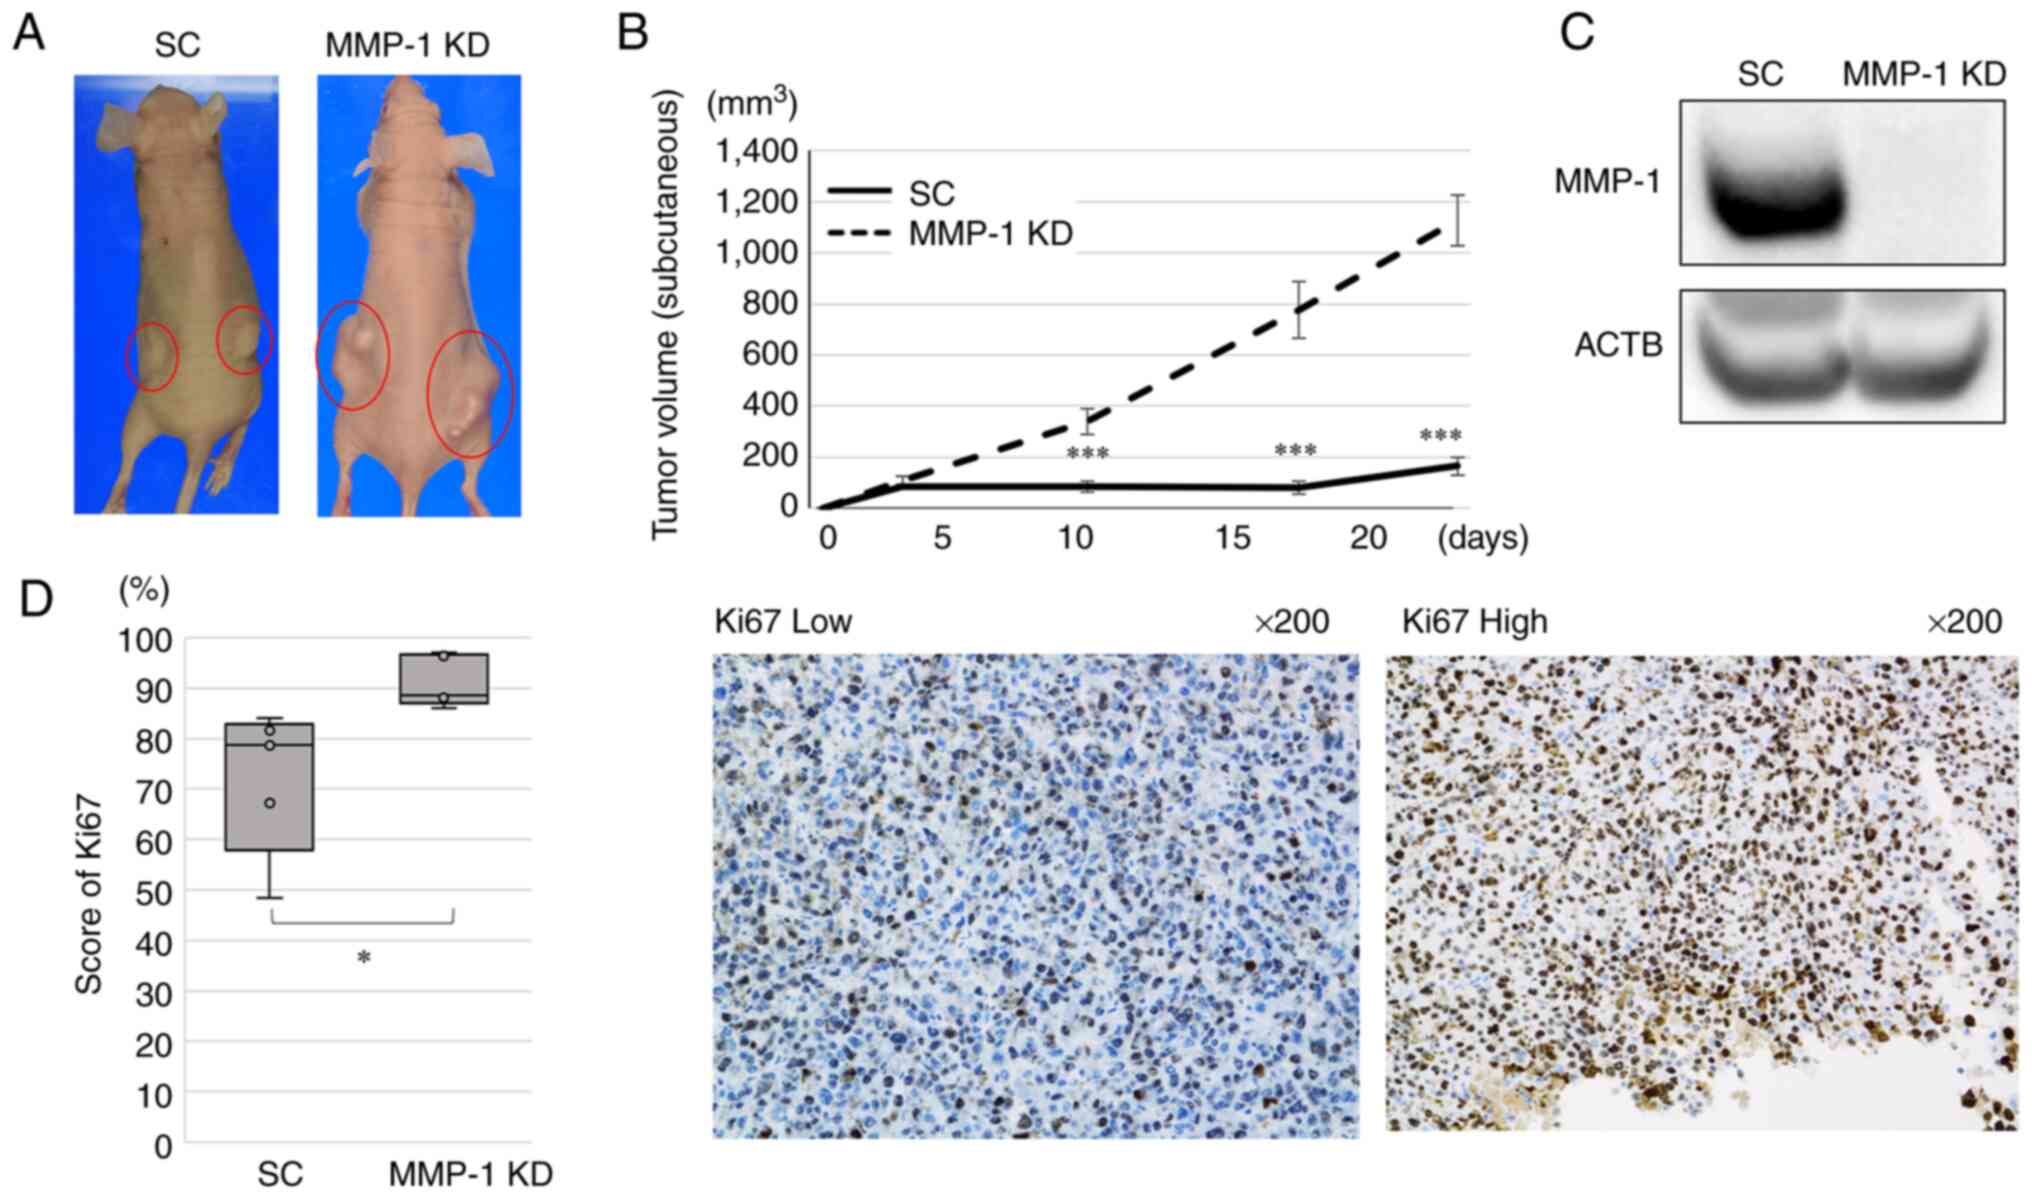
Effect of MMP-1 knockdown on the growth
of xenograft tumors in mice
The in vivo effect of MMP-1 knockdown on
tumor growth in mice was next evaluated. MMP-1 knockdown and 58As9
SC cells were subcutaneously injected into nude mice and the sizes
of subcutaneous tumors were measured. Then, 24 days after
subcutaneous injection, the xenograft tumors from MMP-1 knockdown
cells appeared larger than those from SC cells (Fig. 5A). The maximum diameter of the
tumor in all mice was 17 mm and the maximum volume was 1,601
mm3. The mean tumor volumes measured on days 10, 18 and
24 after the subcutaneous injection were significantly higher in
MMP-1 knockdown compared with SC tumors (Fig. 5B). WB analysis confirmed the
deficient MMP-1 expression in MMP-1 knockdown cells (Fig. 5C).
The number of Ki67-positive cells in the xenograft
tumors were estimated by IHC analysis. The mean score of Ki67 was
significantly higher in MMP-1 knockdown tumors (mean: 91.2%, range:
88.0–97.1%) compared with SC tumors (mean: 72.0%, range:
48.4–84.1%; P=0.025; Fig.
5D).
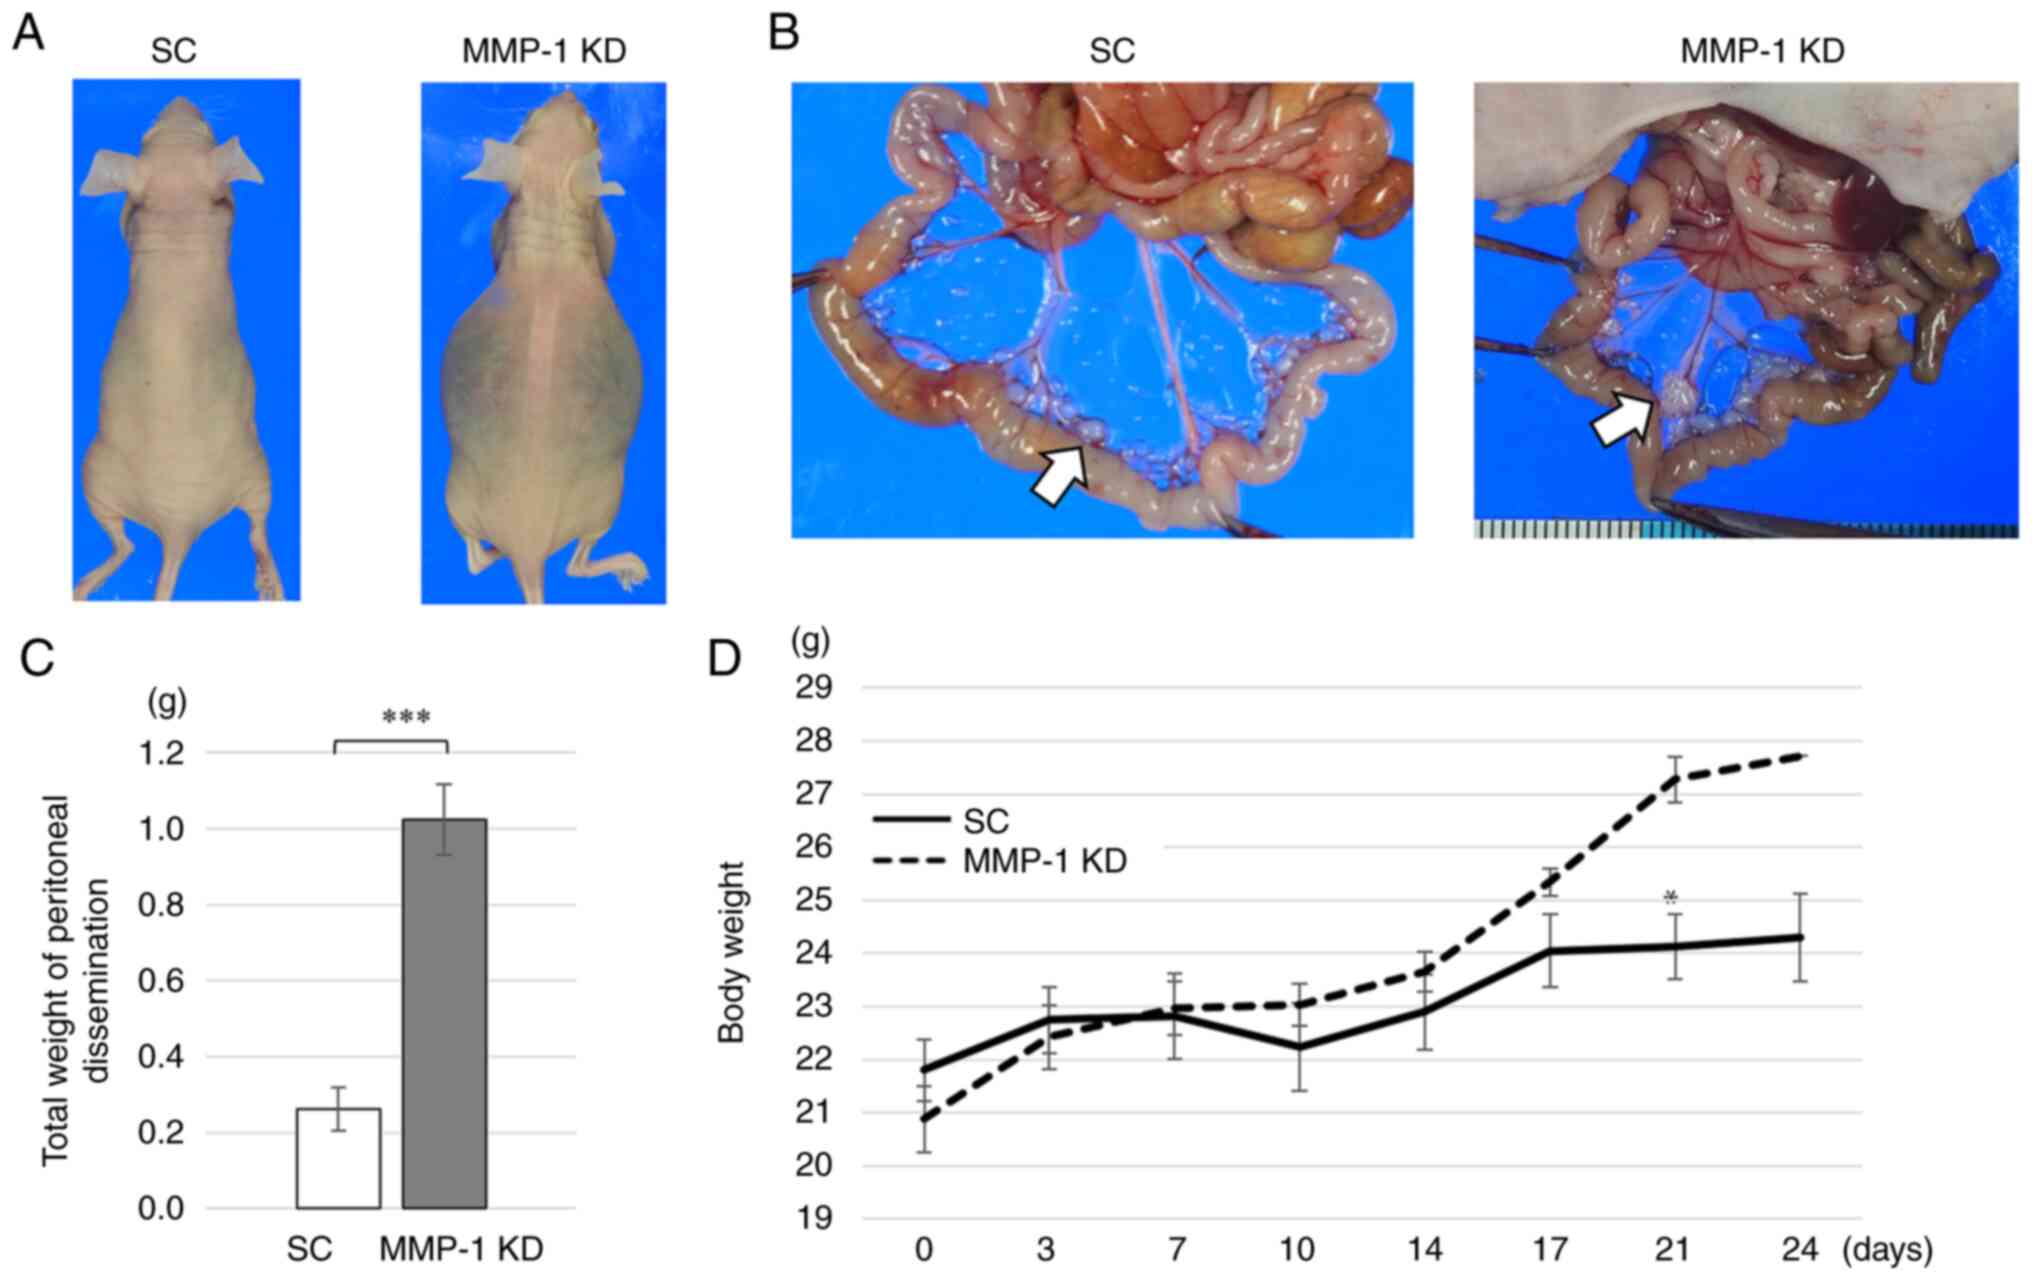
Effect of MMP-1 knockdown on development
of peritoneal dissemination in mice
MMP-1 knockdown and SC cells were intraperitoneally
injected into mice and the ability to form peritoneal dissemination
was evaluated. All mice intraperitoneally injected with MMP-1
knockdown developed ascites by day 25, whereas those with SC cells
did not (Fig. 6A). Disseminated
nodules in the peritoneal cavity were formed in all five mice
(100%) injected with MMP-1 knockdown, while they were observed in
three of the five mice (60%) injected with SC (Fig. 6B). The total weight of the
disseminated nodules was significantly greater in MMP-1 knockdown
(1.024 g) compared with SC (0.2618 g) (P<0.001) (Fig. 6C). Mean body weight of MMP-1
knockdown mice gradually increased with time due to the ascites
(Fig. 6D). On day 21, mean body
weight was significantly greater in MMP-knockdown compared with SC
mice (Fig. 6D).
IHC analysis of MMP-1 in GC tissues. MMP-1
expression levels were evaluated by IHC in 161 advanced GC tissues.
High MMP-1 expression was identified in 40 (24.8%) of the 161
patients, whereas low MMP-1 expression was observed in the rest.
Fig. 7 shows the IHC results of
MMP-1 expression. A representative tissue sample with low MMP-1
expression is shown in Fig. 7A.
By contrast, MMP-1 expression was observed in the cytoplasm of GC
cells in cases with high MMP-1 expression (Fig. 7B). Furthermore, MMP-1-positive
cells were mainly localized at the surface of cancer tissues
(Fig. 7C). In addition, MMP-1 was
not stained at the stroma in almost GC tissues, although it was
slightly stained in some cases (Fig.
7B and C). We further evaluated proliferation in 161 GC tissues
by Ki67 IHC analysis. The mean Ki67-positive rate was significantly
higher in the Low MMP-1 group (mean: 30.7%, range: 4.3–61.9%)
compared with the High group (mean: 20.7%, range: 2.7–52.5%;
P<0.001; Fig. 7D).
Relationship between MMP-1 expression and
clinicopathological factors
The associations of the MMP-1 expression level with
clinicopathological factors were statistically analyzed (Table II). MMP-1 expression was
significantly associated with age, histology and cancer recurrence
(Table II). The Low MMP-1 group
had a higher proportion of patients >70 years of age compared
with the High MMP-1 group (P=0.015). Regarding cancer histology,
the proportion of undifferentiated types was significantly higher
in the Low MMP-1 group (78/121, 64.5%) compared with the High MMP-1
group (17/40, 42.5%) (P=0.015). Recurrent cancer was more
frequently observed in the Low MMP-1 group (47/121, 38.8%) compared
with the High MMP-1 group (7/40, 17.5%) (P=0.009). In addition, 17
cases of peritoneal dissemination were observed among 54 cases of
recurrent cancer. Peritoneal dissemination demonstrated a tendency
to be more common in the Low MMP-1 group (12.4%) compared with the
High group (5.0%) (P=0.096).
| Table IICorrelation between MMP-1 expression
and clinicopathological features. |
Table II
Correlation between MMP-1 expression
and clinicopathological features.
| High MMP-1 (n=40)
| Low MMP-1 (n=121)
| P value |
|---|
| n | % | n | % |
|---|
| Age, years
(mean±SD) | 66.1±9.57 | | 69.4±11.59 | | 0.015 |
| <70 | 26 | 33.3 | 52 | 66.7 | |
| >70 | 14 | 16.9 | 69 | 83.1 | |
| Sex | | | | | 0.581 |
| Male | 28 | 26.2 | 79 | 73.8 | |
| Female | 12 | 22.2 | 42 | 77.8 | |
| Histology | | | | | 0.015 |
|
Differentiated | 23 | 34.8 | 43 | 65.2 | |
|
Undifferentiated | 17 | 17.9 | 78 | 82.1 | |
| Tumor depth | | | | | 0.146 |
| 2 | 14 | 33.3 | 28 | 66.7 | |
| 3/4 | 26 | 21.8 | 93 | 78.2 | |
| Lymph node
metastasis | | | | | 0.613 |
| No | 16 | 27.1 | 43 | 72.9 | |
| Yes | 24 | 23.5 | 78 | 76.5 | |
| Lymphatic
invasion | | | | | 0.651 |
| No | 9 | 27.3 | 24 | 72.7 | |
| Yes | 31 | 24.2 | 97 | 75.8 | |
| Vascular
invasion | | | | | 0.714 |
| No | 20 | 23.8 | 64 | 76.2 | |
| Yes | 20 | 26.3 | 56 | 73.7 | |
| Stage | | | | | 0.129 |
| I | 25 | 29.8 | 59 | 70.2 | |
| II/III | 15 | 19.5 | 62 | 80.5 | |
| Adjuvant
therapy | | | | | 0.383 |
| No | 22 | 22.4 | 76 | 77.6 | |
| Yes | 18 | 28.6 | 45 | 71.4 | |
| Recurrence | | | | | 0.009 |
| No | 33 | 30.8 | 74 | 69.2 | |
| Yes | 7 | 13.0 | 47 | 87.0 | |
| Peritoneal
dissemination | | | | | 0.096 |
| No | 38 | 26.4 | 106 | 73.6 | |
| Yes | 2 | 11.8 | 15 | 88.2 | |
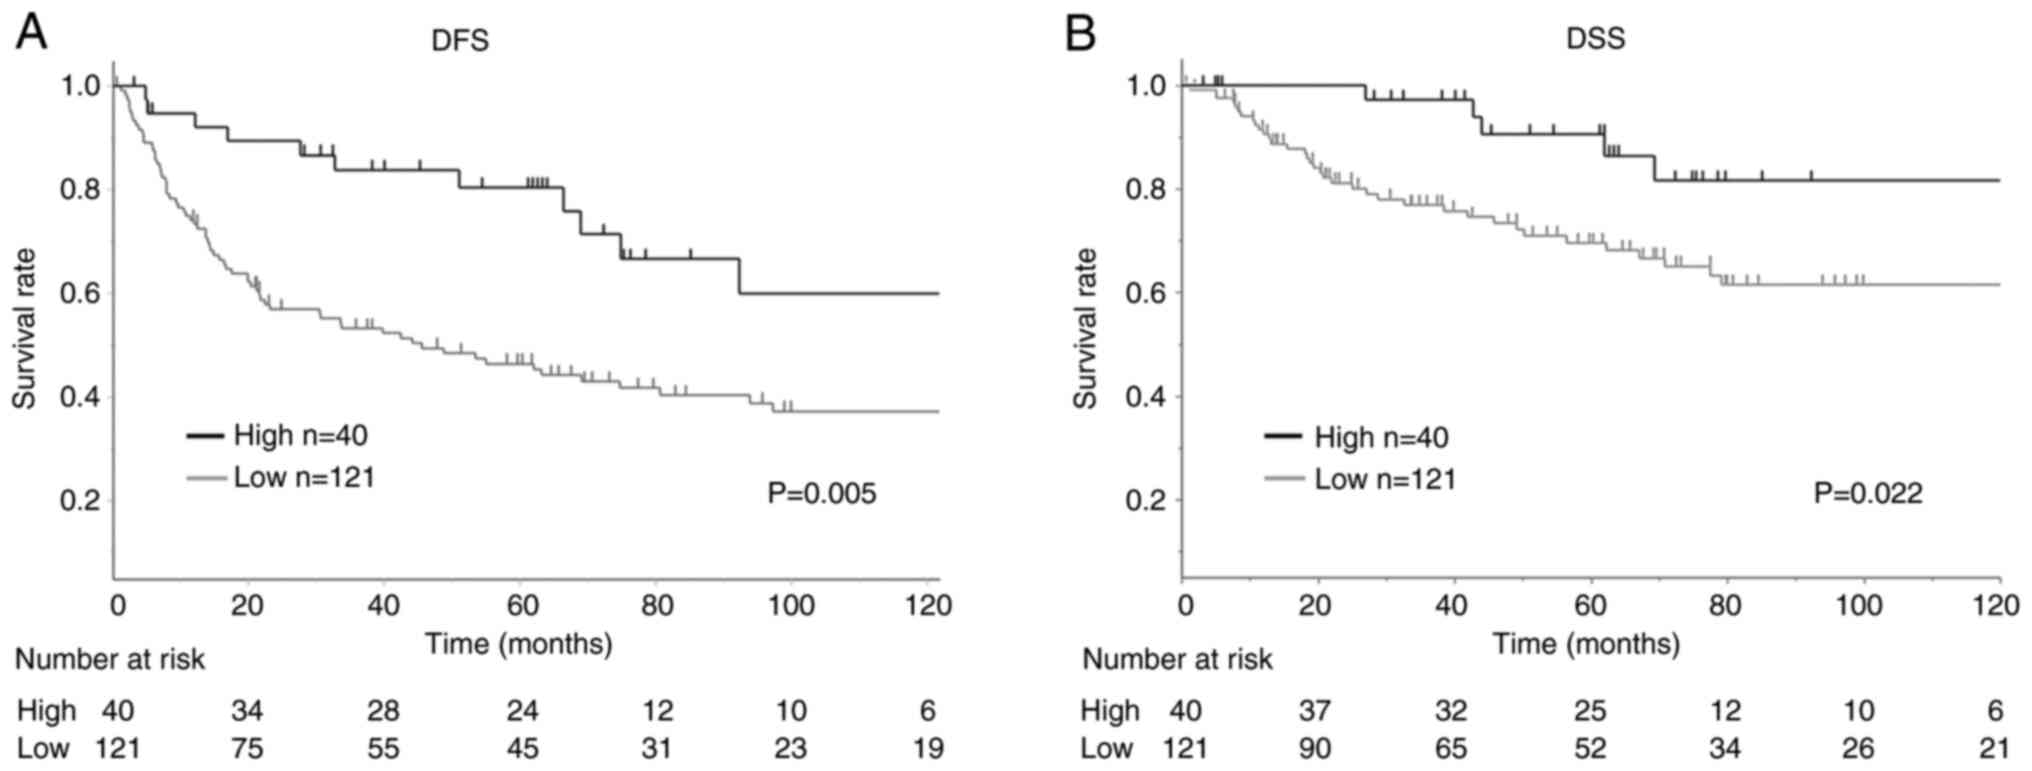
Relationship between MMP-1 expression and
patient survival
The association between patient survival and MMP-1
expression was analyzed in the 161 patients with advanced GC
(Fig. 8). Kaplan-Meier curve
analysis and log-rank test demonstrated that the DFS in GC patients
with low MMP-1 expression (n=121) was significantly shorter
compared with those with high expression (P=0.005) (Fig. 8A). The DSS was also shorter in
patients with low MMP-1 expression (n=121) compared with those with
high expression (n=40) (P=0.022) (Fig. 8B).
Univariate analysis of 161 patients demonstrated
that tumor depth (T), lymph node metastasis (N), lymphatic invasion
(Ly), stage and MMP-1 expression were significantly associated with
DFS (Table III). Multivariate
analysis further confirmed that N and MMP1 expression were factors
independently predictive of DFS (Table III). Another univariate analysis
demonstrated that T, N, Ly, vascular invasion (V), stage, adjuvant
chemotherapy and MMP-1 expression were significantly associated
with DSS (Table III). The
multivariate analysis revealed that N, V and MMP1 expression were
factors independently predictive of DSS (DFS: HR=2.111; 95% CI:
1.222–3.920; P=0.005; DSS: HR=2.899; 95% CI: 1.234–8.499; P=0.012;
Table III).
| Table IIIUnivariate and multivariate analysis
for disease free survival and disease specific survival in 161
patients. |
Table III
Univariate and multivariate analysis
for disease free survival and disease specific survival in 161
patients.
A. Disease free
survival
|
|---|
| Variable | Univariate
| Multivariate
|
|---|
| HR | 95% C.I. | P-value | HR | 95% C.I. | P-value |
|---|
| Age, years | | | | | | |
| <70 /
>70 | 0.745 | (0.484–1.142) | 0.177 | | | |
| Sex | | | | | | |
| Male/Female | 1.481 | (0.940–2.414) | 0.091 | | | |
| Histology | | | | | | |
|
Differentiated/Undifferentiated | 1.057 | (0.681–1.620) | 0.801 | | | |
| Tumor depth | | | | | | |
| 2/3–4 | 0.524 | (0.289–0.886) | 0.015 | 0.708 | (0.379–1.244) | 0.352 |
| Lymph node
metastasis | | | | | | |
| −/+ | 0.428 | (0.263–0.676) | <0.001 | 0.456 | (0.253–0.796) | 0,004 |
| Lymphatic
invasion | | | | | | |
| −/+ | 0.569 | (0.308–0.976) | 0.040 | 0.996 | (0.496–1.903) | 0.989 |
| Vascular
invasion | | | | | | |
| −/+ | 0.691 | (0.454–1.050) | 0.084 | 0.720 | (0.465–1.112) | 0.108 |
| Stage | | | | | | |
| I-II/III | 0.392 | (0.251–0.602) | <0.001 | | | |
| Adjuvant | | | | | | |
| −/+ | 0.675 | (0.445–1.029) | 0.067 | 1.055 | (0.646–1.710) | 0.760 |
| MMP1 | | | | | | |
| −/+ | 2.084 | (1.215–3.853) | 0.007 | 2.111 | (1.222–3.920) | 0.005 |
|
B. Disease specific
survival
|
| Variable | Univariate
| Multivariate
|
| HR | 95% C.I. | P-value | HR | 95% C.I. | P-value |
|
| Age, years | | | | | | |
| <70 | 0.915 | (0.491–1.698) | 0.778 | | | |
| >70 | | | | | | |
| Gender | | | | | | |
| Male/Female | 1.146 | (0.605–2.287) | 0.684 | | | |
| Histology | | | | | | |
|
Differentiated/Undifferentiated | 1.135 | (0.598–2.105) | 0.693 | | | |
| Tumor depth | | | | | | |
| 2/3–4 | 0.203 | (0.049–0.560) | <0.001 | 0.322 | (0.076–0.934) | 0.036 |
| Lymph node
metastasis | | | | | | |
| −/+ | 0.068 | (0.011–0.223) | <0.001 | 0.072 | (0.011–0.271) | <0.001 |
| Lymphatic
invasion | | | | | | |
| −/+ | 0.256 | (0.062–0.707) | 0.006 | 1.326 | (0.286–4.423) | 0.686 |
| Vascular
invasion | | | | | | |
| −/+ | 0.445 | (0.227–0.838) | 0.012 | 0.485 | (0.239–0.939) | 0.032 |
| Stage | | | | | | |
| I-II/III | 0.152 | (0.061–0.323) | <0.001 | | | |
| Adjuvant | | | | | | |
| −/+ | 0.478 | (0.254–0.889) | 0.019 | 1.108 | (0.564–2.124) | 0.760 |
| MMP1 | | | | | | |
| −/+ | 2.84 | (1.221–8.272) | 0.013 | 2.899 | (1.234–8.499) | 0.012 |
Discussion
The majority of solid tumors maintain growth under
hypoxic environments. Tumor hypoxia generally promotes the
malignant behavior of cancer cells, such as invasion and metastasis
(3). The present study analyzed
three GC cell lines: 58As9, MKN45 and MKN74. First, it demonstrated
the increased invasiveness of 58As9 cells under hypoxia, whereas
the other two cell lines-MKN45 and MKN74-exhibited limited
invasiveness. Next, it was attempted to identify an HIF-1α target
gene that is specifically expressed in 58As9 cells and required for
their enhanced invasion under hypoxia. RT-qPCR analysis of
invasion-related genes, such as RHOA, ROCK1, S100A4, UPAR, MMP-7,
MMP-14, AMFR, LOXL2, C-MET and MMP-1, was performed using three GC
cell lines (48–56). The results demonstrated that
hypoxia-induced elevation of MMP-1 mRNA occurred in 58As9 cells,
but not in the other two cell lines. By contrast, the other nine
genes did not show the hypoxia-induced elevation of the
corresponding mRNA specifically in 58As9 cells (data not shown).
Therefore, the present study focused on MMP-1 and investigated the
biological roles of GC cells under hypoxia. To clarify whether the
hypoxia-induced expression of MMP-1 was dependent on HIF-1α, HIF-1α
knockdown cells were generated. The results revealed that the
silencing of HIF-1α expression in HIF-1α knockdown cells markedly
attenuated MMP-1 expression. Furthermore, hypoxia-induced MMP-1
expression was suppressed by drug treatment with the HIF-1α
inhibitor YC-1 in parental 58As9 cells. These results clearly
demonstrated that MMP-1 expression was directly upregulated by
HIF-1α in hypoxic 58As9 cells. In addition, combination treatment
with 5-aza-dC and TSA significantly increased MMP-1 expression in
MMP-1-deficient MKN45 and MKN74 cells, which suggested that
epigenetic mechanisms, including chromatin supraorganization, may
play an important role in silencing MMP-1 expression (57,58). Previously, the upregulation of
MMP-1 by HIF-1α has been reported in metastatic bladder cancer
cells (59). Epigenetic
regulation of MMP-1 expression is also reported in a previous
study, in which 5-aza-dC plus TSA treatments increases MMP-1 mRNA
expression in a human fibrosarcoma cell line (58). The present study demonstrated that
both HIF-1α-dependent and epigenomic mechanisms are involved in
regulating MMP-1 expression in GC cell lines.
MMP-1 knockdown 58As9 cells were generated and the
effect of MMP-1 knockdown on cell invasion and proliferation
investigated. Hypoxia failed to enhance the invasiveness of MMP-1
knockdown cells, indicating that MMP-1 expression was essential for
hypoxia-enhanced invasion in 58As9 cells. MMP-1 is a proteolytic
enzyme that degrades type I and III collagens, which are the main
components of the GC stroma (60,61). These reports support the finding
of the present study that MMP-1 knockdown decreased the in
vitro invasion of MMP-1-expressing 58As9 cells. By contrast,
in vitro cell proliferation was increased in MMP-1 knockdown
cells under both normoxia and hypoxia compared with that in control
SC cells. It was further elucidated that the promotion of cell
proliferation by MMP-1 knockdown was derived from elevated
expression of the cell cycle activators cyclin D1 and cyclin B1 and
attenuated expression of the cell cycle repressors p21 and p27KIP1
(62–65). In nude mice, MMP-1 knockdown
xenograft tumors also exhibited accelerated growth compared with SC
tumors. The mean Ki67 score was higher in MMP-1 knockdown compared
with SC tumors. Taken together, these results constituted novel
evidence that MMP-1 acted as a suppressor of cell proliferation by
altering the expression of cell cycle-related proteins in 58As9 GC
cells.
Among cancer recurrences occurring in GC patients,
peritoneal dissemination is the most common type (66). The present study thus explored the
effect of MMP-1 knockdown on the development of peritoneal
dissemination. The results demonstrated that MMP-1 knockdown
accelerated the formation of peritoneal dissemination in mice,
compared with that for SC. The present study first demonstrated a
suppressive role of MMP-1 in cell proliferation in vitro,
tumor growth and development of peritoneal dissemination in mice,
although MMP-1 served a critical role in hypoxia-induced invasion
in 58As9 GC cell line in vitro. Peritoneal dissemination is
hypothesized to develop through a direct seeding mechanism, which
is composed of several steps including cancer invasion, attachment
and proliferation distant peritoneum (67). The loss of MMP-1 expression in
MMP-1 knockdown cells may increase adhesion and proliferation on
the peritoneal peritoneum, while the loss may attenuate
invasiveness.
On the basis of these findings in GC cell lines, the
relationship between the IHC expression of MMP-1 and clinical
outcomes of GC patients was investigated. Regarding
clinicopathological factors, MMP-1 expression was significantly
associated with age, histology and cancer recurrence. Studies using
cancer tissues have reported that T, V and Ly are important
parameters for cancer invasion (68). However, MMP-1 expression was not
significantly associated with these invasion parameters in 161 GC
tissues. One possible explanation of this is that the positive
immunostaining for MMP-1 was mainly observed at the tumor surface
rather than deeper areas, including the invasive tumor front.
Therefore, MMP-1 expression may not be responsible for tumor
invasion and the expression was not significantly associated with
the invasion-related clinicopathological parameters. In addition,
MMP-1 expression did not show a significant correlation with HIF-1α
expression (data not shown), which was previously analyzed using
the same 161 GC tissues (69).
One possible reason for this result is that, in GC tissues, MMP-1
expression is regulated not only by HIF-1α, but also by an
epigenetic mechanism. Methylation analysis of the MMP-1 gene
promoter may be necessary to explain this finding. By contrast, the
mean Ki67 score in the 161 GC tissues was higher in the Low MMP-1
group compared with the High group (P<0.001). This may be
consistent with the findings in the mouse xenograft model. In
addition, patients with low MMP-1 expression exhibited
significantly higher recurrence rates, indicating that GC with low
MMP-1 expression has higher malignant potential than that with high
expression. Among the cancer recurrences, the occurrence of
peritoneal dissemination was more frequently observed in the Low
MMP-1 group compared with the High group, although this did not
reach statistical significance. This result may support the
findings in nude mice. It may be necessary to analyze more GC
patients in order to clarify the significance of this relationship.
The present study analyzed the association between MMP-1 expression
and patient survival. DFS and DSS were significantly shorter in the
Low MMP-1 expression group compared with the High group.
Multivariate analysis demonstrated that MMP-1 expression was an
independent determinant of both DFS and DSS. IHC studies using
cancer tissues previously identified a significant relationship
between MMP-1 expression and patient outcome (34–45). In the majority of these studies, a
significant association between high MMP-1 expression and poor
patient prognosis was reported in esophageal, gallbladder and
hepatocellular carcinoma (35,36,39). By contrast, another study reported
that high MMP-1 expression is significantly associated with an
improved prognosis in prostate cancer (38), which appears to support the
findings of the present study. In addition, Kosaka et al
(70) reported that high level of
MMP-1 mRNA expression in GC patients demonstrates a significant
association with clinical stage and distant metastasis, although
they analyzed expression of MMP-1 mRNA in bone marrow and
peripheral blood, not in primary GC tissues. This shows that there
is still controversy about the effect of MMP-1 expression on
survival of patient with cancers.
In conclusion, the present study reported that MMP-1
expression was regulated in a distinct process by HIF-1α-dependent
and epigenomic mechanisms in GC cells. MMP-1 expression increased
hypoxia-induced cancer invasion but inhibited the proliferation of
58As9 GC cells. Furthermore, MMP-1 expression acted as a repressor
of xenograft tumor growth and the development of peritoneal
dissemination in nude mice. In the IHC study of GC tissues, MMP-1
expression was also associated with reduced cell proliferation and
identified as an independent factor associated with favorable
patient outcomes. As IHC analysis revealed that MMP-1 is expressed
at the tumor surface, but not at the cancer invasive front, the
invasion-promoting ability of this enzyme may not be exhibited in
GC tissues. However the present study may not have completely
elucidated the precise mechanism by which Low MMP-1 expression
contributed to increasing malignant potential in GC. In the future,
an in silico analysis on the Cancer Genome Atlas data for GC
patients may be required to evaluate implication of MMP-1
expression in GC progression. Taking the findings of the present
study together, MMP-1 may act as a tumor suppressor in GC, although
it is generally known to promote invasion in other cancer types.
The assessment of MMP-1 expression in resected GC tissues may
contribute to predicting cancer recurrence. If low MMP-1 expression
is detected, postoperative chemotherapy may be considered, unless
the cancer stage is low.
Availability of data and materials
The datasets generated and/or analyzed during the
current study are available from the corresponding author on
reasonable request.
Authors' contributions
YK and KI conceived and designed the experiments.
KI, KK, NE, HK, KO, KY and SM performed the experiments. YK, KI, TT
and HN analyzed the data. KK contributed reagents, materials, or
analytical tools. KI and YK wrote the paper. KI and YK confirm the
authenticity of all the raw data. All authors reviewed and approved
the final manuscript.
Ethics approval and consent to
participate
Informed consent to use the tissue specimens was
obtained from each patient. The study was approved by the Ethics
Committee of Saga University, Faculty of Medicine (approval no.
2020–10-R-03) and performed in accordance with the Declaration of
Helsinki and current ethical guidelines. All animal protocols were
approved by the Animal Care Committee of Saga University (approval
no. A2020-015-0).
Patient consent for publication
Not applicable.
Competing interests
The authors declare that they have no competing
interests.
Acknowledgments
The authors would like to thank Dr Kazuyoshi
Yanagihara (National Cancer Institute, Tokyo, Japan) for providing
the GC cell line 58As9.
Funding
The present study was financially supported by JSPS KAKENHI
Grant-in-Aid for Scientific Research (research project no.
18K08650).
Abbreviations:
|
ACTB
|
β-actin;
|
|
AMFR
|
autocrine motility factor
receptor;
|
|
C-MET
|
c-Mesenchymal-epithelial transition
factor;
|
|
DFS
|
disease-free survival;
|
|
DSS
|
disease-specific survival;
|
|
GC
|
gastric cancer;
|
|
HIF-1α
|
hypoxia-inducible factor-1α
|
|
IHC
|
immunohistochemistry;
|
|
LOXL2
|
lysyl oxidase-like 2;
|
|
Ly
|
lymphatic invasion;
|
|
MMP
|
matrix metalloproteinase;
|
|
N
|
lymph node metastasis;
|
|
RHOA
|
Ras homolog family member A;
|
|
ROCK1
|
ρ-associated protein kinase 1;
|
|
RT-qPCR
|
reverse-transcription quantitative
polymerase chain reaction;
|
|
SC
|
scramble;
|
|
T
|
tumor depth;
|
|
TSA
|
Trichostatin A;
|
|
WB
|
western blotting;
|
|
UPAR
|
urokinase-type plasminogen activator
receptor;
|
|
V
|
vascular invasion;
|
|
5-aza-dC
|
5-Aza-2-deoxycytidine
|
References
|
1
|
Smyth EC, Nilsson M, Grabsch HI, van
Grieken NC and Lordick F: Gastric cancer. Lancet. 396:635–648.
2020. View Article : Google Scholar : PubMed/NCBI
|
|
2
|
Karimi P, Islami F, Anandasabapathy S,
Freedman ND and Kamangar F: Gastric cancer: Descriptive
epidemiology, risk factors, screening, and prevention. Cancer
Epidemiol Biomarkers Prev. 23:700–713. 2014. View Article : Google Scholar : PubMed/NCBI
|
|
3
|
Harris AL: Hypoxia-a key regulatory factor
in tumour growth. Nat Rev Cancer. 2:38–47. 2002. View Article : Google Scholar : PubMed/NCBI
|
|
4
|
Lu X and Kang Y: Hypoxia and
hypoxia-inducible factors: Master regulators of metastasis. Clin
Cancer Res. 16:5928–5935. 2010. View Article : Google Scholar : PubMed/NCBI
|
|
5
|
Poellinger L and Johnson RS: HIF-1 and
hypoxic response: The plot thickens. Curr Opin Genet Dev. 14:81–85.
2004. View Article : Google Scholar : PubMed/NCBI
|
|
6
|
Majmundar AJ, Wong WJ and Simon MC:
Hypoxia-inducible factors and the response to hypoxic stress. Mol
Cell. 40:294–309. 2010. View Article : Google Scholar : PubMed/NCBI
|
|
7
|
Semenza GL, Jiang BH, Leung SW, Passantino
R, Concordet JP, Maire P and Giallongo A: Hypoxia response elements
in the aldolase A, enolase 1, and lactate dehydrogenase A gene
promoters contain essential binding sites for hypoxia-inducible
factor 1. J Biol Chem. 271:32529–32537. 1996. View Article : Google Scholar : PubMed/NCBI
|
|
8
|
Comerford KM, Wallace TJ, Karhausen J,
Louis NA, Montalto MC and Colgan SP: Hypoxia-inducible
factor-1-dependent regulation of the multidrug resistance (MDR1)
gene. Cancer Res. 62:3387–3394. 2002.PubMed/NCBI
|
|
9
|
Ide T, Kitajima Y, Miyoshi A, Ohtsuka T,
Mitsuno M, Ohtaka K, Koga Y and Miyazaki K: Tumor-stromal cell
interaction under hypoxia increases the invasiveness of pancreatic
cancer cells through the hepatocyte growth factor/c-Met pathway.
Int J Cancer. 119:2750–2759. 2006. View Article : Google Scholar : PubMed/NCBI
|
|
10
|
Hara S, Nakashiro K, Klosek SK, Ishikawa
T, Shintani S and Hamakawa H: Hypoxia enhances c-Met/HGF receptor
expression and signaling by activating HIF-1alpha in human salivary
gland cancer cells. Oral Oncol. 42:593–598. 2006. View Article : Google Scholar : PubMed/NCBI
|
|
11
|
Forsythe JA, Jiang BH, Iyer NV, Agani F,
Leung SW, Koos RD and Semenza GL: Activation of vascular
endothelial growth factor gene transcription by hypoxia-inducible
factor 1. Mol Cell Biol. 16:4604–4613. 1996. View Article : Google Scholar : PubMed/NCBI
|
|
12
|
Stoeltzing O, McCarty MF, Wey JS, Fan F,
Liu W, Belcheva A, Bucana CD, Semenza GL and Ellis LM: Role of
hypoxia-inducible factor 1alpha in gastric cancer cell growth,
angiogenesis, and vessel maturation. J Natl Cancer Inst.
96:946–956. 2004. View Article : Google Scholar : PubMed/NCBI
|
|
13
|
Vaupel P, Mayer A and Höckel M: Tumor
hypoxia and malignant progression. Methods Enzymol. 381:335–354.
2004. View Article : Google Scholar : PubMed/NCBI
|
|
14
|
Kitajima Y and Miyazaki K: The critical
impact of HIF-1a on gastric cancer biology. Cancers (Basel).
5:15–26. 2013. View Article : Google Scholar
|
|
15
|
Rankin EB and Giaccia AJ: Hypoxic control
of metastasis. Science. 352:175–180. 2016. View Article : Google Scholar : PubMed/NCBI
|
|
16
|
Semenza GL: Targeting HIF-1 for cancer
therapy. Nat Rev Cancer. 3:721–732. 2003. View Article : Google Scholar : PubMed/NCBI
|
|
17
|
Singh D, Srivastava SK, Chaudhuri TK and
Upadhyay G: Multifaceted role of matrix metalloproteinases (MMPs).
Front Mol Biosci. 2:192015. View Article : Google Scholar : PubMed/NCBI
|
|
18
|
Brown PD: Matrix metalloproteinases in
gastrointestinal cancer. Gut. 43:161–163. 1998. View Article : Google Scholar
|
|
19
|
Gialeli C, Theocharis AD and Karamanos NK:
Roles of matrix metalloproteinases in cancer progression and their
pharmacological targeting. FEBS J. 278:16–27. 2011. View Article : Google Scholar
|
|
20
|
Page-McCaw A, Ewald AJ and Werb Z: Matrix
metalloproteinases and the regulation of tissue remodelling. Nat
Rev Mol Cell Biol. 8:221–233. 2007. View Article : Google Scholar : PubMed/NCBI
|
|
21
|
McCawley LJ and Matrisian LM: Matrix
metalloproteinases: They're not just for matrix anymore! Curr Opin
Cell Biol. 13:534–540. 2001. View Article : Google Scholar : PubMed/NCBI
|
|
22
|
Boire A, Covic L, Agarwal A, Jacques S,
Sherifi S and Kuliopulos A: PAR1 is a matrix metalloprotease-1
receptor that promotes invasion and tumorigenesis of breast cancer
cells. Cell. 120:303–313. 2005. View Article : Google Scholar : PubMed/NCBI
|
|
23
|
Shintani T, Kusuhara Y, Daizumoto K,
Dondoo TO, Yamamoto H, Mori H, Fukawa T, Nakatsuji H, Fukumori T,
Takahashi M and Kanayama H: The involvement of hepatocyte growth
Factor-MET-Matrix metalloproteinase 1 signaling in bladder cancer
invasiveness and proliferation. Effect of the MET inhibitor,
cabozantinib (XL184), on bladder cancer cells. Urology.
101:169.e7–169.e13. 2017. View Article : Google Scholar
|
|
24
|
Wang J, Liu D, Zhou W, Wang M, Xia W and
Tang Q: Prognostic value of matrix
metalloprotease-1/protease-activated receptor-1 axis in patients
with prostate cancer. Med Oncol. 31:9682014. View Article : Google Scholar : PubMed/NCBI
|
|
25
|
Wang QM, Lv L, Tang Y, Zhang L and Wang
LF: MMP-1 is overexpressed in triple-negative breast cancer tissues
and the knockdown of MMP-1 expression inhibits tumor cell malignant
behaviors in vitro. Oncol Lett. 17:1732–1740. 2019.PubMed/NCBI
|
|
26
|
Yamamoto H, Itoh F, Iku S, Adachi Y,
Fukushima H, Sasaki S, Mukaiya M, Hirata K and Imai K: Expression
of matrix metalloproteinases and tissue inhibitors of
metalloproteinases in human pancreatic adenocarcinomas:
Clinicopathologic and prognostic significance of matrilysin
expression. J Clin Oncol. 19:1118–1127. 2001. View Article : Google Scholar : PubMed/NCBI
|
|
27
|
Pittayapruek P, Meephansan J, Prapapan O,
Komine M and Ohtsuki M: Role of matrix metalloproteinases in
photoaging and photocarcinogenesis. Int J Mol Sci. 17:8682016.
View Article : Google Scholar :
|
|
28
|
Wang K, Zheng J, Yu J, Wu Y, Guo J, Xu Z
and Sun X: Knockdown of MMP-1 inhibits the progression of
colorectal cancer by suppressing the PI3K/Akt/c-myc signaling
pathway and EMT. Oncol Rep. 43:1103–1112. 2020.PubMed/NCBI
|
|
29
|
Grimm M, Lazariotou M, Kircher S, Stuermer
L, Reiber C, Höfelmayr A, Gattenlöhner S, Otto C, Germer CT and von
Rahden BH: MMP-1 is a (pre-)invasive factor in Barrett-associated
esophageal adenocarcinomas and is associated with positive lymph
node status. J Transl Med. 8:992010. View Article : Google Scholar : PubMed/NCBI
|
|
30
|
Eiró N, González LO, Atienza S,
González-Quintana JM, Beridze N, Fernandez-Garcia B,
Pérez-Fernández R, García-Caballero T, Schneider J and Vizoso FJ:
Prediction of metastatic breast cancer in non-sentinel lymph nodes
based on metalloprotease-1 expression by the sentinel lymph node.
Eur J Cancer. 49:1009–1017. 2013. View Article : Google Scholar
|
|
31
|
Bianco BC, Scotti FM, Vieira DS, Biz MT,
Castro RG and Modolo F: Immunohistochemical expression of matrix
metalloproteinase-1, matrix metalloproteinase-2 and matrix
metalloproteinase-9, myofibroblasts and Ki-67 in actinic cheilitis
and lip squamous cell carcinoma. Int J Exp Pathol. 96:311–318.
2015. View Article : Google Scholar : PubMed/NCBI
|
|
32
|
Hanrahan K, O'Neill A, Prencipe M, Bugler
J, Murphy L, Fabre A, Puhr M, Culig Z, Murphy K and Watson RW: The
role of epithelial-mesenchymal transition drivers ZEB1 and ZEB2 in
mediating docetaxel-resistant prostate cancer. Mol Oncol.
11:251–265. 2017. View Article : Google Scholar : PubMed/NCBI
|
|
33
|
Lassig AAD, Joseph AM, Lindgren BR and
Yueh B: Association of oral cavity and oropharyngeal cancer
biomarkers in surgical drain fluid with patient outcomes. JAMA
Otolaryngol Head Neck Surg. 143:670–678. 2017. View Article : Google Scholar : PubMed/NCBI
|
|
34
|
Kim M, Kim HJ, Choi BY, Kim JH, Song KS,
Noh SM, Kim JC, Han DS, Kim SY and Kim YS: Identification of
potential serum biomarkers for gastric cancer by a novel
computational method, multiple normal tissues corrected
differential analysis. Clin Chim Acta. 413:428–433. 2012.
View Article : Google Scholar
|
|
35
|
Altadill A, Rodriguez M, Gonzalez LO,
Junquera S, Corte MD, González-Dieguez ML, Linares A, Barbón E,
Fresno-Forcelledo M, Rodrigo L and Vizoso FJ: Liver expression of
matrix metalloproteases and their inhibitors in hepatocellular
carcinoma. Dig Liver Dis. 41:740–748. 2009. View Article : Google Scholar : PubMed/NCBI
|
|
36
|
Du X, Wang S, Lu J, Cao Y, Song N, Yang T,
Dong R, Zang L, Yang Y, Wu T and Li J: Correlation between
MMP1-PAR1 axis and clinical outcome of primary gallbladder
carcinoma. Jpn J Clin Oncol. 41:1086–1093. 2011. View Article : Google Scholar : PubMed/NCBI
|
|
37
|
Mizrachi A, Koren R, Hadar T, Yaniv E,
Morgenstern S and Shvero J: Expression of MMP-1 in invasive
well-differentiated thyroid carcinoma. Eur Arch Otorhinolaryngol.
268:131–135. 2011. View Article : Google Scholar
|
|
38
|
Ozden F, Saygin C, Uzunaslan D, Onal B,
Durak H and Aki H: Expression of MMP-1, MMP-9 and TIMP-2 in
prostate carcinoma and their influence on prognosis and survival. J
Cancer Res Clin Oncol. 139:1373–1382. 2013. View Article : Google Scholar : PubMed/NCBI
|
|
39
|
Murray GI, Duncan ME, O'Neil P, McKay JA,
Melvin WT and Fothergill JE: Matrix metalloproteinase-1 is
associated with poor prognosis in oesophageal cancer. J Pathol.
185:256–261. 1998. View Article : Google Scholar : PubMed/NCBI
|
|
40
|
Murray GI, Duncan ME, O'Neil P, Melvin WT
and Fothergill JE: Matrix metalloproteinase-1 is associated with
poor prognosis in colorectal cancer. Nat Med. 2:461–462. 1996.
View Article : Google Scholar : PubMed/NCBI
|
|
41
|
Inoue T, Yashiro M, Nishimura S, Maeda K,
Sawada T, Ogawa Y, Sowa M and Chung KH: Matrix metalloproteinase-1
expression is a prognostic factor for patients with advanced
gastric cancer. Int J Mol Med. 4:73–77. 1999.PubMed/NCBI
|
|
42
|
Wang J, Ye C, Lu D, Chen Y, Jia Y, Ying X,
Xiong H, Zhao W, Zhou J and Wang L: Matrix metalloproteinase-1
expression in breast carcinoma: A marker for unfavorable prognosis.
Oncotarget. 8:91379–91390. 2017. View Article : Google Scholar : PubMed/NCBI
|
|
43
|
Liu M, Hu Y, Zhang MF, Luo KJ, Xie XY, Wen
J, Fu JH and Yang H: MMP1 promotes tumor growth and metastasis in
esophageal squamous cell carcinoma. Cancer Lett. 377:97–104. 2016.
View Article : Google Scholar : PubMed/NCBI
|
|
44
|
Langenskiöld M, Ivarsson ML, Holmdahl L,
Falk P, Kåbjörn-Gustafsson C and Angenete E: Intestinal mucosal
MMP-1-a prognostic factor in colon cancer. Scand J Gastroenterol.
48:563–569. 2013. View Article : Google Scholar
|
|
45
|
Fujimoto D, Hirono Y, Goi T, Katayama K
and Yamaguchi A: Prognostic value of protease-activated receptor-1
(PAR-1) and matrix metalloproteinase-1 (MMP-1) in gastric cancer.
Anticancer Res. 28:847–854. 2008.PubMed/NCBI
|
|
46
|
Tanaka T, Kitajima Y, Miyake S, Yanagihara
K, Hara H, Nishijima-Matsunobu A, Baba K, Shida M, Wakiyama K,
Nakamura J and Noshiro H: The apoptotic effect of HIF-1α inhibition
combined with glucose plus insulin treatment on gastric cancer
under hypoxic conditions. PLoS One. 10:e01372572015. View Article : Google Scholar
|
|
47
|
Livak KJ and Schmittgen TD: Analysis of
relative gene expression data using real-time quantitative PCR and
the 2(-Delta Delta C(T)) method. Methods. 25:402–408. 2001.
View Article : Google Scholar
|
|
48
|
Karlsson R, Pedersen ED, Wang Z and
Brakebusch C: Rho GTPase function in tumorigenesis. Biochim Biophys
Acta. 1796:91–98. 2009.PubMed/NCBI
|
|
49
|
Martin DN, Boersma BJ, Yi M, Reimers M,
Howe TM, Yfantis HG, Tsai YC, Williams EH, Lee DH, Stephens RM, et
al: Differences in the tumor microenvironment between
African-American and European-American breast cancer patients. PLoS
One. 4:e45312009. View Article : Google Scholar : PubMed/NCBI
|
|
50
|
Hu C, Zhou H, Liu Y, Huang J, Liu W, Zhang
Q, Tang Q, Sheng F, Li G and Zhang R: ROCK1 promotes migration and
invasion of non-small-cell lung cancer cells through the
PTEN/PI3K/FAK pathway. Int J Oncol. 55:833–844. 2019.PubMed/NCBI
|
|
51
|
Fei F, Qu J, Zhang M, Li Y and Zhang S:
S100A4 in cancer progression and metastasis: A systematic review.
Oncotarget. 8:73219–73239. 2017. View Article : Google Scholar : PubMed/NCBI
|
|
52
|
Cho JY, Chung HC, Noh SH, Roh JK, Min JS
and Kim BS: High level of urokinase-type plasminogen activator is a
new prognostic marker in patients with gastric carcinoma. Cancer.
79:878–883. 1997. View Article : Google Scholar : PubMed/NCBI
|
|
53
|
Zheng HC, Sun JM, Li XH, Yang XF, Zhang YC
and Xin Y: Role of PTEN and MMP-7 expression in growth, invasion,
metastasis and angiogenesis of gastric carcinoma. Pathol Int.
53:659–666. 2003. View Article : Google Scholar : PubMed/NCBI
|
|
54
|
Valacca C, Tassone E and Mignatti P:
TIMP-2 Interaction with MT1-MMP Activates the AKT Pathway and
protects tumor cells from apoptosis. PLoS One. 10:e01367972015.
View Article : Google Scholar : PubMed/NCBI
|
|
55
|
Pasquini G and Giaccone G: C-MET
inhibitors for advanced non-small cell lung cancer. Expert Opin
Investig Drugs. 27:363–375. 2018. View Article : Google Scholar : PubMed/NCBI
|
|
56
|
Wen B, Xu LY and Li EM: LOXL2 in cancer:
Regulation, downstream effectors and novel roles. Biochim Biophys
Acta Rev Cancer. 1874:1884352020. View Article : Google Scholar : PubMed/NCBI
|
|
57
|
Poplineau M, Schnekenburger M, Dufer J,
Kosciarz A, Brassart-Pasco S, Antonicelli F, Diederich M and
Trussardi-Régnier A: The DNA hypomethylating agent,
5-aza-2'-deoxycytidine, enhances tumor cell invasion through a
transcription-dependent modulation of MMP-1 expression in human
fibrosarcoma cells. Mol Carcinog. 54:24–34. 2015. View Article : Google Scholar
|
|
58
|
Poplineau M, Dufer J, Antonicelli F and
Trussardi-Regnier A: Epigenetic regulation of proMMP-1 expression
in the HT1080 human fibrosarcoma cell line. Int J Oncol.
38:1713–1718. 2011.PubMed/NCBI
|
|
59
|
Zhang T, Fan J, Wu K, Zeng J, Sun K, Guan
Z, Wang X, Hiesh JT and He D: Roles of HIF-1α in a novel optical
orthotopic spontaneous metastatic bladder cancer animal model. Urol
Oncol. 30:928–935. 2012. View Article : Google Scholar : PubMed/NCBI
|
|
60
|
Zhou ZH, Ji CD, Xiao HL, Zhao HB, Cui YH
and Bian XW: Reorganized Collagen in the tumor microenvironment of
gastric cancer and its association with prognosis. J Cancer.
8:1466–1476. 2017. View Article : Google Scholar : PubMed/NCBI
|
|
61
|
Yin Y, Zhao Y, Li AQ and Si JM: Collagen:
A possible prediction mark for gastric cancer. Med Hypotheses.
72:163–165. 2009. View Article : Google Scholar
|
|
62
|
Gao SY, Li J, Qu XY, Zhu N and Ji YB:
Downregulation of Cdk1 and cyclinB1 expression contributes to
oridonin-induced cell cycle arrest at G2/M phase and growth
inhibition in SGC-7901 gastric cancer cells. Asian Pac J Cancer
Prev. 15:6437–6441. 2014. View Article : Google Scholar : PubMed/NCBI
|
|
63
|
Kanthan R, Fried I, Rueckl T, Senger JL
and Kanthan SC: Expression of cell cycle proteins in male breast
carcinoma. World J Surg Oncol. 8:102010. View Article : Google Scholar : PubMed/NCBI
|
|
64
|
Wang Y, Zhou X, Shan B, Han J, Wang F, Fan
X, Lv Y, Chang L and Liu W: Downregulation of microRNA-33a promotes
cyclin-dependent kinase 6, cyclin D1 and PIM1 expression and
gastric cancer cell proliferation. Mol Med Rep. 12:6491–6500. 2015.
View Article : Google Scholar : PubMed/NCBI
|
|
65
|
Liu FY, Wang LP, Wang Q, Han P, Zhuang WP,
Li MJ and Yuan H: MiR-302b regulates cell cycles by targeting CDK2
via ERK signaling pathway in gastric cancer. Cancer Med.
5:2302–2313. 2016. View Article : Google Scholar : PubMed/NCBI
|
|
66
|
Chu DZ, Lang NP, Thompson C, Osteen PK and
Westbrook KC: Peritoneal carcinomatosis in nongynecologic
malignancy. A prospective study of prognostic factors Cancer.
63:364–367. 1989.
|
|
67
|
Yonemura Y, Kawamura T, Bandou E,
Tsukiyama G, Endou Y and Miura M: The natural history of free
cancer cells in the peritoneal cavity. Recent Results Cancer Res.
169:11–23. 2007.PubMed/NCBI
|
|
68
|
del Casar JM, Corte MD, Alvarez A, García
I, Bongera M, González LO, García-Muñiz JL, Allende MT, Astudillo A
and Vizoso FJ: Lymphatic and/or blood vessel invasion in gastric
cancer: Relationship with clinicopathological parameters,
biological factors and prognostic significance. J Cancer Res Clin
Oncol. 134:153–161. 2008. View Article : Google Scholar
|
|
69
|
Kubo H, Kitajima Y, Kai K, Nakamura J,
Miyake S, Yanagihara K, Morito K, Tanaka T, Shida M and Noshiro H:
Regulation and clinical significance of the hypoxia-induced
expression of ANGPTL4 in gastric cancer. Oncol Lett. 11:1026–1034.
2016. View Article : Google Scholar : PubMed/NCBI
|
|
70
|
Kosaka Y, Mimori K, Fukagawa T, Ishikawa
K, Etoh T, Katai H, Sano T, Watanabe M, Sasako M and Mori M:
Clinical significance of molecular detection of matrix
metalloproteinase-1 in bone marrow and peripheral blood in patients
with gastric cancer. Ann Surg Oncol. 19(Suppl 3): S430–S437. 2012.
View Article : Google Scholar
|