Introduction
Obesity is a major and continually increasing public
health concern. Since 1975, the worldwide prevalence of obesity has
rapidly increased almost 3-fold (1). Obesity is a public health concern in
developed and developing countries, in all ages and in all
socioeconomic groups. The World Health Organization (WHO) published
in 2016 that 1.9 billion adults (aged ≥18 years; 39%) were
overweight [body mass index (BMI) ≥25.0 kg/m2] and 650
million (13%) were obese (BMI ≥30 kg/m2) (2). For Germany, 67% of adult men are
overweight and 23% obese, and 53% of women are overweight, with 24%
being obese (3).
Obesity is linked to a number of severe and chronic
diseases, such as type 2 diabetes, coronary heart disease or
stroke. Moreover, obesity is also associated with an increased risk
of and mortality from several types of cancer, including colorectal
cancer (CRC), and is associated with cancer progression, metastasis
and resistance to therapy (4-6).
In fact, it has been estimated that a substantial proportion (up to
20%) of the total cancer cases may be attributed to being
overweight (BMI ≥25 kg/m2) (7). CRC is the second most common cause
of cancer-related mortality in the United States (8). Human studies have demonstrated that
a body weight increase of 5 kg elevates the incidence of colon
cancer by 6% (9). Moreover, a
high BMI in patients with colon cancer has also been linked to an
increased mortality rate (10,11).
A variety of factors may contribute to
obesity-induced cancer, such as metabolic factors, microbiota or
chronic inflammation (12).
However, the underlying molecular pathophysiological mechanisms and
signaling pathways are not yet entirely understood. The present
study focused on the cancer- and metastasis-inducing gene,
metastasis-associated in colon cancer 1 (MACC1), in the context of
obesity and obesity-induced cancer. The authors previously newly
discovered MACC1 in the tissues of patients with colon cancer
(13,14). The authors have previously
demonstrated its functions for inducing phenotypes, such as
proliferation, migration, invasion, dissemination, etc. in cell
culture, as well as carcinogenesis and metastases in several mouse
models (13,15,16). Since the discovery of MACC1, the
authors of the present study, as well as several other research
groups have demonstrated the clinical significance of MACC1 as a
causal, prognostic and predictive biomarker for >20 solid cancer
types (14), including
meta-analyses for solid cancers, cancers of the digestive system,
colorectal, hepatocellular, gastric, gynecological and breast
cancer (17-22). The causal contribution of MACC1
for rewiring cell metabolism has been demonstrated by the authors
of the present study, as well as others (23-25). A recent study reported
MACC1-driven metabolic networks in CRC, such as rewiring glucose
and glutamine metabolism, an increase in glucose use by the
enhanced surface of glucose transporter 1 (GLUT1) or an increase in
glutamine and pyruvate use by enhanced uptake (25). It was thus concluded that MACC1 is
an important regulator of cancer metabolism.
The present study aimed to determine whether the
plasma MACC1 levels may be increased in obesity, which may be a
link to obesity-associated CRC. The levels of circulating cell-free
MACC1 transcripts were first investigated in the blood of obese
subjects from two independent human studies of adult individuals:
One study of subjects from the Martin Luther University (MLU study)
(26) and a second study on
individuals from the Metabolic Syndrome study (MetScan) (27), thereby evaluating a potential link
of MACC1 expression and BMI or body fat mass. These analyses were
complemented with plasma MACC1 expression data from the MLU
intervention study of subjects analyzed following 3 months of a
moderate dietary and exercise program. Plasma MACC1 levels in
Wistar rats fed a normal-fat diet (NFD) or a high-fat diet (HFD)
were further compared. Finally, the animals were exposed to
azoxymethane (AOM) in order to test the hypothesis of the induction
of CRC in the context of obesity and MACC1 expression (28).
Materials and methods
Animal experiments
Animal experiments were performed as previously
described (27,28). All research and animal care
procedures were approved by the local Animal Care Committee
(reference no. 42502-2-1200 MLU). The principles of laboratory
animal care were followed according to the guidelines of the
European (FELASA) and German Society of Laboratory Animal Sciences
(GV-SOLAS). In brief, male Wistar rats (6 weeks old, n=50, Charles
River GmbH) were randomly divided according to body weight into two
groups. One group (n=25) received a NFD (control, 4% fat, C1090-10,
Altromin) and the other group (n=25) received the corresponding HFD
(34% fat, C1090-60, Altromin) for 46 weeks. At 8 weeks following
the start of dietary intervention, 12 (NFD group) or 11 (HFD group)
rats were injected subcutaneously with 15 mg/kg body weight of the
carcinogen, AOM (Sigma-Aldrich; Merck KGaA), once a week for 2
weeks to induce colon cancer growth. The corresponding control
groups received a subcutaneous injection of 0.9% sodium chloride
(NaCl; NFD: n=13, HFD: n=14). At 37 weeks after the final AOM
injection, the rats were sacrificed by isoflurane inhalation
anesthesia (1.5-2% v/v in oxygen) followed by cardiac puncture for
blood collection (8-9 ml per rat). The final body weight was
determined directly prior to cardiac puncture. Visceral fat mass
was removed and determined by weighing the total intra- and
retroperitoneal adipose tissues. The colon was examined for
macroscopically visible tumors and tumor-bearing areas were
excised, followed by tumor classification according to histologic
grade by an expert pathologist.
Human populations
Description of the MLU study
The MLU study was performed as previously described
(26). In brief, male and female
participants were recruited. The inclusion criteria were as
follows: BMI ≥30 kg/m2 and an age between 18 and 65
years. The exclusion criteria were pregnancy, breastfeeding,
chronic infections, acute diseases, metabolic or endocrine diseases
(e.g., type 1 diabetes, hypo- or hyperthyroidism), or
immunosuppression (e.g., chemotherapy). The participants (n=32;
male, n=14; female, n=18) were divided into 2 groups as follows:
One experimental group (n=19; 8 males and 11 females) and one
control group (n=13; 6 males and 7 females). The participants of
the experimental group performed a moderate exercise training
program of three 1-h exercise sessions per week: One unit endurance
training and two units of a combined weight and endurance training.
The training intensity was adapted to the individual performance
level determined before the start of intervention. In addition,
participants of the experimental group received dietary
recommendations according to the guidelines of the German Society
for Nutrition to reduce their body weight through information
flyers as well as individual or group consultations. Participants
of the control group were instructed not to change their lifestyle
and to maintain their weight. They received neither dietary advices
nor an exercise training program.
The following parameters were determined before and
at 3 months after the start of the intervention as previously
described: Body weight and height with the calculation of BMI,
waist and hip circumferences, as well as body fat mass measured by
bioelectrical impedance analysis (26). In addition, blood plasma of
participants was obtained from blood samples after fasting before
and at 3 months following the start of intervention. Each
participant signed informed consent prior to participation.
Description of the MetScan study
MetScan is a cross-sectional study that aimed to
investigate to what extent abdominal volume, automatically
determined using a 3D body surface scanner algorithm, allows
metabolic characterization (27,30). Following a standardized
recruitment protocol, a total of 516 participants, aged 18-79
years, were recruited. The inclusion criteria were German language
skills and an ability to provide informed consent. The exclusion
criteria were an inability to perform a body scan measurement and
any condition distorting body shape (e.g., casts).
Sex, age, and a history of diabetes mellitus and
dyslipidemia were assessed in computer-assisted interviews. Body
height (cm, stadiometer SECA 285, Hamburg, Germany), body weight
and fat mass (kg, bioelectrical impedance analysis device SECA mBCA
515, SECA), as well as both waist and hip circumference (cm,
measuring tape SECA 201, SECA) were measured with an accuracy of
one decimal place by trained personnel according to WHO guidelines
(31). BMI was calculated as body
weight divided by the square of body height (kg/m2);
waist-to-hip ratio (WHR) was calculated as the waist circumference
divided by hip circumference; the waist-to-height ratio (WHtR) was
calculated as the waist circumference divided by body height.
Blood pressure was calculated as the mean of the
second and third blood pressure measurement taken after an initial
5-min rest (OMRON Medizintechnik mbH) (32). Blood samples were collected in BD
Vacutainer® (BD Becton-Dickinson) tubes following a
standardized venipuncture protocol. EDTA tubes (9 ml) were
centrifuged at 2,000 × g for 15 min (15°C) and the plasma
supernatant was aliquoted and immediately frozen on dry ice and
stored at -80°C until the measurement of MACC1 levels.
Concentrations of triglycerides (TG, mmol/l),
high-density lipoprotein cholesterol (HDL-C, mg/dl) in serum,
glucose (mmol/l) in citrate fluoride plasma and hemoglobin A1c
(HbA1c; mmol/mol) in EDTA blood were determined from blood samples
following fasting (>8 h) (Hospital Laborverbund
Brandenburg-Berlin GmbH).
Parameters of the metabolic syndrome (MetS) were
classified according to the Harmonized model as follows (33) elevated TG concentration (≥1.7
mmol/l); decreased HDL-C concentration (men, <1.0 mmol/l; women,
<1.3 mmol/l); elevated blood pressure (systolic blood pressure
≥130 mmHg or diastolic blood pressure ≥85 mm Hg or reported
diagnosis of hypertension); elevated glucose concentration (≥5.6
mmol/l or reported diagnosis of diabetes). If participants met at
least three of the aforementioned criteria or elevated waist
circumference (WC; men, ≥94 cm; women, ≥80 cm) this was defined as
having MetS (33).
Selection of participants from the
MetScan study
In the preliminary analyses derived from the MLU
study, correlation coefficients of Rho=0.2-0.5 were observed for
the association of MACC1 with fat mass and body weight. Assuming
similar effect sizes and with the adjustment for two covariates
(age and sex), a study sample size of 195 participants was
determined to be necessary to detect correlation coefficients of
Rho >0.2. Following the exclusion of participants with missing
covariates, 429 MetScan participants were eligible for inclusion in
the present analyses. From these, selected 204 participants were
randomly, stratified by BMI categories (normal weight, <25;
pre-obesity, 25-29.9; obesity, ≥30 kg/m2) and sex. This
resulted in 68 participants per BMI category, with 34 males and 34
females in the low and middle BMI category. The highest BMI
category included slightly more females than males (41 vs. 27) as
the number of males eligible in this category was limited. For
these 204 participants, a blood sample was transferred to the
Translational Oncology of Solid Tumors Group, Max Delbrück Center
for Molecular Medicine in the Helmholtz Association (MDC), to
determine the level of circulating cell-free MACC1 transcripts.
Determination of circulating cell-free
MACC1 transcripts using reverse transcription-quantitative PCR
(RT-qPCR) MLU
The entire procedure, as employed for the MLU study,
has already been described for patients suffering from CRC, gastric
and ovarian cancer, and glioblastomas (34-38). Herein, total RNA was isolated from
the plasma samples by employing the high pure viral RNA kit (Roche
Diagnostics) according to the manufacturer's instructions. The
analysis of circulating cell-free MACC1 transcripts was carried out
with the hybridization probe detection format using
amplicon-specific hybridization probes on the LightCycler 480
system (Roche Diagnostics). Following 2 min at 95°C, 40 cycles were
run, each with 3 sec at 95°C, 5 sec at 60°C, 25 sec at 60°C,
followed by melting curve analysis (40°C to 95°C) after the PCR
cycles (Promega GoTaq Probe PCR Master kit). The MACC1-specific PCR
product of 136 bp was amplified with the following primers (BioTeZ)
and probes (TIB MolBiol): Forward primer, 5′-TTC TTT TGA TTC CTC
CGG TGA-3′ and reverse primer, 5′-ACT CTG ATG GGC ATG TGC TG-3′;
FITC-probe, 5′-GCA GAC TTC CTC AAG AAA TTC TGG AAG ATC TA-3′;
LCRed640-probe, 5′-AGT GTT TCA GAA CTT CTG GAC ATT TTA GAC GA-3′.
MACC1 mRNA levels are presented as a percentage of the calibrator
sample mRNA levels. The calibrator cDNA originated from the CRC
cell line, SW620 (authentication by short tandem repeat genotyping,
DSMZ). Serial dilutions of this calibrator RNA were employed for
standard curve generation simultaneously in each quantitative PCR
run. The in-run standard curve ranged from 100% calibrator down to
6.25% calibrator sample. Each sample was run and calculated in
duplicate, the means are depicted.
MetScan
For the determination of circulating cell-free MACC1
in the plasma of individuals from MetScan, digital droplet PCR was
performed using a Bio-Rad QX200 Droplet Digital PCR System (Bio-Rad
Laboratories GmbH) and droplet digital polymerase chain reaction
(ddPCR) Supermix for Probes (Bio-Rad Laboratories, Inc.) following
the manufacturer's instructions (34). Briefly, 1X master mix was
supplemented with primer probe mix (qHsaCPE5056798, Bio-Rad
Laboratories, Inc.) and cDNA. Droplet generation for ddPCR was
performed using the QX200 droplet generator. A total of 20
µl PCR mix and 70 µl droplet generator oil are given
in the respective cavities of the droplet generator cartridges
(Bio-Rad Laboratories, Inc.). Subsequently, 40 µl droplet
suspension was pipetted into twin.tec 96-well PCR plates
(Eppendorf). PCR was performed at 95°C for 10 min, by 39× 95°C for
30 sec and 60°C for 60 sec, followed by 98°C for 10 min using a
T100 thermal cycler (Bio-Rad Laboratories, Inc.). Droplet
quantification was performed in the QX200 droplet reader. The
system counts all generated droplets and detects the amount of PCR
product-positive (fluorescent) droplets. The determination of
circulating cell-free MACC1 transcripts was not successful in 13
out of the 204 MetScan participants, thus, 191 MetScan participants
were included in the following analyses. The Poisson correction of
generated droplet amount and data analysis was performed using the
QUANTA LIFE (Bio-Rad Laboratories, Inc.) software.
Statistical analyses
For the animal experiments, statistical analyses
were performed using Graph Pad Prism software V7 (GraphPad
Software, Inc.). Statistical analyses were performed using a
Student's t-test to compare results between the HFD-group with the
appropriate control group. Spearman's correlation analysis was used
to investigate the correlation between rat body weight and relative
MACC1 expression. Values are presented as the mean ± standard error
of the mean (SEM). A value of P≤0.05 was considered to indicate a
statistically significant difference.
For the MLU study, statistical analyses were
performed using Graph Pad Prism software V7 (GraphPad Software,
Inc.). Spearman's correlation analysis was used to investigate the
correlation between MACC1 expression and body fat mass prior to the
start of the intervention. The change in MACC1 expression and body
fat mass before and after intervention was determined by the
subtraction of the values at 3 months after the start of the
intervention from the values before the start of the intervention.
Spearman's correlation analysis was used to determine the
correlation between the changes in MACC1 expression and the changes
in body fat mass by intervention. A value of P≤0.05 was considered
to indicate a statistically significant difference.
For the MetScan study, descriptive data on age,
anthropometric and blood pressure measures are presented as the
median and interquartile range (IQR), the frequency of MetS
components and elevated MACC1 levels, WHR and WHtR as relative
figures. Laboratory parameters are presented as the geometric mean
(GM) and 95% confidence interval (CI). The level of circulating
cell-free MACC1 transcripts was determined as 0.0 copies/20
µl in 27 out of the 191 participants. To avoid missing
values for the log-transformed MACC1 measures for the respective
participants, half of the minimal value >0.0 measured for MACC1
expression in the MetScan study population (i.e., 1.2 copies/20
µl) was determined and this value was used to set MACC1
values of 0.0 as 0.6 copies/20 µl. The respective
participants were included with the modified values in the
following analyses requiring a log-transformed value of MACC1
expression. Basic characteristics of participants were additionally
analyzed by MACC1 tertiles.
Tests for differences across and between groups were
analyzed using ANOVA and the post hoc Scheffe test or
Kruskal-Wallis tests and the post hoc rank-based Scheffe test for
continuous variables and Chi-squared tests for discrete variables.
The mean level of circulating cell-free MACC1 transcripts
(copies/20 µl) was calculated according to the three BMI
categories, first as raw estimates (presented as the median and
IQR) and secondly based on least square means and log-transformed
MACC1 values, adjusted for sex and age (presented as the GM and 95%
CI).
Additionally, the association of MACC1 expression
with anthropometric measures, i.e., WC, BMI, WHR and WHtR, as well
as metabolic parameters, i.e., glucose and HbA1c concentration and
absolute fat mass, was investigated using Spearman's partial
correlations adjusted for sex and age.
P-values presented are two-tailed, with P<0.05
considered to indicate a statistically significant difference.
Analyses were performed using SAS® Enterprise
Guide® (version 7.15; SAS Institute Inc.).
Results
Correlation between circulating cell-free
plasma MACC1 expression and body fat mass in the MLU study
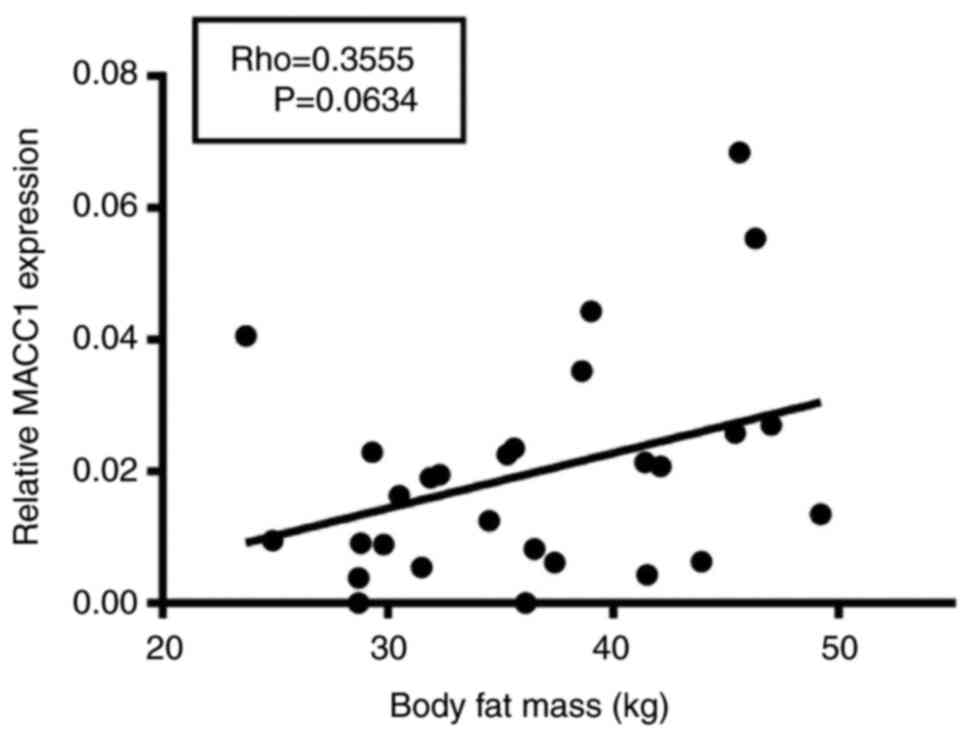
First, the correlation between anthropometric
parameters and MACC1 expression in plasma samples of obese human
subjects was analyzed. Of note, a modest positive correlation
between body fat mass and MACC1 expression (Rho=0.36) was found,
which, however, was not significant at the 5% level (P=0.06,
Fig. 1).
Association of circulating cell-free
plasma MACC1 expression with anthropometric parameters in the
MetScan study
Subsequently, MACC1 expression was measured in
MetScan, a larger, independent study (Table I). The median MACC1 expression in
MetScan was 3.4 copies/20 µl (IQR, 1.6-6.8) and GM 3.7
copies/20 µl (95% CI, 3.1-4.5). When stratified by sex, the
median expression in males was 4.0 copies/20 µl (IQR,
1.6-6.8) and GM was 4.0 copies/20 µl (95% CI, 3.1-5.3), and
in females the median expression was 3.1 copies/20 µl (IQR,
1.4-6.6) and GM 3.4 copies/20 µl (95% CI, 2.7-4.4); the
differences between sexes were not statistically significant
(P=0.28 and P=0.40, respectively).
 | Table ICharacteristics of the participants
of the MetScan study (n=191). |
Table I
Characteristics of the participants
of the MetScan study (n=191).
| Characteristic | Total (n=191) | Male (n=91) | Female (n=100) |
|---|
| Age, years, median
(IQR) | 54.2
(40.3-66.3) | 55.2
(42.0-67.5) | 54.1
(38.0-65.3) |
| Height, cm, median
(IQR) | 172.0
(166.1-179.7) | 179.3
(174.3-183.3) | 166.8
(161.6-170.1) |
| WC, cm, median
(IQR) | 95.2
(83.6-105.1) | 98.0
(89.5-109.6) | 92.6
(79.8-102.6) |
| BMI,
kg/m2, median (IQR) | 26.8
(23.9-31.1) | 26.1
(23.8-30.7) | 27.4
(24.0-31.9) |
| BMI categories,
% | | | |
| <25.0
kg/m2 | 33.5 | 36.0 | 31.0 |
| 25.0-29.9
kg/m2 | 33.0 | 34.0 | 32.0 |
| ≥30.0
kg/m2 | 33.5 | 30.0 | 37.0 |
| WHR, median
(IQR) | 0.90
(0.83-0.96) | 0.95
(0.90-1.02) | 0.85
(0.78-0.91) |
| WHtR, median
(IQR) | 0.55
(0.49-0.62) | 0.54
(0.49-0.62) | 0.56
(0.48-0.62) |
| Fat mass, kg,
median (IQR) | 27.0
(19.6-35.2) | 23.0
(17.4-32.1) | 30.0
(24.2-39.2) |
| SBP, mmHg, median
(IQR) | 122.0
(114.5-135.5) | 128.5
(119.5-141.0) | 117.0
(109.5-127.0) |
| DBP, mmHg, median
(IQR) | 76.5
(71.0-82.0) | 78.0
(74.0-84.0) | 74.0
(68.0-79.3) |
| TG, mmol/l, GM (95%
CI) | 1.2 (1.1-1.3) | 1.3 (1.2-1.4) | 1.1 (1.0-1.2) |
| HDL-C, mg/dl, GM
(95% CI) | 1.5 (1.4-1.5) | 1.3 (1.2-1.4) | 1.6 (1.6-1.7) |
| Glucose, mmol/l, GM
(95% CI) | 5.9 (5.8-6.0) | 6.1 (5.9-6.2) | 5.7 (5.6-5.9) |
| HbA1c, mmol/mol, GM
(95% CI) | 35.7
(35.0-36.5) | 35.6
(34.5-36.8) | 35.9
(34.8-37.0) |
| Diabetes
mellitusb, % | 8.9 | 9.9 | 8.0 |
| Dyslipidemia,
% | 36.1 | 28.6 | 43.0 |
| MetS (meeting ≥3 of
the following five symptoms), % | 41.9 | 42.9 | 41.0 |
| Elevated
WCc, % | 66.0 | 56.0 | 75.0 |
| Elevated
TGd, % | 22.0 | 27.5 | 17.0 |
| Reduced
HDL-Ce, % | 8.9 | 5.5 | 12.0 |
| Elevated blood
pressuref, % | 50.3 | 57.1 | 44.0 |
| Elevated
glucoseg, % | 66.0 | 76.9 | 56.0 |
| MACC1, copies/20
µl, median (IQR) | 3.4 (1.6-6.8) | 4.0 (1.6-6.8) | 3.1 (1.4-6.6) |
| MACC1, copies/20
µla, GM (95% CI) | 3.7 (3.1-4.5) | 4.0 (3.1-5.3) | 3.4 (2.7-4.4) |
| Elevated MACC1,
% | 8.9 | 8.8 | 9.0 |
The characteristics of the MetScan participants per
tertiles of MACC1 expression are presented in Table II. Age and sex did not vary
substantially across the MACC1 tertiles. However, there were
differences in WC (P=0.02) and WHtR (P=0.03) across MACC1 tertiles
with higher anthropometric measures in the upper than in the lower
tertile. Similar, yet non-significant differences were observed for
BMI (P=0.06) and fat mass (P=0.07).
| Table IIBasic characteristics of the
participants of the MetScan study by MACC1 tertiles. |
Table II
Basic characteristics of the
participants of the MetScan study by MACC1 tertiles.
| Characteristic | MACC1 tertile
|
|---|
| 1 (n=63) | 2 (n=63) | 3 (n=65) | P-value |
|---|
| MACC1 copies/20
µl | ≤2.4 | >2.4 to
≤4.8 | >4.8 | |
| Women, % | 58.7 | 49.2 | 49.2 | 0.47 |
| Age, years, median
(IQR) | 54.2
(40.6-66.0) | 54.0
(36.4-65.1) | 56.4
(45.5-66.6) | 0.52 |
| Height, cm, median
(IQR) | 170.2
(166.1-177.9) | 172.2
(167.0-179.7) | 174.4
(165.4-181.1) | 0.73 |
| Waist
circumference, cm, median (IQR) | 92.7
(82.8-103.9) | 92.7
(84.5-102.3) | 99.5
(88.5-111.6) | 0.02 |
| BMI,
kg/m2, median (IQR) | 25.8
(23.6-31.0) | 26.8
(23.7-29.5) | 28.2
(24.2-33.1) | 0.06 |
| WHR, median
(IQR) | 0.90
(0.82-0.96) | 0.90
(0.82-0.95) | 0.91
(0.84-1.00) | 0.14 |
| WHtR, median
(IQR) | 0.54
(0.48-0.60) | 0.53
(0.49-0.60) | 0.58
(0.50-0.64) | 0.03 |
| Fat mass, kg,
median (IQR) | 25.4
(17.2-32.3) | 27.1
(19.6-32.4) | 32.1
(20.7-37.6) | 0.07 |
| Systolic blood
pressure, mm Hg | 124.0
(116-130.5) | 122.0
(113.0-141.0) | 122.0
(113.5-136.5) | 0.62 |
| Diastolic blood
pressure, mm Hg | 76.0
(71.5-81.5) | 77.5 (72-87.5) | 76.5
(70.0-81.0) | 0.07 |
| TG, mmol/l, GM (95%
CI) | 1.15
(1.02-1.28) | 1.15
(1.03-1.29) | 1.25
(1.12-1.40) | 0.31 |
| HDL-C, mg/dl, GM
(95% CI) | 1.47
(1.39-1.56) | 1.48
(1.40-1.57) | 1.43
(1.35-1.52) | 0.71 |
| glucose, mmol/l, GM
(95% CI) | 5.75
(5.57-5.95) | 5.85
(5.66-6.05) | 6.04
(5.84-6.24) | 0.27 |
| HbA1c, mmol/mol, GM
(95% CI) | 35.7
(34.3-37.1) | 34.8
(33.5-36.2) | 36.8
(35.4-38.2) | 0.10 |
| Diabetes
mellitusa, % | 7.9 | 4.8 | 13.8 | 0.19 |
|
Dyslipidemiaa,
% | 31.7 | 36.5 | 40.0 | 0.62 |
| MetS (meeting ≥3 of
the following five symptoms), % | 41.3 | 31.7 | 52.3 | 0.06 |
| Elevated
WCb, % | 63.5 | 65.1 | 69.2 | 0.78 |
| Elevated
TGc, % | 25.4 | 15.9 | 24.6 | 0.36 |
| Reduced
HDL-Cd, % | 11.1 | 4.8 | 10.8 | 0.37 |
|
Hypertensione, % | 44.4 | 49.2 | 56.9 | 0.36 |
| Elevated
glucosef, % | 63.5 | 65.1 | 69.2 | 0.78 |
In unadjusted analyses, median MACC1 expression was
3.2 copies/20 µl (IQR, 1.6-6.4) among normal weight
individuals (BMI <25 kg/m2), 3.0 copies/20 µl
(IQR 1.4-4.6) among pre-obese individuals (BMI 25.0-29.9
kg/m2; P=0.93 in comparison to normal weight) and 4.8
copies/20 µl (IQR 1.7-11.0) among obese individuals (BMI
≥30.0 kg/m2; P=0.16 in comparison to normal weight;
P=0.05 for differences in MACC1 across BMI categories) (Table III). The results were similar
when after adjusting for age and sex:
| Table IIIUnadjusted median MACC1 expression in
normal weight, pre-obese, and obese persons. |
Table III
Unadjusted median MACC1 expression in
normal weight, pre-obese, and obese persons.
| Group | MACC1 expression
(copies/20 µl)
| P-value for
differences compared with reference groupa | P-value for
difference across groupsb |
|---|
| Median | Interquartile
range |
|---|
| Normal weight (BMI
<25.0 kg/m2) | 3.2 | 1.6-6.4 | Reference | |
| Pre-obese (BMI
25.0-29.9 kg/m2) | 3.0 | 1.4-4.6 | 0.93 | 0.05 |
| Obese (BMI ≥30.0
kg/m2) | 4.8 | 1.7-11.0 | 0.16 | |
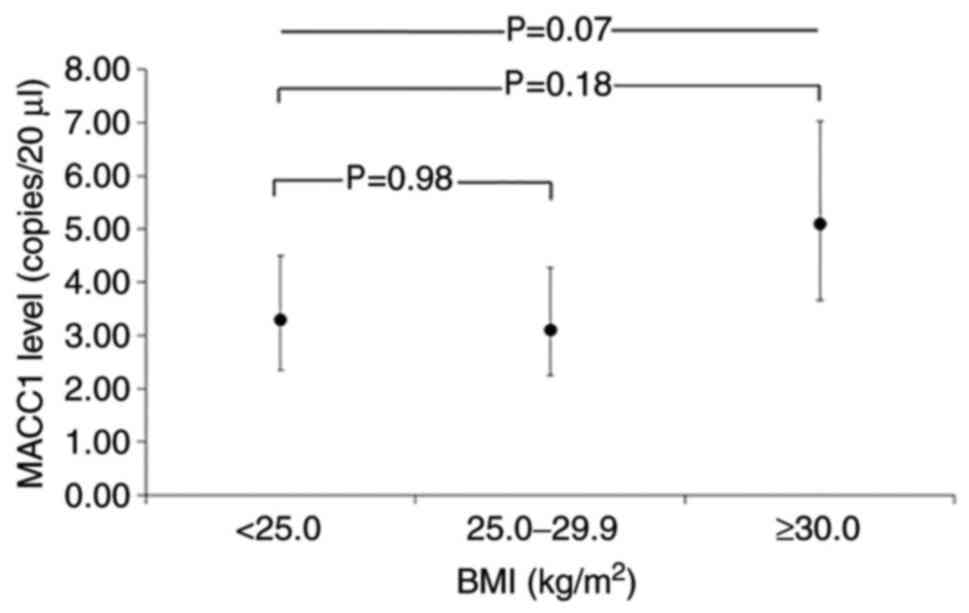
Thus, geometric mean MACC1 levels were 3.3 copies/20
µl (95% CI 2.4-4.5) among normal weight, 3.1 copies/20
µl (95% CI 2.3-4.3) among pre-obese (P= 0.98 compared to
normal weight), and 5.1 copies/20 µl (95% CI 3.7-7.0) among
obese individuals (P=0.18 compared to normal weight; P=0.07 across
BMI categories; Fig. 2). The
differences in MACC1 levels across BMI categories were slightly,
although not-significantly (P=0.63) stronger among males than among
females (Fig. 3).
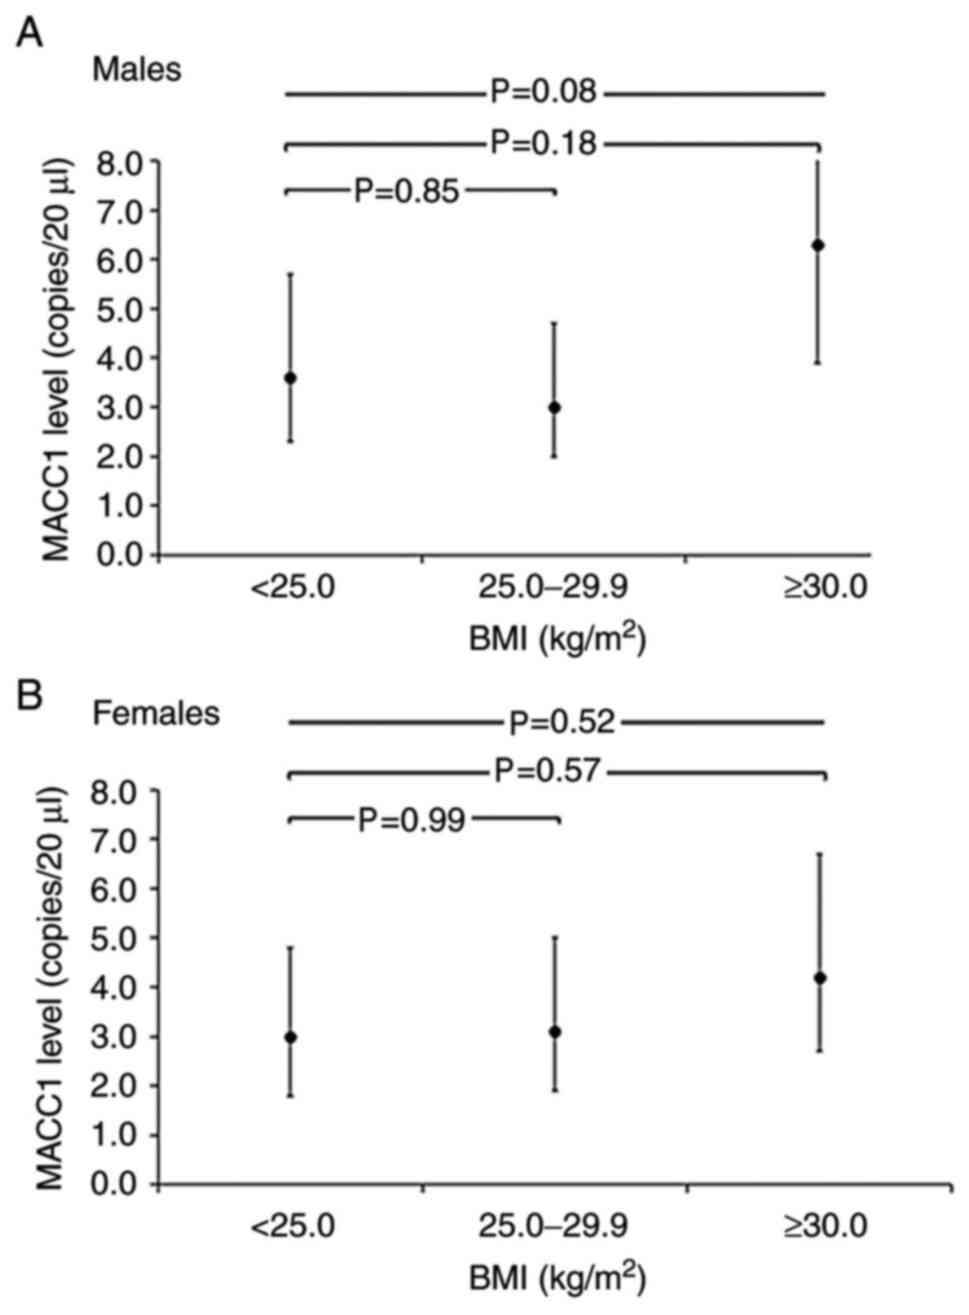 | Figure 3Geometric mean MACC1 levels
(copies/20 µl) and 95% CI per BMI category, adjusted for age
in MetScan. (A) Geometric mean MACC1 levels and 95% CI per BMI
category, adjusted for age among males. Geometric mean MACC1 levels
were 3.6 copies/20 µl (95% CI, 2.3-5.7) among normal weight,
3.0 copies/20 µl (95% CI, 2.0-4.7) among pre-obese (P= 0.85
compared to normal weight) and 6.3 copies/20 µl (95% CI,
3.9-10.1) among obese individuals (P=0.18 compared to normal
weight; P=0.08 across BMI categories. (B) Geometric mean MACC1
levels and 95% CI per BMI category, adjusted for age among females.
Geometric mean MACC1 levels were 3.0 copies/20 µl (95% CI,
1.8-4.8) among normal weight, 3.1 copies/20 µl (95% CI,
1.9-5.0) among pre-obese (P=0.99 compared to normal weight) and 4.2
copies/20 µl (95% CI, 2.7-6.7) among obese individuals
(P=0.57 compared to normal weight; P=0.52 across BMI categories.
The MACC1 value was 0.0 copies/20 µl for 27 of the total 191
participants. To calculate the geometric mean (95%) MACC1 values
were set as 0.6 copies/20 µl (half of the minimal value
>0.0 measured for MACC1) for these participants and included the
respective participants with the modified values in this analysis.
Across-group comparisons are based on ANOVA and between-group
comparisons are based on the Scheffe test, using log-transformed
MACC1 concentrations. The test for difference in MACC1 levels
across BMI categories was P=0.63), based on ANOVA with the
inclusion of an interaction term of sex x BMI categories. BMI, body
mass index; MACC1, metastasis-associated in colon cancer 1. |
When analyzed continuously, there were weak
associations found between MACC1 and markers of general or
abdominal adiposity and with markers of glucose metabolism
(Table IV). For example, the
Spearman's partial correlation coefficient for the association with
MACC1 expression, adjusted for age and sex, was 0.10 (P=0.17) for
BMI, 0.13 (P=0.07) for fat mass, 0.11 (P=0.12) for WC and 0.07
(P=0.36) for glucose levels. Of note, when stratified by sex, these
associations were slightly stronger among males than among females
(Table IV), although most
correlations were not significant at the 5% level.
| Table IVSpearman's partial correlation of
anthropometric measures and biomarkers with MACC1 expression
(copies/20 µl). |
Table IV
Spearman's partial correlation of
anthropometric measures and biomarkers with MACC1 expression
(copies/20 µl).
| Totala (n=191)
| Maleb (n=91)
| Femaleb (n=100)
|
|---|
| Rho | P-value | Rho | P-value | Rho | P-value |
|---|
| BMI,
kg/m2 | 0.10 | 0.17 | 0.15 | 0.16 | 0.05 | 0.63 |
| Fat mass, kg | 0.13 | 0.07 | 0.16 | 0.14 | 0.10 | 0.34 |
| WC, cm | 0.11 | 0.12 | 0.19 | 0.08 | 0.07 | 0.48 |
| WHR | 0.05 | 0.48 | 0.20 | 0.06 | -0.03 | 0.79 |
| WHtR | 0.14 | 0.05 | 0.19 | 0.07 | 0.12 | 0.25 |
| Glucose,
mmol/l | 0.07 | 0.36 | 0.23 | 0.03 | -0.04 | 0.67 |
| HbA1c,
mmol/mol | 0.07 | 0.36 | 0.20 | 0.07 | -0.04 | 0.71 |
Association of circulating cell-free
plasma MACC1 expression and body fat mass in obese individuals
following dietary and exercise intervention in the MLU study
Previous results of the MLU study demonstrated that
a moderate dietary and physical exercise program in obese
individuals led to a significantly reduced body fat mass and waist
and hip circumferences in the male sub-cohort following 3 months of
intervention. Moreover, blood glucose levels significantly
decreased in the male sub-cohort following intervention. The body
weight and plasma concentrations of cholesterol, its subsets and
triacylglycerols were reduced, but results were not significant
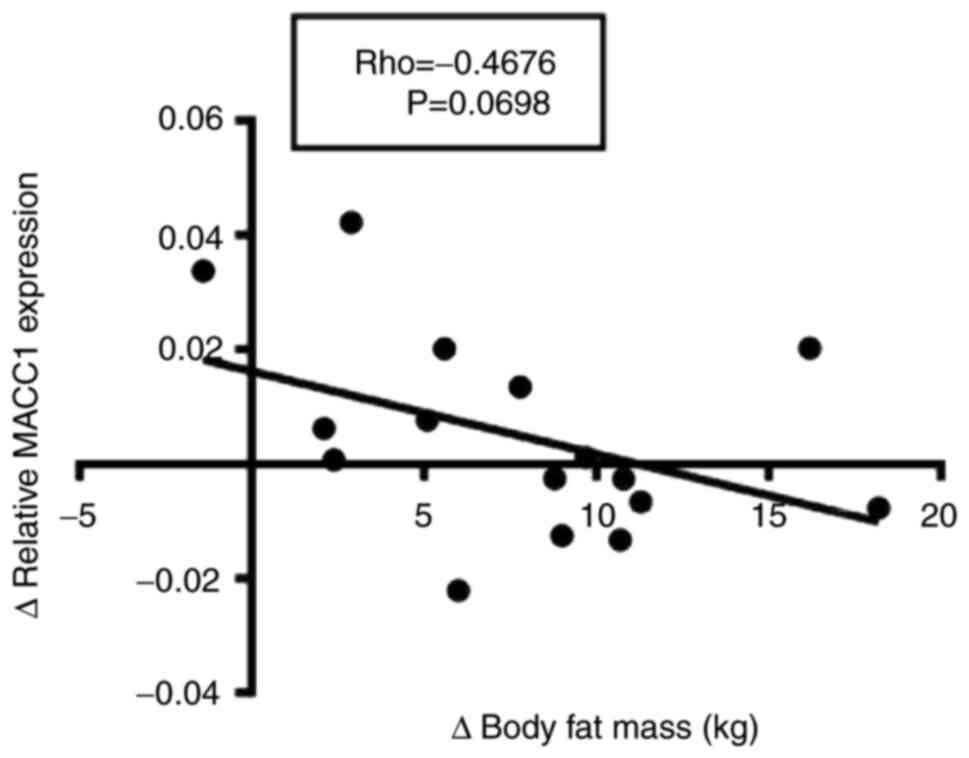
(26). The results of the present
analyses demonstrated that the change in body fat mass reduction
negatively correlated with the change of MACC1 expression following
three month of dietary intervention and physical exercise program,
although results were not statistically significant (P=0.0698,
Fig. 4).
Circulating cell-free plasma MACC1
expression in Wistar rats fed a NFD or HFD with or without CRC
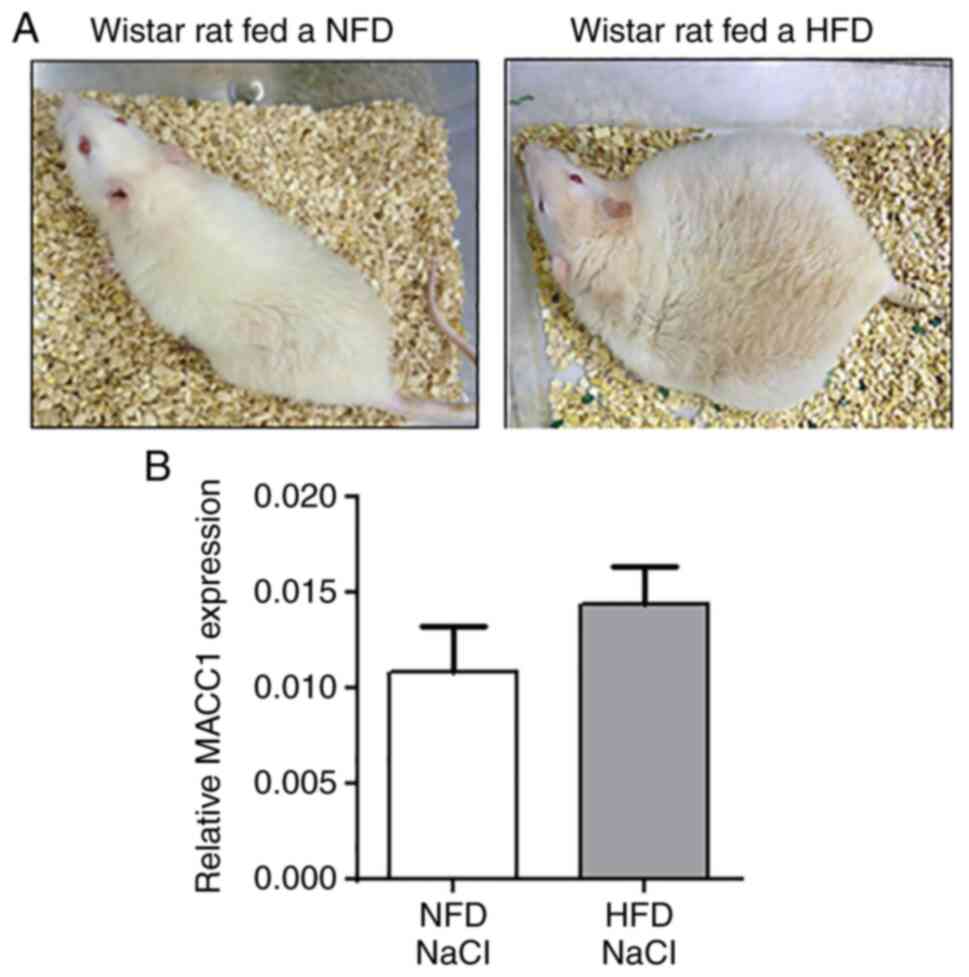
Previous research has demonstrated that Wistar rats
fed a HFD for 46 weeks exhibited significantly higher body weights
and visceral fat mass compared to Wistar rats fed a NFD (28). In the present study,
representative images of NFD- and HFD-fed Wistar rats are presented
in Fig. 5A. Moreover, former
investigations in diet-induced obese rats revealed a more severe
tumor outcome with an increased number, size, and weight of
colorectal tumors and a higher rate of adenocarcinomas than
adenomas compared to the normal-weight control group (28). The results of the present analyses
revealed no significant changes in circulating cell-free plasma
MACC1 expression levels of rats fed the NFD compared with rats fed
the HFD (Fig. 5B).
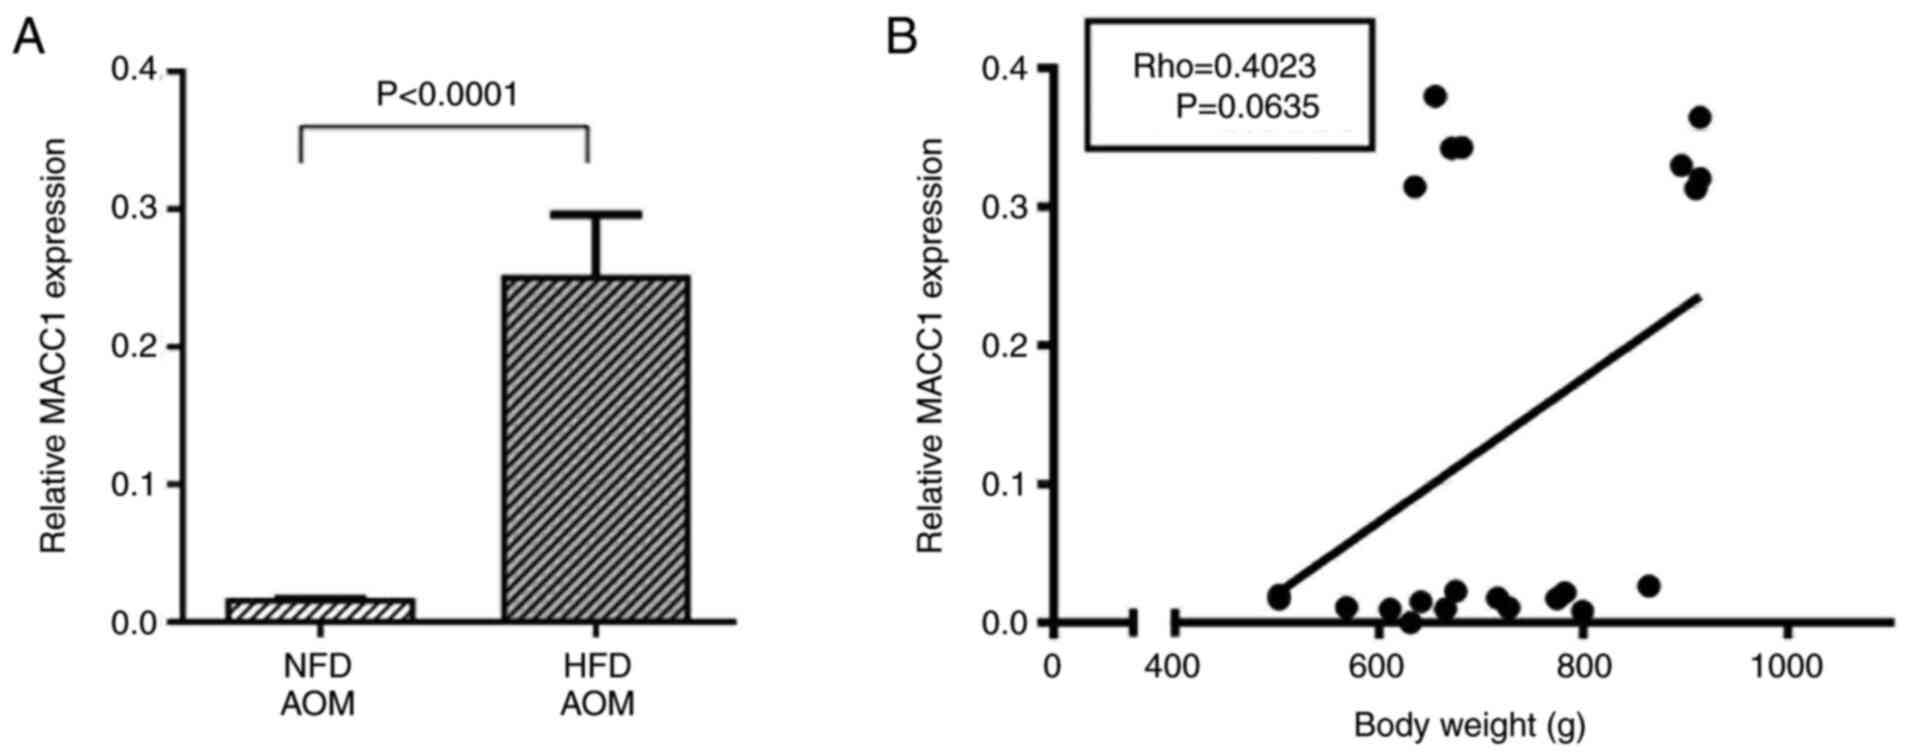
However, in AOM-exposed Wistar rats, plasma MACC1
expression was significantly increased in the HFD group compared
with the NFD group (P<0.0001, Fig.
6A). In addition, correlation analyses revealed a slight,
although not significant, positive correlation between body weight
and MACC1 expression in AOM-exposed rats (P=0.06, Fig. 6B).
Discussion
Obesity is a major risk factor for the development
of CRC, as well as for metastasis and cancer-associated mortality
(10,12). Several pathophysiological
mechanisms for an increased risk of CRC in obese individuals have
been investigated. Apart from altered secretion profiles of
adipocytokines, the increased release of growth factors and steroid
hormones, oxidative stress and alterations in microbiome the
chronic low-grade inflammation may contribute to the enhanced tumor
development in obesity (6,39-41).
However, the underlying pathophysiological mechanisms linking
obesity and cancer remain unclear.
MACC1 was discovered to be expressed in human CRC
tissue (13,14). Moreover, in vitro and in
vivo studies have revealed the effects of MACC1 in tumor
metabolism, proliferation, migration and invasion, and have
demonstrated that MACC1 is a potent prognostic and predictive
biomarker for several tumor entities, including CRC (13,15,16,25). The present study, to the best of
our knowledge, is the first to investigate the potential
association between MACC1 expression, obesity and obesity-induced
CRC.
The findings of the present study suggest an
association between anthropometric parameters characterizing
obesity and plasma MACC1 expression. Although not statistically
significant, the results of the MLU cohort detected a slight
positive correlation between body fat mass and plasma MACC1
expression in healthy obese subjects. In addition, analyses in
MetScan demonstrated that participants in the highest MACC1 tertile
had higher levels of BMI, WHtR, WC and fat mass, compared to
participants in the lowest MACC1 tertile. Moreover, geometric mean
MACC1 levels were the highest in the obese BMI group compared to
normal weight and over-weight participants. Although most of these
associations were not statistically significant at the 5% level,
these data of these two independent studies indicate that obesity
may be associated with increased MACC1 expression levels. This is
in line with the hypothesis that MACC1 expression may contribute to
the higher risk for the development and metastasis of CRC in obese
individuals.
Of note, when stratified by sex, the increased MACC1
levels in obesity were predominantly observed in male participants
and to a lesser extent in female participants, although these
differences between males and females were not statistically
significant. It remains to be elucidated whether possible
sex-hormone-dependent effects in females of reproductive age may
affect the MACC1 expression levels.
Previous studies have demonstrated an association
between increased HbA1c or serum glucose levels and a higher cancer
risk (42,43). Although the insulin-insulin growth
factor (IGF)-1 axis is a commonly suggested pathway, the mechanisms
through which hyperglycemia contributes to an increased cancer risk
are not yet completely understood.
The present study found a weak association between
fasting glucose levels, as well as HbA1c and MACC1 levels in
MetScan, and it may thus be hypothesized that MACC1 is involved in
the pathway mediating the increased risk of cancer and tumor
metastasis by hyperglycemia; nevertheless, this association was
statistically significant for glucose and only in males.
Although epidemiological studies investigating the
loss of body weight and the subsequent cancer risk in obesity are
limited, there is some evidence to indicate that a reduction in
body weight can reduce the risk of cancer in obese individuals
(44,45). The present study analyzed whether
a reduction in body weight and fat mass by a lifestyle intervention
program in obese individuals may affect the plasma MACC1 expression
levels. The results demonstrate that a change in body fat mass
reduction negatively correlated with the change in MACC1 expression
following 3 months of a moderate dietary intervention and physical
exercise program. These data indicate that the increased MACC1
levels in obesity may not be normalized by a loss of body weight
and fat mass or an enhanced level of physical activity. Apart from
the significant decrease in fat mass in male participants, other
anthropometric parameters such as BMI and body weight, were only
moderately reduced after the 3-month intervention program of the
MLU study (26). Therefore,
further investigations are required to examine the impact of the
loss of body weight or fat mass, as well as physical exercise on
MACC1 levels in obese individuals.
The present study further analyzed the impact of
obesity on plasma MACC1 expression in an animal model of CRC.
Wistar rats treated with the carcinogen, AOM, exhibited a more
severe colorectal tumor outcome when fed a HFD compared to
AOM-treated rats fed a NFD (28).
Notably, the results of the present study revealed that plasma
MACC1 expression in AOM-exposed animals was significantly increased
in rats fed the HFD compared to rats fed the NFD. These data
indicate that the MACC1 levels may have contributed to the
increased number, size and weight of colorectal tumors and a higher
rate of adenocarcinomas than adenomas in HFD-fed rats exposed to
AOM. Although no tumor metastases were detected in secondary organs
of the AOM-exposed rats at the end of the experiment (28), it can be hypothesized that a
higher metastasis rate in obese individuals with CRC may be
associated by increased MACC1 levels and driven by MACC1-mediated
pathways. Nevertheless, as AOM-exposed rats fed the HFD had a more
severe colon tumor burden compared with AOM-exposed rats fed the
NFD, future studies are warranted to investigate whether the high
MACC1 levels in HFD-fed rats were induced by obesity or resulted
from an increased MACC1 secretion by colon tumor cells. To date,
the biological mechanisms through which obesity contributes to an
increase of MACC1 remain unclear. Future studies are required to
evaluate whether obesity-associated factors, such as alterations in
adipocytokine levels or inflammatory parameters, may affect the
expression of the transcription factor, MACC1. In addition,
epidemiological long-term studies, including normal weight and
obese patients with or without CRC are required to investigate
whether increased MACC1 expression levels in obese individuals are
associated with an increased risk of CRC and metastasis in humans.
Moreover, further investigations are warranted to evaluate whether
an association between the elevated MACC1 levels and the increased
risk for tumor development in obesity may also be observed for
other obesity-related cancer types, such as breast, liver, kidney
or pancreatic cancer.
The present study has some limitations. Although
MACC1 weakly correlated with anthropometric parameters of adiposity
in the human studies, the majority of these results were
statistically non-significant at the 5% level. As described above,
in the MLU study, the correlation coefficient between body fat mass
and MACC1 expression was 0.36 (P=0.06). Based on this observation,
the MetScan sample was powered to detect correlation coefficients
r>0.2 with adjustment for two covariates. The correlations that
we observed in MetScan were <0.2 and statistically
non-significant, which is in line with the current power
calculations. When stratified by sex, slightly higher correlation
coefficients were found among males than among females. These
findings need to be interpreted cautiously, given that formal tests
for interaction were statistically non-significant. In addition,
one should also keep in mind that these latter were post hoc
analyses, which included multiple testing, and that sample size was
reduced in these stratified analyses.
In conclusion, the results of the present study
revealed higher MACC1 plasma concentrations in obese as compared
with non-obese persons, although these findings were not
statistically significant. In addition, significantly increased
plasma MACC1 expression levels were observed in obese rats exposed
to AOM to induce colorectal tumors. These findings lead to the
assumption that MACC1 is associated with pathophysiological
pathways, contributing to an increased risk of CRC in obesity.
Availability of data and materials
The datasets used and/or analyzed during the current
study are available from the corresponding author on reasonable
request.
Authors' contributions
IB, HK, TP and US were involved in the
conceptualization of the study. LJ, JJ, KN, DK and PH were involved
in the study methodology. DK and PH were involved in the formal
analysis, as well as in experimental plasma expression analyses.
IB, LJ, TP and US were involved in the writing of the manuscript
and in the preparation of the original draft. All authors were
involved in the writing, reviewing and editing of the manuscript.
IB, TP and US supervised the study. IB, TP, US and HK were involved
in project administration. TP, US and HK were involved in funding
acquisition. IB, HK, LJ, TP and US confirmed the authenticity of
all the raw data. All authors have read and approved the final
manuscript.
Ethics approval and consent to
participate
All research and animal care procedures were
approved by the local Animal Care Committee (reference number:
42502-2-1200 MLU). The principles of laboratory animal care were
followed according to the guidelines of the European (FELASA) and
German Society of Laboratory Animal Sciences (GV-SOLAS). For the
MLU study, the study followed the Declaration of Helsinki on
medical protocol and ethics and was approved by the ethics
committee of the Faculty of Medicine, Martin Luther University
Halle-Wittenberg (MLU), Halle (Saale), Germany. For the MetScan
study, the study protocol was approved by the ethics committee of
the Charité-Universitätsmedizin Berlin (reference no. EA1/197/15)
and the local data protection officer. All investigations were
carried out in accordance with the relevant guidelines and
regulations, and written informed consent was obtained from all
participants before inclusion. Informed consent was obtained from
all subjects involved in the study.
Patient consent for publication
Not applicable.
Competing interests
The authors declare that they have no competing
interests.
Acknowledgments
Not applicable.
Funding
MetScan was funded by the Federal Ministry for Economic Affairs
and Energy (Bundesministerium für Wirtschaft und Energie, (BMWi),
Förderkennzeichen KF2135010BZ4. The MACC1 association analyses were
in part supported by the German Cancer Consortium (DKTK).
References
|
1
|
NCD Risk Factor Collaboration (NCD-RisC):
Trends in adult body-mass index in 200 countries from 1975 to 2014:
A pooled analysis of 1698 population-based measurement studies with
192 million participants. Lancet. 387:1377–1396. 2016. View Article : Google Scholar
|
|
2
|
World Health Organisation: Obesity and
Overweight (WHO fact sheet). WHO; Geneva, Switzerland: 2021,
https://www.who.int/news-room/fact-sheets/detail/obesity-and-overweight.
Accessed December 22, 2021.
|
|
3
|
Robert Koch Institute: Overweight and
Obesity. Robert Koch Institute; Berlin, Germany: 2021, https://www.rki.de/EN/Content/Health_Monitoring/Main_Topics/Overweight_Obesity/obesity_node.html;jsessionid=B0011790B0977853D808900F073E7775.internet111.
Accessed December 22, 2021.
|
|
4
|
Renehan AG, Tyson M, Egger M, Heller RF
and Zwahlen M: Body-mass index and incidence of cancer: A
systematic review and meta-analysis of prospective observational
studies. Lancet. 371:569–578. 2008. View Article : Google Scholar : PubMed/NCBI
|
|
5
|
Ma Y, Yang Y, Wang F, Zhang P, Shi C, Zou
Y and Qin H: Obesity and risk of colorectal cancer: A systematic
review of prospective studies. PLoS One. 8:e539162013. View Article : Google Scholar : PubMed/NCBI
|
|
6
|
Dong Y, Zhou J, Zhu Y, Luo L, He T, Hu H,
Liu H, Zhang Y, Luo D, Xu S, et al: Abdominal obesity and
colorectal cancer risk: Systematic review and meta-analysis of
prospective studies. Biosci Rep. Dec 12–2017.Epub ahead of print.
View Article : Google Scholar
|
|
7
|
Renehan AG and Soerjomataram I: Obesity as
an avoidable cause of cancer (Attributable Risks). Recent Results
Cancer Res. 208:243–256. 2016. View Article : Google Scholar : PubMed/NCBI
|
|
8
|
Sung H, Ferlay J, Siegel RL, Laversanne M,
Soerjomataram I, Jemal A and Bray F: Global cancer statistics 2020:
GLOBOCAN estimates of incidence and mortality worldwide for 36
cancers in 185 countries. CA Cancer J Clin. 71:209–249. 2021.
View Article : Google Scholar : PubMed/NCBI
|
|
9
|
Larsson SC and Wolk A: Obesity and colon
and rectal cancer risk: A meta-analysis of prospective studies. Am
J Clin Nutr. 86:556–565. 2007. View Article : Google Scholar : PubMed/NCBI
|
|
10
|
Calle EF, Rodriguez C, Walker-Turmond K
and Tun MJ: Overweight, obesity, and mortality from cancer in a
prospectively studied cohort of U.S. Adults New Engl J Med.
348:1625–1638. 2003. View Article : Google Scholar
|
|
11
|
Campbell PT, Newton CC, Dehal AN, Jacobs
EJ, Patel AV and Gapstur SM: Impact of body mass index on survival
after colorectal cancer diagnosis: The cancer prevention StudyII
nutrition cohort. J Clin Oncol. 30:42–52. 2012. View Article : Google Scholar
|
|
12
|
Arnold M, Leitzmann M, Freisling H, Bray
F, Romieu I, Renehan A and Soerjomataram I: Obesity and cancer: An
update of the global impact. Cancer Epidemiol. 41:8–15. 2016.
View Article : Google Scholar : PubMed/NCBI
|
|
13
|
Stein U, Walther W, Arlt F, Schwabe H,
Smith J, Fichtner I, Birchmeier W and Schlag PM: MACC1, a newly
identified key regulator of HGF-MET signaling, predicts colon
cancer metastasis. Nat Med. 15:59–67. 2009. View Article : Google Scholar
|
|
14
|
Radhakrishnan H, Walther W, Zincke F,
Kobelt D, Imbastari F, Erdem M, Kortüm B, Dahlmann M and Stein U:
MACC1-the first decade of a key metastasis molecule from gene
discovery to clinical translation. Cancer Metastasis Rev.
37:805–820. 2018. View Article : Google Scholar
|
|
15
|
Pichorner A, Sack U, Kobelt D, Kelch I,
Arlt F, Smith J, Walther W, Schlag PM and Stein U: In vivo imaging
of colorectal cancer growth and metastasis by targeting MACC1 with
shRNA in xenografted mice. Clin Exp Metastasis. 29:573–583. 2012.
View Article : Google Scholar : PubMed/NCBI
|
|
16
|
Lemos C, Hardt MS, Juneja M, Voss C,
Förster S, Jerchow B, Haider W, Bläker H and Stein U: MACC1 induces
tumor progression in transgenic mice and colorectal cancer patients
via increased pluripotency markers Nanog and Oct4. Clin Cancer Res.
22:2812–2824. 2016. View Article : Google Scholar : PubMed/NCBI
|
|
17
|
Wang G, Fu Z and Li D: MACC1
overexpression and survival in solid tumors: A meta-analysis.
Tumour Biol. 36:1055–1065. 2015. View Article : Google Scholar
|
|
18
|
Wu Z, Zhou R, Su Y, Sun L, Liao Y and Liao
W: Prognostic value of macc1 in digestive system neoplasms: A
systematic review and meta-analysis. Biomed Res Int.
2015:2520432015.PubMed/NCBI
|
|
19
|
Sun DW, Zhang YY, Qi Y, Liu GQ, Chen YG,
Ma J and Lv GY: Prognostic and clinicopathological significance of
MACC1 expression in hepatocellular carcinoma patients: A
meta-analysis. Int J Clin Exp Med. 8:4769–4777. 2015.PubMed/NCBI
|
|
20
|
Zhao Y, Dai C, Wang M, Kang H, Lin S, Yang
P, Liu X, Liu K, Xu P, Zheng Y, et al: Clinicopathological and
prognostic significance of metastasis-associated in colon cancer-1
(MACC1) overexpression in colorectal cancer: A meta-analysis.
Oncotarget. 7:62966–62975. 2016. View Article : Google Scholar
|
|
21
|
Jin Y, Zhou K, Zhao W, Han R, Huo X, Yang
F and Chen J: Clinicopathological and prognostic significance of
metastasis-associated in colon cancer-1 in gastric cancer: A
meta-analysis. Int J Biol Markers. 34:27–32. 2019. View Article : Google Scholar : PubMed/NCBI
|
|
22
|
Wang L, Fan L, Xu H and Jiang H:
Prognostic significance of the expression of metastasis-associated
in colon cancer-1 in gynecologic cancers and breast cancer: A
protocol for systematic review and meta-analysis. Medicine
(Baltimore). 100:e242552021. View Article : Google Scholar
|
|
23
|
Li Y, Lu Z, Liang Z, Ji D, Zhang P, Liu Q,
Zheng X and Yao Y: Metastasis-associated in colon cancer-1 is
associated with poor prognosis in hepatocellular carcinoma, partly
by promoting proliferation through enhanced glucose metabolism. Mol
Med Rep. 12:426–434. 2015. View Article : Google Scholar : PubMed/NCBI
|
|
24
|
Zhang M, Yang J, Jiang H, Jiang H and Wang
Z: Correlation between glucose metabolism parameters derived from
FDG and tumor TNM stages and metastasis-associated proteins in
colorectal carcinoma patients. BMC Cancer. 21:2582021. View Article : Google Scholar :
|
|
25
|
Lisec J, Kobelt D, Walther W, Mokrizkij M,
Grötzinger C, Jaeger C, Baum K, Simon M, Wolf J, Beindorff N, et
al: Systematic identification of MACC1-driven metabolic networks in
colorectal cancer. Cancers (Basel). 13:9782021. View Article : Google Scholar
|
|
26
|
Jahn J, Spielau M, Brandsch C, Stangl GI,
Delank KS, Bähr I, Berreis T, Wrann CD and Kielstein H: Decreased
NK cell functions in obesity can be reactivated by fat mass
reduction. Obesity (Silver Spring). 23:2233–2241. 2015. View Article : Google Scholar
|
|
27
|
Jaeschke L, Steinbrecher A, Hansen G,
Sommer S, Adler C, Janke J and Pischon T: Association of body
surface scanner-based abdominal volume with parameters of the
Metabolic Syndrome and comparison with manually measured waist
circumference. Sci Rep. 10:93242020. View Article : Google Scholar : PubMed/NCBI
|
|
28
|
Bähr I, Goritz V, Doberstein H, Hiller
GGR, Rosenstock P, Jahn J, Pörtner O, Berreis T, Mueller T,
Spielmann J and Kielstein H: Diet-induced obesity is associated
with an impaired NK cell function and an increased colon cancer
incidence. J Nutr Metab. 2017:42970252017. View Article : Google Scholar : PubMed/NCBI
|
|
29
|
Bähr I, Pörtner OJ, Glass M, Doberstein H,
Goritz V, Hiller GGR, Spielmann J and Kielstein H: Characterization
of natural killer cells in colorectal tumor tissue of rats fed a
control diet or a high-fat diet. Ann Anat. 233:1515862021.
View Article : Google Scholar
|
|
30
|
Adler C, Steinbrecher A, Jaeschke L,
Mähler A, Boschmann M, Jeran S and Pischon T: Validity and
reliability of total body volume and relative body fat mass from a
3-dimensional photonic body surface scanner. PLoS One.
12:e01802012017. View Article : Google Scholar : PubMed/NCBI
|
|
31
|
World Health Organization: Waist
Circumference and Waist-Hip Ratio. Report of a WHO Expert
Consultation; Geneva, 8-11 December 2008; World Health
Organization; Geneva: 2011, Available from: http://www.who.int/nutrition/publications/obesity/WHO_report_waistcircumference_and_waisthip_ratio/en/.
|
|
32
|
Schulze MB, Kroke A, Bergmann MM and
Boeing H: Differences of blood pressure estimates between
consecutive measurements on one occasion: Implications for
inter-study comparability of epidemiologic studies. Eur J
Epidemiol. 16:891–898. 2000. View Article : Google Scholar
|
|
33
|
Alberti KG, Eckel RH, Grundy SM, Zimmet
PZ, Cleeman JI, Donato KA, Fruchart JC, James WP, Loria CM, Smith
SC Jr, et al: Harmonizing the metabolic syndrome: A joint interim
statement of the international diabetes federation Task Force on
epidemiology and prevention; National heart, lung, and blood
institute; American Heart Association World Heart Federation;
International atherosclerosis society; and International
association for the study of obesity. Circulation. 120:1640–1645.
2009. View Article : Google Scholar : PubMed/NCBI
|
|
34
|
Hagemann C, Neuhaus N, Dahlmann M, Kessler
AF, Kobelt D, Herrmann P, Eyrich M, Freitag B, Linsenmann T,
Monoranu CM, et al: Circulating MACC1 transcripts in glioblastoma
patients predict prognosis and treatment response. Cancers (Basel).
11:8252019. View Article : Google Scholar
|
|
35
|
Link T, Kuhlmann JD, Kobelt D, Herrmann P,
Vassileva YD, Kramer M, Frank K, Göckenjan M, Wimberger P and Stein
U: Clinical relevance of circulating MACC1 and S100A4 transcripts
for ovarian cancer. Mol Oncol. 13:1268–1279. 2019. View Article : Google Scholar : PubMed/NCBI
|
|
36
|
Ashktorab H, Hermann P, Nouraie M,
Shokrani B, Lee E, Haidary T, Brim H and Stein U: Increased MACC1
levels in tissues and blood identify colon adenoma patients at high
risk. J Transl Med. 14:2152016. View Article : Google Scholar : PubMed/NCBI
|
|
37
|
Burock S, Herrmann P, Wendler I,
Niederstrasser M, Wernecke KD and Stein U: Circulating Metastasis
Associated in Colon Cancer 1 transcripts in gastric cancer patient
plasma as diagnostic and prognostic biomarker. World J
Gastroenterol. 21:333–341. 2015. View Article : Google Scholar : PubMed/NCBI
|
|
38
|
Stein U, Burock S, Herrmann P, Wendler I,
Niederstrasser M, Wernecke KD and Schlag PM: Circulating MACC1
transcripts in colorectal cancer patient plasma predict metastasis
and prognosis. PLoS One. 7:e492492012. View Article : Google Scholar :
|
|
39
|
Ackerman SE, Blackburn OA, Marchildon F
and Cohen P: Insights into the link between obesity and cancer.
Curr Obes Rep. 6:195–203. 2017. View Article : Google Scholar : PubMed/NCBI
|
|
40
|
Berger NA: Obesity and cancer
pathogenesis. Ann N Y Acad Sci. 1311:57–76. 2014. View Article : Google Scholar : PubMed/NCBI
|
|
41
|
Himbert C, Delphan M, Scherer D, Bowers
LW, Hursting S and Ulrich CM: Signals from the adipose
microenvironment and the obesity-cancer link-A systematic review.
Cancer Prev Res (Phila). 10:494–506. 2017. View Article : Google Scholar
|
|
42
|
Crawley DJ, Holmberg L, Melvin JC, Loda M,
Chowdhury S, Rudman SM and Van Hemelrijck M: Serum glucose and risk
of cancer: A meta-analysis. BMC Cancer. 14:9852014. View Article : Google Scholar : PubMed/NCBI
|
|
43
|
Hope C, Robertshaw A, Cheung KL, Idris I
and English E: Relationship betweenHbA1c and cancer in people with
or without diabetes: A systematic review. Diabet Med. 33:1013–1025.
2016. View Article : Google Scholar
|
|
44
|
Luo J, Hendryx M, Manson JE, Figueiredo
JC, LeBlanc ES, Barrington W, Rohan TE, Howard BV, Reding K, Ho GY,
et al: Intentional weight loss and obesity-related cancer risk.
JNCI Cancer Spectr. 3:pkz0542019. View Article : Google Scholar : PubMed/NCBI
|
|
45
|
Tee MC, Cao Y, Warnock GL, Hu FB and
Chavarro JE: Effect of bariatric surgery on oncologic out-comes: A
systematic review and meta-analysis. Surg Endosc. 27:4449–4456.
2013. View Article : Google Scholar : PubMed/NCBI
|