Introduction
It is estimated that 19.3 million new cancer cases
and nearly 10 million cancer-associated deaths occurred in 2020
world-wide (1). Furthermore, the
global cancer burden is projected to reach 28.4 million cases in
2040, representing a 47% increase from 2020 (1). Cancer is largely considered a
disease of gene alterations and mutations. Therefore, it is of
great significance to conduct comprehensive pan-cancer studies on
genes associated with the diagnosis, prognosis and treatment of
cancer.
Mineral dust-induced gene (MDIG) is an oncogene that
may be induced by environmental factors, including mineral dust
(2), tobacco smoke (3), arsenic (4) and silica (5). It encodes a nuclear protein with a
molecular weight of 53 kDa (6)
and is also known as MYC induced nuclear antigen 53 (MINA53)
(6), nucleolar protein 52
(7), ribosomal oxygenase 2
(RIOX2) (8) and JmjC
domain-containing protein 10 (9).
MDIG contributes to the occurrence and development of multiple
tumors, mainly through post-translational protein hydroxylation
(10) and epigenetic
demethylation (via a hydroxylation reaction) (11). Previous studies have suggested
that MDIG is highly expressed in a variety of tumor tissue types,
including lung (12), breast
(13), liver (14), colon (15) and gastric cancer (16), as well as renal cell carcinoma
(17), gingival squamous cell
carcinoma (18) and lymphoma
(19). Furthermore, high
expression of MDIG is usually associated with poor prognosis
(20). Of note, another study
indicated that, compared with low expression of MDIG, high
expression was associated with a favorable prognosis in patients
with lung cancer (21).
Similarly, a study on breast cancer indicated that the expression
levels of MDIG were associated with lymph node metastasis and that
increased MDIG expression predicted poor overall survival (OS) in
patients with lymph node metastasis (13,22,23). Furthermore, MDIG may have
different roles in different stages of tumor development, promoting
tumor proliferation in the early stages of tumor occurrence, but
inhibiting tumor invasion and migration in the advanced stages of
tumor progression (22). In
addition, MDIG also has an effect on tumor therapy. A previous
study by our group suggested that MDIG promoted cisplatin
resistance in lung adenocarcinoma (LUAD) by regulating ABC
transporter expression via activation of the Wnt/β-catenin
signaling pathway (24).
Furthermore, MDIG deficiency sensitized glioblastoma cells to
doxorubicin (25). In addition,
MDIG induced tumor angiogenesis by promoting the activation of the
EGFR/phosphorylated (P-) EGFR (Tyr1068)/VEGF-A/VEGF-R1/R2 pathway
(26). In the light of these
results, it may be hypothesized that MDIG is not only closely
linked to cancer diagnosis and prognosis but may also affect
chemotherapy and anti-angiogenic targeted therapy. It is worth
noting that studies on MDIG have so far been limited to a small
number of tumor types. Furthermore, studies evaluating the
association between MDIG and antitumor immunity are still
lacking.
The aim of the present study was to carry out a
pan-cancer analysis of MDIG expression and determine its
association with the prognosis and tumor microenvironment
(TME)-immunological characteristics using public datasets.
Furthermore, the prognostic effect of MDIG was validated in a
cohort of patients with bladder carcinoma (BLCA) who had received
anti-programmed cell death 1 ligand 1 (PD-L1) immunotherapy. In
addition, chemotherapeutic drug sensitivity in The Cancer Genome
Atlas (TCGA)-LUAD cohort was assessed and gene set variant analysis
(GSVA) and gene set enrichment analysis (GSEA) were conducted in
the TCGA-LUAD cohort. Finally, in vitro experiments were
used to verify the molecular mechanisms.
Materials and methods
Analysis of MDIG expression in different
types of cancer
MDIG expression in normal tissue was assessed via
the Genotype-Tissue Expression (GTEx) database (https://gtexportal.org) (27) using the gene symbol RIOX2. In
addition, data downloaded from the Cancer Cell Line Encyclopedia
(CCLE; https://sites.broadinstitute.org/ccle/) for the gene
symbol RIOX2 were used to analyze the expression of MDIG in cancer
cell lines representing 30 types of cancer. Furthermore, the TCGA
database (https://portal.gdc.cancer.gov/) (28), which is the largest database of
cancer genetic information available, holds transcriptome data,
clinical information and methylation data. The mRNA expression data
from RNA-sequencing (RNA-seq) of 33 tumor types of a pan-cancer
panel were downloaded for subsequent bioinformatics analysis. All
data were obtained in December 2021. First, RNA-seq datasets for 33
types of cancer in TCGA were used to analyze the differences in
MDIG expression between tumor and paired normal tissue samples.
Next, the clinicopathological characteristics of the patients
(smoking and age) were obtained from the TCGA-LUAD cohort and
assessed for their association with MDIG expression. For all gene
expression analyses, the RNA-seq data were downloaded as
log2 (TPM+1), where TPM is the transformation to
transcripts per million mapped reads. Furthermore,
immunohistochemical staining images of MDIG expression in normal
lung and lung cancer tissue were obtained from the Human Protein
Atlas (HPA; https://www.proteinatlas.org/) using the gene symbol
RIOX2.
Survival analysis of MDIG in different
types of cancer
The OS and progression-free interval (PFI) data of
patients with different types of cancer were obtained from the
University of California Santa Cruz (UCSC) Xena database
(https://xena.ucsc.edu/) (29) using the gene symbol RIOX2.
Univariate Cox regression (uniCox) and Kaplan-Meier (KM) analyses
were performed to examine the effect of MDIG on patient survival
using the R packages 'forestplot (version 1.10.1)', 'survival
(version 3.210)' and 'survminer (version 0.4.9)'. The expression
levels of MDIG in tumor and adjacent noncancerous tissue samples
were divided into a high- and a low-expression group according to
the median of the cohort.
Analysis of MDIG alterations in different
types of cancer
The mutational status (alteration frequency and
mutation type) of MDIG were all analyzed in TCGA tumor datasets
from cBioPortal (https://www.cbioportal.org/) (30) using the 'quick selection' section
to investigate 'TCGA Pan Cancer Atlas Studies'. 'RIOX2' was entered
for queries regarding the genetic alteration. The 'mutations'
module was used to explore the mutated site of MDIG, which is
displayed in the schematic diagram of the protein structure or the
three-dimensional structure. The analysis was performed and
graphically presented using the 'Cancer Types Summary (version
1.20.0)' and 'Complex Heatmap (version 2.2.0)' R packages,
respectively.
Promoter methylation status and the
association with important oncogenes of MDIG in non-small cell lung
cancer (NSCLC)
Data on the promoter methylation status of MDIG in
NSCLC were obtained from the UALCAN database (http://ualcan.path.uab.edu/index.html)
(31) using the gene symbol MINA.
The DNA methylation data were presented as β-values ranging from 0
(unmethylated) to 1 (fully methylated). Furthermore, the Spearman's
correlation between the expression of MDIG and that of C-Myc, an
important proto-oncogene in NSCLC (32), or tumor protein 53 (TP53), an
important tumor suppressor gene in NSCLC (33), was examined in the TCGA-LUAD
cohort.
Correlation analysis of MDIG expression
and immunological characteristics
Cell type Identification by Estimating Relative
Subsets of RNA Transcripts (CIBERSORT) (34) was used to analyze the relationship
between MDIG and 22 types of tumor-infiltrating immune cell in TCGA
datasets. Furthermore, the TME-relevant signatures were correlated
with the immunotherapy response (35,36) and the CIBERSORT algorithm was used
to quantify the content of TME-relevant signatures in different
types of cancer in the CIBERSORT web portal (https://cibersort.stanford.edu) using the gene symbol
RIOX2.
In addition, the relationship between the expression
of MDIG and that of immune-relevant genes closely related to tumor
immune escape, as well as immunotherapy responsiveness (37), were examined using the
tumor-immune system interactions database (TISIDB) website
(http://cis.hku.hk/TISIDB/) (38) using the gene symbol MINA. The
analyzed immune-relevant genes included immunostimulatory, immune
checkpoint and chemokine receptor.
Association analysis of MDIG with tumor
mutational burden (TMB) and microsatellite instability (MSI)
The analysis of the association between MDIG
expression and TMB or MSI was performed using Spearman's
correlation coefficient. The 'fmsb (version 0.7.2)', 'limma
(version 3.28.14)' and 'dplyr (version 0.7.8)' R package was used
to analyze the pan-cancer data of MDIG for 33 types of cancer.
Cohort validation of the prognostic value
of MDIG for immunotherapy
A systemic study of immune checkpoint blockade gene
expression profiles was performed. Gene expression and
immunotherapeutic efficacy were obtained from the IMvigor210
cohort, which was a cohort with open information from a previous
study (39), with the
'IMvigor210' package. According to the correlation between MDIG
expression (RNA-seq) and patient survival, the 'surv-cutpoint'
function of the 'survminer (version 0.4.9)' R package was used to
divide patients into high and low MDIG expression groups according
to the median of the cohort. The KM method and log-rank test were
used to analyze patient OS.
Drug sensitivity analysis of MDIG in the
TCGA-LUAD cohort
The response to chemotherapy for LUAD was predicted
using the Genomics of Drug Sensitivity in Cancer (GDSC) database
(https://www.cancerrxgene.org/) (40). The expression levels of MDIG
(RNA-seq data) in the TCGA-LUAD cohort were divided into a high and
a low-expression group according to the median. A total of 138
drugs had potential for the treatment of cancer. The R software
package 'pRRophetic' (41) was
used to predict the chemotherapy sensitivity of each sample. In
brief, the half-maximal inhibitory concentration (IC50)
of the LUAD samples was calculated through ridge regression and the
prediction accuracy was assessed by 10-fold cross-validation based
on the GDSC training set (42).
Furthermore, the estimated IC50 for each specific
chemotherapeutic agent between a high- and a low-expression group
was compared using the Wilcoxon's rank-sum test.
Functional enrichment analysis of MDIG in
the TCGA-LUAD cohort
GSVA (43) and
GSEA (44) were performed using
the 'GSVA (version 1.20.0)', 'limma (version 3.28.14)' and
'clusterProfiler (version 3.16.1)' packages to identify the
pathways in which the genes co-expressed with MDIG were
significantly enriched in the TCGA-LUAD cohort. To determine
significant gene sets in the Kyoto Encyclopedia of Genes and
Genomes (KEGG) and Gene Ontology (GO) analyses, |normalized
enrichment score|>1, P-value <0.05 and false discovery rate
(FDR) <0.25 were used as the threshold for GSEA; pathways were
considered significantly enriched when they met the
sub-conditions.
Cell culture, lentiviral transduction and
treatments
The human lung adenocarcinoma cell line A549 (cat.
no. TCHu150) and the human umbilical vein endothelial cell line
EA.hy926 (cat. no. GNHu39) were purchased from the Cell Culture
Center of the Chinese Academy of Medical Sciences. The EA.hy926
cell line was originally established by fusing primary human
umbilical vein cells with a thioguanine-resistant clone of A549 by
exposure to polyethylene glycol. The cells were identified by short
tandem repeat profiling and were free of mycoplasma infection. The
cells were cultured in RPMI-1640 culture medium containing 10%
fetal bovine serum (FBS; both from Hyclone; Cytiva) in a 5%
CO2 cell incubator (Thermo Fisher Scientific, Inc.) at
37°C.
The MDIG overexpression lentiviral vector (LV-MDIG;
GenBank accession no. NM_032778), empty control lentiviral vector
(vector), MDIG short hairpin RNA (shRNA) silencing lentiviral
vectors (shRNA1, 5′-GGG TGA TTT GTT GTA CTT T-3′; shRNA2, 5′-AAC
GAT TCA GTT TCA CCA A-3′) and a control shRNA lentiviral vector
(con, 5′-TTC TCC GAA CGT GTC ACG T-3′) were purchased from Shanghai
GeneChem Co., Ltd. The overexpression vector was sent for
sequencing and designated GV365 (pUbi-MCS-3FLAG-pCMV-EGFP) and the
knockdown vector was sent for sequencing and designated GV248
(phU6-MCS-PUbi-EGFP). The experimental procedures were performed
according to the manufacturer's protocol. As described in a
previous study by our group (26), in brief, the day before
transfection, 5 ml (5×10⁴ cells/ml) of the target cells
were inoculated into a T25 flask (Corning, Inc.). When confluence
reached 30-50%, the cells were incubated with lentivirus at a
multiplicity of infection of 20 for A549 cells and 10 for EA.hy926
cells. The cells were maintained at 37°C, with a 5% volume fraction
of CO2 and saturated humidity. After 72 h, stably
transfected A549 cells were grown in RPMI-1640 medium supplemented
with 2.0 g/ml puromycin and 10% FBS for 2 weeks. Stably transfected
EA.hy926 cells were screened with 1.0 g/ml puromycin as described
above.
To inhibit PI3K-dependent Akt phosphorylation and
kinase activity, EA.hy926 cells transduced with LV-MDIG were
treated with 30 µM LY294002 (cat. no. 9901; Cell Signaling
Technology, Inc.) at 37.5°C for 24 h.
Cell proliferation assay
For EdU assays, cells were seeded into 6-well plates
at a density of 5×10³ cells/ml. After being subjected to
the corresponding treatment, the cells were cultured for 72 h and
then used for EdU assays using a commercial kit (cat. no. C0071S;
Beyotime Institute of Biotechnology). The cells were incubated with
50 µM EdU solution for 12 h, fixed in 4% paraformaldehyde
for 30 min at room temperature and further incubated in 5% glycine
for 5 min at room temperature. The cells were washed in 1X PBS,
followed by treatment with 0.5% Triton X-100 at room temperature
for 30 min. The samples in each well were incubated with 100
µl Apollo® mixture (cat. no. C0071S; Beyotime
Institute of Biotechnology) for 30 min at room temperature.
Finally, the cell nuclei were stained using Hoechst 33342 solution
(cat. no. C0071S-6; Beyotime Institute of Biotechnology) at 25°C
for 25 min. Images were captured using a fluorescence microscope
(Observer A1; ZEISS). The number of EdU-positive cells was counted
using ImageJ software (version 1.8.0_172; National Institutes of
Health).
For Cell Counting Kit-8 (CCK-8) assays, transfected
A549 and EA.hy926 cells were seeded at a density of
5×10³ cells/well and were examined at 6, 24, 48, 72 and
96 h post-transfection according to the manufacturer's protocols.
Cell viability was evaluated using a CCK-8 kit (Beyotime Institute
of Biotechnology). In brief, CCK-8 solution was added to each well
and the cells were incubated for an additional 2 h. The absorbance
at 450 nm was measured using a microplate reader (Tecan Infinite
M200PRO; Tecan Group, Ltd.).
Western blot analysis
Cells were lysed using lysis buffer (cat. no. 9803S;
Cell Signaling Technology, Inc.) supplemented with a protease
inhibitor cocktail (cat. no. 11697498001; Roche Diagnostics GmbH)
for 30 min at 4°C. The protein concentration was measured by a
bicinchoninic acid assay (Thermo Fisher Scientific, Inc.). A total
of 30 µg protein per lane was separated using 8-14% SDS-PAGE
(Bio-Rad Laboratories, Inc.) and transferred to PVDF membranes
(Merck Life Sciences, Inc.), which were then blocked at room
temperature for 2 h with 5% skimmed dried milk (cat. no. 1172GR500;
BioFroxx). The membranes were subsequently washed with 1X
Tris-buffered saline containing 0.1% Tween®-20 detergent
(1X TBST) and then incubated with primary antibodies against MINA53
(cat. no. sc-398521), cyclin-dependent kinase (CDK)2 (cat. no.
sc-6248), CDK6 (cat. no. sc-7961), CDK inhibitor 1A (CDKN1A; cat.
no. sc-6246), CDKN2D (cat. no. sc-1665; all at 1:1,000 dilution;
mouse monoclonal; Santa Cruz Biotechnology, Inc.), pan-Akt (cat.
no. 4691), pyruvate dehydrogenase kinase 1 (PDK1; cat. no. 13037),
P-PDK1 (Ser241; cat. no. 3438), P-Akt (Thr308; cat. no. 13038),
mTOR (cat. no. 2983), GβL (cat. no. 3274), Rictor (cat. no. 9476),
P-Akt (Ser473; cat. no. 4060) and GAPDH (cat. no. 5174; all at
1:1,000 dilution; rabbit monoclonal; Cell Signaling Technology,
Inc.) at 4°C overnight. After another wash with 1X TBST, the
membranes were incubated with anti-mouse IgG (cat. no. sc-2005;
1:3,000 dilution; Santa Cruz Biotechnology, Inc.) or anti-rabbit
IgG (cat. no. 7074; 1:3,000 dilution; Cell Signaling Technology,
Inc.) as the secondary antibody at room temperature for 2 h.
Immunoreactive bands were detected using an enhanced
chemiluminescence (ECL) western blotting system (Clarity Western
ECL Substrate; Bio-Rad Laboratories, Inc.). The greyscale densities
of the bands were measured using Image J software (version
1.8.0_172; National Institutes of Health), and the density ratio of
each protein band was normalized to that of GAPDH and expressed as
the percentage of the corresponding control group. Phosphoproteins
were presented as the ratio of phosphoprotein to total protein.
Statistical analysis
All statistical analyses were performed using R
(version 4.0.3) and R packages 'ggplot2 (version 3.3.3)', 'ggpubr
(version 0.4.0)', 'pheatmap (version 1.0.12)' and 'cowplot (version
1.1.1)' were used for visualization. In the bioinformatics
analyses, Kruskal-Wallis tests were performed to examine the
differences in MDIG expression between different tissue types and
cancer cell lines. Furthermore, Kruskal-Wallis tests were performed
to examine the differences in the clinicopathological
characteristics of the patients (smoking and age), followed by
Dunn's test. The significance of the difference in gene expression
between cancerous and para-cancerous normal tissues, the drug
sensitivity analysis, and the correlation analysis between MDIG
expression and TME-relevant signatures in BLCA were determined
using Wilcoxon's rank-sum test. Patient prognosis was evaluated
using uniCox and the results were presented as the hazard ratio
(HR) with 95% confidence interval and P-values. The KM method with
log-rank tests was used to estimate the survival probability
against time, but when there was a late-stage crossover between the
groups, Renyi-type tests were used, with the results presented as
P-values. The correlation between MDIG expression and immunological
characteristics was evaluated using Pearson's correlation or
Spearman's correlation tests. P<0.05 was considered to indicate
a statistically significant difference.
All data obtained from in vitro experiments
were expressed as the mean ± standard deviation. Comparisons
between groups were performed using one-way ANOVA (CCK-8 assay, EdU
assay and western blotting) followed by Tukey's post-hoc test by
RStudio (RStudio; https://www.rstudio.com). P<0.05 was considered to
indicate a statistically significant difference. All experiments
were performed at least three times.
Results
Expression of MDIG in different types of
cancer
In the datasets obtained from the GTEx database,
MDIG was significantly differentially expressed in all human
tissues and organs, among which the thyroid gland and skeletal
muscle had high expression levels, while the testis and lung had
low expression levels (Fig. 1A).
Furthermore, the expression levels of MDIG in 1,363 cell lines from
30 types of cancer were analyzed in CCLE datasets. The results
indicated that MDIG was significantly differentially expressed in
most cancer cell lines compared to each other (Fig. 1B).
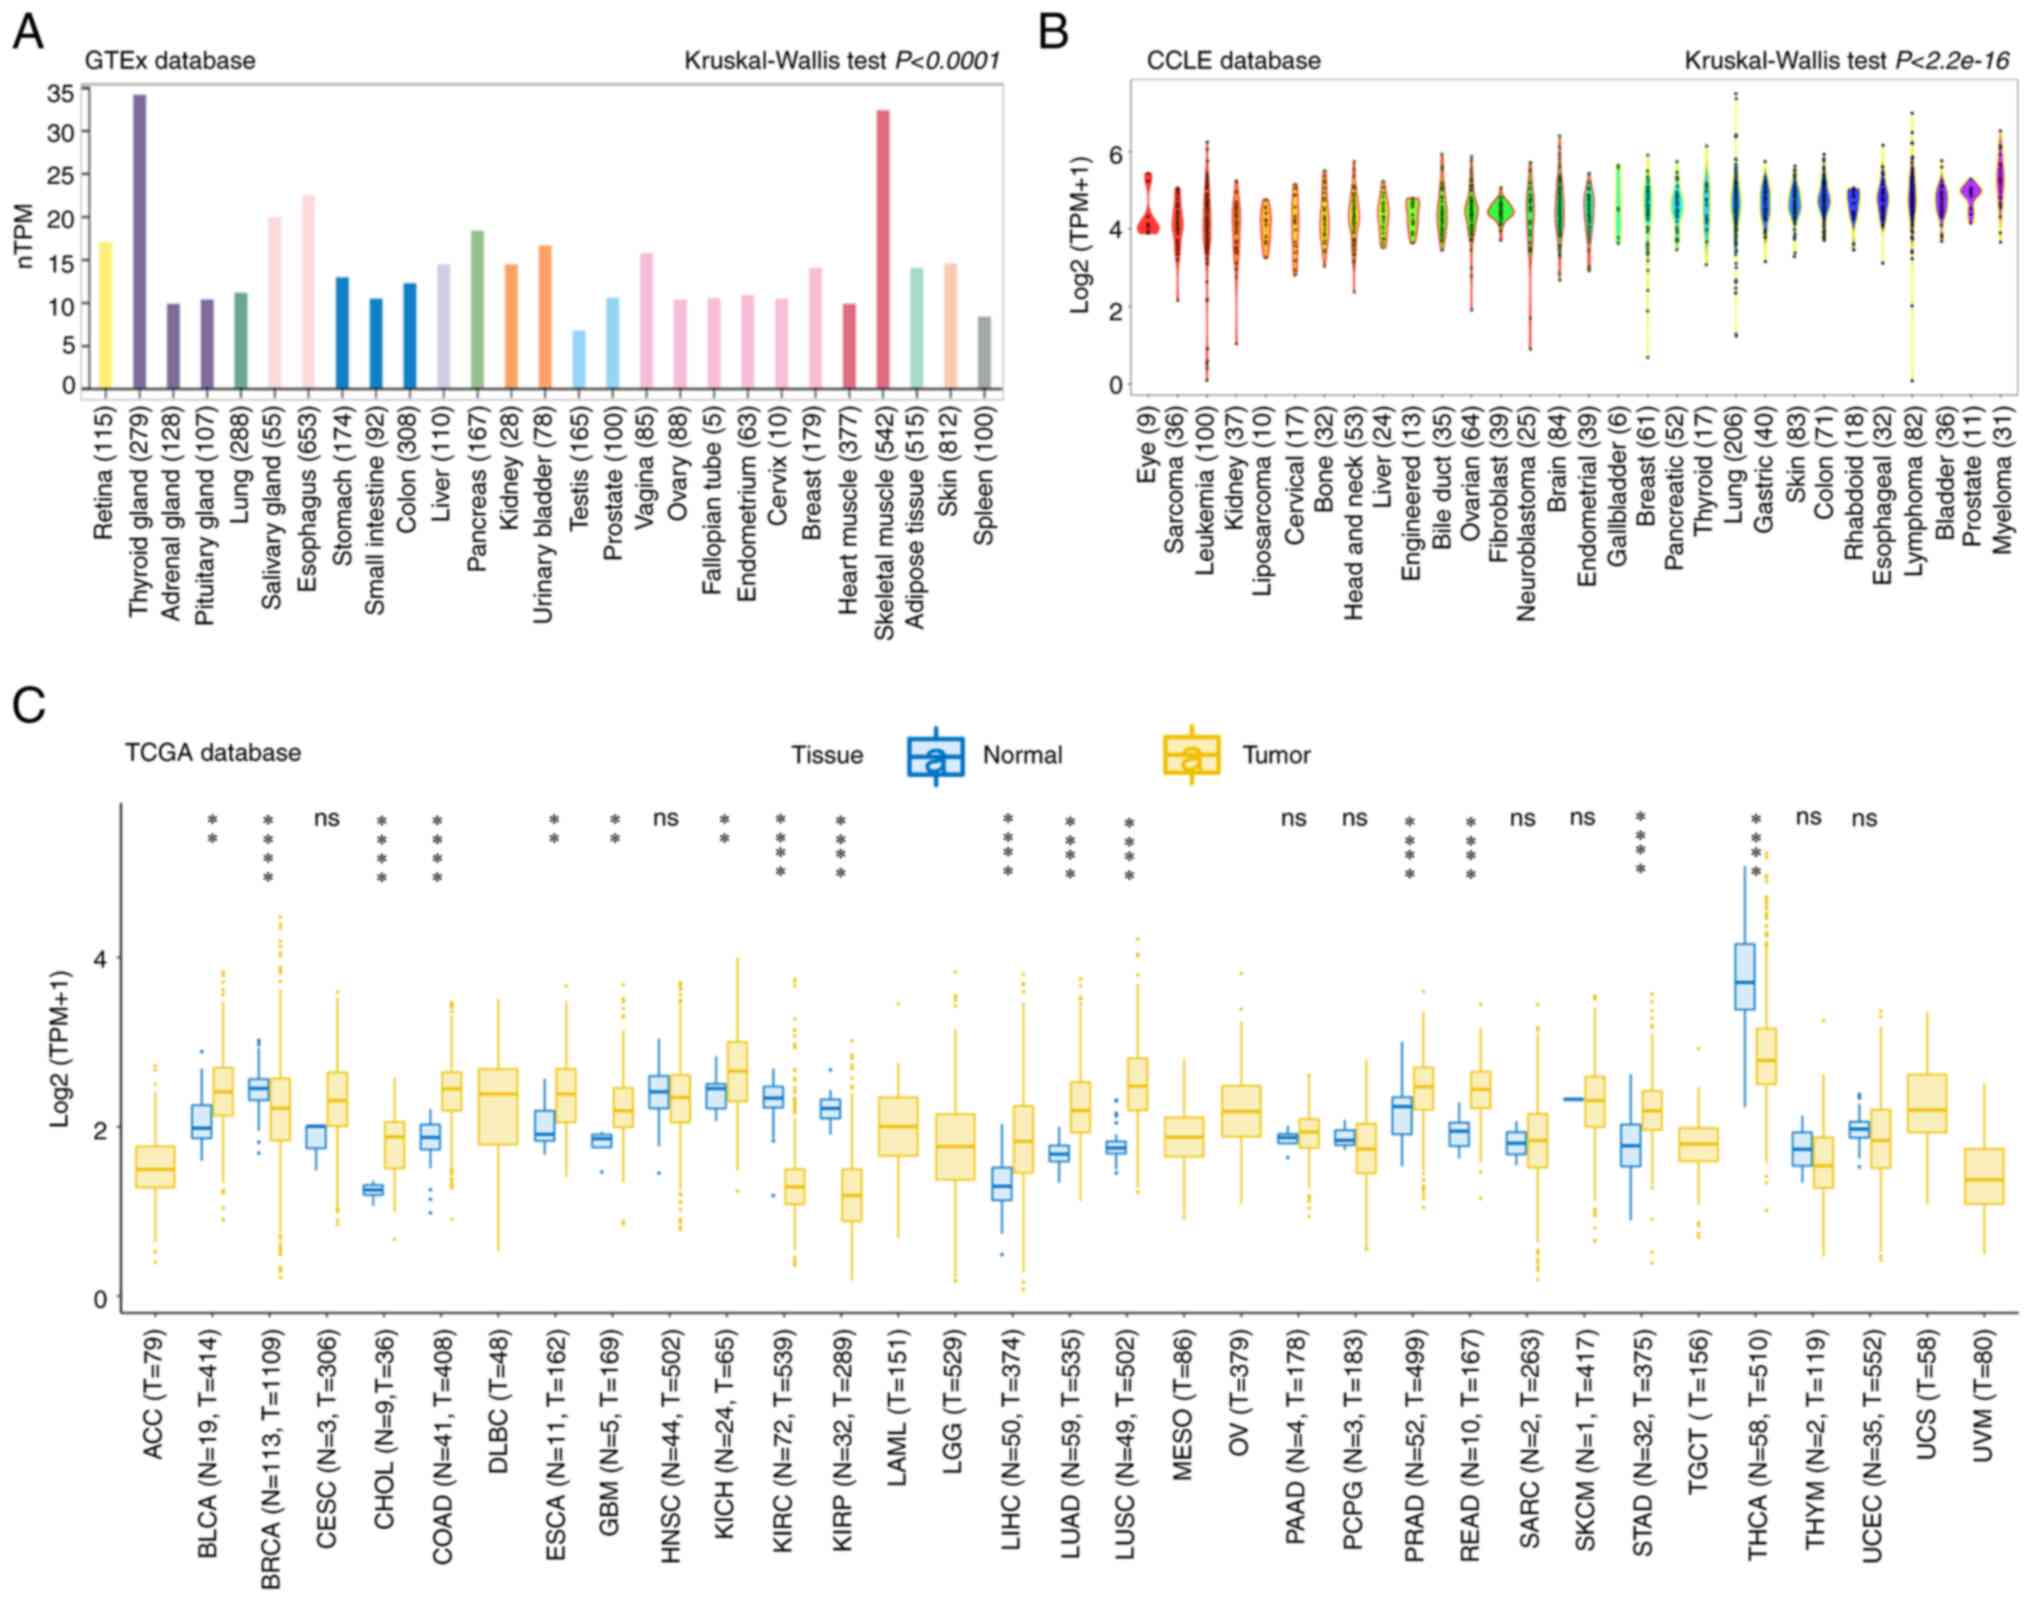 | Figure 1MDIG expression in various types of
cancer. (A) Different expression levels of MDIG among 27 normal
tissue types in a GTEx dataset determined using Kruskal-Wallis
tests. (B) Different expression levels of MDIG among cancer cell
lines representing 30 types of cancer in a CCLE dataset according
to Kruskal-Wallis tests. (C) Expression levels of MDIG in a dataset
from TCGA comprising 33 tumor tissue types and paired adjacent
noncancerous tissue (Wilcoxon rank-sum test). Data in the box plot
are presented as the median and 25-75th percentile, and the
vertical bars indicate the standard deviation and the dots
outliers. **P<0.01, ****P<0.0001. ns,
no significance; N, normal; T, tumor; MDIG, mineral dust-induced
gene; TPM, transcripts per million mapped reads; GTEx,
Genotype-Tissue Expression; CCLE, Cancer Cell Line Encyclopedia;
TCGA, The Cancer Genome Atlas; ACC, adrenocortical carcinoma; BLCA,
bladder urothelial carcinoma; BRCA, breast invasive carcinoma;
CESC, cervical squamous cell carcinoma; CHOL, cholangiocarcinoma;
COAD, colon adenocarcinoma; DLBC, diffuse large B cell lymphoma;
ESCA, esophageal carcinoma; GBM, glioblastoma; HNSC, head and neck
squamous cell carcinoma; KICH, kidney chromophobe; KIRC, kidney
renal clear cell carcinoma; KIRP, kidney renal papillary cell
carcinoma; LAML, acute myeloid leukemia; LGG, brain lower grade
glioma; LIHC, liver hepatocellular carcinoma; LUAD, lung
adenocarcinoma; LUSC, lung squamous cell carcinoma; MESO,
mesothelioma; OV, ovarian serous cystadenocarcinoma; PAAD,
pancreatic adenocarcinoma; PCPG, pheochromocytoma and
paraganglioma; PRAD, prostate adenocarcinoma; READ, rectum
adenocarcinoma; SARC, sarcoma; SKCM, skin cutaneous melanoma; STAD,
stomach adenocarcinoma; TGCT, testicular germ cell tumors; THCA,
thyroid carcinoma; THYM, thymoma; UCEC, uterine corpus endometrial
carcinoma; UCS, uterine carcinosarcoma; UVM, uveal melanoma. |
MDIG expression in cancer and paired adjacent tissue
samples was then analyzed in TCGA datasets. MDIG was significantly
upregulated in BLCA, cholangiocarcinoma (CHOL), colon
adenocarcinoma (COAD), esophageal carcinoma (ESCA), glioblastoma
(GBM), liver hepatocellular carcinoma (LIHC), LUAD, lung squamous
cell carcinoma (LUSC), prostate adenocarcinoma (PRAD), rectum
adenocarcinoma (READ) and stomach adenocarcinoma (STAD) tumor
tissue compared with normal adjacent tissue. By contrast, MDIG
expression was significantly downregulated in breast invasive
carcinoma (BRCA), kidney renal clear cell carcinoma (KIRC), kidney
renal papillary cell carcinoma (KIRP) and thyroid carcinoma (THCA)
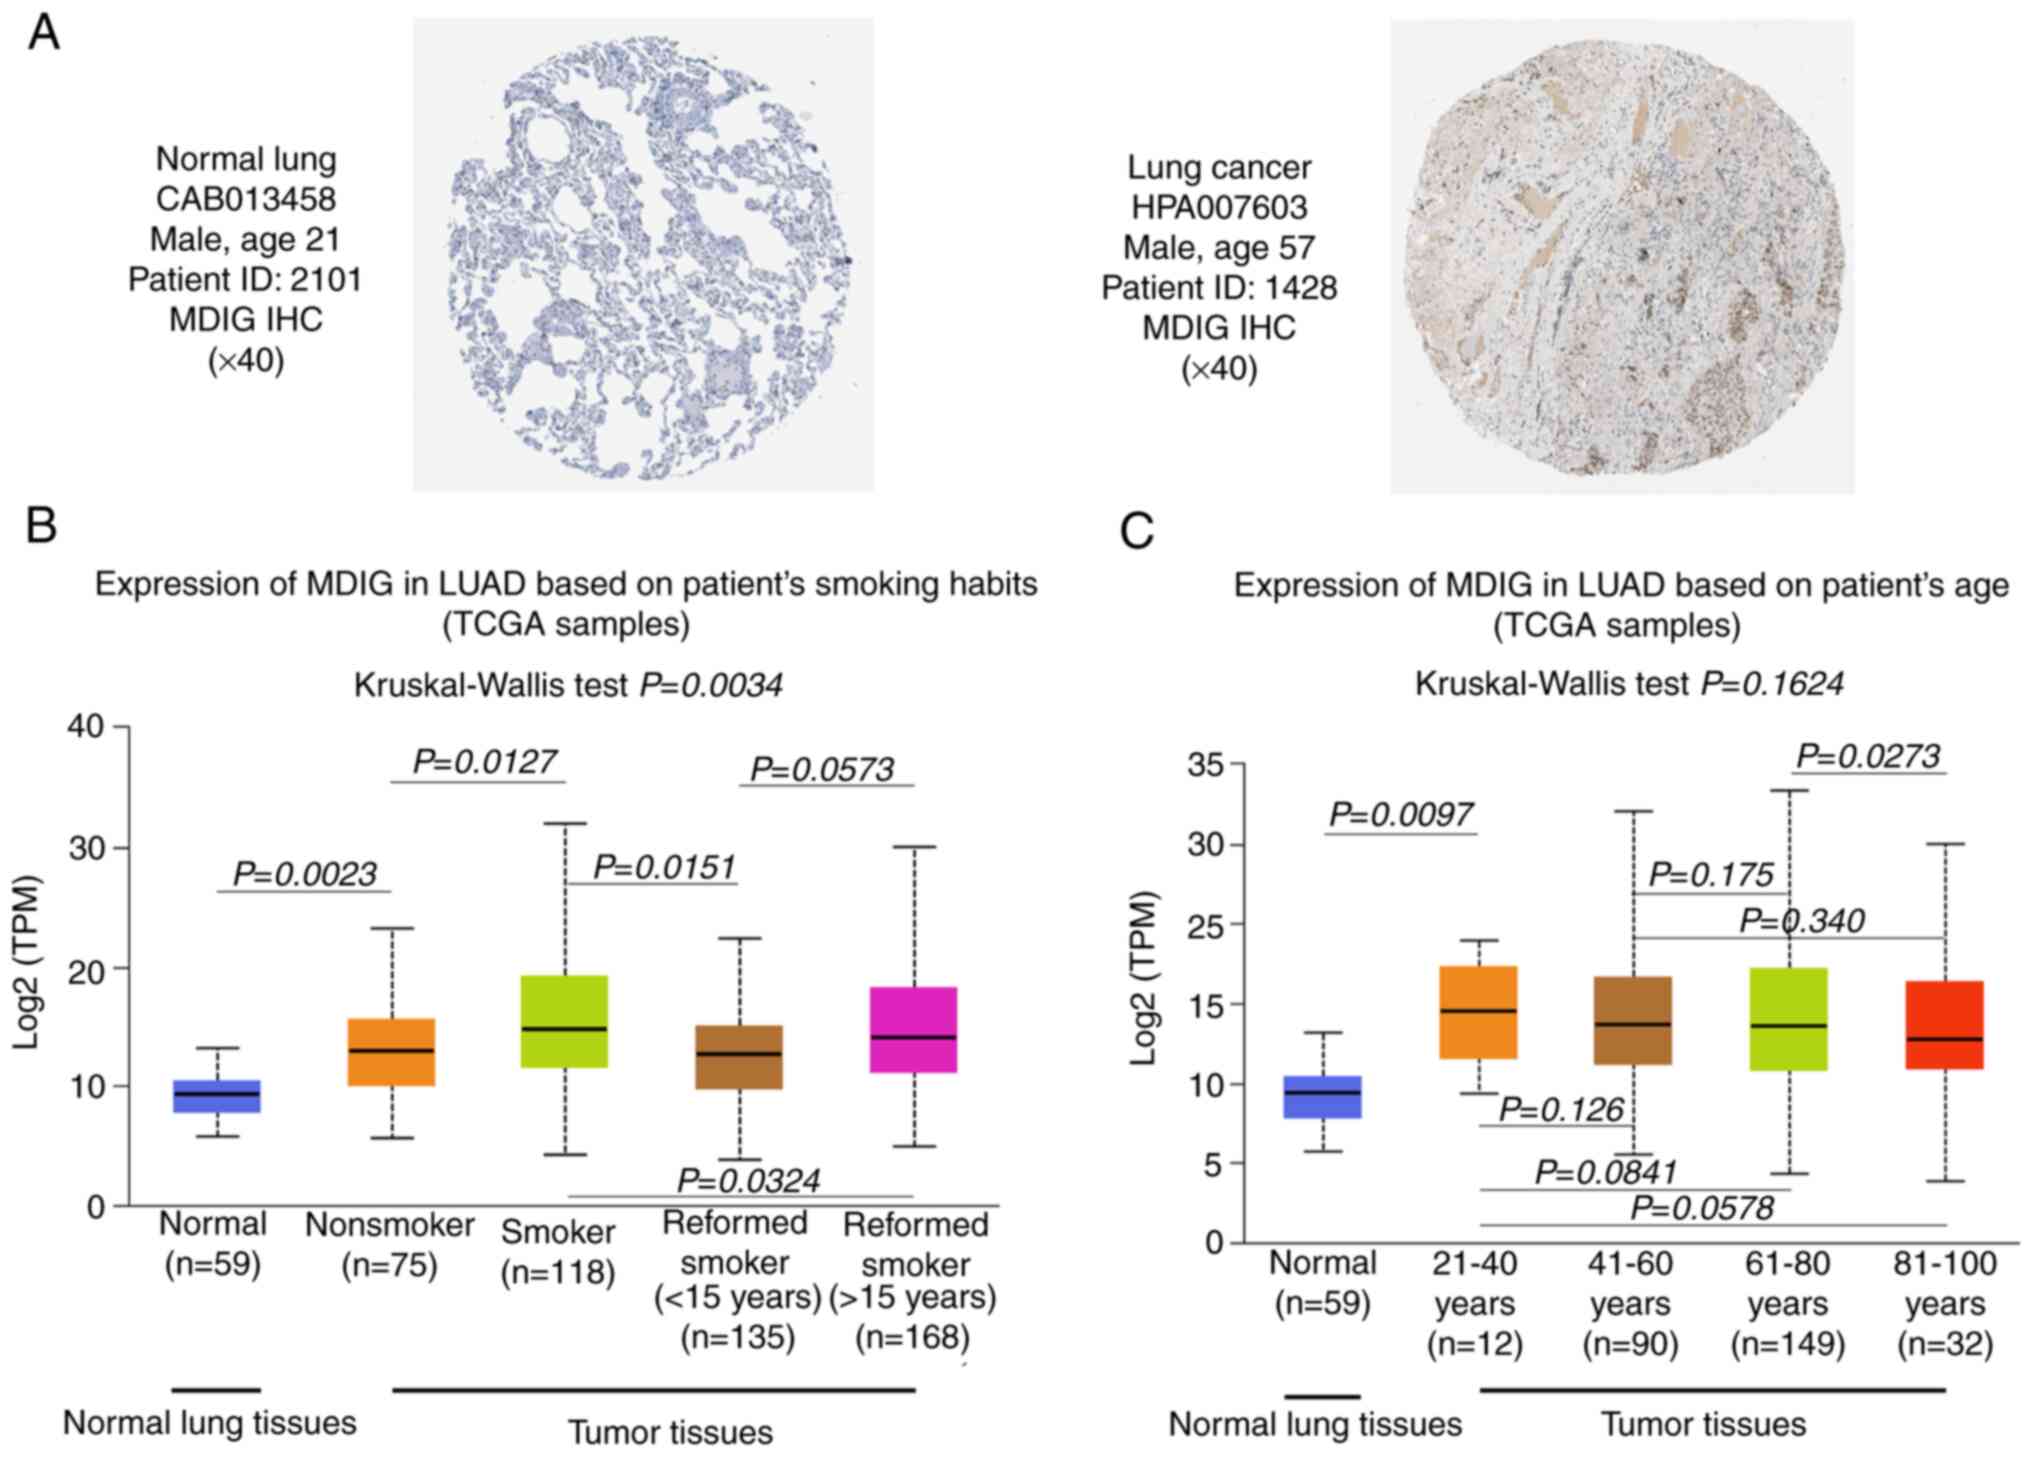
(Fig. 1C). At the protein level,
immunohistochemistry images from the HPA suggested that MDIG
protein was expressed at low levels in normal lung tissue but
markedly upregulated in lung cancer tissue (Fig. 2A). In addition, MDIG expression
was significantly higher in patients with LUAD and a history of
smoking than in those without a history of smoking. Furthermore,
MDIG expression levels were significantly lower after smoking
cessation but did not change with the duration of cessation
(Fig. 2B). However, age did not
affect MDIG expression in LUAD (Fig.
2C).
Survival analysis of MDIG in different
types of cancer
Since MDIG was highly expressed in several types of
tumor tissue, the UCSC Xena database was used to examine the
association between MDIG and clinical prognosis in different types
of cancer. The uniCox OS results indicated that MDIG was a risk
factor in KIRP (HR=1.352, P=0.002), brain lower grade glioma (LGG)
(HR=1.224, P<0.001), LIHC (HR=1.154, P<0.001), pancreatic
adenocarcinoma (PAAD) (HR=1.332, P=0.022), PRAD (HR=1.458, P=0.028)
and sarcoma (SARC) (HR=1.157, P=0.010). Of note, the opposite
results were found for READ (HR=0.549, P=0.001) and uveal melanoma
(UVM) (HR=0.596, P=0.039) (Fig.
3). For the PFI, MDIG was a risk factor in BLCA (HR=1.112,
P=0.005), KIRP (HR=1.244, P=0.019), LGG (HR=1.202, P<0.001),
LIHC (HR=1.097, P=0.009), PAAD (HR=1.304, P=0.026) and uterine
corpus endometrial carcinoma (UCEC) (HR=1.172, P=0.006). However,
the opposite result was obtained for pheochromocytoma and
paraganglioma (HR=0.581, P=0.031) (Fig. 3).
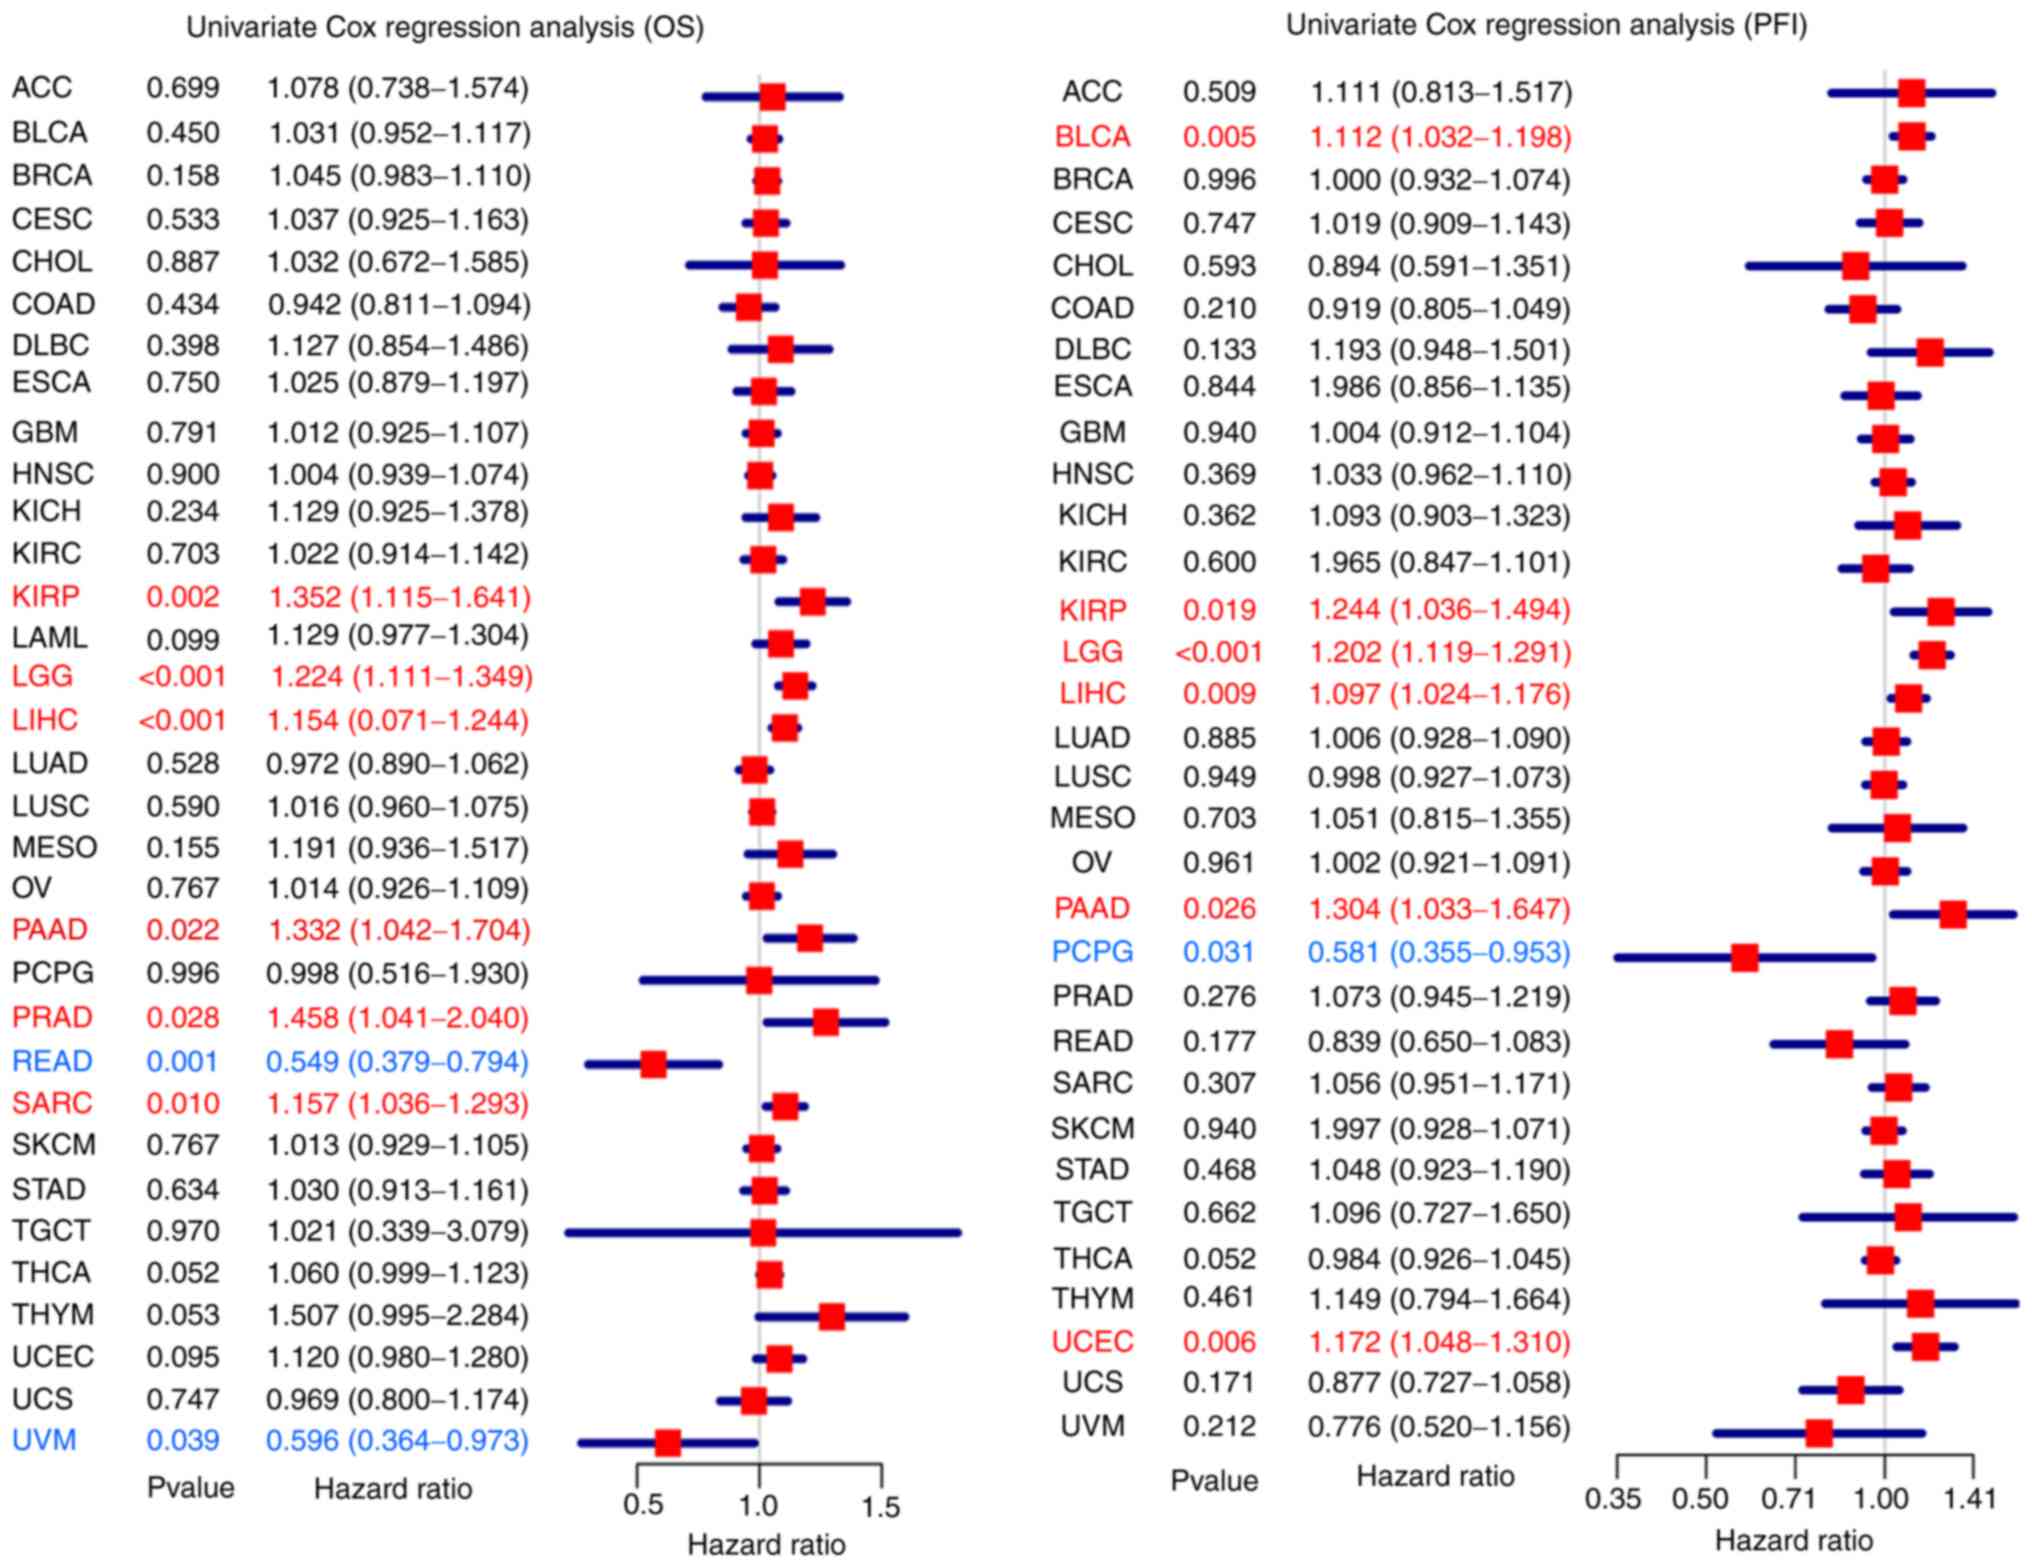 | Figure 3Relationship between high expression
of MDIG and patient OS (left panel) and PFI (right panel). The
forest plots were generated using univariate survival analysis in
various cancer types. HR>1 indicates that MDIG high expression
represents a risk factor, whereas HR<1 suggests that it is a
protective factor. MDIG, mineral dust-induced gene; HR, hazard
ratio; OS, overall survival; PFI, progression-free interval; ACC,
adrenocortical carcinoma; BLCA, bladder urothelial carcinoma; BRCA,
breast invasive carcinoma; CESC, cervical squamous cell carcinoma;
CHOL, cholangiocarcinoma; COAD, colon adenocarcinoma; DLBC, diffuse
large B cell lymphoma; ESCA, esophageal carcinoma; GBM,
glioblastoma; HNSC, head and neck squamous cell carcinoma; KICH,
kidney chromophobe; KIRC, kidney renal clear cell carcinoma; KIRP,
kidney renal papillary cell carcinoma; LAML, acute myeloid
leukemia; LGG, brain lower grade glioma; LIHC, liver hepatocellular
carcinoma; LUAD, lung adenocarcinoma; LUSC, lung squamous cell
carcinoma; MESO, mesothelioma; OV, ovarian serous
cystadenocarcinoma; PAAD, pancreatic adenocarcinoma; PCPG,
pheochromocytoma and paraganglioma; PRAD, prostate adenocarcinoma;
READ, rectum adenocarcinoma; SARC, sarcoma; SKCM, skin cutaneous
melanoma; STAD, stomach adenocarcinoma; TGCT, testicular germ cell
tumors; THCA, thyroid carcinoma; THYM, thymoma; UCEC, uterine
corpus endometrial carcinoma; UCS, uterine carcinosarcoma; UVM,
uveal melanoma. |
In addition, in the KM analysis of OS, high MDIG
expression predicted unfavorable OS in patients with BRCA, KIRP,
LGG, LIHC, PAAD, SRAC and UCEC (Fig.
4). Furthermore, high MDIG expression predicted shorter PFI
times in patients with KIRP, LGG, LIHC, PAAD and UCEC (Fig. 4).
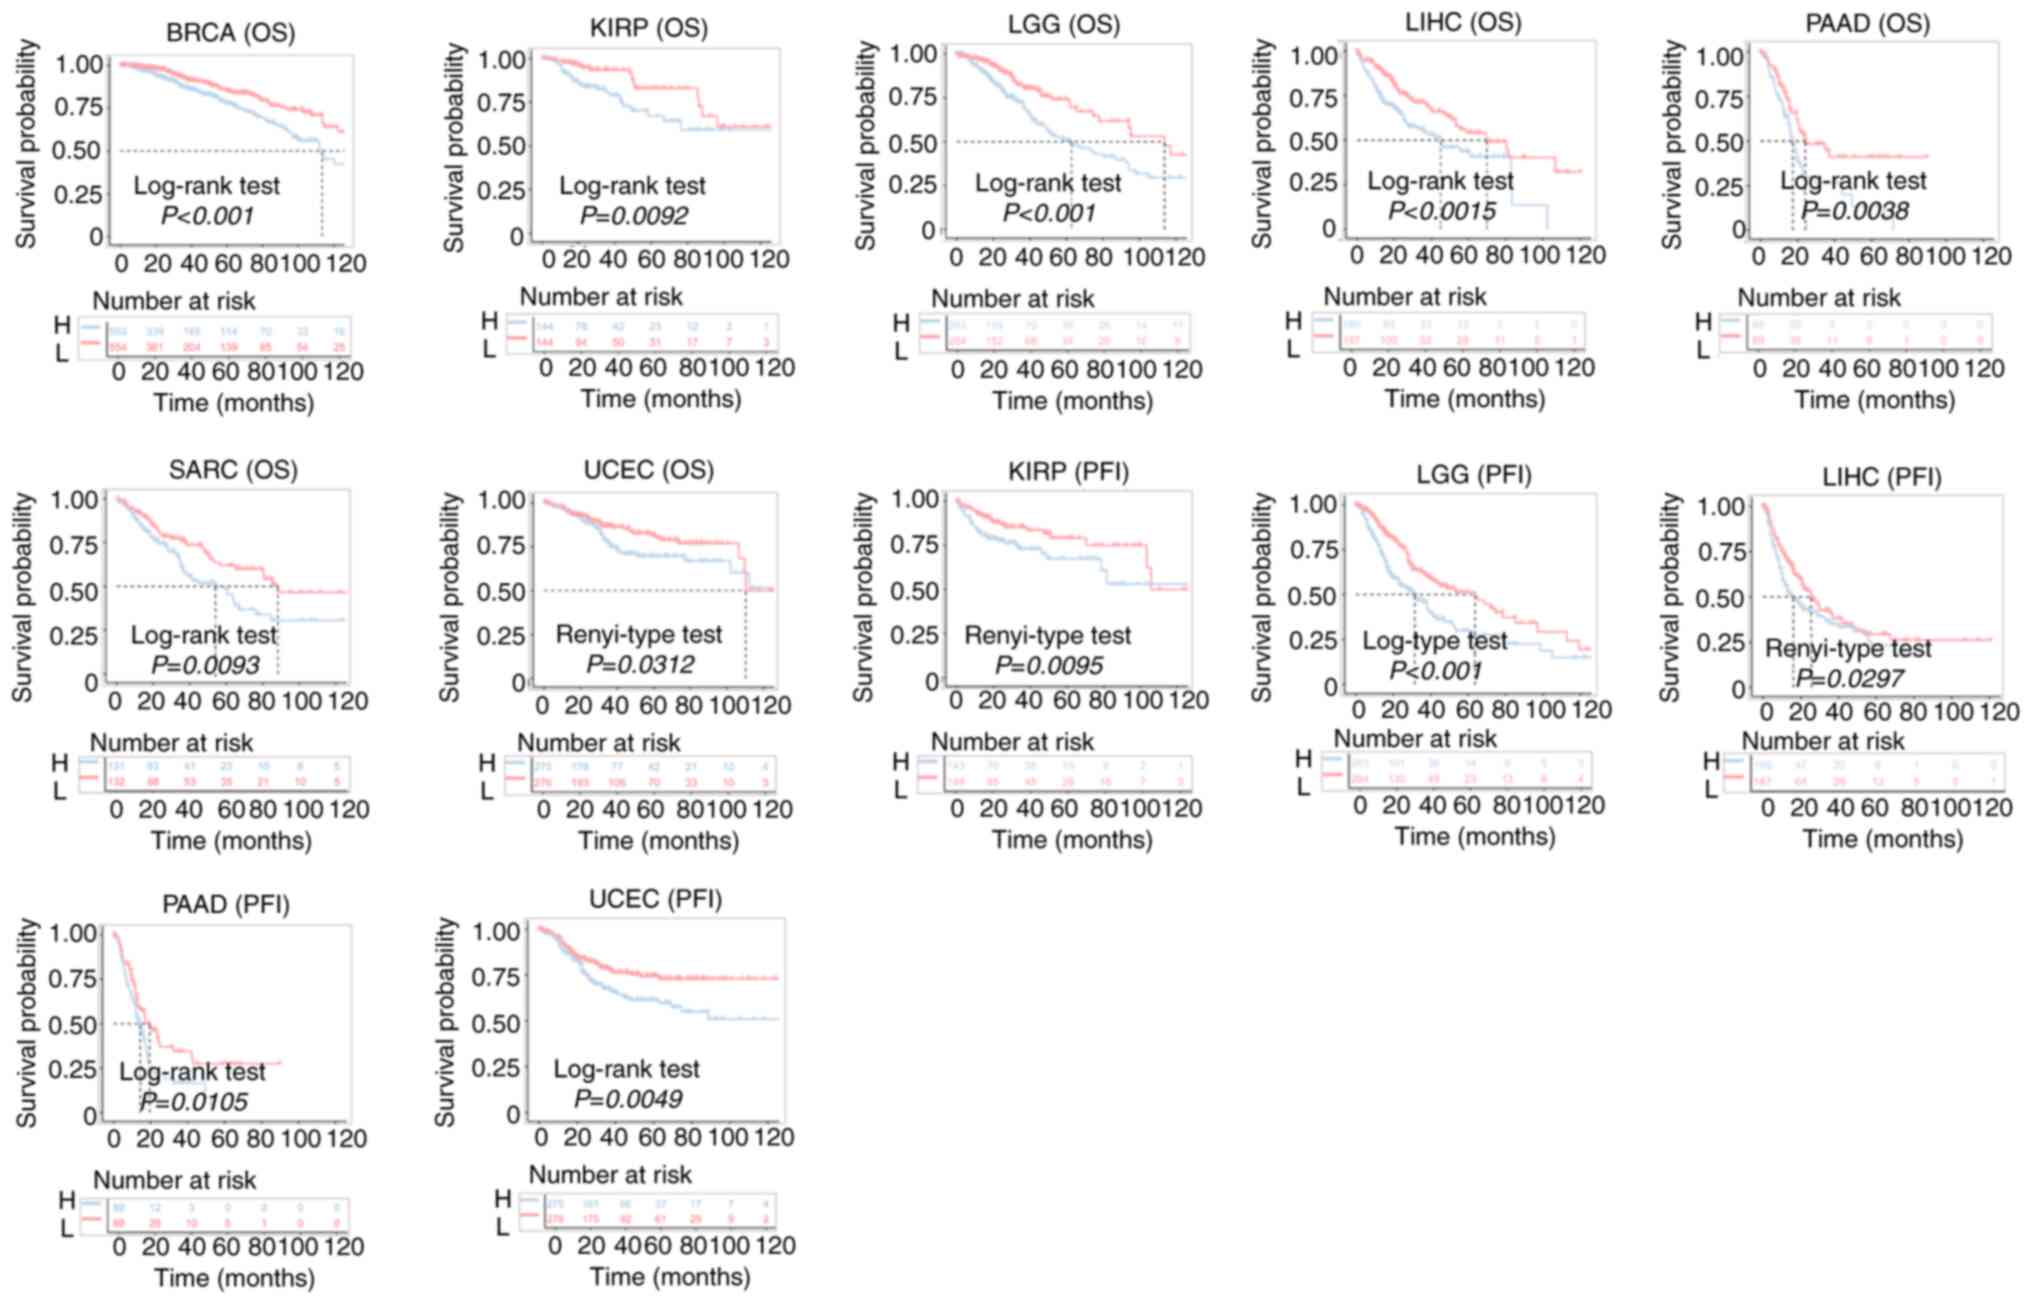 | Figure 4Kaplan-Meier curves for OS and PFI of
patients from TCGA datasets stratified according to MDIG gene
expression. MDIG, mineral dust-induced gene; OS, overall survival;
PFI, progression-free interval; H, high expression; L, low
expression; BRCA, breast invasive carcinoma; KIRP, kidney renal
papillary cell carcinoma; LGG, brain lower grade glioma; LIHC,
liver hepatocellular carcinoma; PAAD, pancreatic adenocarcinoma;
SARC, sarcoma; UCEC, uterine corpus endometrial carcinoma. |
Gene alteration analysis of MDIG in
different types of cancer
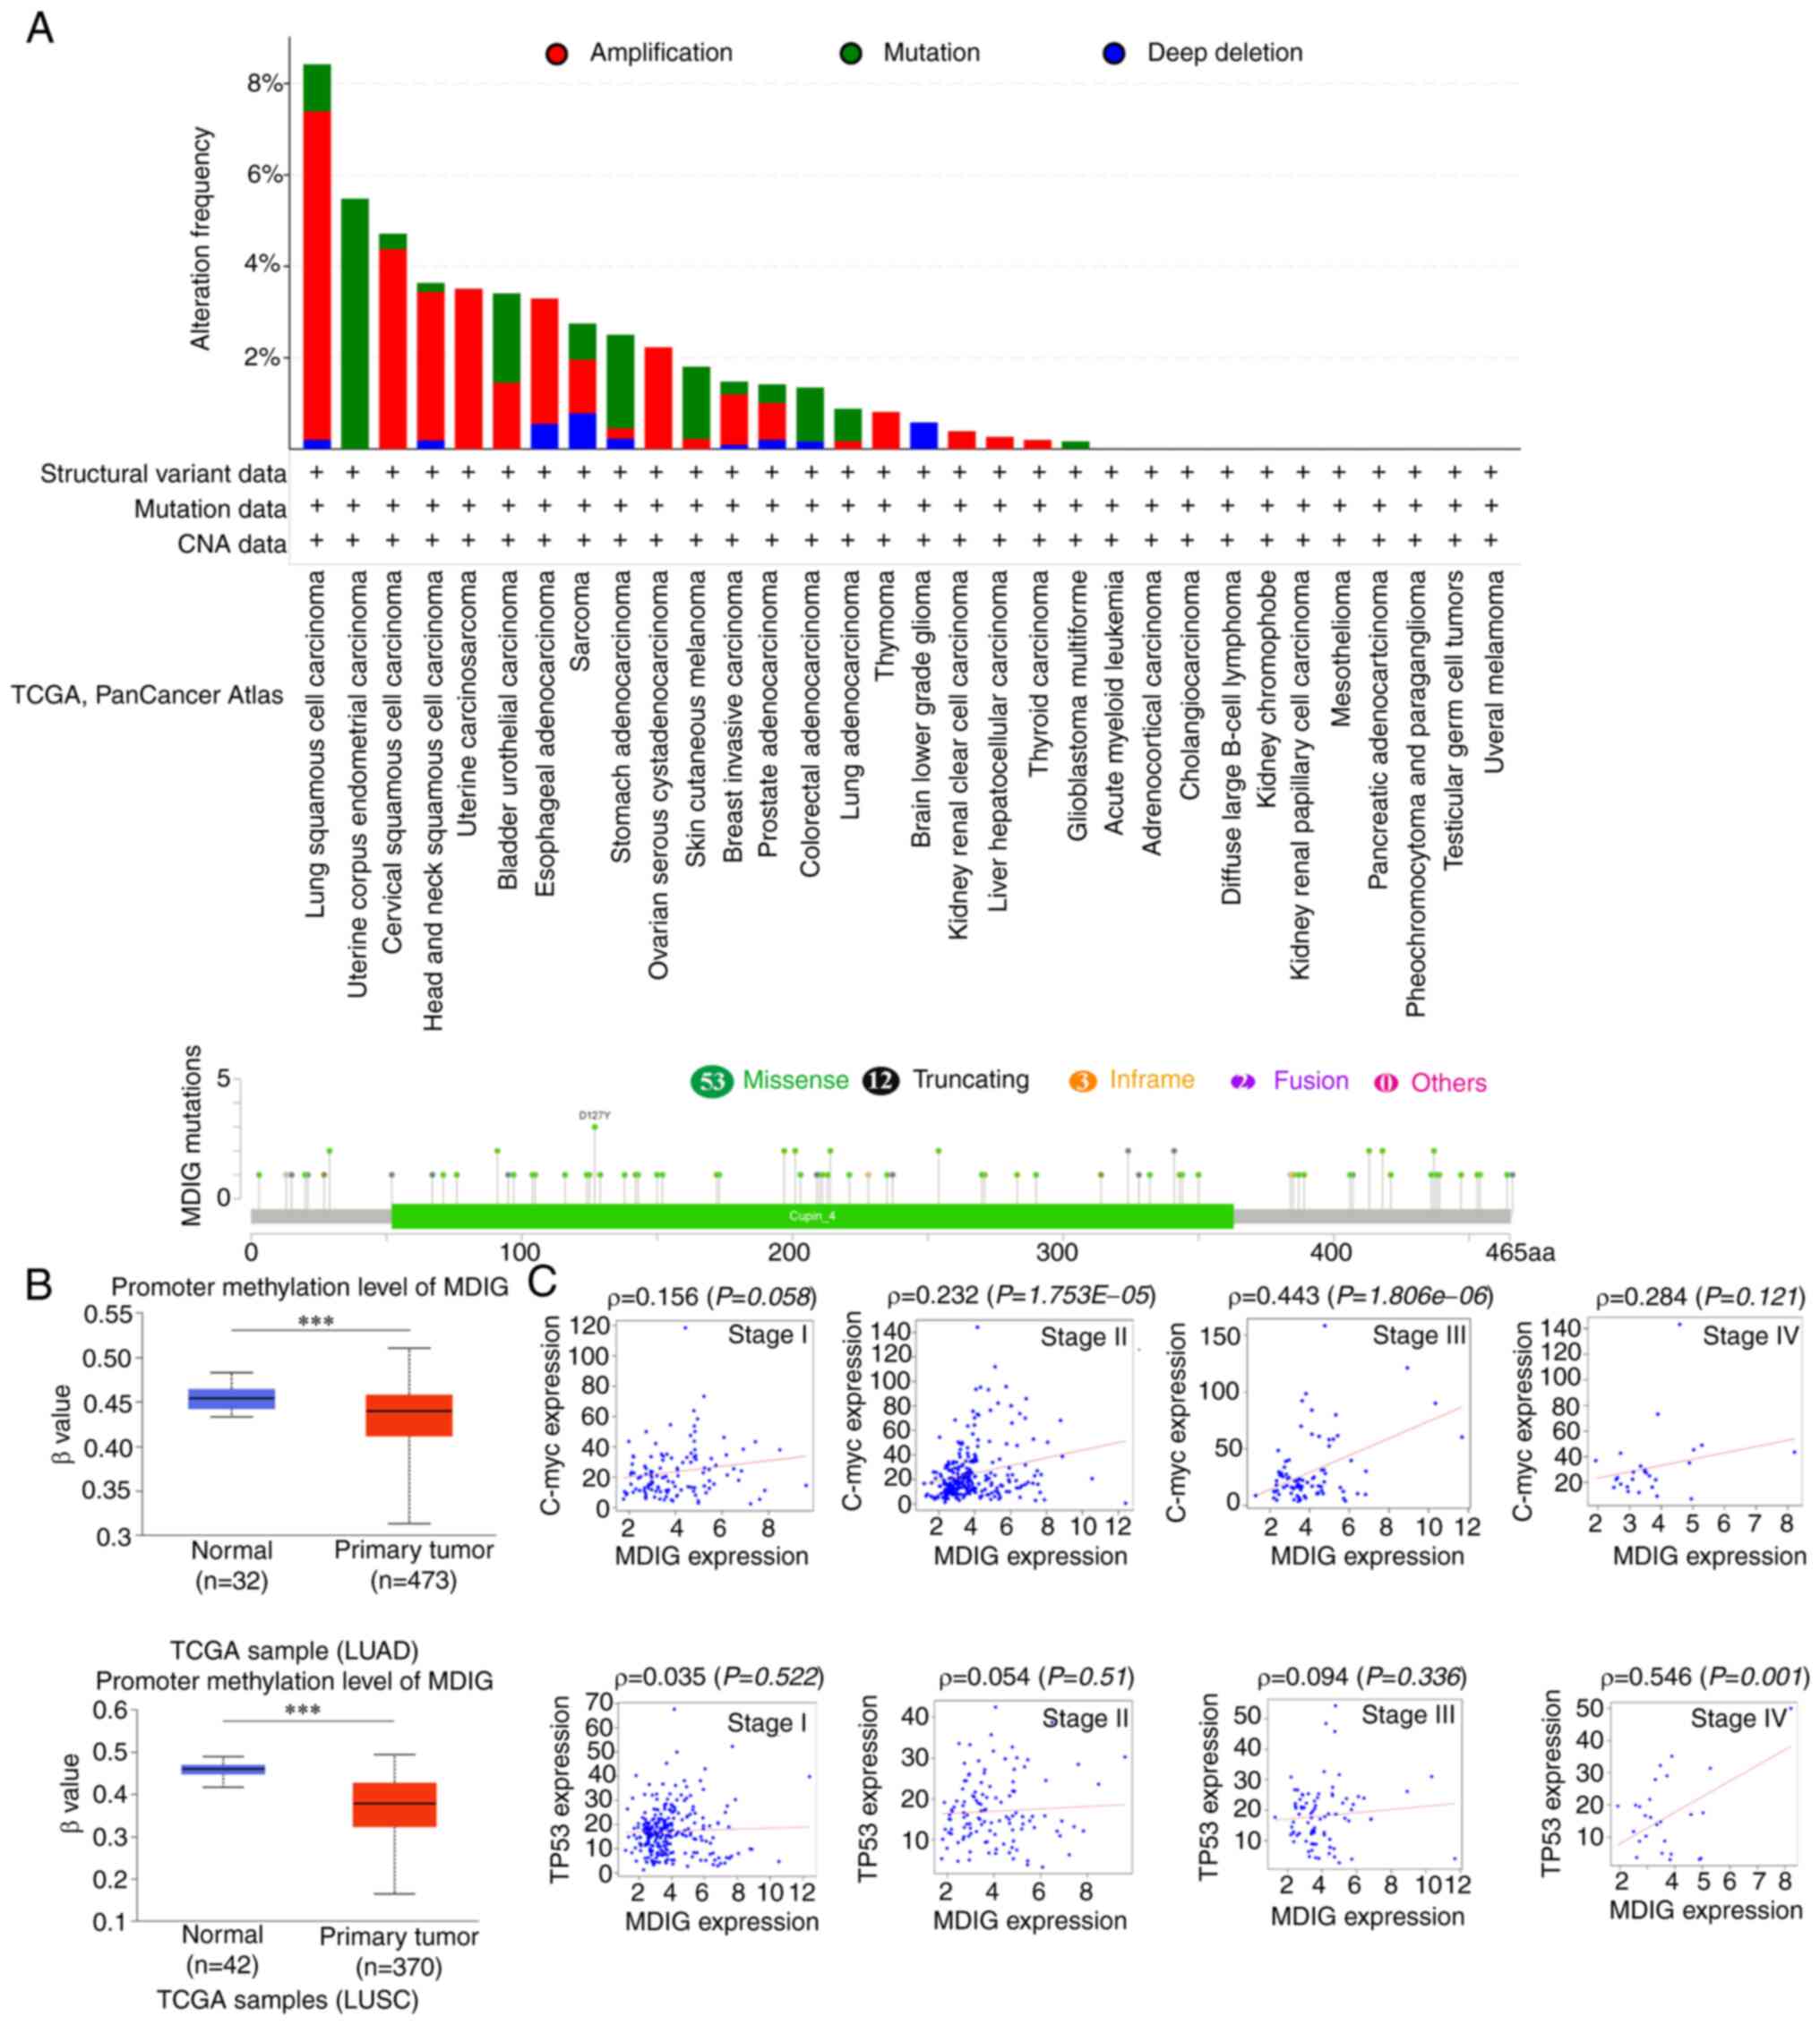
The highest alteration frequency of MDIG (~8%) was
observed in patients with LUSC. 'Amplification' was the primary
type for LUSC, cervical squamous cell carcinoma and head and neck
squamous cell carcinoma, with an alteration frequency of ~7, ~4 and
~3%, respectively (Fig. 5A).
However, MDIG mutations were not prevalent in any other types of
cancer tissue (Fig. 5A). There
was no significant association between MDIG mutations and patient
prognosis (data not shown).
Promoter methylation status and the
association between MDIG, C-Myc and TP53 expression in LUAD
As presented in Fig.
5B, the promoter methylation levels of MDIG in LUSC and LUAD
were significantly lower than those in normal lung tissue from TCGA
data. In addition, MDIG expression was significantly positively
correlated with that of C-Myc in LUAD (stages II/III). The
correlation gradually increased from stage I to stage III, then
decreased at stage IV and was no longer statistically significant.
Of note, the significance became stronger with increasing stage was
observed for the correlation analysis between MDIG and TP53
expression (Fig. 5C).
Correlation of MDIG expression with
immunological characteristics
In most types of cancer, MDIG expression positively
correlated with the frequency of 'Macrophages M1', 'T cells
CD4+ memory activated', and 'T cells CD4+
memory resting'. However, MDIG expression significantly negatively
correlated with 'T cells CD8+', 'NK cells activated' and
'T cells regulatory (Tregs)' (Fig.
6A). As indicated in Fig. 6B,
MDIG expression positively correlated with TME-relevant signatures
(such as 'Nucleotide_excision_repair', 'Mismatch_Repair',
'DNA_replication' and 'DNA_damage_response'). However, MDIG
expression had a significant negative correlation with TME-relevant
signatures in KIRC and THCA.
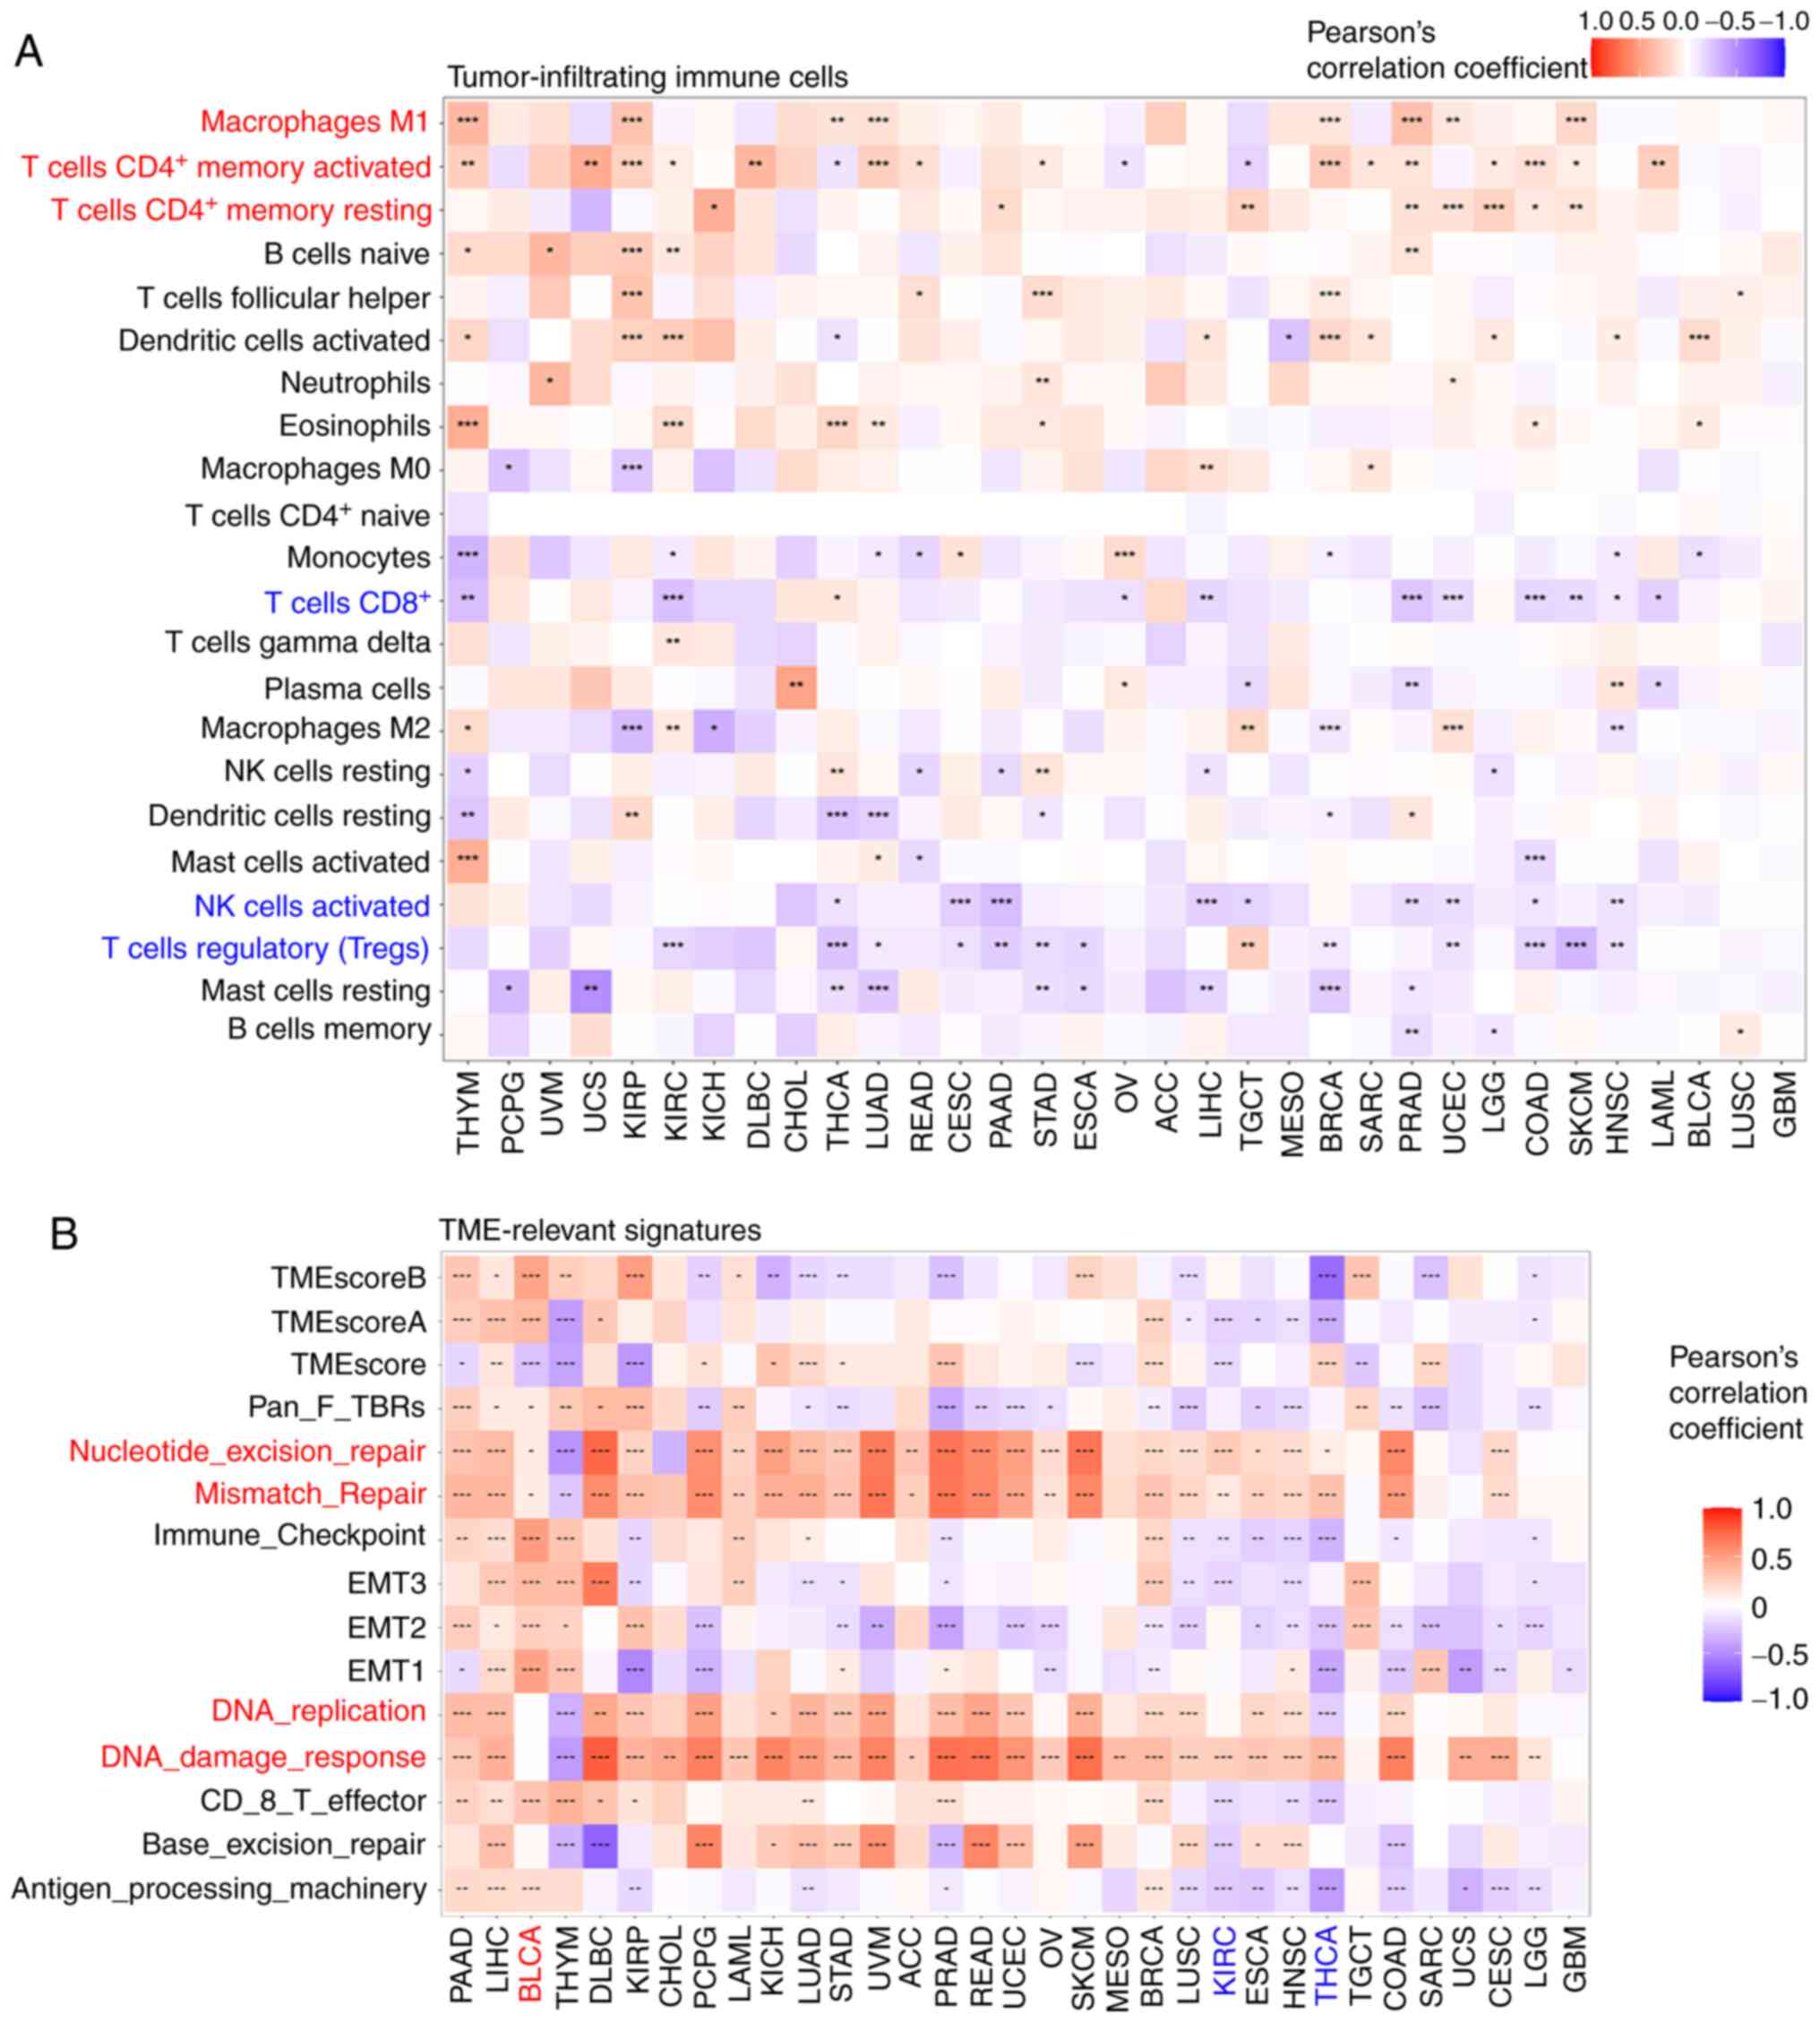 | Figure 6Correlation analysis between MDIG
expression and the frequency of tumor-infiltrating immune cells and
TME-relevant signatures in various cancer types. (A) Correlation
analysis between MDIG expression and the frequency of
tumor-infiltrating immune cells. (B) Correlation analysis between
MDIG expression and TME-relevant signatures obtained through the
CIBERSORT web portal. *P<0.05,
**P<0.01, ***P<0.001. MDIG, mineral
dust-induced gene; TME, tumor microenvironment; CIBERSORT, Cell
type Identification by Estimating Relative Subsets of RNA
Transcripts; EMT, epithelial-to-mesenchymal transition; Pan-F-TBR,
pan tissue fibroblast TGF-β response signature; NK, natureal
killer; ACC, adrenocortical carcinoma; BLCA, bladder urothelial
carcinoma; BRCA, breast invasive carcinoma; CESC, cervical squamous
cell carcinoma; CHOL, cholangiocarcinoma; COAD, colon
adenocarcinoma; DLBC, diffuse large B cell lymphoma; ESCA,
esophageal carcinoma; GBM, glioblastoma; HNSC, head and neck
squamous cell carcinoma; KICH, kidney chromophobe; KIRC, kidney
renal clear cell carcinoma; KIRP, kidney renal papillary cell
carcinoma; LAML, acute myeloid leukemia; LGG, brain lower grade
glioma; LIHC, liver hepatocellular carcinoma; LUAD, lung
adenocarcinoma; LUSC, lung squamous cell carcinoma; MESO,
mesothelioma; OV, ovarian serous cystadenocarcinoma; PAAD,
pancreatic adenocarcinoma; PCPG, pheochromocytoma and
paraganglioma; PRAD, prostate adenocarcinoma; READ, rectum
adenocarcinoma; SARC, sarcoma; SKCM, skin cutaneous melanoma; STAD,
stomach adenocarcinoma; TGCT, testicular germ cell tumors; THCA,
thyroid carcinoma; THYM, thymoma; UCEC, uterine corpus endometrial
carcinoma; UCS, uterine carcinosarcoma; UVM, uveal melanoma. |
Association of MDIG with immune-relevant
genes, TMB and MSI
MDIG expression correlated with that of several
immune-relevant genes, albeit with different patterns in different
tumor types. MDIG was positively correlated with immunostimulatory
genes in most types of cancer, such as LIHC, CHOL, BLCA, thymoma
(THYM) and LUAD. However, there was a negative correlation between
KIRC and THCA (Fig. 7A). As
presented in Fig. 7D, MDIG was
significantly associated with immune checkpoint genes in most types
of tumor. Furthermore, there was a significant positive correlation
between MDIG and PD-L1 in most types of tumor. Of note, MDIG was
negatively correlated with immune checkpoint genes in KIRC and
THCA. In addition, MDIG was significantly positively correlated
with chemokine receptor genes in BLCA, PAAD, CHOL and diffuse large
B cell lymphoma (DLBC), amongst others, but significantly
negatively correlated with chemokine receptor genes in KIRC and
THCA (Fig. 7E). Overall, there
was a close correlation between immune-relevant genes and MDIG and
MDIG was always significantly negatively correlated with
immune-relevant genes in KIRC and THCA.
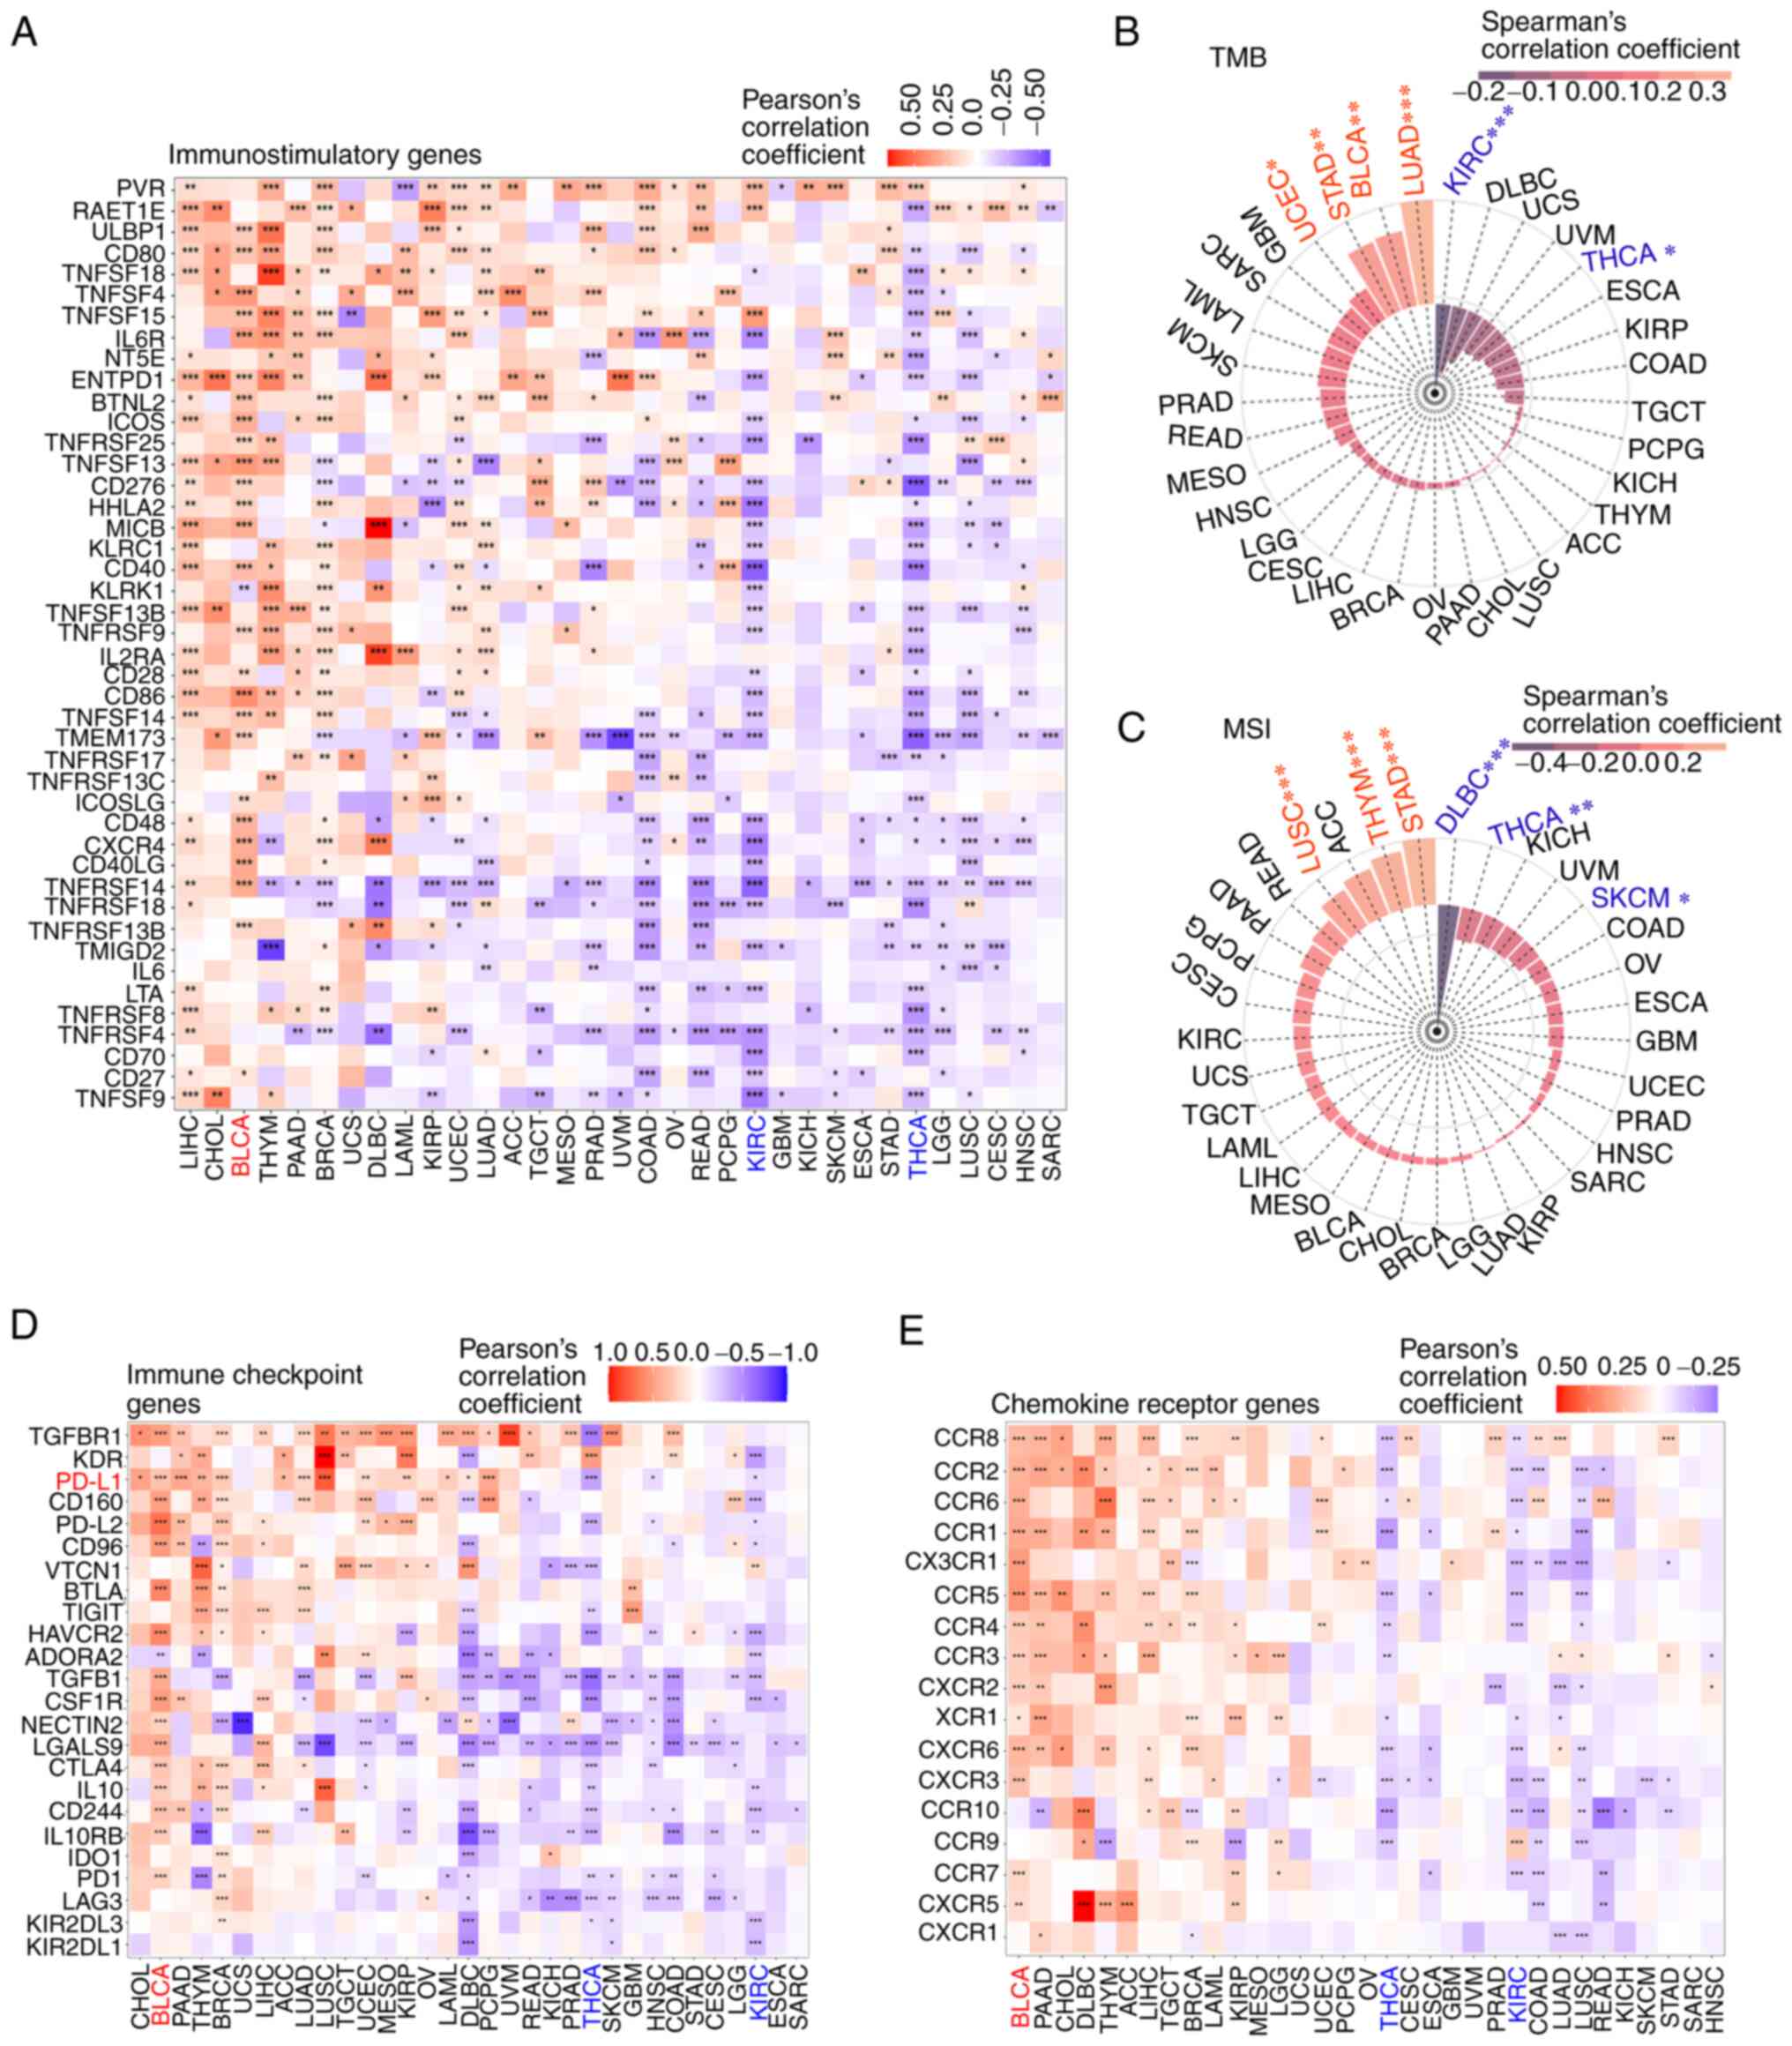 | Figure 7Analysis of the correlation of MDIG
with immune-relevant genes, TMB and MSI. (A) Correlation analysis
between MDIG expression and immunostimulatory genes. (B)
Correlation between MDIG expression and TMB. (C) Correlation
between MDIG expression and MSI. (D) Correlation analysis between
MDIG expression and immune checkpoint genes. (E) Correlation
analysis between MDIG expression and chemokine receptor genes.
*P<0.05, **P<0.01,
***P<0.001. MDIG, mineral dust-induced gene; TMB,
tumor mutational burden; MSI, microsatellite instability; ACC,
adrenocortical carcinoma; BLCA, bladder urothelial carcinoma; BRCA,
breast invasive carcinoma; CESC, cervical squamous cell carcinoma;
CHOL, cholangiocarcinoma; COAD, colon adenocarcinoma; DLBC, diffuse
large B cell lymphoma; ESCA, esophageal carcinoma; GBM,
glioblastoma; HNSC, head and neck squamous cell carcinoma; KICH,
kidney chromophobe; KIRC, kidney renal clear cell carcinoma; KIRP,
kidney renal papillary cell carcinoma; LAML, acute myeloid
leukemia; LGG, brain lower grade glioma; LIHC, liver hepatocellular
carcinoma; LUAD, lung adenocarcinoma; LUSC, lung squamous cell
carcinoma; MESO, mesothelioma; OV, ovarian serous
cystadenocarcinoma; PAAD, pancreatic adenocarcinoma; PCPG,
pheochromocytoma and paraganglioma; PRAD, prostate adenocarcinoma;
READ, rectum adenocarcinoma; SARC, sarcoma; SKCM, skin cutaneous
melanoma; STAD, stomach adenocarcinoma; TGCT, testicular germ cell
tumors; THCA, thyroid carcinoma; THYM, thymoma; UCEC, uterine
corpus endometrial carcinoma; UCS, uterine carcinosarcoma; UVM,
uveal melanoma. |
TMB (45) and MSI
(46) are important molecular
markers for immune checkpoint block therapy. MDIG expression
positively correlated with TMB in LUAD, BLCA, STAD and UCEC, but
negatively correlated in KIRC and THCA (Fig. 7B). As presented in Fig. 7C, MDIG also positively correlated
with MSI in STAD, THYM and LUSC. However, the opposite results were
observed in DLBC, THCA and skin cutaneous melanoma.
Cohort validation of the prognostic role
of MDIG for immunotherapy
The effect of MDIG on TME-relevant signatures in
BLCA was analyzed using the CIBERSORT algorithm. The results
suggested that high expression of MDIG was associated with
'CD-8-T-effector', 'Immune-Checkpoint',
'Antigen-processing-machinery', 'TMEscoreA', 'Mismatch-Repair',
'Nucleotide-excision-repair', 'pan tissue fibroblast TGF-β response
signature (Pan-F-TBRs)', 'epithelial-to-mesenchymal transition
(EMT)1/2/3' and 'TMEscoreB' (Fig.
8A). Furthermore, KM analysis of OS indicated that MDIG high
expression was associated with favorable OS in patients with BLCA
who had received PD-L1 immunotherapy (Fig. 8B).
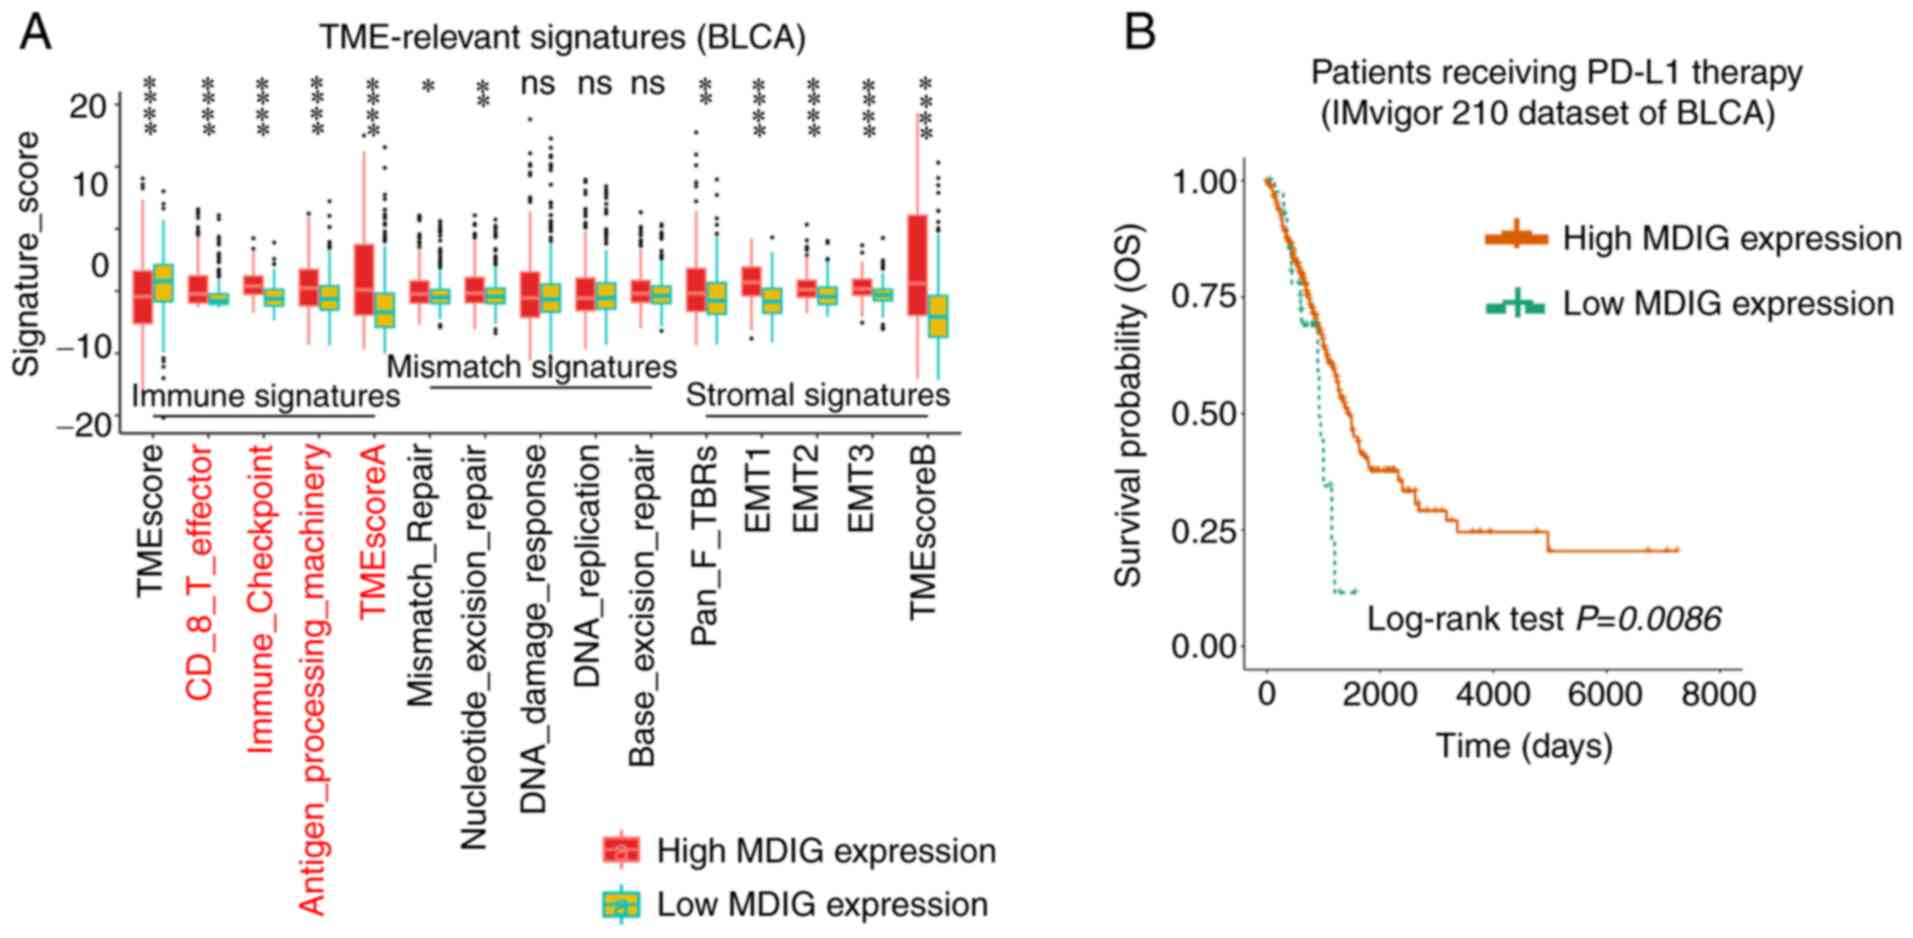 | Figure 8Association of MDIG with TME-relevant
signatures and immune checkpoint blockade therapy in BLCA. (A)
Correlation analysis between MDIG expression and TME-relevant
signatures in BLCA obtained through the CIBERSORT web portal
(Wilcoxon rank-sum test). (B) Kaplan-Meier curve analysis of OS in
patients who had received anti-PD-L1 immunotherapy, stratified
according to MDIG expression. *P<0.05,
**P<0.01, ****P<0.0001. BLCA, bladder
urothelial carcinoma; TME, tumor microenvironment; EMT,
epithelial-to-mesenchymal transition; Pan-F-TBR, pan tissue
fibroblast TGF-β response signature; OS, overall survival;
CIBERSORT, Cell type Identification by Estimating Relative Subsets
of RNA Transcripts; PD-L1, programmed cell death 1 ligand 1. |
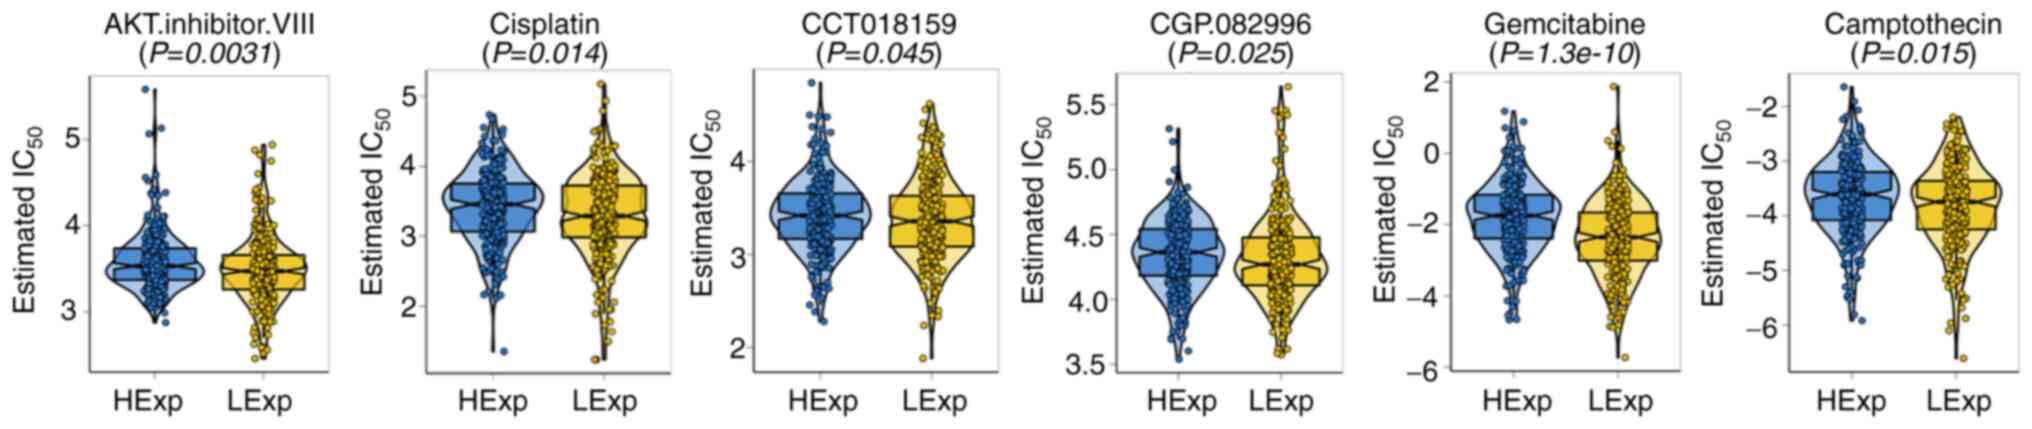
Drug sensitivity analysis of MDIG in
TCGA-LUAD cohort
While several treatment options are available for
lung cancer at present, chemotherapy remains widely used (47). The GDSC database was used to
analyze the relationship between MDIG expression and sensitivity to
chemotherapeutic drugs in the TCGA-LUAD cohort. As presented in
Fig. 9, for AKT.inhibitor.VIII,
cisplatin, CCT018159, CGP.082996, gemcitabine and camptothecin, the
estimated IC50 was higher with high expression of MDIG
as compared with the low-expression group.
Functional enrichment analysis of MDIG in
LUAD
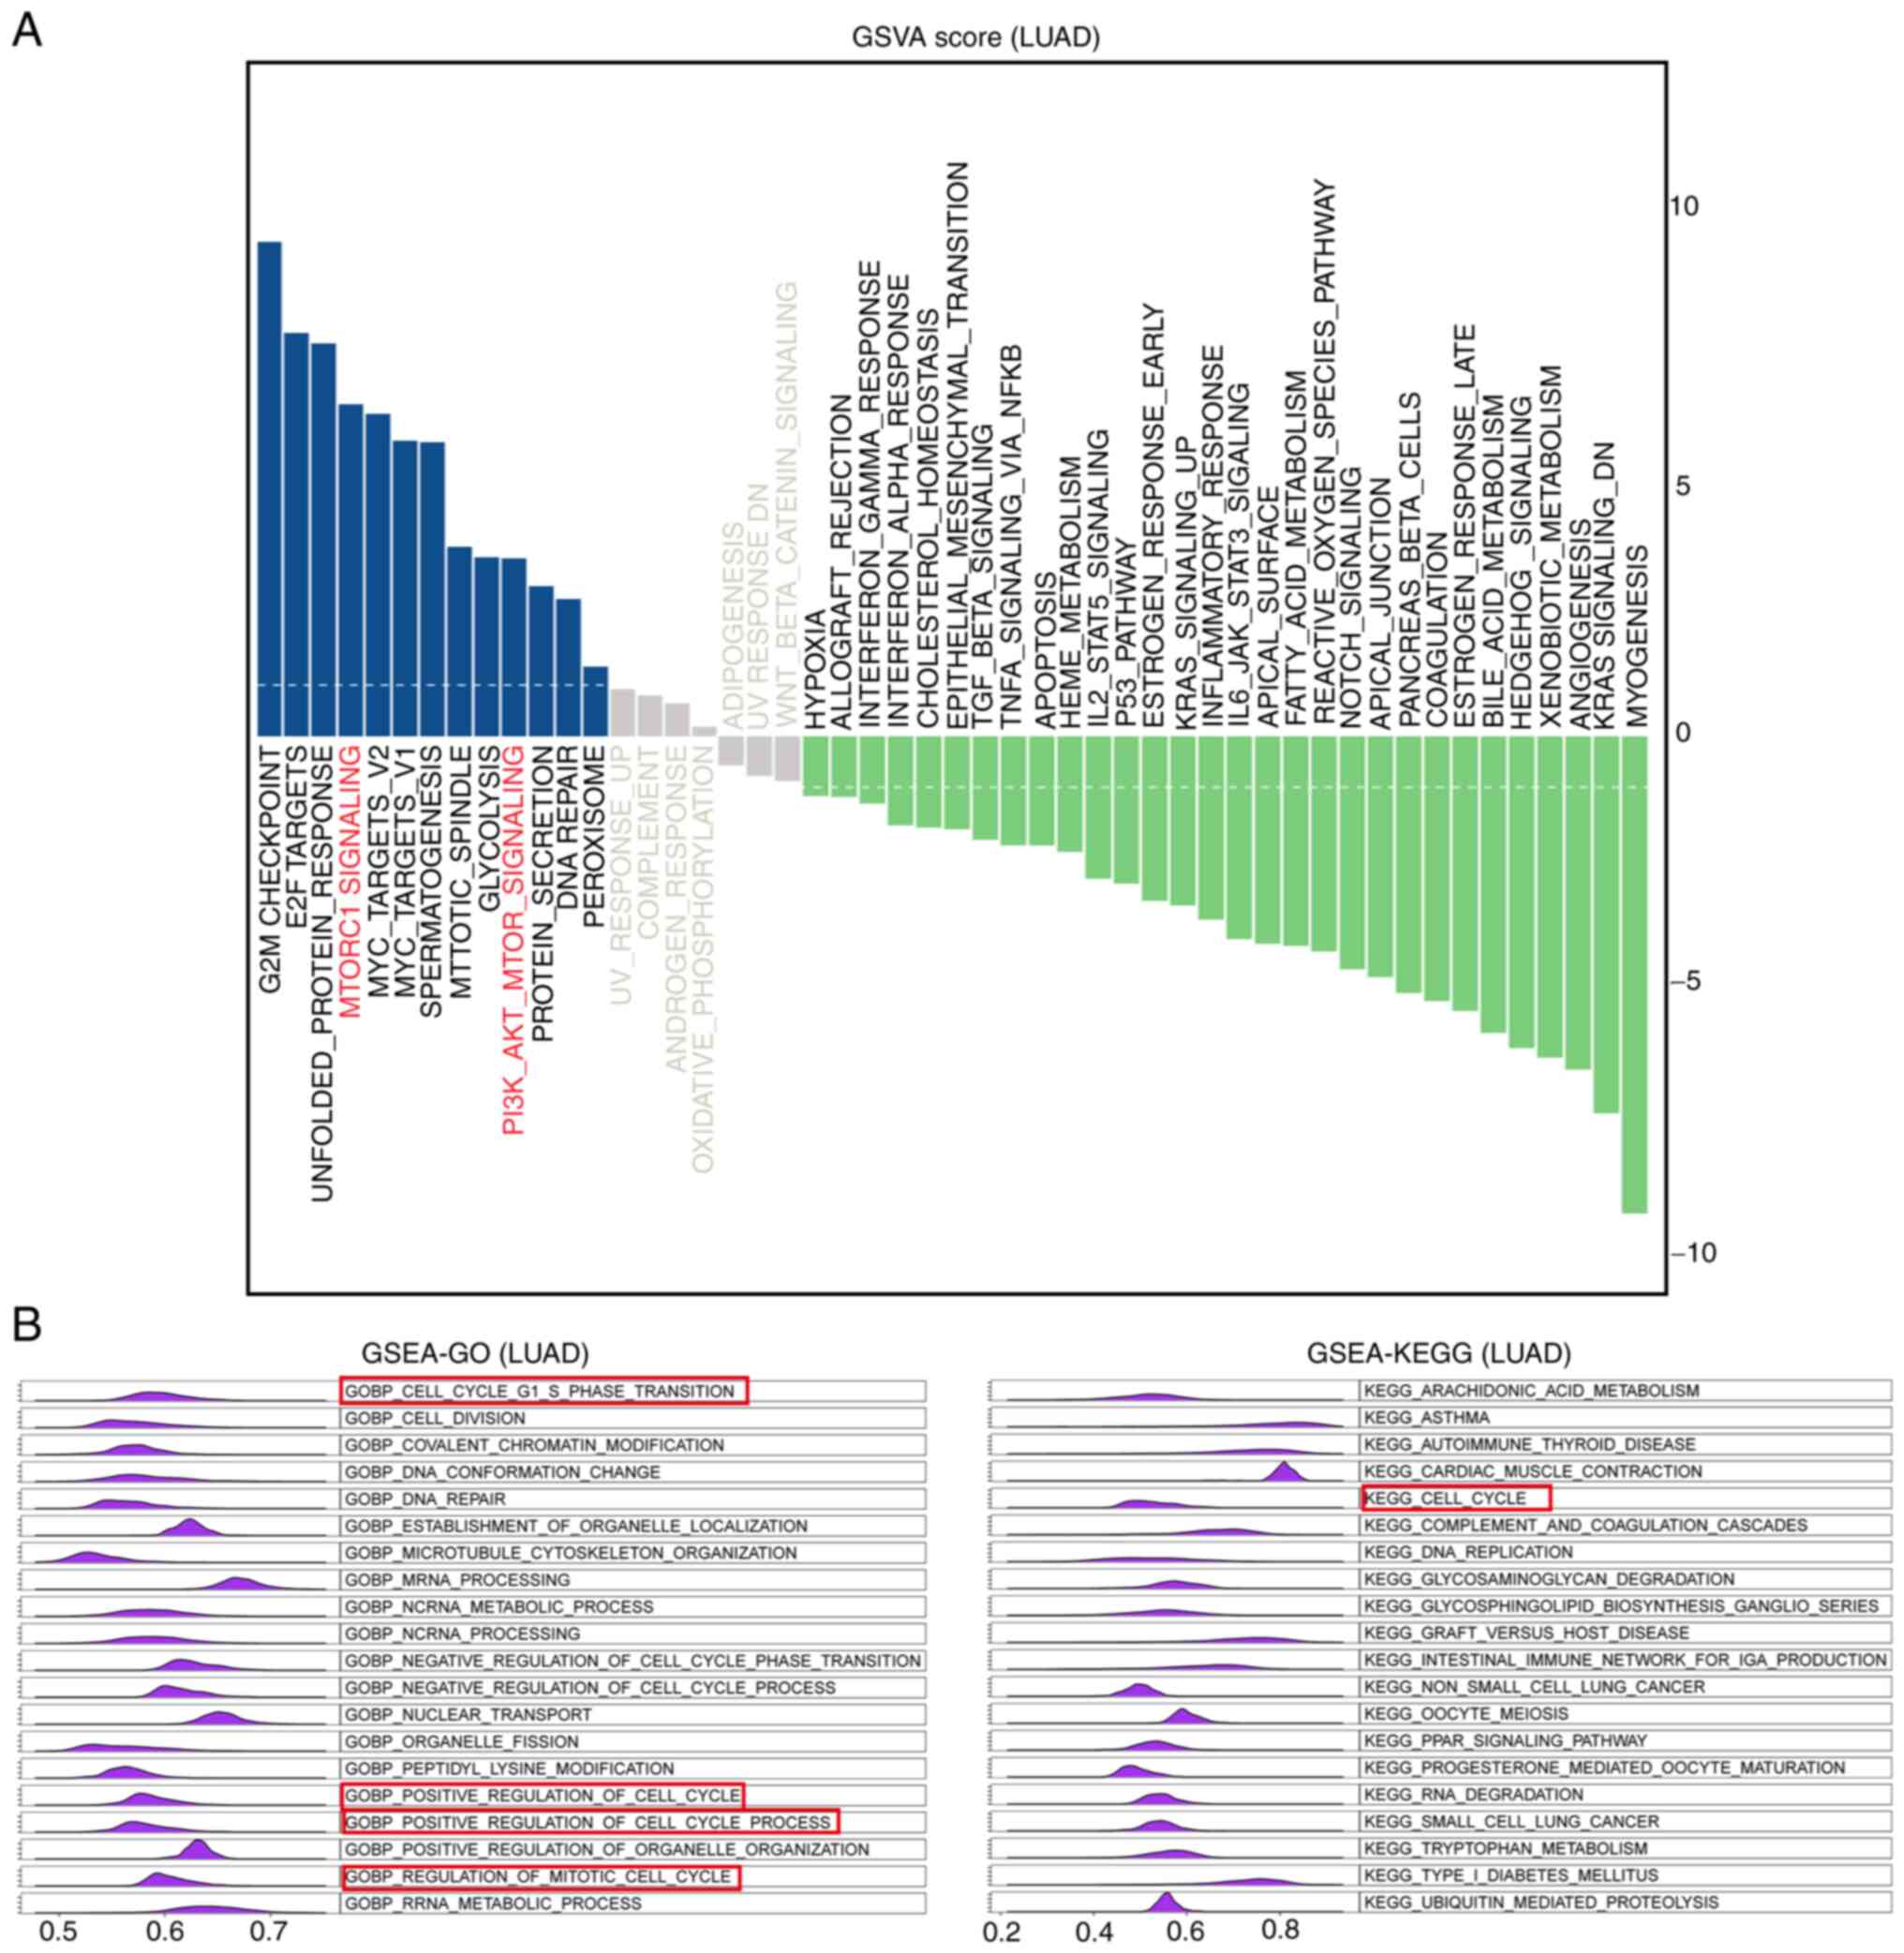
To obtain deeper insight into the biological
functions associated with MDIG, GSVA and GSEA were used to identify
pathways enriched by MDIG. As presented in Fig. 10A, the results of the GSVA
indicated that the pathways in which the genes co-expressed with
MDIG were enriched were G2M-CHECKPOINT, E2F-TARGETS, UNFOLDED- PROT
E I N-R E SP ONSE, M TORC1- SIGNA L I NG, M YC -TA RG E T S -V1 /
2, SP E R M AT O G E N E SI S, MITOTIC-SPINDLE, GLYCO LYSIS and
PI3K-AKT- MTOR-SIGNALING. Furthermore, GSEA-GO and GSEA-KEGG were
performed to identify enriched GO terms in the category biological
process (GOBP) and KEGG pathways in association with MDIG in LUAD.
The results suggested that the genes co-expressed with MDIG were
enriched in biological process terms and pathways such as
GOBP-CELL-G1-S-PHASE-TRANSITION, GOBP- CELL- DIVISION, GOBP-
COVALENT-CHROMATIN-MODIF ICATION, GOBP-DNA-CONFORMATION-CHANGE, G
OBP- DNA- R E PA I R, K E G G - A R AC H I D ON IC- A C I D - M E T
A B O L I S M, K E G G - A S T H M A, KEGG-AUTOIMMUNE- THYROID-
DISEASE, KEGG- CARDIAC- MUSCLE-CONTRACTION and KEGG- CELL- CYCLE
(Fig. 10B).
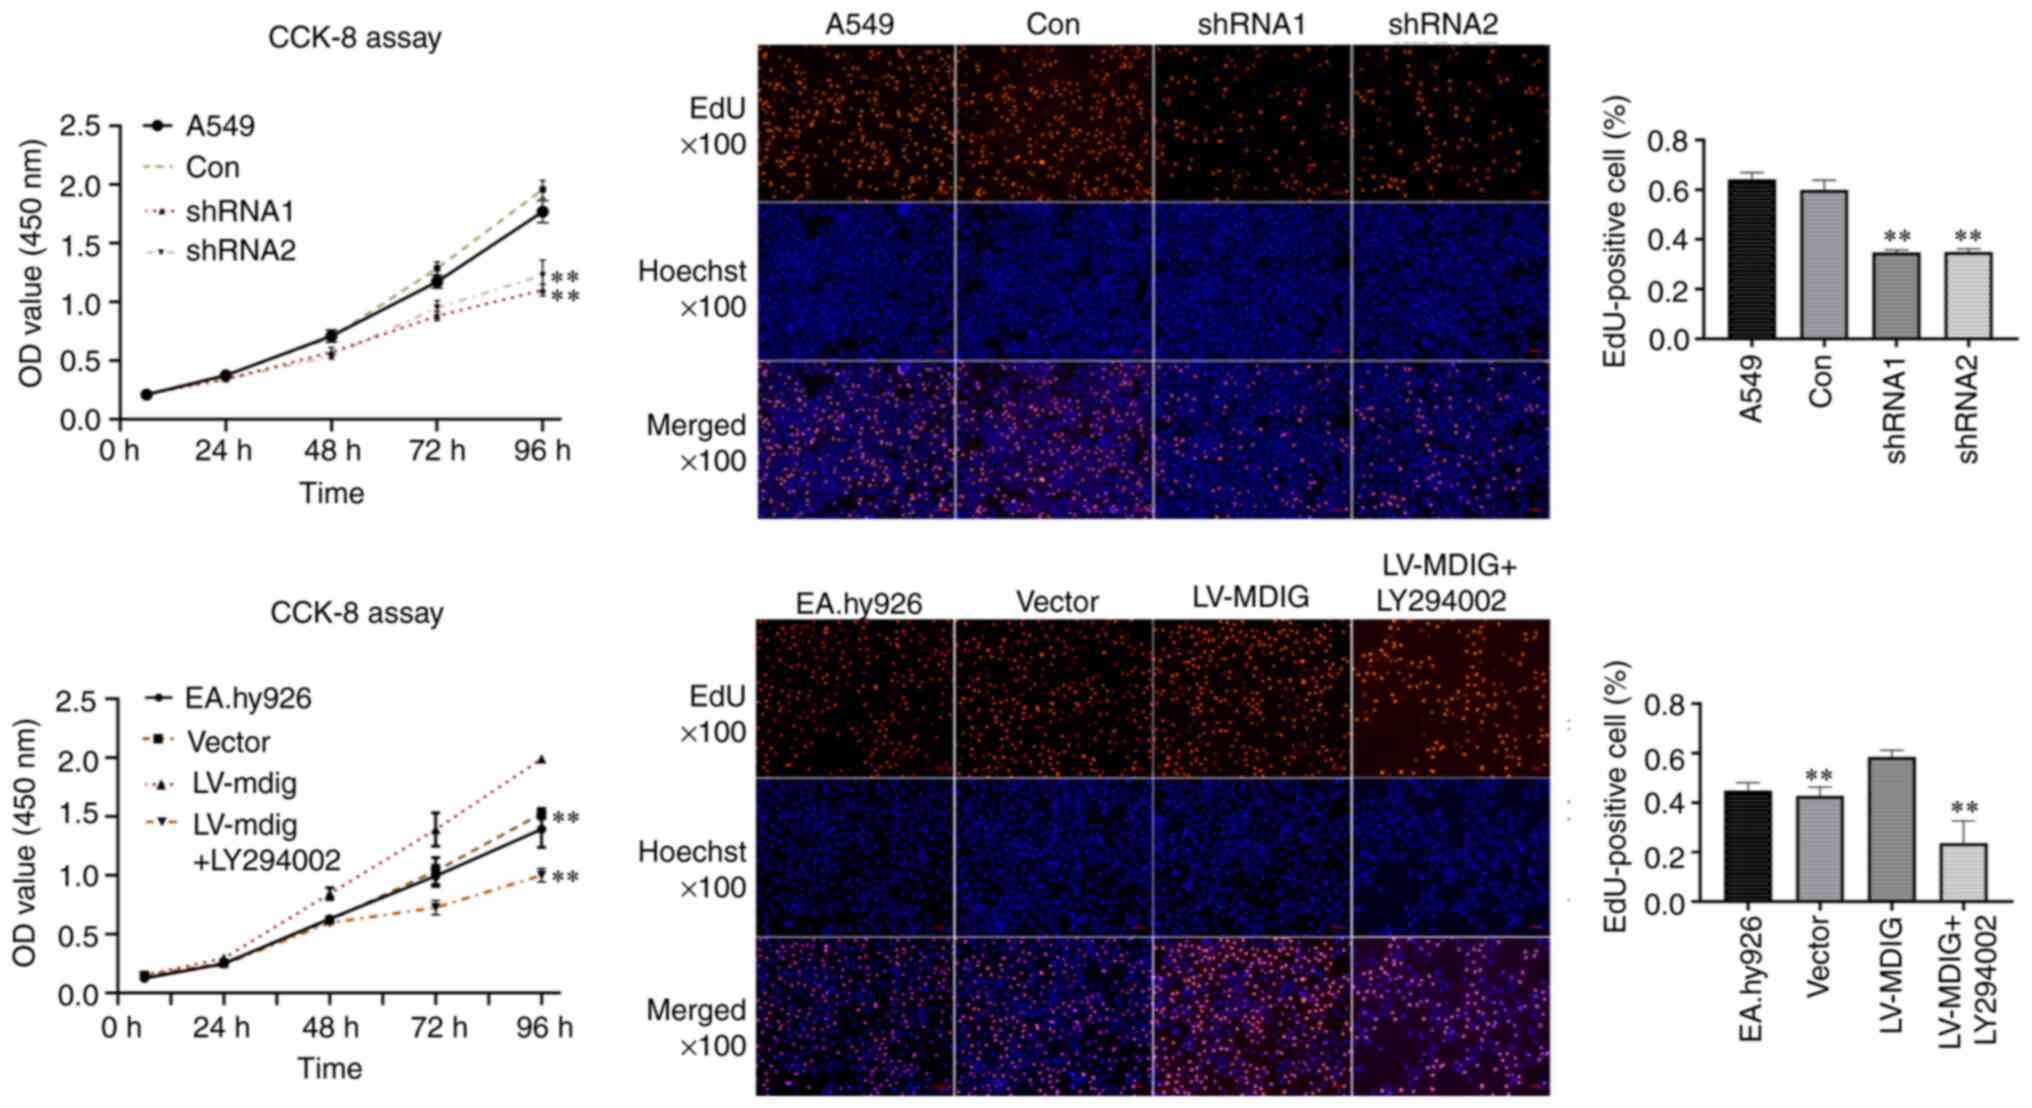
MDIG promotes cell proliferation through
the Akt signaling pathway in vitro
The results suggested that MDIG was upregulated in
lung cancer cell lines and enrichment analysis suggested that the
main biological processes of MDIG were related to the cell cycle
and Akt signaling. To our knowledge, there have been no previous
studies indicating that MDIG may promote cell proliferation through
the Akt signaling pathway; the Akt signaling pathway is one of the
most important signaling pathways that promote cell proliferation
(48). Therefore, the A549 cell
line (with high expression of MDIG; this cell line was thus used
for MDIG knockdown studies) and the EA.hy926 cell line (which lacks
MDIG expression and was thus used for MDIG overexpression studies;
this cell line may be more comparable to A549 cells than other cell
lines in terms of cell source) were selected for in vitro
experiments to verify that MDIG promotes cell proliferation through
the Akt signaling pathway. EdU and CCK-8 assays suggested that MDIG
silencing significantly inhibited A549 cell proliferation, whereas
overexpression of MDIG significantly promoted the proliferation of
EA.hy926 cells. Furthermore, the addition of PI3K/Akt inhibitor
(LY294002) to MDIG-overexpressing EA.hy926 cells significantly
inhibited cell proliferation (Fig.
11).
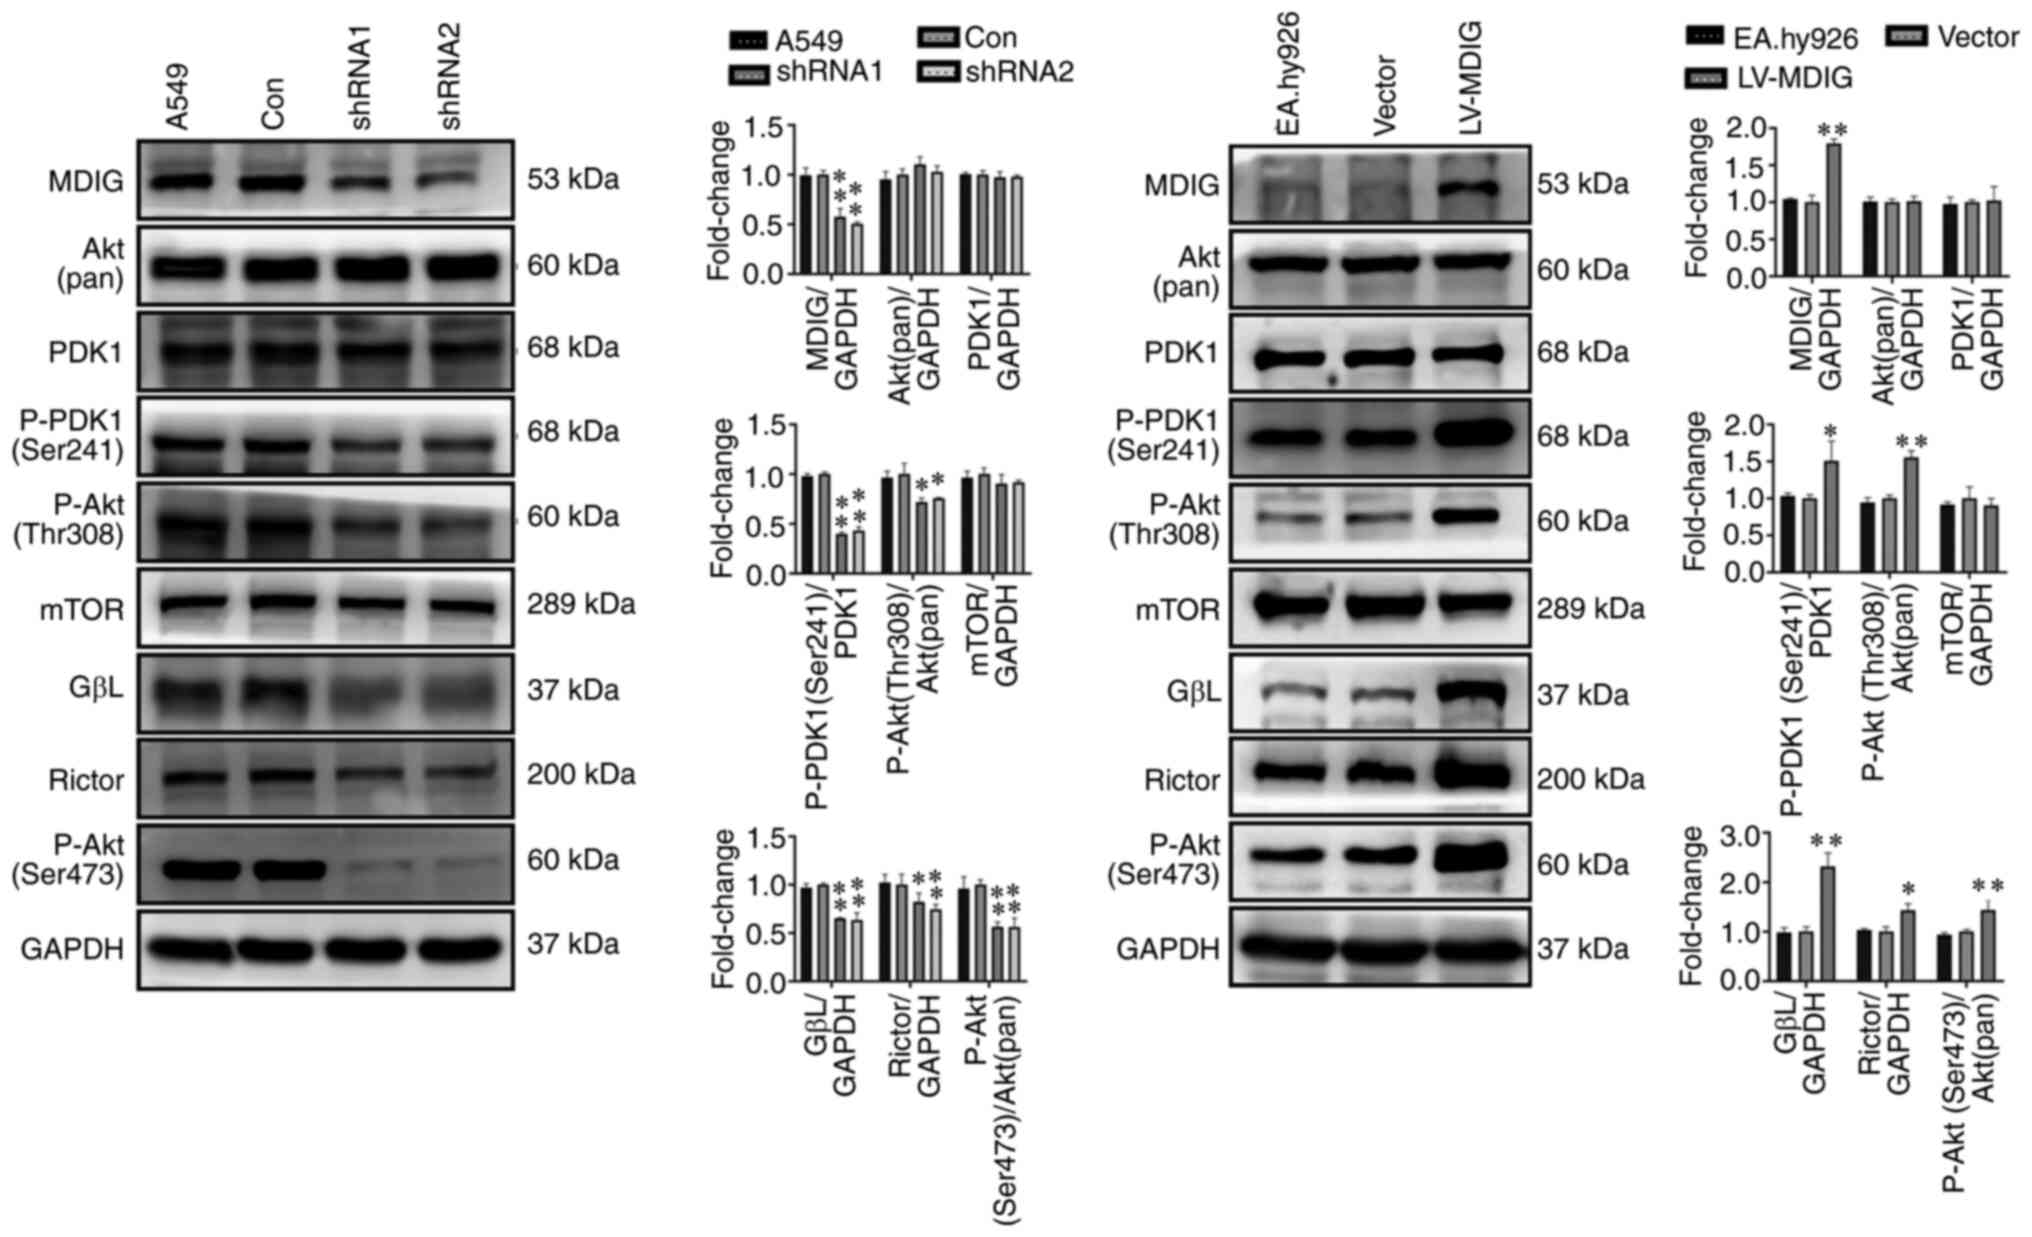
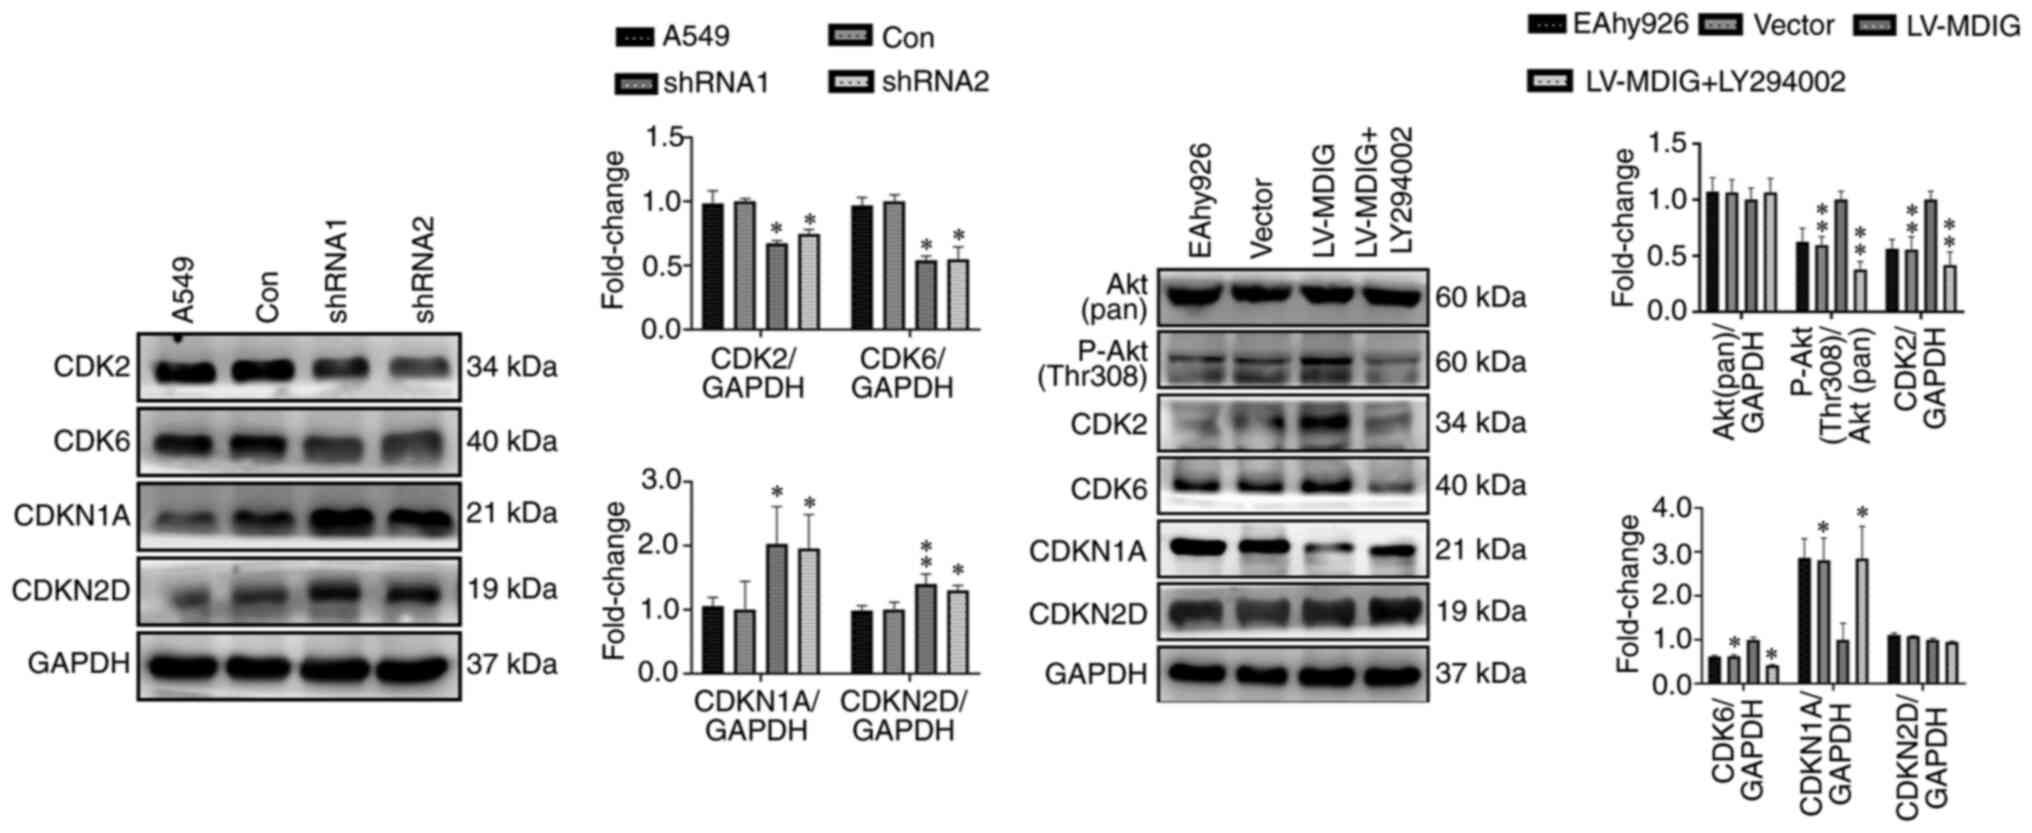
Furthermore, western blot analysis was performed on
MDIG-knockdown A549 cells and MDIG-overexpressing EA.hy926 cells to
examine the role of Akt signaling and its downstream regulation of
cell cycle-related proteins. In MDIG-knockdown A549 cells, the
levels of P-PDK1 (Ser241), P-Akt (Thr308), GβL, Rictor, P-Akt
(Ser473), CDK2 and CDK6 were significantly reduced (Figs. 12 and 13), whereas the expression levels of
CDKN1A and CDKN2D were significantly increased compared with those
in the control group (Fig. 13).
However, the expression levels of Akt (pan), PDK1 and mTOR were not
significantly altered (P>0.05; Fig. 12). The opposite effects were
obtained for MDIG-overexpressing EA.hy926 cells (Figs. 12 and 13). As indicated in Fig. 13, in EA.hy926 cells, when
comparing the LV-MDIG + LY294002 group with the LV-MDIG group, the
effects of LV-MDIG on the expression levels of P-Akt (Thr308),
CDK2, CDK6 and CDKN1A were reversed by LY294002, but those of
CDKN2D were not. These results suggested that MDIG promoted the
phosphorylation of PDK1 (Ser241) and the expression of GβL and
Rictor. This may promote the phosphorylation of Akt (Thr308) and
Akt (Ser473), leading to an increase in CDK2 and CDK6 and a
decrease in CDKN1A and CDKN2D, which may in turn promote cell
proliferation.
Discussion
MDIG is a member of the Jumonji-C domain-containing
protein family. Evidence suggests that the MDIG protein is mainly
expressed in the nucleus, diffused uniformly in the nucleoplasm and
absent from the cytoplasm, but highly enriched in the nuclear and
nucleolar fractions (7).
Furthermore, a previous study indicated that MDIG promotes gene
expression through the demethylation of histones H3K9me3, H3K27me3
and H4K20me3, thus modulating the behavior of a variety of tumors
(11).
While previous clinical studies with small samples
were limited to a small number of cancer types and had certain
contradictory findings, the present pan-cancer analysis
comprehensively revealed the expression, prognosis and gene
function of MDIG in all common tumor types using large samples with
comprehensive information from public databases. MDIG was expressed
at low levels in almost all normal human tissue types. These
results suggested that MDIG may have an important role in embryonic
development or basic physiological activities of cells. Of note, a
previous study indicated that MDIG was essential for normal
embryogenesis (5); in that study,
the researchers were able to obtain MDIG heterozygotic knockout
(MDIG+/−) mice, but not the homozygotic mice, indicating
that MDIG is essential for normal embryogenesis and was
involved in ribosome formation by catalyzing
(2S,3S)-3-hydroxyhistidine modification of Rpl27a at residue 39
(10). Similarly, in the present
enrichment analysis, MDIG was indicated to be related to biological
processes such as RNA splicing, ribonucleoprotein complex
biogenesis and carbon metabolism. Furthermore, although the
expression of MDIG was not high in normal lung tissue, it was
highest in lung cancer cell lines. These results suggested that
MDIG may have an important role in the development of lung cancer.
Thus, studying the expression of MDIG in cancer cell lines may help
guide further cell experimental studies on the regulation of gene
expression in the future. In addition, most of the cancer types
examined in the present study, including BLCA, CHOL, COAD, ESCA,
GBM, LIHC, LUAD, LUSC, PRAD, READ and STAD, exhibited higher MDIG
expression than para-cancerous normal tissue. These results
suggested that MDIG may be used as a diagnostic marker for these
tumors. By contrast, MDIG expression was significantly
downregulated in BRCA, KIRC, KIRP, and THCA. This result was the
opposite of findings from previous studies with small clinical
samples (13,17,49). This may be because of a bias due
to the different samples and sample sizes, which requires to be
verified by more clinical studies. However, there was no study on
the expression of MDIG in patients with THCA.
As previously reported, MDIG expression may be
associated with smoking and the expression of MDIG was
significantly higher in lung cancer patients who smoked compared
with that in non-smokers (50).
Since smoking is closely associated with lung cancer, the results
using large samples of data from a public database verified that
the expression of MDIG in patients with LUAD who smoked was
significantly higher than that in patients who did not smoke,
suggesting that smoking may lead to high MDIG expression in LUAD.
According to the uniCox analysis and KM curves for OS and PFI, high
expression of MDIG was significantly associated with poor prognosis
in KIRP, LGG, LIHC, PAAD, PRAD, SARC, BLCA, BRCA and UCEC. The
present results just confirmed the previous results of clinical
studies indicating that high expression of MDIG was significantly
associated with poor prognosis of KIRP (49), LIHC (14), PAAD (51) and BRCA (13). At present, there is no literature
report on the relationship between MDIG expression and prognosis of
LGG, BLCA, SARC and UCEC. In summary, MDIG was not only upregulated
in multiple tumor types but also associated with prognosis,
suggesting that MDIG may represent a biomarker and prognostic
indicator for certain types of tumor.
The results of the present pan-cancer analysis
confirmed that MDIG was highly expressed in a variety of tumor
types. Furthermore, the possible reasons for the increased
expression of MDIG in tumor tissue were examined. The results
suggested that 'Amplification' was the main type of MDIG genetic
alteration in different types of cancer. Therefore, it may be
hypothesized that MDIG amplification may explain the high
expression of this gene in a variety of tumor tissues. DNA
methylation is one of the most studied epigenetic modifications in
mammals. In tumor cells, DNA demethylation was able to promote the
expression of certain oncogenes (52). For the first time, the changes in
MDIG promoter methylation levels in tumors were explained. As MDIG
was abnormally highly expressed in NSCLC, as expected, the promoter
methylation levels of MDIG were significantly reduced in LUAD and
LUSC. This suggested that hypomethylation of the promoter region of
MDIG may be another reason for the high expression of MDIG in tumor
tissues. Previous studies have indicated that high expression of
MDIG was associated with poor prognosis of patients in the early
stage of NSCLC but improved prognosis in the late stage (22). Therefore, LUAD was selected to
study the correlation between MDIG expression and that of C-Myc or
TP53. MDIG expression was positively correlated with that of C-Myc
at stage II/III; it was previously reported that MDIG was a novel
target gene of C-Myc and that the gene expression from the MDIG
promoter was elevated by c-Myc through E-box sites (6), yet this correlation weakened and was
no longer statistically significant at stage IV in the present
study. These results indicated that MDIG may be the downstream
target gene of C-Myc, but MDIG may not be regulated solely by C-Myc
and there may be other transcription factors that may regulate its
expression. In addition, the correlation between MDIG and TP53 was
weak and insignificant at stage I/II/III, but positive at stage IV.
This suggests that MDIG may inhibit tumor progression by promoting
the expression of certain tumor suppressor genes in patients with
advanced LUAD. However, the underlying molecular mechanisms of
these relationships require to be confirmed.
The TME has been widely implicated in tumorigenesis,
as it harbors tumor cells that interact with surrounding cells
through the circulatory and lymphatic systems to modulate the
development and progression of cancer. In addition to malignant
cells, adipocytes, fibroblasts, tumor vasculature, lymphocytes,
dendritic cells and cancer-associated fibroblasts are also present
in the TME (53). Each of these
cell types has unique immunological functions that determine
whether the tumor will survive and affect neighboring cells
(53). Previous reports have
demonstrated that MDIG was associated with a variety of human
diseases through immune regulation, such as pulmonary fibrosis
(5), asthma (54) and nematode expulsion (55). However, there were no studies on
the association of MDIG with tumor immunity. In the present study,
MDIG expression positively correlated with immune cell infiltration
in most types of tumors. However, the correlation of MDIG
expression with the infiltration of 'T cells CD8+', 'NK
cells activated' and 'Tregs' was negative. Since activated
CD8+ T cells and NK-cell infiltration predicts favorable
prognosis of patients with cancer (53), such as those with gastric cancer
(56) and malignant pleural
mesothelioma (57), MDIG may lead
to a poor prognosis by inhibiting their infiltration in the TME.
The negative correlation between MDIG and Treg infiltration was
also consistent with previous research, in which
immunohistochemistry using the Treg cell marker forkhead box p3
revealed an increased presence of Tregs in the lung of the
MDIG+/− mice in response to silica (5). Thus, the expression of MDIG is
closely related to immune cell infiltration, suggesting that MDIG
has an important role in the TME and may influence the occurrence
and development of a tumor by influencing the type and number of
infiltrating cells.
The clinical development of checkpoint
inhibitor-based immunotherapy has ushered in a promising era for
cancer treatment. Durable anti-PD-L1 immune checkpoint blockade
responses may be seen in patients with melanoma, LUAD, BLCA and
other malignancies (58). By
increasing the activity of the immune system, immune checkpoint
blockade may have inflammatory side effects, termed immune-related
adverse events. The development of predictive biomarkers is
required in order to optimize the patient benefit, minimize the
risk of toxicities and guide combination treatment approaches
(59,60). In the present study, MDIG
positively correlated with the frequency of certain
tumor-infiltrating immune cells, TME-relevant signatures,
immunostimulatory genes, immune checkpoint genes and chemokine
receptor genes in most types of tumor except for KIRC and THCA.
Furthermore, there was a significant positive correlation between
the expression of MDIG and that of PD-L1 in multiple tumor types.
Based on these results, it may be hypothesized that MDIG may be a
positive immunotherapy biomarker in several tumor types. In
addition, MDIG expression also correlated with TMB and MSI in
different types of cancer. Therefore, MDIG may be a good prognostic
biomarker for LUAD, BLCA, THYM, STAD, UCEC and LUSC in immune
checkpoint blockade therapy, but a poor prognostic biomarker for
KIRC and THCA. To test this hypothesis, a cohort of patients who
had received immunotherapy was used. The results demonstrated that
patients with BLCA and high MDIG expression had longer OS after
receiving PD-L1 treatment. This result suggested that high
expression of MDIG in BLCA may be used as a biomarker for the
clinical benefit of patients with cancer after receiving PD-L1
treatment. However, further clinical and molecular biology studies
are required to confirm this finding in different types of cancer
in the future.
Furthermore, high expression of MDIG led to multiple
drug resistance in the TCGA-LUAD cohort, consistent with previous
findings by our group that high expression of MDIG leads to
cisplatin resistance in A549 cells, in which MDIG promotes
cisplatin resistance of LUAD by regulating ABC transporter
expression via activation of the WNT/β-catenin signaling pathway
(24). More recently,
MDIG-specific small molecule inhibitors, 2-(aryl)
alkylthio-3,4-dihydro-4-oxoypyrimidine-5-carboxylic acids, were
reported to bind to MDIG through direct interaction with iron
cofactors (61). They not only
had anti-proliferative activity against cancer cells but also
sensitized cancer cells to conventional chemotherapy. In addition,
the anti-tumor effect of doxorubicin combined with MDIG inhibitor
was synergistic (61). Thus,
combination of MDIG inhibitors with existing chemotherapy, targeted
therapy and immunotherapy drugs may provide novel effective methods
for the treatment of multiple cancer types in the future.
The results of the present enrichment analysis
indicated that MDIG was related to the Akt signaling pathway and
cell proliferation. In addition, in vitro experiments
confirmed that MDIG modulated the expression of cycle-related
proteins (CDK2, CDK6, CDKN1A and CDKN2D) and promoted cell
proliferation through the mTORC2/Akt and PDK1/Akt signaling
pathways. In the mTORC2/Akt pathway, MDIG primarily promoted GβL
and Rictor expression, which may in turn activate Akt through
phosphorylation at Ser473, without affecting mTOR expression.
Furthermore, MDIG promoted phosphorylation of PDK1 at Ser241 and
also the phosphorylation of Akt at Thr308, without affecting PDK1
expression. In addition, PDK1/Akt inhibitors were used to verify
this molecular mechanism.
Although the present study comprehensively analyzed
the landscape of MDIG expression in different types of cancer,
there were several limitations. First, most of the data were mined
using public databases and most of them were results of RNA-seq
data. Furthermore, the absence of specific names of the tumor cell
lines from the CCLE database was another limitation. In addition,
as lung cancer is by far the most common malignancy, the mechanisms
of MDIG were primarily explored in LUAD. Finally, in vitro
experiments were only performed to verify the effect of MDIG on
cell proliferation at the protein level, which was because
signaling pathway proteins were primarily regulated by
post-transcriptional modifications. However, the present study not
only revealed the roles of MDIG in different types of cancer but
may also guide future research on MDIG in various tumor types.
Therefore, more detailed and in-depth studies are required in the
future to clarify the significance of MDIG in different types of
cancer.
Availability of data and materials
The datasets used and/or analyzed during the current
study are available from the corresponding author on reasonable
request. The patient data used are available from the GTEx, CCLE,
TCGA and IMvigor210 public databases.
Authors' contributions
FG and HZ contributed to the experimental design.
FG, WY, DS and HH collected and analyzed the raw data. FG, BH, HZ
and YC performed data analysis. FG participated in the writing of
the manuscript and data interpretation. FG and WY conducted the
transfection experiments. FG and HZ checked and approved the
authenticity of the raw data. All authors read and approved the
final manuscript.
Ethics approval and consent to
participate
Not applicable.
Patient consent for publication
Not applicable.
Competing interests
The authors declare that they have no competing
interests.
Acknowledgments
Not applicable.
Funding
This work was funded by the Project of Liaoning Distinguished
Professor [grant no. (2013) 204 to HZ] and the China Postdoctoral
Foundation Project (grant no. 2020M670097ZX to FG).
References
|
1
|
Sung H, Ferlay J, Siegel RL, Laversanne M,
Soerjomataram I, Jemal A and Bray F: Global cancer statistics 2020:
GLOBOCAN estimates of incidence and mortality worldwide for 36
Cancers in 185 Countries. CA Cancer J Clin. 71:209–249. 2021.
View Article : Google Scholar
|
|
2
|
Wu K, Li L, Thakur C, Lu Y, Zhang X, Yi Z
and Chen F: Proteomic characterization of the world trade center
dust-activated mdig and c-myc signaling circuit linked to multiple
myeloma. Sci Rep. 6:363052016. View Article : Google Scholar
|
|
3
|
Zhang Y, Lu Y, Yuan BZ, Castranova V, Shi
X, Stauffer JL, Demers LM and Chen F: The Human mineral
dust-induced gene, mdig, is a cell growth regulating gene
associated with lung cancer. Oncogene. 24:4873–4882. 2005.
View Article : Google Scholar
|
|
4
|
Sun J, Yu M, Lu Y, Thakur C, Chen B, Qiu
P, Zhao H and Chen F: Carcinogenic metalloid arsenic induces
expression of mdig oncogene through JNK and STAT3 activation.
Cancer Lett. 346:257–263. 2014. View Article : Google Scholar
|
|
5
|
Thakur C, Wolfarth M, Sun J, Zhang Y, Lu
Y, Battelli L, Porter DW and Chen F: Oncoprotein mdig contributes
to silica-induced pulmonary fibrosis by altering balance between
Th17 and Treg T cells. Oncotarget. 6:3722–3736. 2015. View Article : Google Scholar
|
|
6
|
Tsuneoka M, Koda Y, Soejima M, Teye K and
Kimura H: A novel myc target gene, mina53, that is involved in cell
proliferation. J Biol Chem. 277:35450–35459. 2002. View Article : Google Scholar
|
|
7
|
Eilbracht J, Kneissel S, Hofmann A and
Schmidt-Zachmann MS: Protein NO52-a constitutive nucleolar
component sharing high sequence homologies to protein NO66. Eur J
Cell Biol. 84:279–294. 2005. View Article : Google Scholar
|
|
8
|
Chowdhury R, Sekirnik R, Brissett NC,
Krojer T, Ho CH, Ng SG, Clifton LJ, Ge W, Kershaw NJ, Fox GC, et
al: Ribosomal oxygenases are structurally conserved from
prokaryotes to humans. Nature. 510:422–426. 2014. View Article : Google Scholar
|
|
9
|
Aziz N, Hong YH, Jo M, Kim JK, Kim KH,
Ashktorab H, Smoot DT, Hur H, Yoo BC and Cho AJY: Molecular
signatures of JMJD10/MINA53 in gastric cancer. Cancers.
12:11412020. View Article : Google Scholar
|
|
10
|
Ge W, Wolf A, Feng T, Ho CH, Sekirnik R,
Zayer A, Granatino N, Cockman ME, Loenarz C and Loik ND:
Oxygenase-catalyzed ribosome hydroxylation occurs in prokaryotes
and humans. Nat Chem Biol. 8:960–962. 2012. View Article : Google Scholar
|
|
11
|
Zhang Q, Thakur C, Shi J, Sun J, Fu Y,
Stemmer P and Chen F: New discoveries of mdig in the epigenetic
regulation of cancers. Semin Cancer Biol. 57:27–35. 2019.
View Article : Google Scholar
|
|
12
|
Komiya K, Sueoka-Aragane N, Sato A,
Hisatomi T, Sakuragi T, Mitsuoka M, Sato T, Hayashi S, Izumi H,
Tsuneoka M and Sueoka E: Mina53, a novel c-Myc target gene, is
frequently expressed in lung cancers and exerts oncogenic property
in NIH/3T3 cells. J Cancer Res Clin Oncol. 136:465–473. 2010.
View Article : Google Scholar
|
|
13
|
Thakur C, Lu Y, Sun J, Yu M, Chen B and
Chen F: Increased expression of mdig predicts poorer survival of
the breast cancer patients. Gene. 535:218–224. 2014. View Article : Google Scholar
|
|
14
|
Zhang L, Huo Q, Ge C, Zhao F, Zhou Q, Chen
X, Tian H, Chen T, Xie H, Cui Y, et al: ZNF143-mediated H3K9
trimethylation upregulates CDC6 by activating MDIG in
hepatocellular carcinoma. Cancer Res. 80:2599–2611. 2020.
View Article : Google Scholar
|
|
15
|
Teye K, Tsuneoka M, Arima N, Koda Y,
Nakamura Y, Ueta Y, Shirouzu K and Kimura H: Increased expression
of a Myc target gene Mina53 in human colon cancer. Am J Pathol.
164:205–216. 2004. View Article : Google Scholar
|
|
16
|
Xing J, Wang K, Liu PW, Miao Q and Chen
XY: Mina53, a novel molecular marker for the diagnosis and
prognosis of gastric adenocarcinoma. Oncol Rep. 31:634–640. 2014.
View Article : Google Scholar
|
|
17
|
Bellut J, Bertz S, Nolte E, Stöhr C,
Polifka I, Lieb V, Herrmann E, Jung R, Hartmann A, Wullich B, et
al: Differential prognostic value of MYC immunohistochemistry in
subtypes of papillary renal cell carcinoma. Sci Rep. 7:164242017.
View Article : Google Scholar
|
|
18
|
Kuratomi K, Yano H, Tsuneoka M, Sakamoto
K, Kusukawa J and Kojiro M: Immunohistochemical expression of
Mina53 and Ki67 proteins in human primary gingival squamous cell
carcinoma. Kurume Med J. 53:71–78. 2006. View Article : Google Scholar
|
|
19
|
Teye K, Arima N, Nakamura Y, Sakamoto K,
Sueoka E, Kimura H and Tsuneoka M: Expression of myc target gene
mina53 in subtypes of human lymphoma. Oncol Rep. 18:841–848.
2007.
|
|
20
|
Thakur C and Chen F: Current understanding
of mdig/MINA in human cancers. Genes Cancer. 6:288–302. 2015.
View Article : Google Scholar
|
|
21
|
Komiya K, Sueoka-Aragane N, Sato A,
Hisatomi T, Sakuragi T, Mitsuoka M, Sato T, Hayashi S, Izumi H,
Tsuneoka M and Sueoka E: Expression of Mina53, a novel c-Myc target
gene, is a favorable prognostic marker in early stage lung cancer.
Lung Cancer. 69:232–238. 2010. View Article : Google Scholar
|
|
22
|
Yu M, Sun J, Thakur C, Chen B, Lu Y, Zhao
H and Chen F: Paradoxical roles of mineral dust induced gene on
cell proliferation and migration/invasion. PLoS One. 9:e879982014.
View Article : Google Scholar
|
|
23
|
Thakur C, Chen B, Li L, Zhang Q, Yang ZQ
and Chen F: Loss of mdig expression enhances DNA and histone
methylation and metastasis of aggressive breast cancer. Signal
Transduct Target Ther. 3:252018. View Article : Google Scholar
|
|
24
|
Wang Q, Geng F, Zhou H, Chen Y, Du Y,
Zhang X, Song D and Zhao H: MDIG promotes cisplatin resistance of
lung adenocarcinoma by regulating ABC transporter expression via
activation of the WNT/β-catenin signaling pathway. Oncol Lett.
18:4294–4307. 2019.
|
|
25
|
Xuan F, Huang M, Zhao E and Cui H: MINA53
deficiency leads to glioblastoma cell apoptosis via inducing DNA
replication stress and diminishing DNA damage response. Cell Death
Dis. 9:10622018. View Article : Google Scholar
|
|
26
|
Zhou H, Geng F, Chen Y, Du J, Zhang X, Liu
B, Song D, Hou H and Zhao H: The mineral dust-induced gene, mdig,
regulates angiogenesis and lymphangiogenesis in lung adenocarcinoma
by modulating the expression of VEGF-A/C/D via EGFR and HIF-1α
signaling. Oncol Rep. 45:602021. View Article : Google Scholar
|
|
27
|
GTEx Consortium: The genotype-tissue
expression (GTEx) project. Nat Gen. 45:580–585. 2013. View Article : Google Scholar
|
|
28
|
The TCGA Legacy: Cell. 173:281–282. 2018.
View Article : Google Scholar
|
|
29
|
Wang S, Xiong Y, Zhao L, Gu K, Li Y, Zhao
F, Li J, Wang M, Wang H, Tao Z, et al: UCSCXenaShiny: An R/CRAN
Package for interactive analysis of UCSC xena data. Bioinformatics.
38:527–529. 2021. View Article : Google Scholar
|
|
30
|
Gao J, Aksoy BA, Dogrusoz U, Dresdner G,
Gross B, Sumer SO, Sun Y, Jacobsen A, Sinha R, Larsson E, et al:
Integrative analysis of complex cancer genomics and clinical
profiles using the cBioPortal. Sci Signal. 6:112013. View Article : Google Scholar
|
|
31
|
Chandrashekar DS, Bashel B, Balasubramanya
SAH, Creighton CJ, Ponce-Rodriguez I, Chakravarthi BVSK and
Varambally S: UALCAN: A portal for facilitating tumor subgroup gene
expression and survival analyses. Neoplasia. 19:649–658. 2017.
View Article : Google Scholar
|
|
32
|
Massó-Vallés D, Beaulieu ME and Soucek L:
MYC, MYCL, and MYCN as therapeutic targets in lung cancer. Expert
Opin Ther Targets. 24:101–114. 2020. View Article : Google Scholar
|
|
33
|
Huang CL, Yokomise H and Miyatake A:
Clinical significance of the p53 pathway and associated gene
therapy in non-small cell lung cancers. Future Oncol. 3:83–93.
2007. View Article : Google Scholar
|
|
34
|
Chen B, Khodadoust MS, Liu CL, Newman AM
and Alizadeh AA: Profiling tumor infiltrating immune cells with
CIBERSORT. Methods Mol Biol. 1711:243–259. 2018. View Article : Google Scholar
|
|
35
|
Ju M, Jiang L, Wei Q, Yu L, Chen L, Wang
Y, Hu B, Qian P, Zhang M, Zhou C, et al: A immune-related signature
associated with TME can serve as a potential biomarker for survival
and sorafenib resistance in liver cancer. Onco Targets Ther.
14:5065–5083. 2021. View Article : Google Scholar
|
|
36
|
Zeng D, Li M, Zhou R, Zhang J, Sun H, Shi
M, Bin J, Liao Y, Rao J and Liao W: Tumor microenvironment
characterization in gastric cancer identifies prognostic and
immunotherapeutically relevant gene signatures. Cancer Immunol Res.
7:737–750. 2019. View Article : Google Scholar
|
|
37
|
Meyers DE and Banerji S: Biomarkers of
immune checkpoint inhibitor efficacy in cancer. Curr Oncol.
27(Suppl 2): S106–S114. 2020.
|
|
38
|
Ru B, Wong CN, Tong Y, Zhong JY, Zhong
SSW, Wu WC, Chu KC, Wong CY, Lau CY, Chen I, et al: TISIDB: An
integrated repository portal for tumor-immune system interactions.
Bioinformatics. 35:4200–4202. 2019. View Article : Google Scholar
|
|
39
|
Mariathasan S, Turley SJ, Nickles D,
Castiglioni A, Yuen K, Wang Y, Kadel EE III, Koeppen H, Astarita
JL, Cubas R, et al: TGFβ attenuates tumour response to PD-L1
blockade by contributing to exclusion of T cells. Nat. 554:544–548.
2018. View Article : Google Scholar
|
|
40
|
Yang W, Soares J, Greninger P, Edelman EJ,
Lightfoot H, Forbes S, Bindal N, Beare D, Smith JA, Thompson IR, et
al: Genomics of drug sensitivity in cancer (GDSC): A resource for
therapeutic biomarker discovery in cancer cells. Nucleic Acids Res.
41:D955–D961. 2013. View Article : Google Scholar
|
|
41
|
Geeleher P, Cox N and Huang RS:
pRRophetic: An R package for prediction of clinical
chemotherapeutic response from tumor gene expression levels. PLoS
One. 9:e1074682014. View Article : Google Scholar
|
|
42
|
Geeleher P, Cox NJ and Huang RS: Clinical
drug response can be predicted using baseline gene expression
levels and in vitro drug sensitivity in cell lines. Genome Biol.
15:R472014. View Article : Google Scholar
|
|
43
|
Hänzelmann S, Castelo R and Guinney J:
GSVA: Gene set variation analysis for microarray and RNA-seq data.
BMC Bioinformatics. 14:72013. View Article : Google Scholar
|
|
44
|
Powers RK, Goodspeed A, Pielke-Lombardo H,
Tan AC and Costello JC: GSEA-InContext: Identifying novel and
common patterns in expression experiments. Bioinformatics.
34:i555–i564. 2018. View Article : Google Scholar
|
|
45
|
Choucair K, Morand S, Stanbery L, Edelman
G, Dworkin L and Nemunaitis J: TMB: A promising immune-response
biomarker, and potential spearhead in advancing targeted therapy
trials. Cancer Gene Ther. 27:841–853. 2020. View Article : Google Scholar
|
|
46
|
Bouchez C, Kempf E and Tournigand C: MSI
Metastatic solid tumors treatment and immunotherapies. Bull Cancer.
106:143–150. 2019. View Article : Google Scholar
|
|
47
|
Kaur J, Elms J, Munn AL, Good D and Wei
MQ: Immunotherapy for non-small cell lung cancer (NSCLC), as a
stand-alone and in combination therapy. Crit Rev Oncol Hematol.
164:1034172021. View Article : Google Scholar
|
|
48
|
Yu JS and Cui W: Proliferation, survival
and metabolism: The role of PI3K/AKT/mTOR signalling in
pluripotency and cell fate determination. Development.
143:3050–3060. 2016. View Article : Google Scholar
|
|
49
|
Ferreira MJ, Pires-Luís AS, Vieira-Coimbra
M, Costa-Pinheiro P, Antunes L, Dias PC, Lobo F, Oliveira J,
Gonçalves CS, Costa BM, et al: SETDB2 and RIOX2 are differentially
expressed among renal cell tumor subtypes, associating with
prognosis and metastization. Epigenetics. 12:1057–1064. 2017.
View Article : Google Scholar
|
|
50
|
Shi J, Thakur C, Zhao Y, Li Y, Nie L,
Zhang Q, Bi Z, Fu Y, Wadgaonkar P, Almutairy B, et al: Pathological
and prognostic indications of the mdig gene in human lung cancer.
Cell Physiol Biochem. 55:13–28. 2021. View Article : Google Scholar
|
|
51
|
Tan XP, Dong WG, Zhang Q, Yang ZR, Lei XF
and Ai MH: Potential effects of Mina53 on tumor growth in human
pancreatic cancer. Cell Biochem Biophys. 69:619–625. 2014.
View Article : Google Scholar
|
|
52
|
Kulis M and Esteller M: DNA methylation
and cancer. Adv Genet. 70:27–56. 2010. View Article : Google Scholar
|
|
53
|
Arneth B: Tumor microenvironment. Medicina
(Kaunas). 56:152019. View Article : Google Scholar
|
|
54
|
Mori T, Okamoto K, Tanaka Y, Teye K, Umata
T, Ohneda K, Tokuyama K, Okabe M and Tsuneoka M: Ablation of Mina53
in mice reduces allergic response in the airways. Cell Struct
Funct. 38:155–167. 2013. View Article : Google Scholar
|
|
55
|
Pillai MR, Mihi B, Ishiwata K, Nakamura K,
Sakuragi N, Finkelstein DB, McGargill MA, Nakayama T, Ayabe T,
Coleman ML and Bix M: Myc-induced nuclear antigen constrains a
latent intestinal epithelial cell-intrinsic anthelmintic pathway.
PLoS One. 14:e02112442019. View Article : Google Scholar
|
|
56
|
Chen T, Yang C, Dou R and Xiong B:
Identification of a novel 10 immune-related genes signature as a
prognostic biomarker panel for gastric cancer. Cancer Med.
10:6546–6560. 2021. View Article : Google Scholar
|
|
57
|
Yamada N, Oizumi S, Kikuchi E, Shinagawa
N, Konishi-Sakakibara J, Ishimine A, Aoe K, Gemba K, Kishimoto T,
Torigoe T and Nishimura M: CD8+ tumor-infiltrating lymphocytes
predict favorable prognosis in malignant pleural mesothelioma after
resection. Cancer Immunol Immunother. 59:1543–1549. 2010.
View Article : Google Scholar
|
|
58
|
Pilard C, Ancion M, Delvenne P, Jerusalem
G, Hubert P and Herfs M: Cancer immunotherapy: It's time to better
predict patients' response. Br J Cancer. 125:927–938. 2021.
View Article : Google Scholar
|
|
59
|
Postow MA, Sidlow R and Hellmann MD:
Immune-related adverse events associated with immune checkpoint
blockade. N Engl J Med. 378:158–168. 2018. View Article : Google Scholar
|
|
60
|
Gibney GT, Weiner LM and Atkins MB:
Predictive biomarkers for checkpoint inhibitor-based immunotherapy.
Lancet Oncol. 17:e542–e551. 2016. View Article : Google Scholar
|
|
61
|
Nowak RP, Tumber A, Hendrix E, Ansari MSZ,
Sabatino M, Antonini L, Andrijes R, Salah E, Mautone N, Pellegrini
FR, et al: First-in-class inhibitors of the ribosomal oxygenase
MINA53. J Med Chem. 64:17031–17050. 2021. View Article : Google Scholar
|