Introduction
Kidney cancer is currently the 11th leading
malignancy incidence among males (254,507 cases) and the 16th
common among females (148,755 cases), ranking as the 14th most
common cause of cancer-associated morality (175,098 cases)
worldwide in 2018 (1). Based on
intratumor heterogeneity and biological characteristics (2,3),
genetic diversity determines varying responses to therapy, and can
even lead to drug resistance by some key determinants, including
imposing therapeutic pressures (4). Thus, it is of utmost urgency to
identify a novel therapeutic target. Moreover, apart from the
WHO/ISUP grade which is widely used to evaluate tumor malignancy,
effective biomarkers are less exploited for the profiling of renal
cell carcinoma (RCC).
Cell division cycle-associated 5 (CDCA5), also known
as sororin, is a substrate of APC/CCdc20 (anaphase-promoting
complex/cyclosome associated with Cdc20) (5), playing pivotal roles in sister
chromatid cohesion (6), chromatin
structure (7), genome integrity
(8) and DNA damage repair
(9,10). Cohesin is a 'ring structure'
complex composed of certain core subunits, such as structural
maintenance of chromosomes protein (SMC)1, SMC3, RAD21 and stromal
antigen 1/2 (11). CDCA5
antagonizes Wings apart-like protein homolog (WAPL) to adjust the
loading and unloading of cohesin, thus stabilizing cohesin-DNA
interactions in the S and G2/M phases (12).
Recent studies have discovered that the upregulated
expression of CDCA5 is associated with an increased tumor
malignancy as an indicator of an unfavorable prognosis, including
in hepatocellular carcinoma (13), colorectal cancer (14), urothelial carcinoma (15), etc. However, several underlying
processes of CDCA5 involved in coordinated chromatin remodeling and
tumorigenesis are not yet well characterized. When paired with
advanced pathological stages and tumor grade, the expression of
CDCA5 lacks a significant association in the majority of these
tumors to effectively stratify tumor malignancy. Additionally,
CDCA5 is not as effective at predicting survival outcomes in these
cancer types, as it is in clear cell RCC (ccRCC). In addition, to
the best of our knowledge, there has been no report to date
describing the expression and function of CDCA5 in RCC.
The objective of the present study was to
investigate the prognostic value of CDCA5 expression levels in
ccRCC and to shed light on tumorigenesis associated with CDCA5. In
this regard, for the first time, to the best of our knowledge, the
present study delineated the differences in CDCA5 expression
between ccRCC tumor specimens and adjacent normal tissues. Of note,
the more advanced grades and stages of ccRCC exhibited a higher
expression of CDCA5, predicting an unfavorable survival. In
vivo and in vitro experiments were conducted to
investigate the function and underlying mechanisms of CDCA5 in the
malignant progression of ccRCC. Apart from the previously described
roles in cell proliferation, chromatin cohesion maintenance and
cell cycle regulation (12,16), it was demonstrated that CDCA5
could function via the DNA damage response (DDR) pathway in ccRCC
and trigger sequential cell cycle arrest and apoptosis when its
expression was knocked down.
The findings presented herein support the oncogenic
role of CDCA5 in maintaining genomic stability and promoting
inflammatory signals, thus promoting ccRCC survival and
progression. CDCA5 may thus be a novel biomarker and potential
therapeutic target in ccRCC.
Materials and methods
Data mining
To identify differential expressed genes (DEGs), The
Cancer Genome Atlas (TCGA) dataset (http://genome-cancer.ucsc.edu) was used to screen all
genes positively associated with a poor prognosis of RCC. Gene
Ontology and Kyoto Encyclopedia of Genes and Genomes (KEGG) pathway
enrichment analysis revealed that the majority of these DEGs were
associated with cell cycle control. Following the tumor survival
analysis of these hub genes, it was found that CDCA5 was
overexpressed in ccRCC and predicted a poor patient prognosis
(Figs. 1 and 2). Subsequently, Gene Set Cancer
Analysis (GSCA, http://bioinfo.life.hust.edu.cn/GSCA/#/expression) and
the UALCAN database (http://ualcan.path.uab.edu/index.html) was utilized to
analyze the differential expression patterns of CDCA5 in all the 33
TCGA cancers. Thereafter, based on the CDCA5 expression differences
between tumor and normal samples, GSCA was used to evaluate the
association between the Gene Set Variation Analysis (GSVA) score
and patient survival.
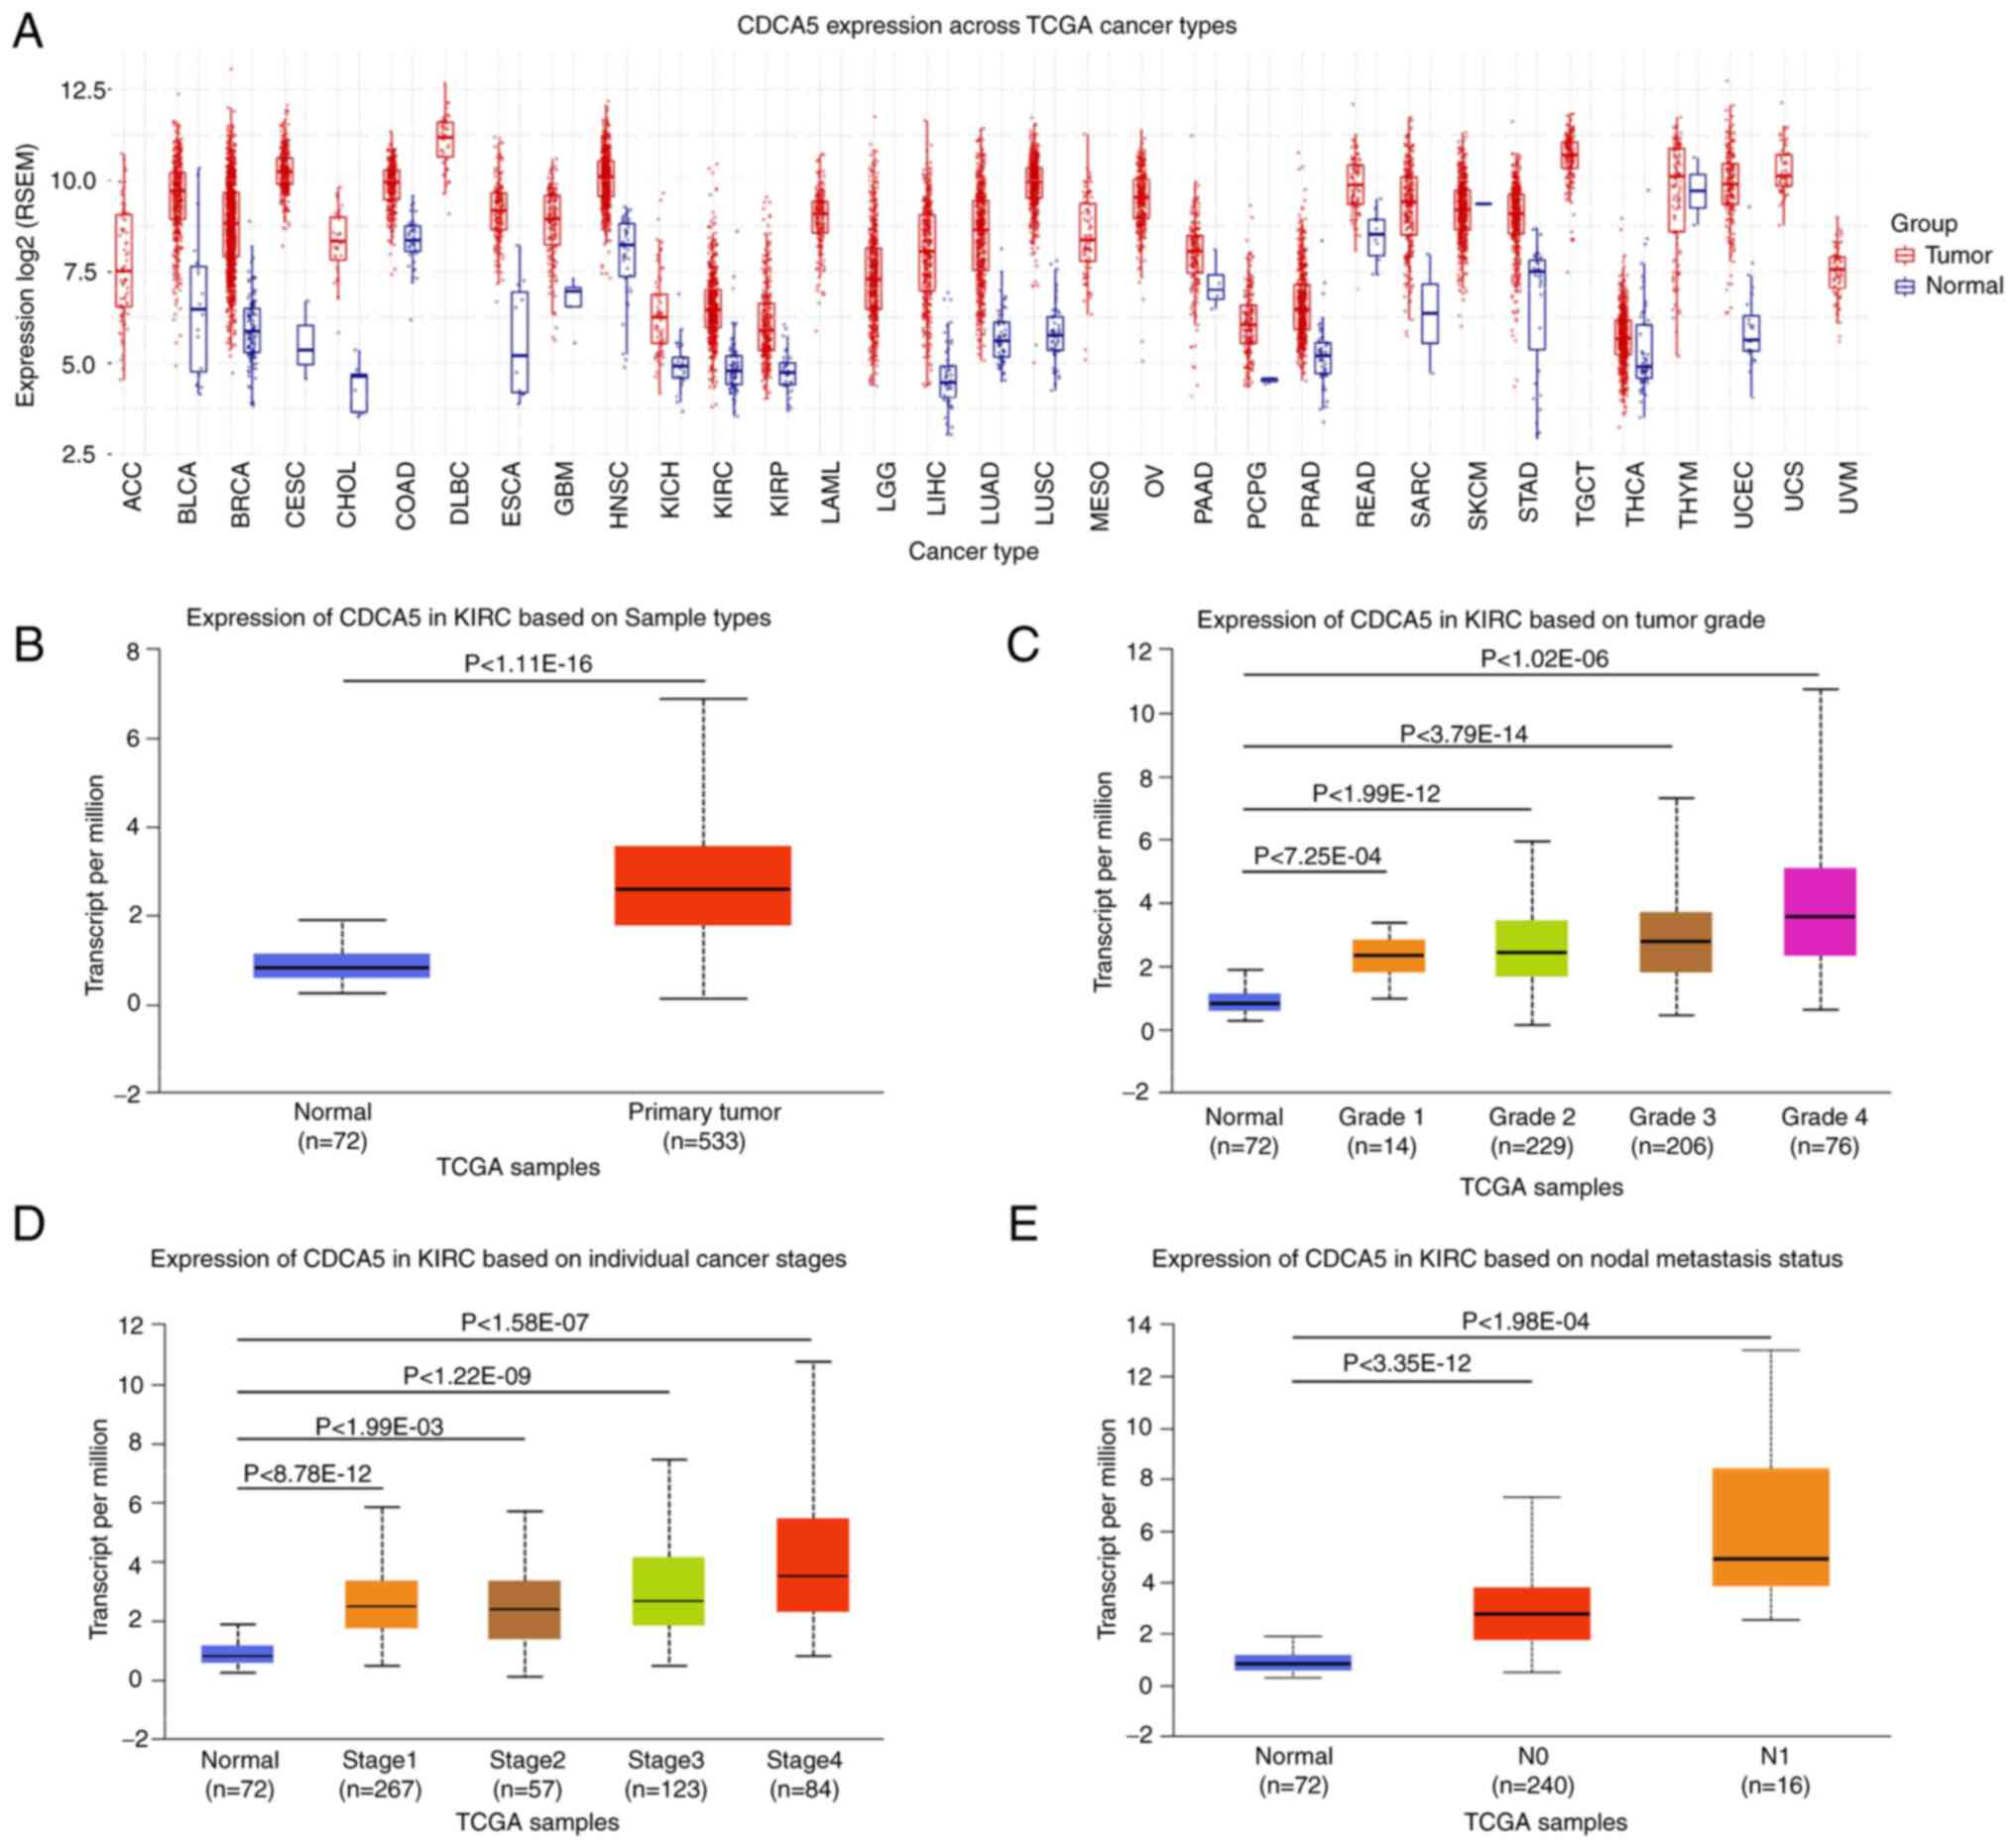 | Figure 1TCGA analysis of kidney renal clear
cell carcinoma on UALCA and GSCA. (A) Pancancer relative expression
of CDCA5 across 33 TCGA tumors. (B) Differential expression of
CDCA5 in ccRCC tissue vs. adjacent normal tissue. (C) Expression of
CDCA5 in ccRCC of different tumor grade. (D) Expression of CDCA5 in
ccRCC of different tumor stages. (E) Expression of CDCA5 in ccRCC
based on nodal metastasis status. TCGA, The Cancer Genome Atlas;
UALCA, the university of Alabama at Birmingham cancer data
analysis; GSCA, Gene Set Cancer Analysis; CDCA5, cell division
cycle-associated 5; ccRCC, clear cell renal cell carcinoma; ACC,
adrenocortical carcinoma; BLCA, bladder urothelial carcinoma; BRCA,
breast invasive carcinoma; CESC, cervical squamous cell carcinoma
and endocervical adenocarcinoma; CHOL, cholangiocarcinoma; COAD,
colon adenocarcinoma; DLBC, lymphoid neoplasm diffuse large B-cell
lymphoma; ESCA, esophageal carcinoma; GBM, glioblastoma multiforme;
HNSC, head and neck squamous cell carcinoma; KICH, kidney
chromophobe; KIRC, kidney renal clear cell carcinoma; KIRP, kidney
renal papillary cell carcinoma; LAML, acute myeloid leukemia; LGG,
brain lower grade glioma; LIHC, liver hepatocellular carcinoma;
LUAD, lung adenocarcinoma; LUSC, lung squamous cell carcinoma;
MESO, mesothelioma; OV, ovarian serous cystadenocarcinoma; PAAD,
pancreatic adenocarcinoma; PCPG, pheochromocytoma and
paraganglioma; PRAD, prostate adenocarcinoma; READ, rectum
adenocarcinoma; SARC, sarcoma; SKCM, skin cutaneous melanoma; STAD,
stomach adenocarcinoma; TGCT, testicular germ cell tumor; THCA,
thyroid carcinoma; THYM, thymoma; UCEC, uterine corpus endometrial
carcinoma; UCS, uterine carcinosarcoma; UVM, uveal melanoma. |
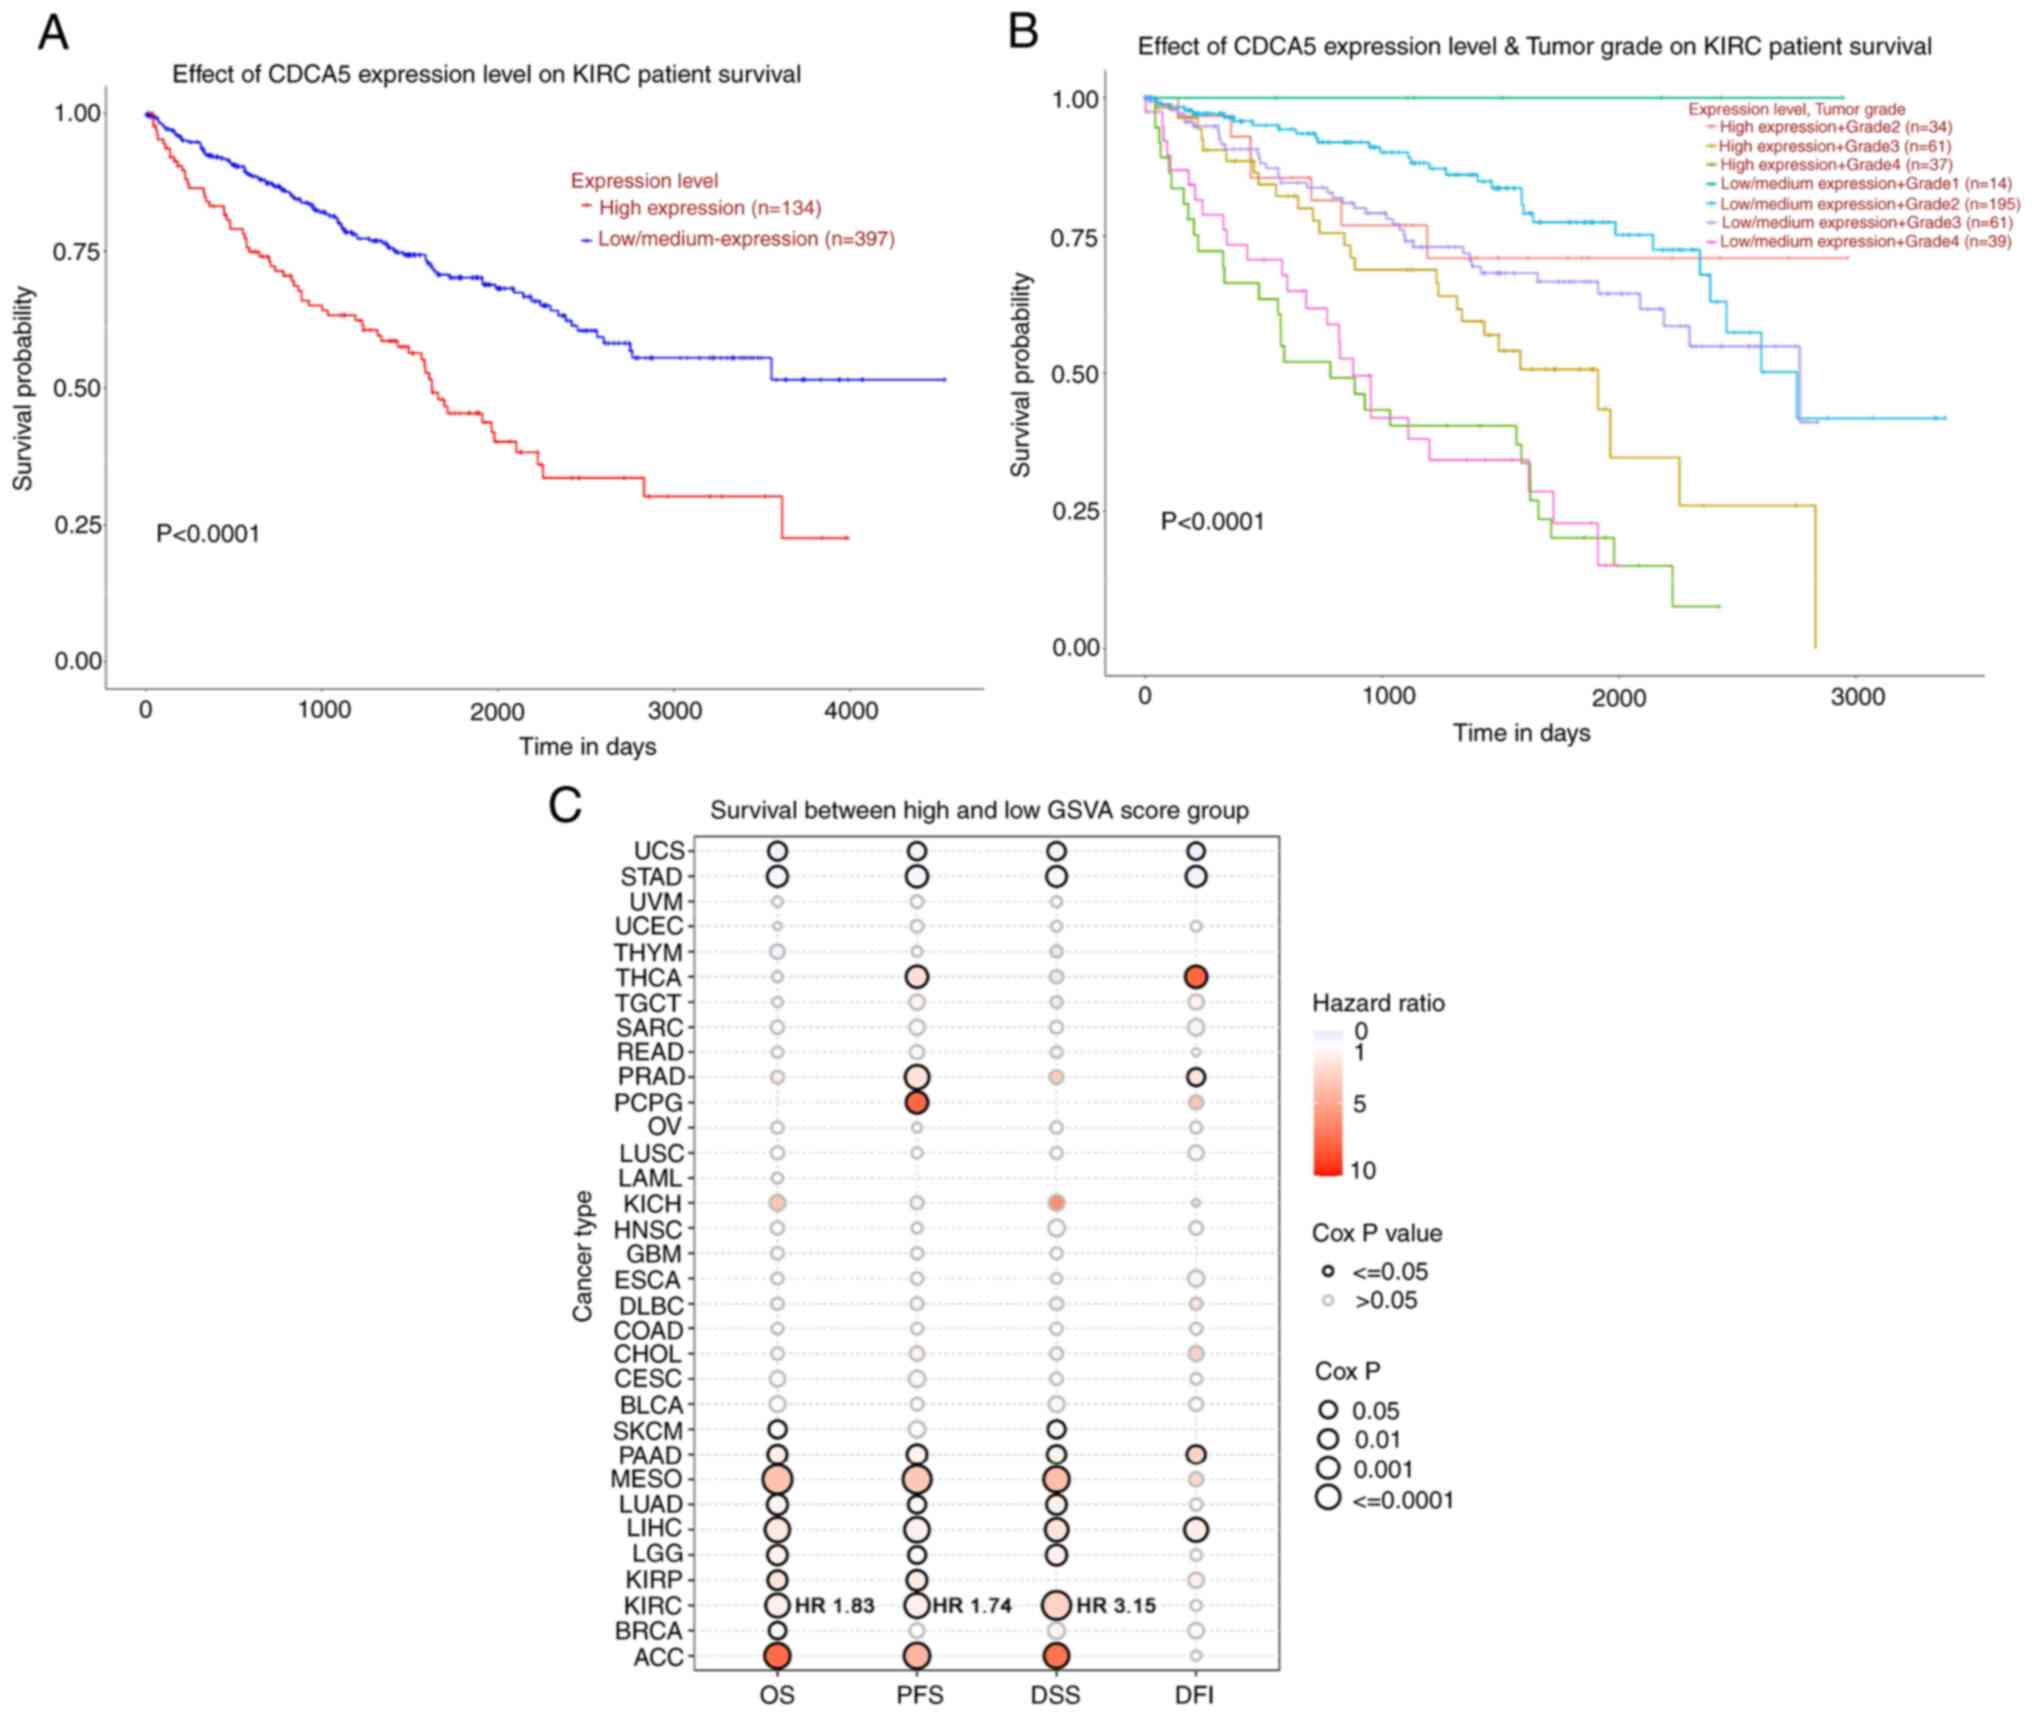 | Figure 2Survival analysis of CDCA5 in kidney
renal clear cell carcinoma and TCGA cancers was performed using
UALCA and GSCA. (A) Patients with a higher CDCA5 expression
exhibited a worse overall survival (P<0.0001) compared to those
with a low/medium CDCA5 expression group. (B) Kaplan-Meier curves
of overall survival between groups according to CDCA5 expression
level and tumor grade. Patients with a high CDCA5 expression and
grade 4 ccRCC tumor had a worse survival (P<0.0001). (C) Bubble
plot displaying survival between the high and low gene set
variation analysis score related to CDCA5 expression. The red
bubbles represented a higher hazard ratio, and bubbles with a black
outline border indicate a Cox P-value <0.05. UALCA, the
university of Alabama at Birmingham cancer data analysis; GSCA,
Gene Set Cancer Analysis; CDCA5, cell division cycle-associated 5;
ccRCC, clear cell renal cell carcinoma; OS, overall survival; DFS,
disease-free survival; PFS, progression-free survival; DSS,
disease-free survival; DFI, disease-free interval; ACC,
adrenocortical carcinoma; BLCA, bladder urothelial carcinoma; BRCA,
breast invasive carcinoma; CESC, cervical squamous cell carcinoma
and endocervical adenocarcinoma; CHOL, cholangiocarcinoma; COAD,
colon adenocarcinoma; DLBC, lymphoid neoplasm diffuse large B-cell
lymphoma; ESCA, esophageal carcinoma; GBM, glioblastoma multiforme;
HNSC, head and neck squamous cell carcinoma; KICH, kidney
chromophobe; KIRC, kidney renal clear cell carcinoma; KIRP, kidney
renal papillary cell carcinoma; LAML, acute myeloid leukemia; LGG,
brain lower grade glioma; LIHC, liver hepatocellular carcinoma;
LUAD, lung adenocarcinoma; LUSC, lung squamous cell carcinoma;
MESO, mesothelioma; OV, ovarian serous cystadenocarcinoma; PAAD,
pancreatic adenocarcinoma; PCPG, pheochromocytoma and
paraganglioma; PRAD, prostate adenocarcinoma; READ, rectum
adenocarcinoma; SARC, sarcoma; SKCM, skin cutaneous melanoma; STAD,
stomach adenocarcinoma; TGCT, testicular germ cell tumor; THCA,
thyroid carcinoma; THYM, thymoma; UCEC, uterine corpus endometrial
carcinoma; UCS, uterine carcinosarcoma; UVM, uveal melanoma. |
Patients and tumor specimens
From October, 2012 to May, 2016, a total of 137
patients who underwent RCC resection at Chinese People's Liberation
Army (PLA) General Hospital (Beijing, China) were enrolled in the
present study. Resected paired tumor and adjacent normal tissue
were immediately snap-frozen in liquid nitrogen, and then stored at
−80°C. Written informed consent was obtained from all participants.
The study was conducted in accordance with protocol approved by the
Protection of Human Subjects Committee of Chinese People's
Liberation Army (PLA) General Hospital (S2019-219-07). The
clinicopathological characteristics of these patients with ccRCC
are summarized in Table I. The
TNM classification (American Joint Committee on Cancer eighth
edition) was utilized for staging ccRCC (17). The inclusion criteria were as
follows: Conventional surgical treatment without radiation or
chemotherapy, histopathologically diagnosed ccRCC, post-operative
follow-up for at least 12 months and comprehensive clinical medical
records. Patients with severe underlying conditions, patients with
inadequate data and patients with benign renal tumors, Xp11.2
translocation/TFE3 fusion gene-related renal carcinoma, papillary
carcinoma and other non-clear cell carcinomas were excluded from
the study.
 | Table IAssociation between CDCA5 expression
and the clinical characteristics of 137 patients with ccRCC. |
Table I
Association between CDCA5 expression
and the clinical characteristics of 137 patients with ccRCC.
| Characteristic | No. of patients
(%) | CDCA5 expression
| χ2
value | P-value |
|---|
| Low (%) | High (%) |
|---|
| Number of
patients | 137 | 85 | 52 | | |
| Age (years) | | | | | |
| ≤60 | 104 (75.9) | 66 (77.6) | 38 (73.1) | 0.369 | 0.544 |
| >60 | 33 (24.1) | 19 (22.4) | 14 (26.9) | | |
| Sex | | | | | |
| Male | 103 (75.2) | 66 (77.6) | 37 (71.2) | 0.729 | 0.393 |
| Female | 34 (24.8) | 19 (22.4) | 15 (28.8) | | |
| BMI | | | | | |
| <28 | 101 (73.7) | 62 (72.9) | 39 (75.0) | 0.071 | 0.79 |
| ≥28 | 36 (26.3) | 23 (27.1) | 13 (25.0) | | |
| T stage | | | | | |
| T1 | 111 (81.0) | 75 (88.2) | 36 (69.2) | 7.578 | 0.006 |
| T2-T4 | 26 (19.0) | 10 (12.8) | 16 (30.8) | | |
| N stage | | | | | |
| N1 | 6 (4.4) | 1 (1.2) | 5 (9.6) | 3.656 | 0.056 |
| N0 | 131 (95.6) | 84 (98.8) | 47 (90.4) | | |
| M stage | | | | | |
| M1 | 13 (9.5) | 2 (2.4) | 11 (21.2) | 13.278 |
<0.001 |
| M0 | 124 (90.5) | 83 (97.6) | 41 (78.8) | | |
| AJCC stage | | | | | |
| I-II | 113 (82.5) | 82 (96.5) | 31 (59.6) | 30.328 |
<0.001 |
| III-IV | 24 (17.5) | 3 (3.5) | 21 (40.4) | | |
| WHO/ISUP Grade | | | | | |
| I-II/Low | 113 (82.5) | 80 (94.1) | 26 (50.0) | 35.867 |
<0.001 |
| III-IV/High | 24 (17.5) | 5 (5.9) | 26 (50.0) | | |
Cell lines and cell culture
The RCC cell lines, ACHN (PU MC0 0 0334), Ca k i-1
(PU MC0 0 024 4), A498 (PUMC0 0 0171), OSRC2 (PUMC0 0 0292), 769-P
(PUMC000333) and 786-O (PUMC000243), and 293T (PUMC000010) cells
were purchased from the National Infrastructure of Cell Line
Resource (Beijing, China). SN12-PM6 cell line was kindly provided
by Dr X.P. Zhang from Union Hospital, Tongji Medical College,
Huazhong University of Science and Technology, Wuhan, China. The
293T and SN12-PM6 cell lines were cultured in Dulbecco's modified
Eagle's medium; the ACHN and A498 cells were maintained in minimum
essential medium; the OSRC2, 769-P and 786-O cells were maintained
in Roswell Park Memorial Institute-1640 medium; and the Caki-1
cells were maintained in McCoy's 5A medium. All media (Thermo
Fisher Scientific, Inc.) were supplemented with 10% fetal bovine
serum (FBS) (EVERY GREEN, Zhejiang Tianhang Biotechnology Co.,
Ltd.) and 1% penicillin G sodium/streptomycin. And all cell lines
were grown in a humidified 37°C incubator containing 5%
CO2.
Plasmid construction and
transfection
Short hairpin RNA (shRNA) targeting human CDCA5 was
designed and cloned into the lentivirus expression vector, pLKO.1
(Addgene Plasmid 8453). shRNA scramble (Addgene Plasmid 162011) was
used as the lentiviral negative control vector. The target
sequences for CDCA5 were designed as follows: shCDCA5-1 (forward,
5′-CCG GCC AAA GTA CCA TAG CCA GTT TCT CGA GAA ACT GGC TAT GGT ACT
TTG GTT TTT G-3′ and reverse, 5′-AAT TCA AAA ACC AAA GTA CCA TAG
CCA GTT TCT CGA GAA ACT GGC TAT GGT ACT TTG G-3′) and shCDCA5-2
(forward, 5′-CCG GGA GCA GTT TGA TCT CCT GGT TCT CGA GAA CCA GGA
GAT CAA ACT GCT CTT TTT G-3′ and reverse, 5′-AAT TCA AAA AGA GCA
GTT TGA TCT CCT GGT TCT CGA GAA CCA GGA GAT CAA ACT GCT C-3′). All
the recombinant plasmids were verified by DNA sequencing. For
recombinant lentivirus production, 293T packaging cells were
transfected by using the calcium phosphate reagent (CTK001,
Macgene, China) according to manufacturer's instructions with 6
µg packaging DNA, 4.5 µg packaging plasmid (pSPAX2,
Addgene Plasmid 12260), and 1.5 µg envelope expressing
plasmid (VSV-G/pMD2.G, Addgene Plasmid 12259). Following
transfection for 6 h, the 293T cells were replaced with fresh
media. The upernatant was then collected after 48 h, cleared
cellular debris by centrifugation at 300 x g for 5 min, and
filtered through a 0.45-µm filter (SLHV033RB, Merck
Millipore). The filtered supernatant was collected and added
lentivirus precipitation solution (C103, Genstar) to precipitate
the virus overnight at 4°C. The viral supernatant was then
harvested by centrifugation at 10,000 x g for 20 min at 4°C. The
SN12-PM6 and 786O cells were selected for infection with CDCA5
shRNA lentivirus at an optimal multiplicity of infection (MOI) of
10. After infection for 24 h with lentivirus and 10 µg/ml
poly-brene n a 37°C incubator, the viral particles were replaced
with fresh medium and cells in which CDCA5 was knocked down were
selected in the presence of 2 µg/ml of puromycin for at
least 2 days. Western blot analysis and RT-qPCR were conducted to
determine the transfection efficiency.
Cell proliferation assay
Cell proliferation assay was performed using crystal
violet assay for determining cell viability. The 786-O and SN12-PM6
cells were seeded separately in a six-well plate. Following
transfection with lentivirus for 24 h and followed by puromycin
selection for 48 h, the cells were fixed with 4% paraformaldehyde
for 20 min and stained with 0.1% crystal violet (C0121, Beyotime
Institute of Biotechnology) for 20 min at room temperature. The
cells were then gently washed with water, and the dye was then
dissolved into acetic acid. The optical density of the collecting
solution was measured at 570 nm (OD570) using a plate reader
(ELx800, BioTek Instruments, Inc.). The mean value of three
independent experiments was calculated.
Cell migration assay
In the cell migration assay, the Boyden chamber was
used for 24-well plates. The inserts were coated with polycarbonate
Transwell membrane (Corning, Inc.) with an 8-µm pore size.
After refilling with a 500 µl high concentration medium (10%
FBS) into the 24-well plate, ~2×10⁴ cells were added to
the compartments with 150 µl medium containing 1% FBS.
Following incubation for 12 h or overnight at 37°C incubator, the
cells remaining on the surface above were gently removed using a
cotton swab. The chamber with the migrating cells attached to the
bottom surface was then fixed with methanol and stained with 0.1%
crystal violet at room temperature for 20 min dye. Subsequently,
the chambers were screened, imaged and quantified in five random
fields per well under an electronic upright microscope (Eclipse
Ts2R, Nikon Corporation). All assays were performed independently
three times.
Western blot analysis
Total protein from tissues and cells were isolated
using RIPA lysis buffer containing protease inhibitor cocktail
(#5871, Cell Signaling Technology, Inc.). The BCA method was
utilized for protein quantification. The quantified protein (30
µg) was separated by 8-12% SDS/PAGE gel electrophoresis, and
then transferred onto 0.45 polyvinyli-dene fluoride membranes
(Direct-Q, MilliporeSigma). After blocking the membranes with 5%
non-fat milk for 1 h at room temperature, they were incubated with
the respective primary antibodies overnight at 4°C. The primary
antibodies used were as follows: Anti-CDCA5 (1:2,000, cat. no.
ab192237, Abcam), β-tubulin (1:3,000, cat. no. BE0025, Easy Bio,
Inc.), Akt (11E7, 1:2,000, cat. no. 4685S, Cell Signaling
Technology, Inc.), phosphate Akt (Ser473, 1:2,000, cat. no. 4060S,
Cell Signaling Technology, Inc.), Stat3 (D3Z2G, 1:2,000, cat. no.
12640S, Cell Signaling Technology, Inc.), phosphorylated (p)-Stat3
(Tyr705, 1:2,000, cat. no. 9145S, Cell Signaling Technology, Inc.),
NF-κB (1:1,000, cat. no. BE3154, Easy Bio, Inc.), p-NF-κB (1:2,000,
cat. no. 3033S, Cell Signaling Technology, Inc.), mTOR (1:5,000,
cat. no. 66888-1-Ig, ProteinTech Group, Inc.), p-mTOR (Ser2448,
1:2,000, cat. no. 5536, Cell Signaling Technology, Inc.), p-γ-H2A
histone family member X (γ-H2AX; Ser139, 1:1,000, cat. no. 9718T,
Cell Signaling Technology, Inc.), breast cancer type 1 (BRCA1;
1:1,000, cat. no. 14823S, Cell Signaling Technology, Inc.), p-BRCA1
(Ser1524, 1:1,000, cat. no. 9009, Cell Signaling Technology, Inc.),
cyclin B1 (1:1,000, cat. no. 55004-1-AP, ProteinTech Group, Inc.),
poly(ADP-ribose) polymerase (PARP; 46D11, 1:1,000, cat. no. 9532,
Cell Signaling Technology, Inc.), Bcl-2 (Ser2448, 1:1,000, cat. no.
12789-1-AP, ProteinTech Group, Inc.). The membranes were then
incubated with horseradish peroxidase (HRP)-conjugated secondary
antibodies diluted in antibody dilution buffer (A1810, Solarbio)
for 1 h at room temperature and visualized using the ECL system
(Thermo Fisher Scientific, Inc.). The secondary antibodies used
were as follows: Anti-rabbit IgG HRP-linked antibody (1:5,000, cat.
no. 7074, Cell Signaling Technology, Inc.) and anti-mouse IgG
HRP-linked antibody (1:5,000, cat. no. 7076, Cell Signaling
Technology, Inc.). The bands were quantified using the Tanon Gel
Image System (Tanon-5200, Biotanon, Shanghai, China).
Reverse transcription-quantitative
polymerase chain reaction (RT-qPCR)
The cells and tissues were lysed using
TRIzol® reagent (Invitrogen; Thermo Fisher Scientific,
Inc.). Total RNA was extracted using chloroform extraction, as well
as isopropanol precipitation. Reverse transcription was then
conducted using a cDNA synthesis kit (E6560S, New England Biolabs)
at 42°C for 15 min. Subsequent quantitative polymerase chain
reaction (qPCR) analyses for each cDNA genes were quantified under
specific conditions as follows: The qPCR program consisted of
pre-denaturation at 94°C for 30 sec, followed by 40 amplification
cycles of denaturation (94°C for 5 sec), annealing (50°C for 15
sec) and extension (72°C for 10 sec). The reactions were performed
on an ABI 7500 Fast Real-Time PCR System (Applied Biosystems;
Thermo Fisher Scientific, Inc.). Homo sapiens peptidylprolyl
isomerase A (PPIA) was applied as an internal reference gene. The
validated primers used were as follows: CDCA5 forward, 5′-GAG GTC
CCA GCG GAA ATCA G-3′ and reverse, 5′-TCT TTA AGA CGA TGG GCT TTC
TG-3′; PPIA forward, 5′-GTG TTC TTC GAC ATT GCC GTC-3′ and reverse,
5′-TGC ACG ATC AGG GGT AAA CA-3′. The data were calculated using
the 2−ΔΔCq method (18).
Flow cytometry
To detect the cell cycle, the 786-O and SN12-PM6
cells transfected with lentivirus for 24 h followed by puromycin
treatment for 48 h, were collected and fixed in cold 95% ethanol
for 3 h at 4°C, then washed with phosphate-buffered saline (PBS)
and treated with propidium iodide (PI) staining solution (CA1020,
Beijing Solarbio Science & Technology Co., Ltd.) for 30 min
according to the manufacturer's instructions. The analysis of cell
apoptosis was performed using the FITC Annexin V apoptosis
detection kit (CA1020, Beijing Solarbio Science & Technology
Co., Ltd.) according to the manufacturer's instructions. A BD
FACSCalibur (BD Biosciences) flow cytometer was used to analyze
percentage of the cells in each cell cycle phase and apoptosis.
Tissue microarray (TMA) and
immunohistochemistry (IHC)
TMAs containing 137 paired formalin-fixed
paraffin-embedded (FFPE) ccRCC and adjacent normal tissue samples
were constructed. IHC for CDCA5 expression in the TMAs was carried
out using a standard protocol (19). The tissue microarray was
constructed manually and a 2-mm cylindrical core sample from tissue
donor blocks (for cohort please see Table I) was placed in a prepared 6×10
array of recipient wax blocks with a 1.5-mm hole spacing. The
recipient wax block was arranged with a maximum of 30 matched pairs
of tumor and adjacent tumor tissues. Paraffin-embedded
5-µm-thick tissue sections were deparaffinized by the
following steps: 10 min in xylol twice, 5 min in 100% ethanol
twice, and 90, 80, and 70% ethanol for 5 min each. Then those
sections were placed in 10 mM citric acid buffer for antigen
retrieval and boiled it using a microwave at 100°C for 15 min. The
sides were then incubated with rabbit anti-CDCA5 antibody overnight
at a dilution of 1:200 at 4°C, followed by incubation with
secondary anti-rabbit antibody (PV-9001, OriGene Technologies,
Inc.) at room temperature. Each TMA spot and IHC slides were
photographed using TissueFAXS imaging system (TissueGnostics GmbH)
and evaluated by its intensity of staining: 0 (no staining,
negative), 1 (<10% of malignant cells staining, weak positive),
2 (10-50% of malignant cells staining, moderate positive), or 3
(>50% of malignant cells staining, strong positive).
Furthermore, IHC was performed on the
paraffin-embedded tumors harvested from orthotopic xenografts in
nude mice to investigate the expression of Ki67, caspase-3, and
γ-H2AX in the shCDCA5 group and control group. IHC was conducted by
the steps and conditions mentioned above. The primary antibody and
dilution for incubation were Ki67 (D3B5, 1:400, cat. no. 12202,
Cell Signaling Technology, Inc.), caspase-3 (1:1,000, cat. no.
9662, Cell Signaling Technology, Inc.) and γ-H2AX (Ser139, 1:480,
cat. no. 9718T, Cell Signaling Technology, Inc.).
Orthotopic RCC tumorigenicity in nude
mice
The scientific use of orthotopic animal models was
conducted between December, 2020 to January, 2021. Due to the
control policy of the coronavirus disease 2019, the animal center
at our institution was temporarily suspended and the athors could
only resort to other authorized animal centers to perform the
animal experiments. The use of animals was approved (approval no.
ACU20-245) by the Institutional Animal Care and Use Committee
(IACUC) of Cyagen Biosciences (Jiangsu, China). The study was
performed under the supervision and inspection of the committee and
the Cyagen Research Centre for model organisms. BALB/c nude
immunodeficient male mice (4 to 6 weeks old) were obtained from
Vital River Laboratory Animal Technology Co. Ltd. These BALB/c mice
were housed under specific-pathogen-free conditions at a room
temperature of 23±2°C and 50-60% humidity under a 12/12-h
light/dark cycle with food and water provided ad libitum. A
total of 12 BALB/c nude mice were included and randomly divided
into the shCDCA5 group and control group. Prepared cells
(3×10⁵) subjected to stable CDCA5 knockdown or those
transfected with the empty vector were suspended in PBS with
Matrigel (Corning, Inc.). The mice were anesthetized by an
intraperitoneal injection of sodium pentobarbital (30 mg/kg) and
the cells were then orthotopically implanted into the right
subrenal capsule (n=6 mice in each group). A total of 8 mice were
eventually included in the analysis as the other 4 mice were
subjected to euthanasia at an early stage due to surgery-related
adverse complications and a body weight loss of >20%. Euthanasia
was performed using an intravascular administration of an overdose
of sodium pentobarbital (>100 mg/kg) followed by cervical
dislocation. Euthanasia was confirmed by the loss of vital signs,
such as respiration and heartbeat cessation. Diagnostic
bioluminescence imaging, as well as animal weight data were
collected on a weekly basis to monitor tumor development during the
experiment. For dynamic bioluminescence imaging, D-luciferin
potassium salt (2591-17-5, ApexBio) was prepared at a concentration
of 15 mg/ml. The mice were then anesthetized and intraperitoneally
injected with D-luciferin (10 µl/g). After the injection for
10 min, these mice were placed into the imaging chamber to
quantitatively assess tumor burden per week (days 7, 14 and 21).
The D-luciferase intensity was evaluated using a bioluminescent
imaging system (NightOWL II LB 983, Berthold). As regards the total
burden of tumor expansion and distress on animal welfare, the mice
were euthanized by overdose of sodium pentobarbital (>100 mg/kg)
followed by cervical dislocation at the third week, which was the
earliest stage at which a scientific decision could be made. Tumor
volume calculations were obtained using the following formula:
V=1/2 x length x width2, where 'length' represents the
longest dimension and 'width' represents the widest dimension
(20). In all harvested tumors,
the maximum tumor volume was 3.83 cm3 and the maximum
tumor size was 1.40 cm.
To assess morphologic changes in orthotopic tumor
growth, hematoxylin and eosin (H&E) staining were conducted.
Hematoxylin and eosin staining kits (G1120, Beijing Solarbio
Science & Technology Co., Ltd.) were used according to
instruments. The harvested tumor from the mice were formalin-fixed,
paraffin-embedded, and cut into 5-µm-thick tissue sections.
Deparaffinization and hydration followed the same steps as IHC. The
slides were then stained at room temperature in hematoxylin for 2
min, differentiated in 1% acid alcohol for 3 sec, washed in running
water for 5 min, and then counterstained with 1% eosin for 1 min.
Followig dehydration and mounting, the slides were photographed
using the TissueFAXS imaging system (TissueGnostics GmbH).
Immunofluorescence (IF) analysis with a
confocal micro-scope
The 786-O and SN12-PM6 cells were each cultured in
three wells of a 24-well plate with coverslips. Following
transfection with lentivirus for 24 h and screening with puromycin
for a further 48 h, the cells were fixed and then blocked in 3%
goat serum albumin-PBS. Primary antibody against γ-H2AX (1:100,
9718s, Cell Signaling Technology, Inc.) and p-histone H3 (Ser10,
1:800, cat. no. 3377, Cell Signaling Technology, Inc.) was
incubated with the cells overnight at 4°C. The cells were then
washed and incubated with Alex Fluor 594 goat anti-rabbit IgG
(1:500, A32740, Invitrogen; Thermo Fisher Scientific, Inc.) for 1 h
at room temperature. The coverslips were then placed on fluorescent
mounting medium with DAPI (ZLI-9557, OriGene Technologies, Inc.)
and incubated at room temperature. The slides were imaged using a
Leica SP5 confocal microscope (Leica Microsystems GmbH) at ×100
magnification and analyzed using software (Leica LAS AF Lite 2.6;
Leica Microsystems CMS GmbH).
Statistical analysis
Data are generally expressed as the mean ± standard
deviation (SD) from experiments independently performed at least
three times. The Wilcoxon matched-pairs signed rank test was used
to investigate differences in the relative mRNA levels between the
patient groups. The Chi-squared test was applied to analyze the
associations between CDCA5 expression levels and the patient
clinico-pathological characteristics, while the continuity
correction of the Chi-squared test was applied to variables of the
N stage and M stage. The Student's t-test was used for the
comparison between the two groups. Measurement data between three
or more groups were analyzed using one-way ANOVA followed by
Tukey's post hoc test. Overall survival (OS) analysis was performed
using Kaplan-Meier analysis and further comparisons were made using
log-rank tests. The Cox proportional hazards regression model was
applied to identify the risk factors. Statistical calculations were
performed using SPSS 23.0 software (SPSS Inc.).
Results
Clinicopathological characteristics and
upregulated CDCA5 expression indicate an aggressive status of
ccRCC
To evaluate CDCA5 expression patterns in 33 TCGA
cancer types, a comprehensive examination of TCGA mRNA database was
conducted. The boxplot comparing tumor and normal tissue CDCA5
expression revealed that CDCA5 was overexpressed in the majority of
malignancies (Fig. 1A). TCGA
online analysis revealed that CDCA5 expression was upregulated in
primary ccRCC tumors compared with adjacent normal tissue (Fig. 1B). The increased expression of
CDCA5 was positively associated with the Fuhrman grade, advanced
TNM stages and lymph node metastasis (Fig. 1C-E), indicating an expression
dependency on aggressive status in ccRCC.
Patients with a highly expression of CDCA5 had a
poorer prognosis (Fig. 2A). In
addition, a survival probability analysis was performed combining
the CDCA5 expression level and tumor grade for patients with ccRCC
(Fig. 2B). Patients with a
low/medium CDCA5 level with grade 1 tumors (Fig. 2B, upper blue line) exhibited a
tendency for an improved survival, whereas patients with a high
CDCA5 expression with grade 4 tumors had the worst OS (Fig. 2B, lower green line). Thus, the
combination of the CDCA5 expression status and tumor grade had a
strong predictive value for survival outcomes. To explore the
diagnostic value of CDCA5 in predicting prognosis, the association
between the GSVA score and clinical survival in all the 33 TCGA
cancers was estimated. It was demonstrated that CDCA5 in patients
with ccRCC with a higher GSVA score could effectively be utilized
as a hazard predictor for OS [hazard ratio (HR), 1.83; P<0.001],
progression-free survival (HR, 1.74; P<0.001) and
disease-specific survival (HR, 3.15; P<0.001) (Fig. 2C).
To investigate the malignant impact of CDCA5,
western blot analyses of cultured human ccRCC cell lines was
performed and the results revealed a higher CDCA5 expression in the
ccRCC cell lines, particularly in the 786-O and SN12-PM6 cell lines
(Fig. 3A). As regards the ccRCC
tissues, RT-qPCR was performed to quantify the mRNA expression
levels in 21 resected paired tumor and adjacent normal tissues. It
was found that CDCA5 was overexpressed in ccRCC samples (Fig. 3B).
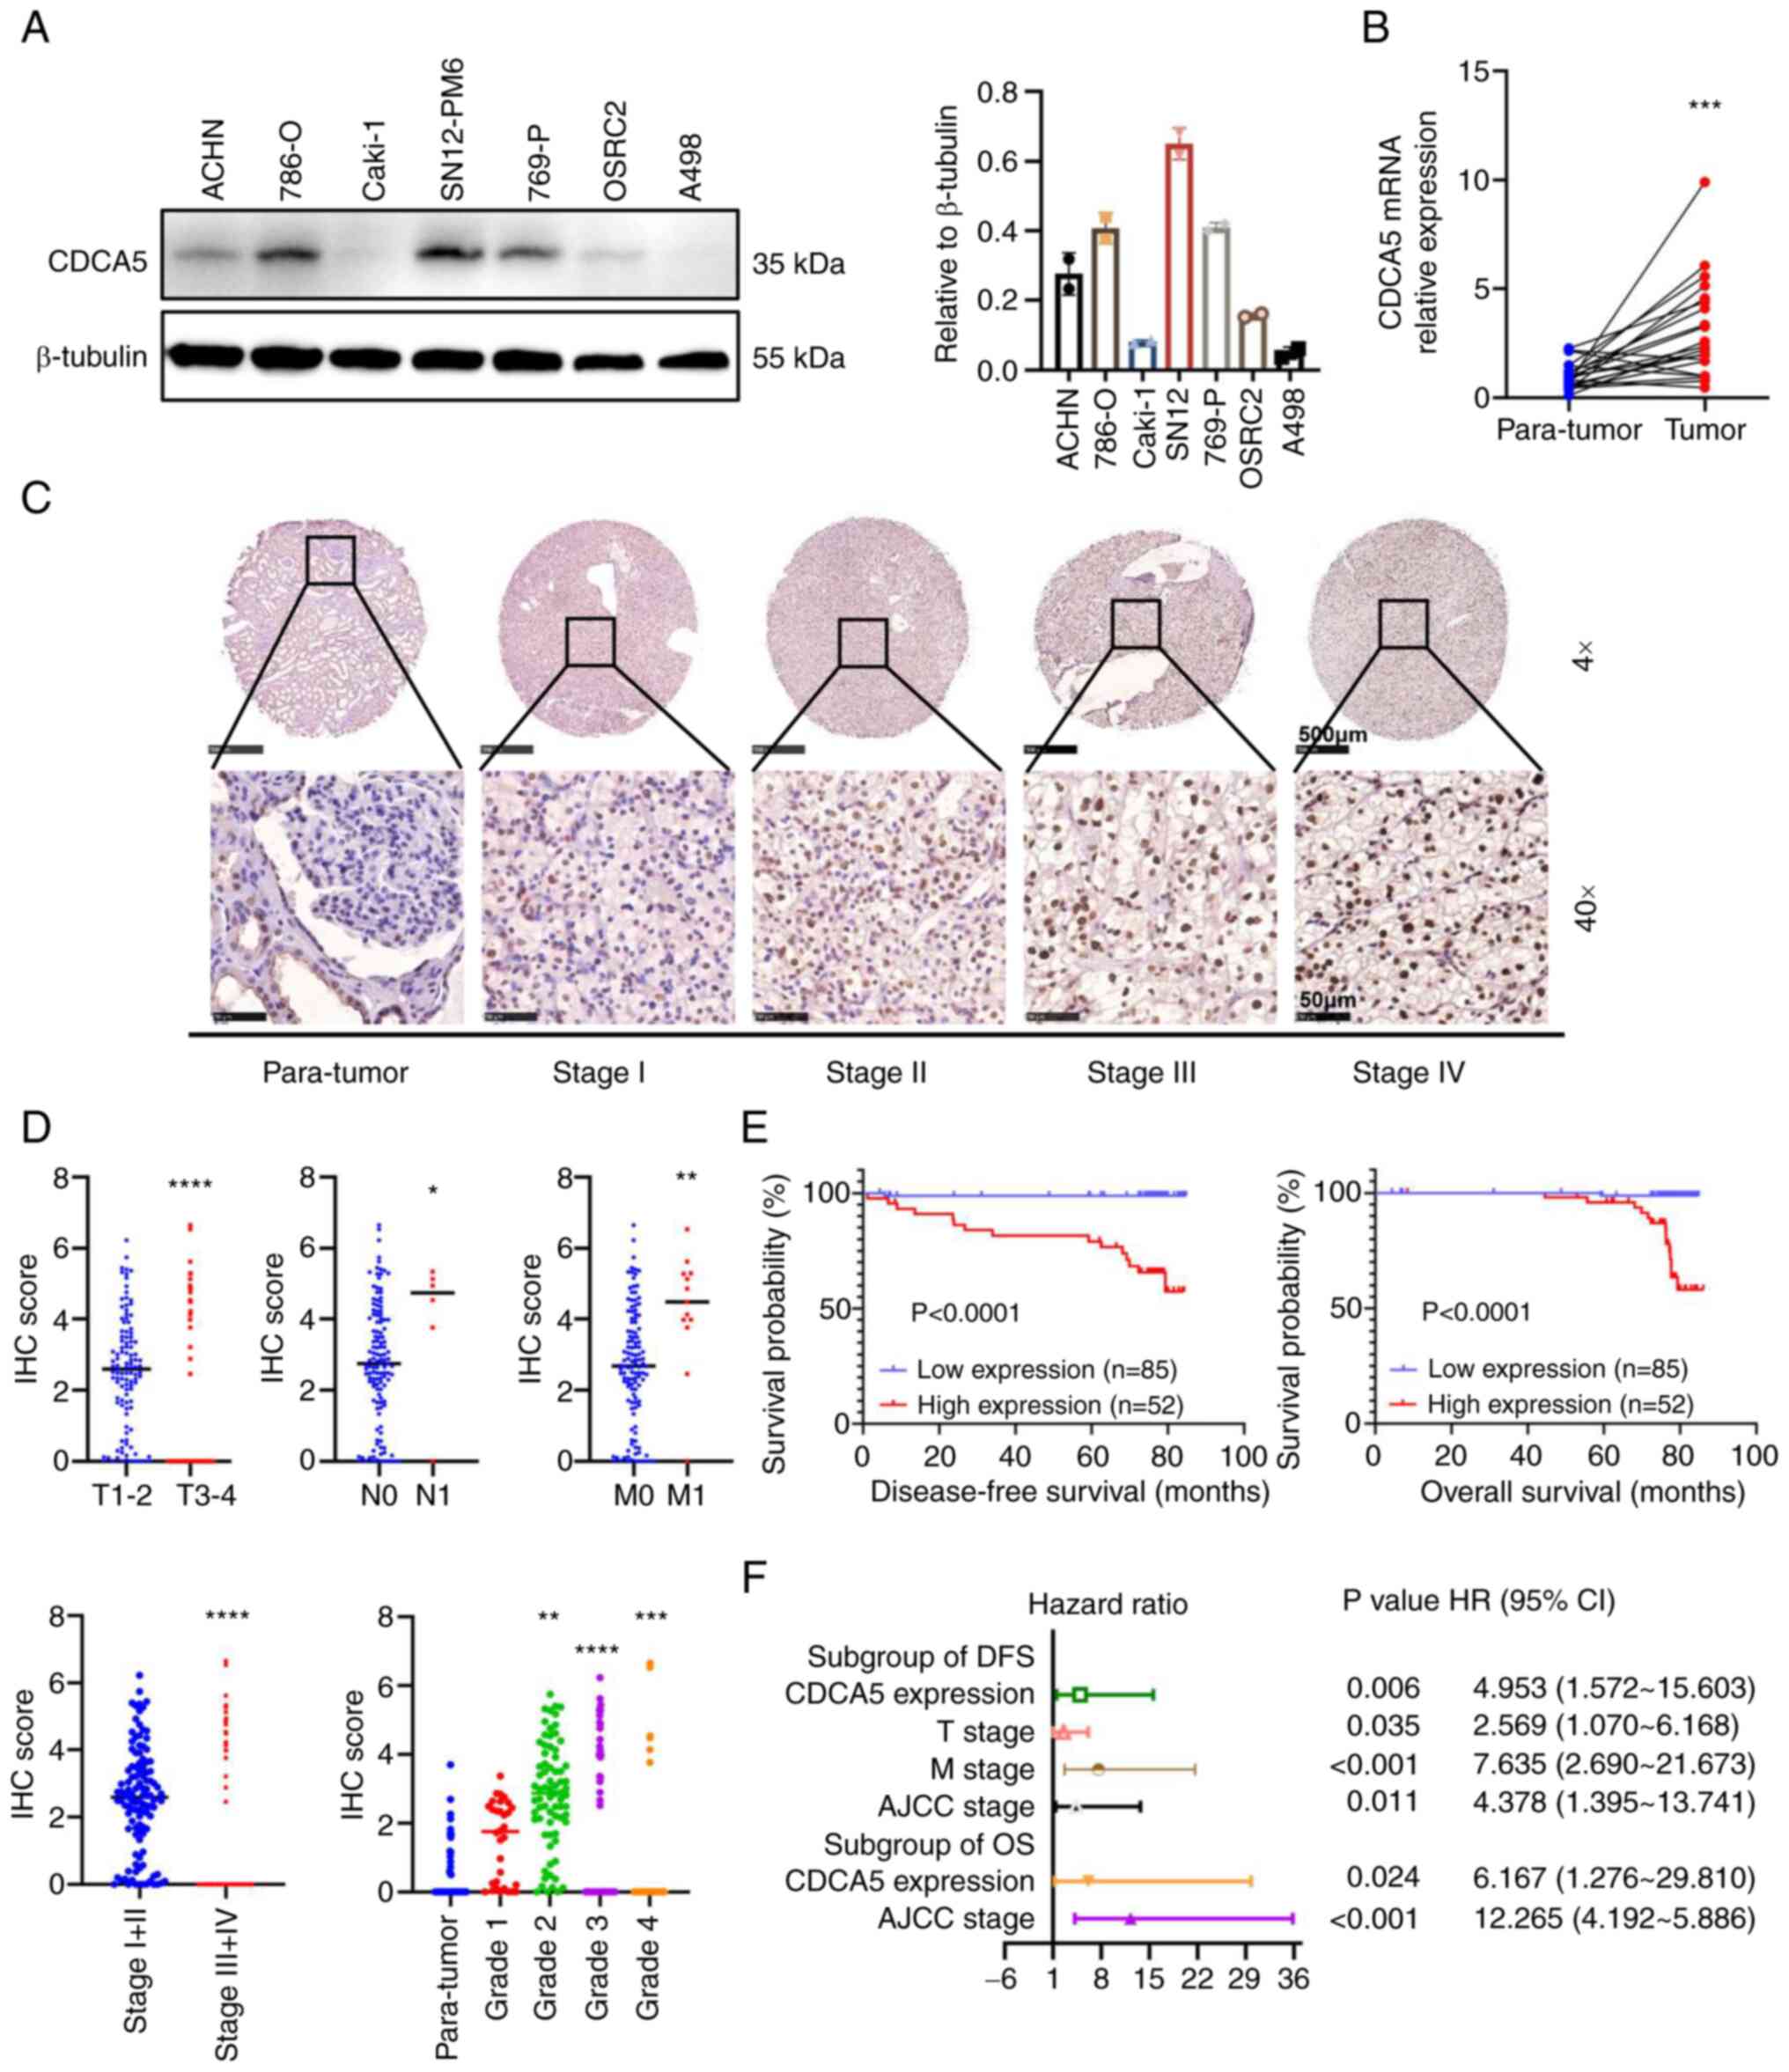 | Figure 3Relative CDCA5 expression in renal
cancer cell lines and tissues with its survival significance. (A)
Protein expression of CDCA5 in renal cancer cell lines examined
using western blot analysis. (B) Relative mRNA expression of CDCA5
in 21 pairs of ccRCC tissues and adjacent tissues examined using
reverse transcription-quantitative PCR. (C) Representative tissue
microarray stained for CDCA5 in 137 patients with ccRCC. The
immunoreactivity of CDCA5 expression in ccRCC and normal tissues
was analyzed based on different cancer stages. Upper panels:
Magnification, ×4; scale bar, 500 µm; lower panels:
Magnification ×40; scale bar, 50 µm. (D) IHC score of CDCA5
expression was significantly higher in ccRCC tissues with an
advanced T stage, positive lymphatic metastasis, distant
metastasis, higher TNM stage, and elevated pathological grade. The
IHC score was quantified according to the integrated optical
density per filed. (E) Kaplan-Meier survival analysis indicated a
poor OS and DFS of patients with ccRCC with a high CDCA5
expression. (F) Forest plot of hazard ratios for DFS and OS.
Multivariate cox regression model of prognostic factors is
displayed with 95% CI values. *P<0.05,
**P<0.01, ***P<0.001 and
****P<0.0001 vs. paratumor tissue. CDCA5, cell
division cycle-associated 5; ccRCC, clear cell renal cell
carcinoma; IHC, immunohistochemistry; DFS, disease-free survival;
OS, overall survival. |
Furthermore, the protein expression characteristics
of four different tumor stages were validated using another
paraffin-embedded paired tissues from patients with 137 ccRCC from
Chinese PLA General Hospital using IHC in a TMA (Fig. 3C). The IHC score of CDCA5
expression quantified by integral optic density (IOD) values
demonstrated that CDCA5 staining was intensified along with an
elevated T stage, lymph node metastasis, distant metastasis, an
elevated AJCC stage and an advanced WHO/ISUP grade in ccRCC tissues
(Fig. 3D). Accordingly, a strong
association between a high CDCA5 expression and the clinical
characteristics of patients with ccRCC was observed for
characteristics such as primary tumor size (P=0.006), distant
metastasis (P<0.001), AJCC stages (P<0.001) and WHO/ISUP
grade (P<0.001) (Table I).
These data were in accordance with those from TCGA dataset
analysis.
Moreover, with a follow-up time of 76.933±0.372
months, Kaplan-Meier survival analysis revealed that a high
expression of CDCA5 was associated with a poorer 5-year
disease-free survival (DFS) and a worse OS (Fig. 3E). Multivariate cox regression
stepwise analysis (Table SI)
(the significant factors are displayed as a forest plot; Fig. 3F), confirmed that a high CDCA5
expression remained an independent risk factor both for both OS
[P=0.024; HR, 6.167; 95% confidence interval (CI), 1.276-29.810]
and DFS (P=0.006; HR, 4.953; 95% CI, 1.572-15.603). The AJCC stage
was also a hazardous factor for both DFS (P=0.011; HR, 4.378; 95%
CI, 1.395-13.741) and OS (P<0.001; HR, 12.265; 95% CI,
4.192-5.886).
Collectively, these results confirm that CDCA5
expression and AJCC stage may serve as malignant prognostic factors
for the OS and DFS of patients with ccRCC.
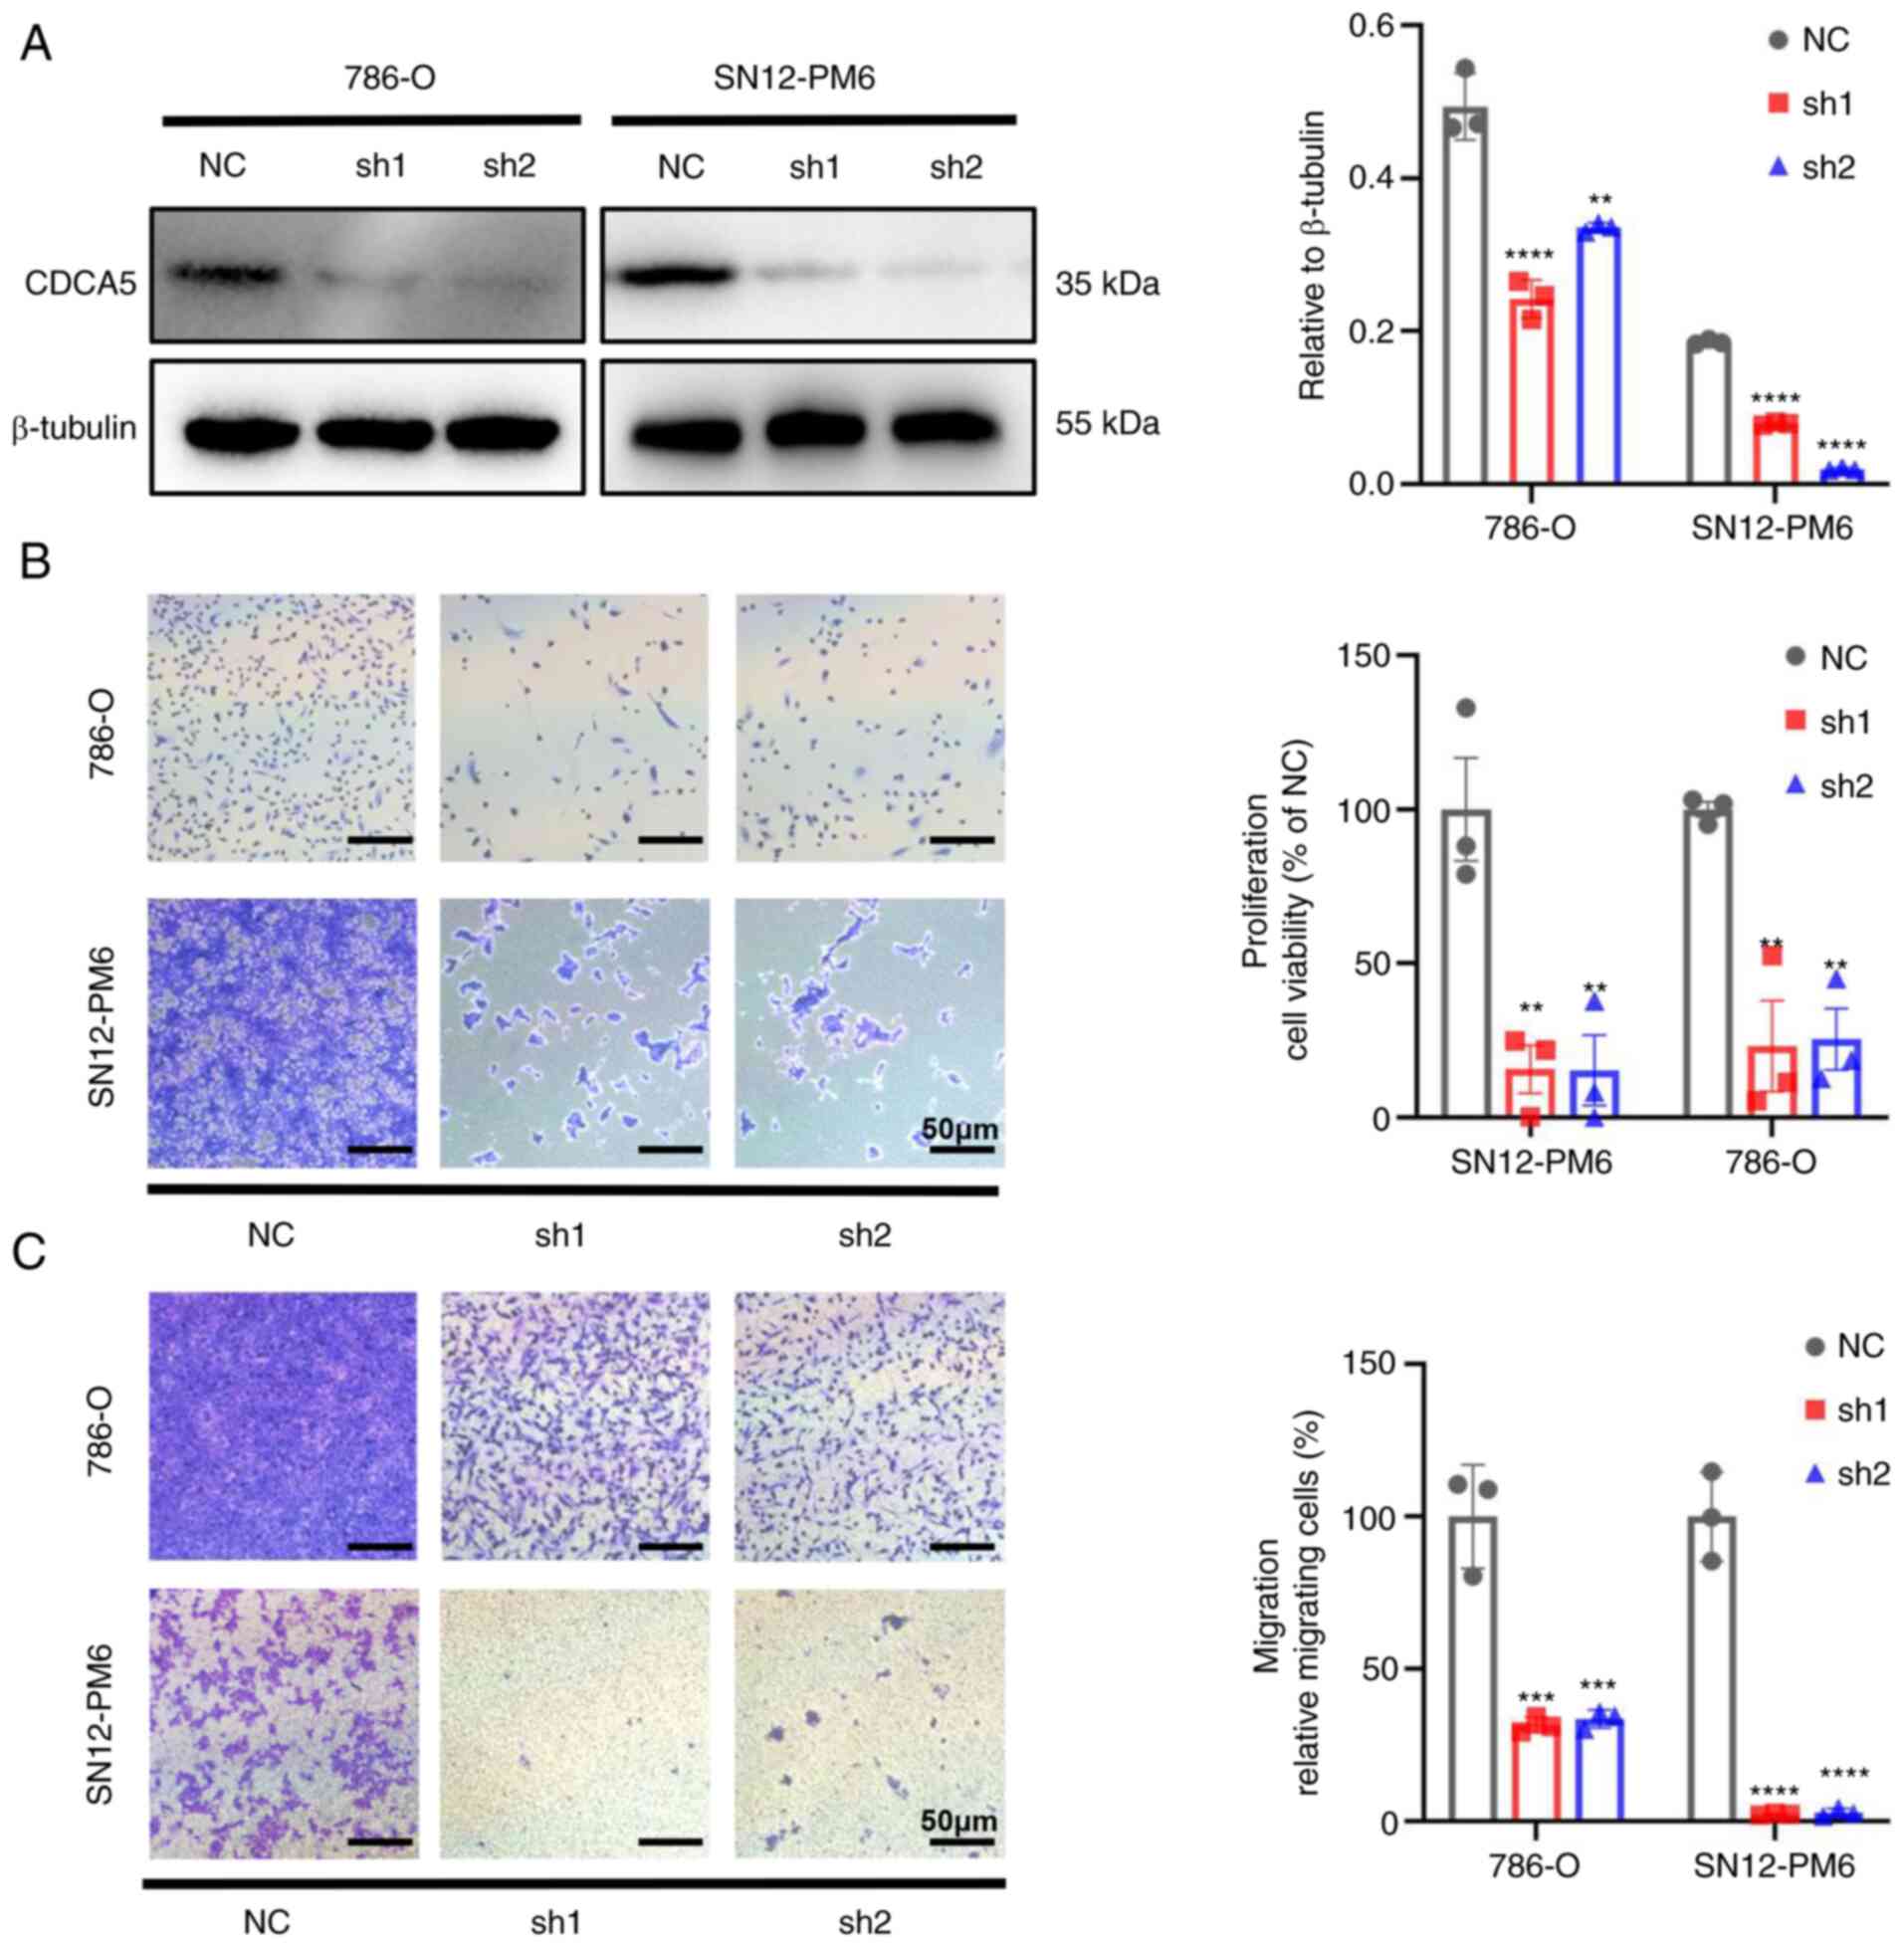
CDCA5 knockdown inhibits the
proliferation and migration of ccRCC cells
Since TCGA analysis indicated that the expression of
CDCA5 was associated with ccRCC progression and nodal metastasis,
the present study then investigated the biological function of
CDCA5 in ccRCC cell lines. After transfecting shRNA targeting CDCA5
and negative control shRNA into the SN12-PM6 and 786-O cells.
Western blot analyses confirmed the decreased protein expression of
CDCA5 in SN12-PM6 and 786-O cells transfected with shRNA lentivirus
(Fig. 4A).
The knockdown of CDCA5 significantly hindered cell
proliferation. Cell viability was markedly decreased in both cell
lines, as shown using crystal violet assay (P<0.01; Fig. 4B). As CDCA5 significantly affected
ccRCC cell proliferation, its effects on migration were thus
evaluated. Transwell assays demonstrated that the knockdown of
CDCA5 impaired the cell migratory ability in vitro compared
with the control group (Fig. 4C).
Thus, CDCA5 is vital to maintain ccRCC cell proliferative and
migratory ability.
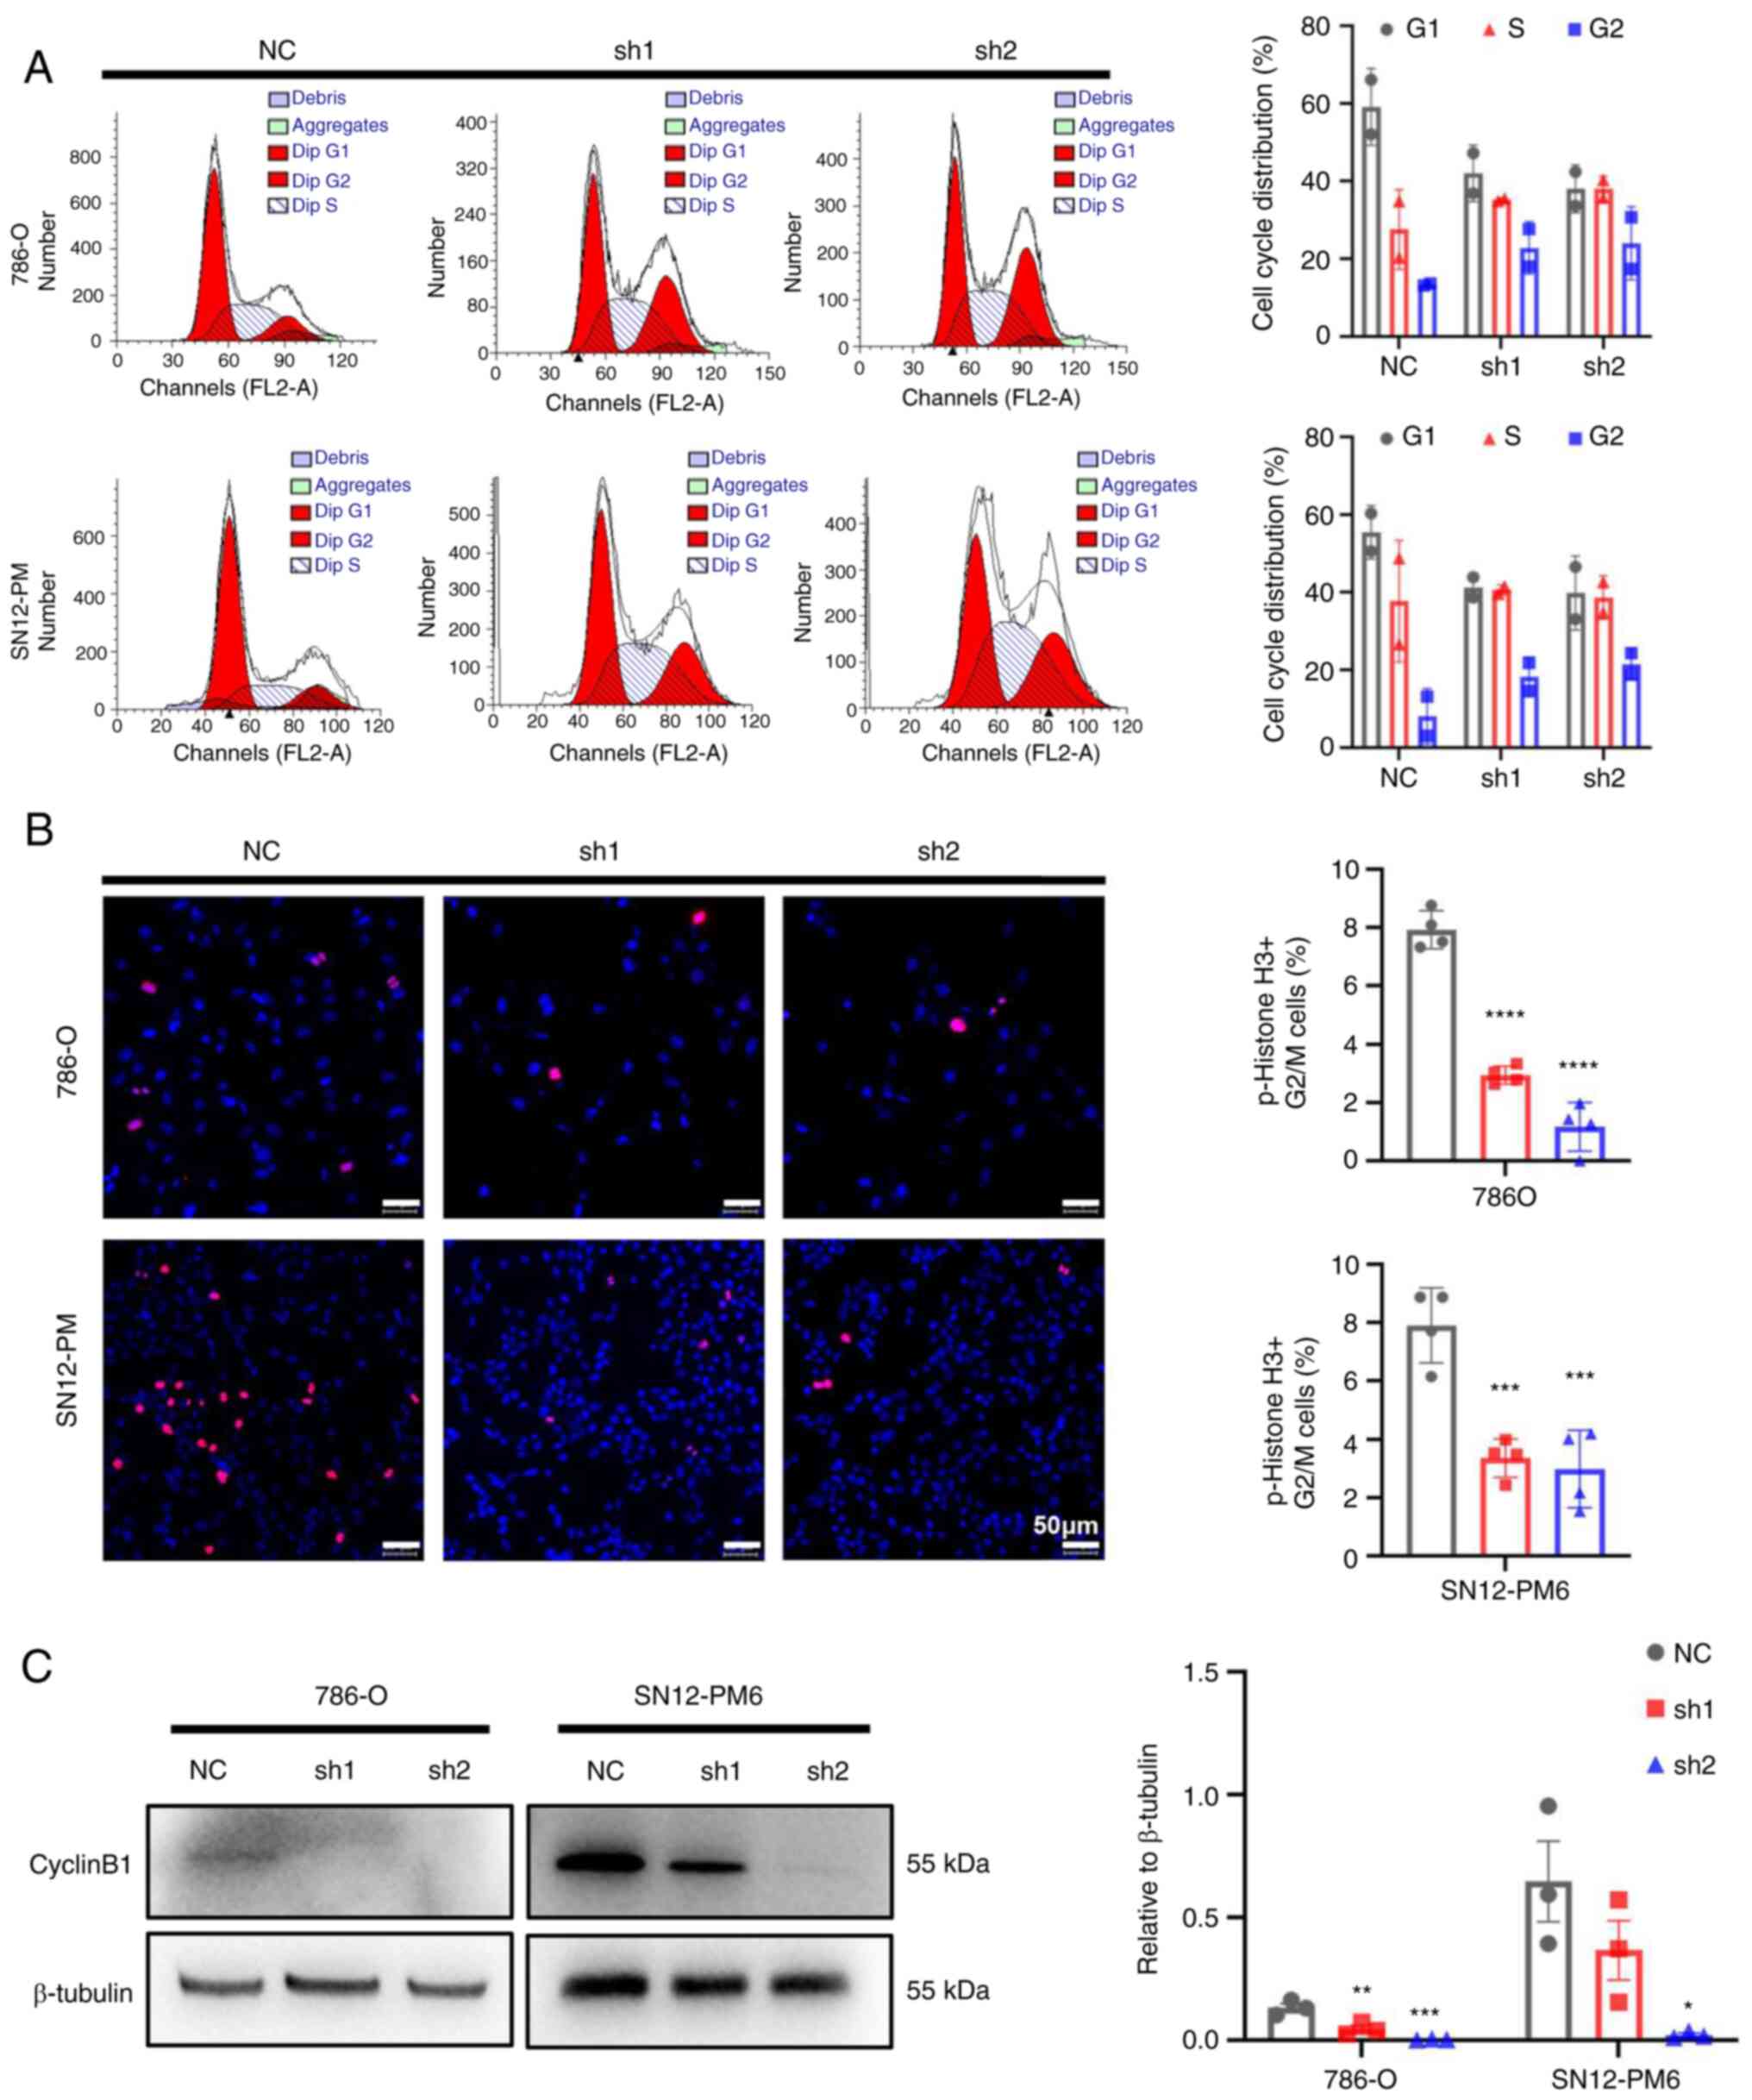
CDCA5 knockdown induces cell cycle arrest
in the G2/M phase
To further investigate the underlying mechanisms of
the inhibitory effects of CDCA5 on cell proliferation, cell cycle
analysis was performed to the effects of CDCA5 knockdown on the
cell cycle. Flow cytometric analyses revealed that CDCA5 knockdown
decreased cell distribution in the G0/G1 phase, while increasing
the cell proportion in the G2/M phase in both the SN12-PM6 and
786-O cell lines (P<0.05; Fig.
5A). Moreover, the IF analysis of p-histone 3 demonstrated a
decreased number of positive cells in the shCDCA5 groups compared
with the increasing positive ratio in the NC group (Fig. 5B). Moreover, a decreased cyclin B1
expression were observed using western blot analysis in both the
786-O and SN12-PM6 cell lines following the knockdown of CDCA5
(Fig. 5C), which suspended cell
cycle progression into mitosis. As a result, this G2/M arrest
eventually inhibited tumor cell proliferation. These data confirm
that CDCA5 has a regulatory function in the cell cycle in the G2/M
checkpoint.
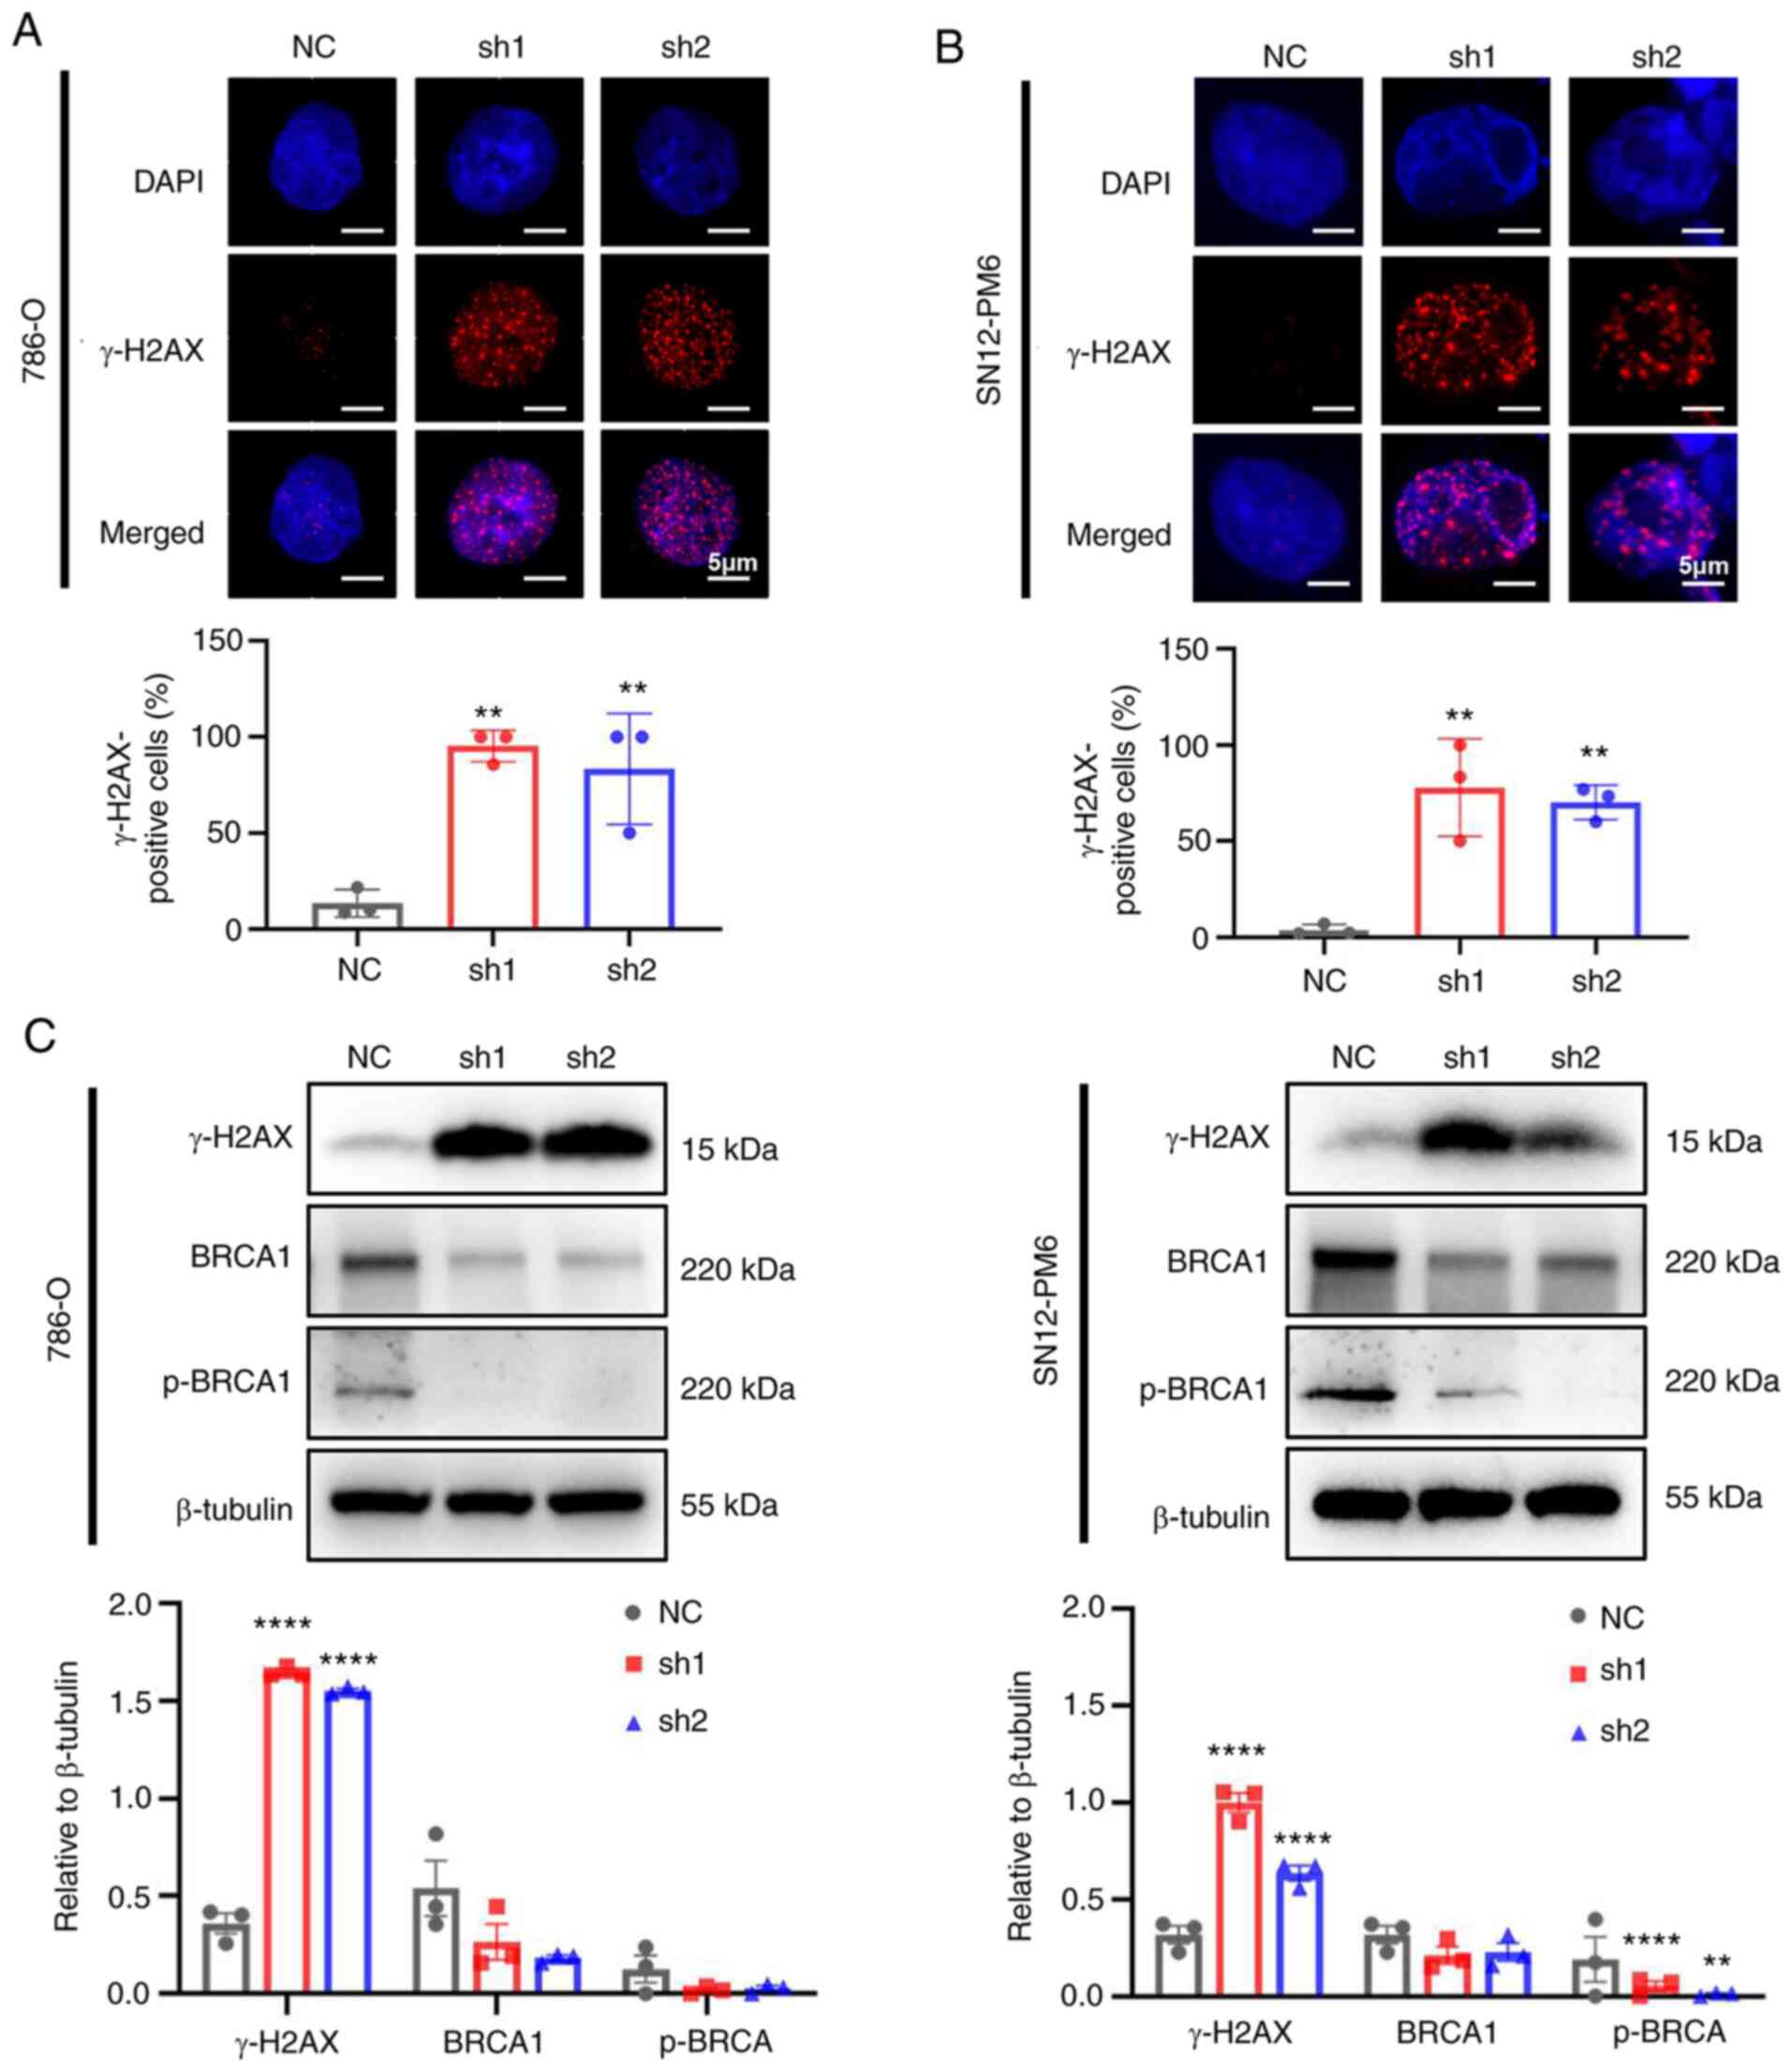
CDCA5 knockdown improves DDR
As CDCA5 is required for sister chromatid cohesin to
maintain genome stability (6),
the present study further validated whether the knockdown of CDCA5
could trigger DDR. The phosphorylation of H2AX, which is a
biomarker of double strand breaks, was found to increase the
numbers of foci formation in IF following the knockdown of CDCA5 in
the 786-O (Fig. 6A) and SN12-PM6
(Fig. 6B) cells. Furthermore, a
large proportion of γ-H2AX-positive cells in both cell lines was
found in the shCDCA5 groups (P<0.01). The increased expression
of γ-H2AX in the cells in which CDCA5 was knocked down was also
detected using western blot analysis (Fig. 6C). Moreover, the expression of the
DNA damage repair gene, BRCA1 and p-BRCA1, was decreased following
CDCA5 knockdown, indicating the further abrogation of the ability
to repair DNA. Taken together, these findings indicate that the
knockdown of CDCA5 triggers the sequential activation of the DDR
and abrogates the repair of damaged DNA.
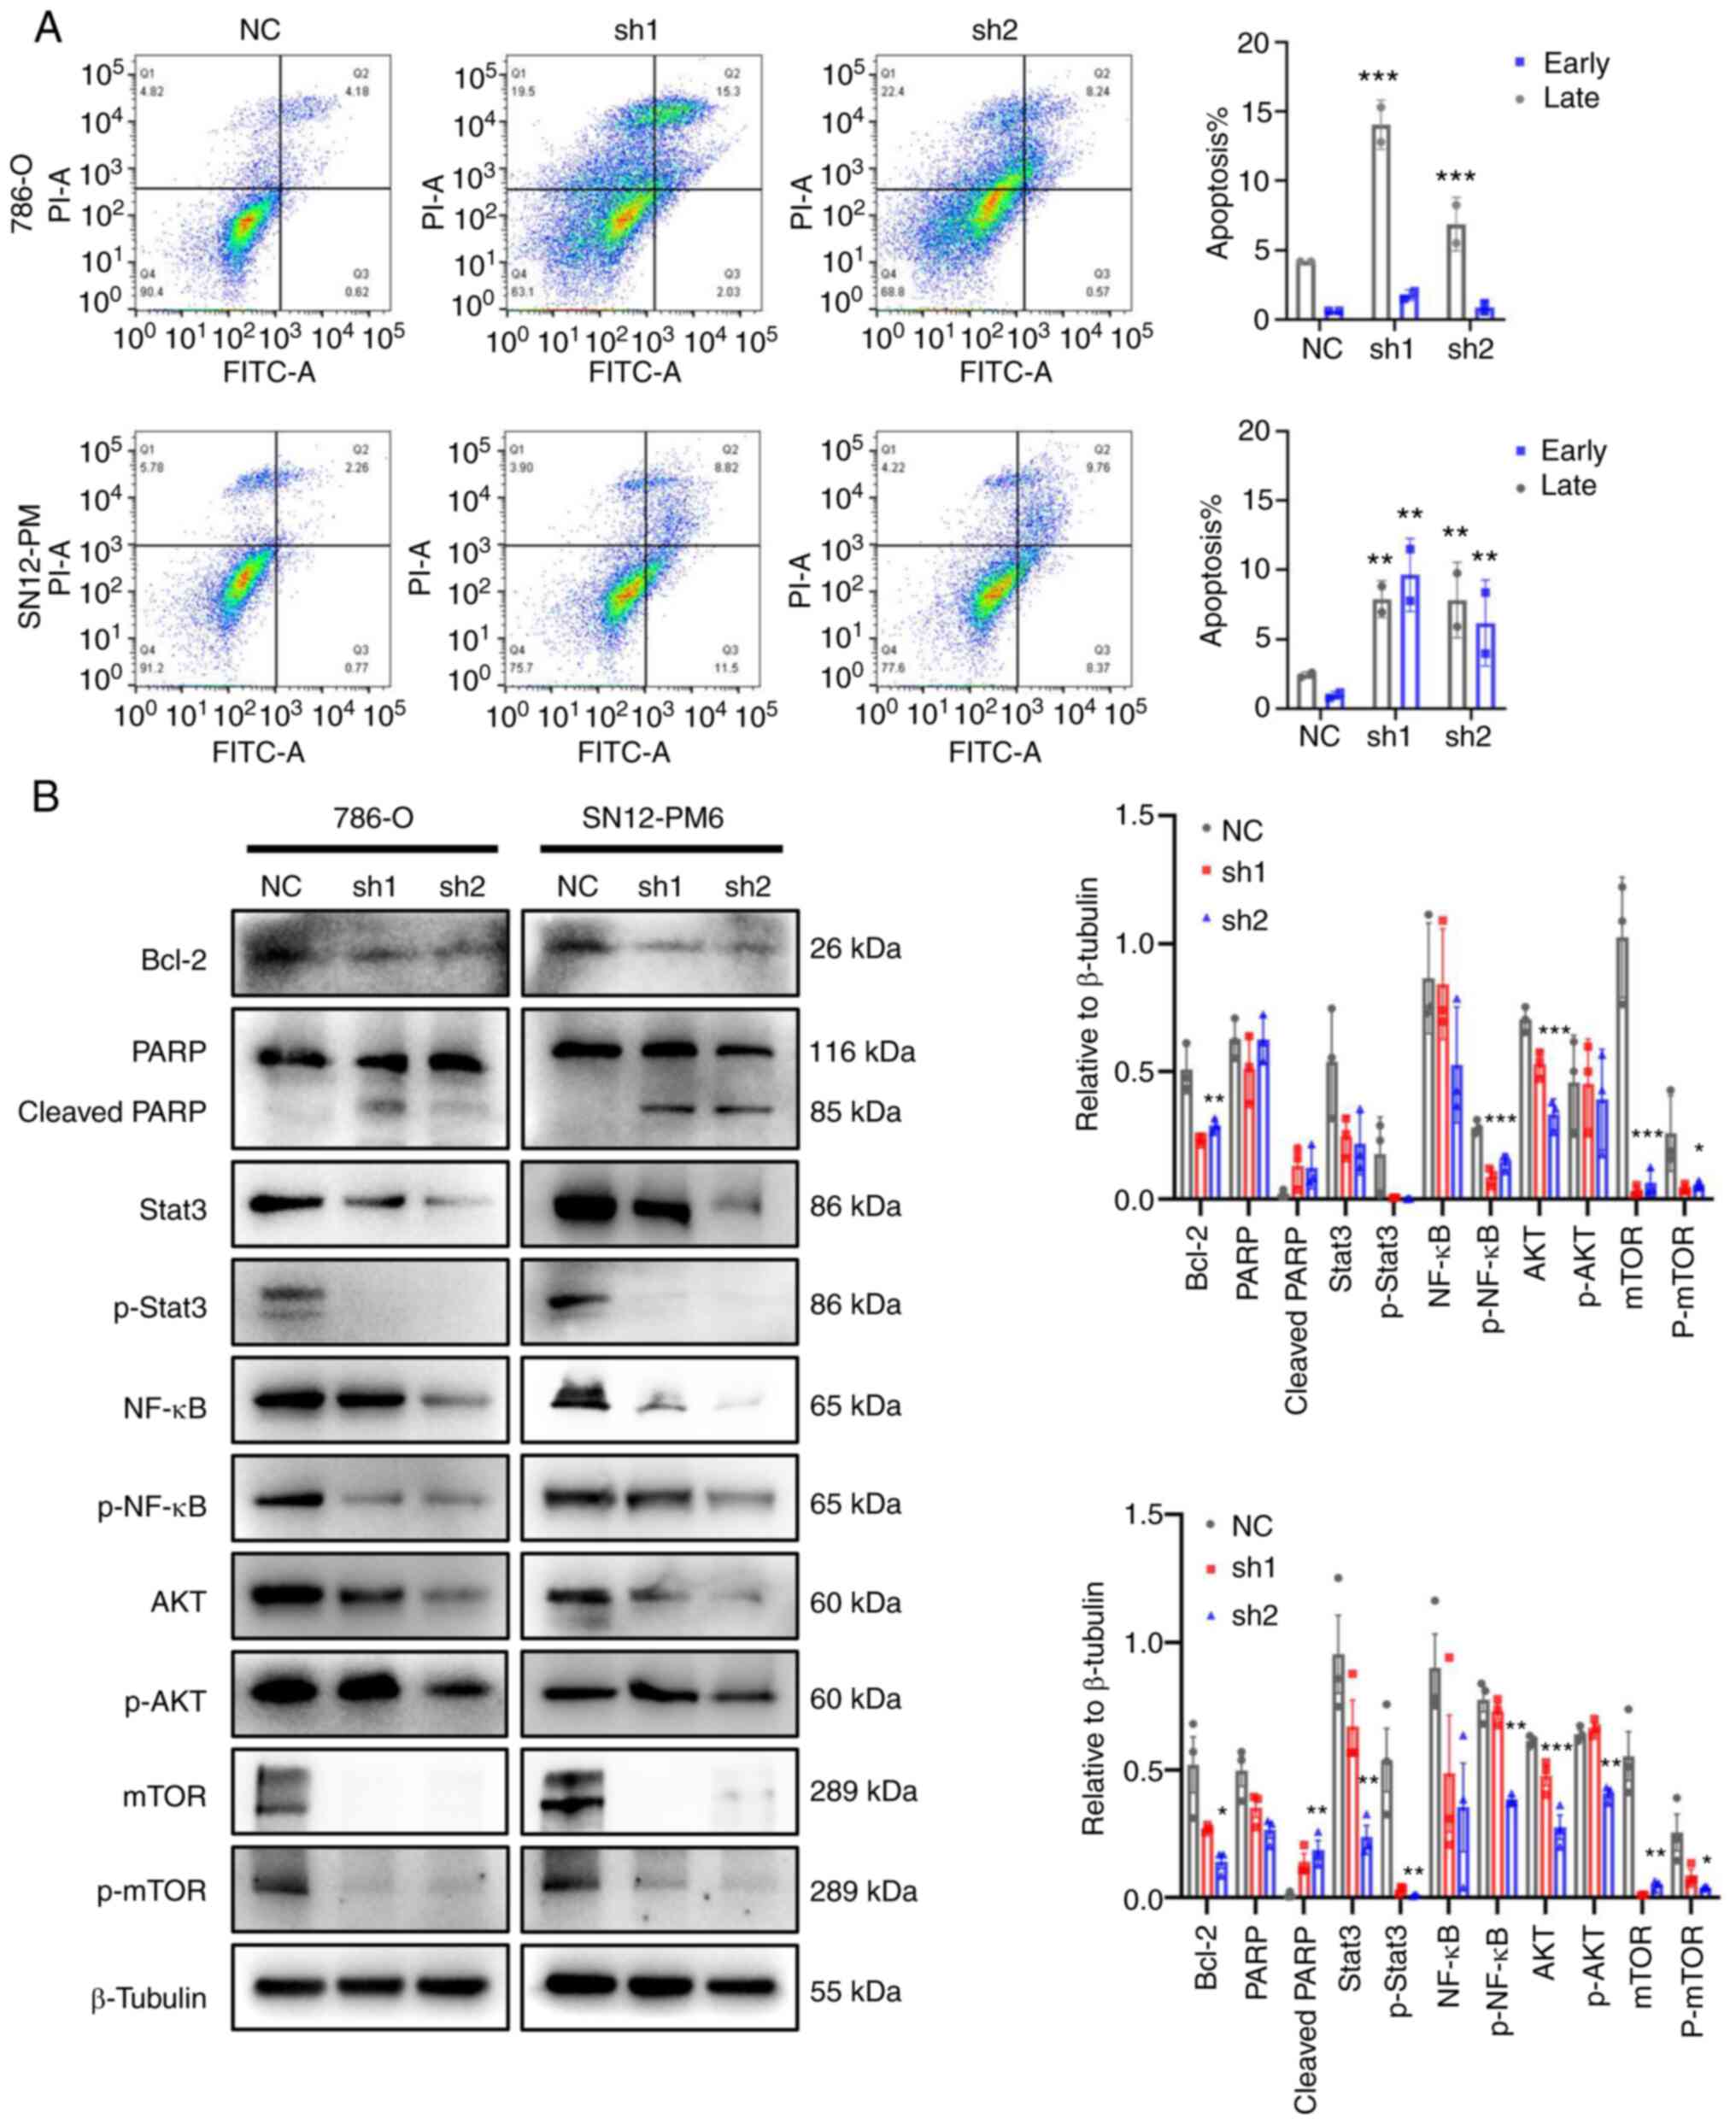
CDCA5 knockdown promotes apoptosis and
regulates ccRCC behavior via the DDR
As a response to DNA damage and cell cycle arrest,
the present study then investigated the cell fate towards
apoptosis. The effects of CDCA5 on cell apoptosis were analyzed
using flow cytometry with Annexin V-FITC staining. The results
demonstrated that CDCA5 knockdown promoted both early and late
apoptosis in the shCDCA5 groups compared with the control groups.
Late apoptosis was prominent according to the flow cytometric
analysis (P<0.001; Fig. 7A).
In the 786-O cells, the average percentage of apoptotic cells
(early and late apoptosis) in the shCDCA5-1 group was increased
3.3-fold, while this was increased 1.6-fold in the shCDCA5-2 group.
In the SN12-PM6 cells, the total number of apoptotic cells in the
shCDCA5-1 group was increased 5.2-fold, while this was increased
4.1-fold in the shCDCA5-2 group, compared with the control
(Fig. 7A).
Consistently, the levels of cell apoptosis-related
proteins levels were examined using western blot analysis. The
knockdown of CDCA5 notably decreased the expression of the
anti-apoptotic protein, Bcl-2. The levels of downstream proteins,
such as PARP were activated; the expression of cleaved PARP was
increased following CDCA5 knockdown (Fig. 7B).
Tumor-promoting inflammation is an enabling
characteristic, and damaged DNA can contribute to the crosstalk
between inflammation and the immune response in cancer (21,22). In the present study, to
investigate the potential inflammation pathways triggered by DDR
following the knockdown of CDCA5, western blot analysis was
performed. The prominent change observed was in the levels of the
transcription factors, Stata3 and NF-κB, related to the
inflammatory response. It was observed that the Stat3, p-Stat3,
NF-κB and p-NF-κB expression levels were decreased following CDCA5
knockdown (Fig. 7B). Moreover,
the expression of total mTOR, p-mTOR, total AKT, and p-AKT was
decreased in the cells transfected with shCDCA5-1 and shCDCA5-2
(Fig. 7B). The inhibition of the
AKT/mTOR signaling pathway can suppress the inflammatory response.
Taken together, the knockdown of CDCA5 predominantly activated the
DDR, promoted apoptosis and decreased the expression of STAT3,
NF-κB, mTOR and AKT to reduce tumor malignancy.
CDCA5 knockdown suppresses tumorigeneses
in an orthotopic model of RCC
To illuminate the function of CDCA5 in tumorgenicity
in vivo, luciferase-expressing SN12-PM6 cells transfected
with shCDCA5 or NC lentivirus were prepared and injected
orthotopically into the right kidneys of nude mice. Intratumoral
green fluorescent protein (GFP) fluorescence was detected following
the administration of D-luciferin at 4 weeks in the xenograft
model. A strong luciferase signal was obtained in the mice
implanted with cells transfected with the control vector, whereas a
reduced signal intensity was observed in the shCDCA5 group
(Fig. 8A). Moreover, SN12-PM6
xenografts transduced with shCDCA5 exhibited a significantly
decreased tumor growth, with a decreased tumor volume and weight
(Fig. 8B).
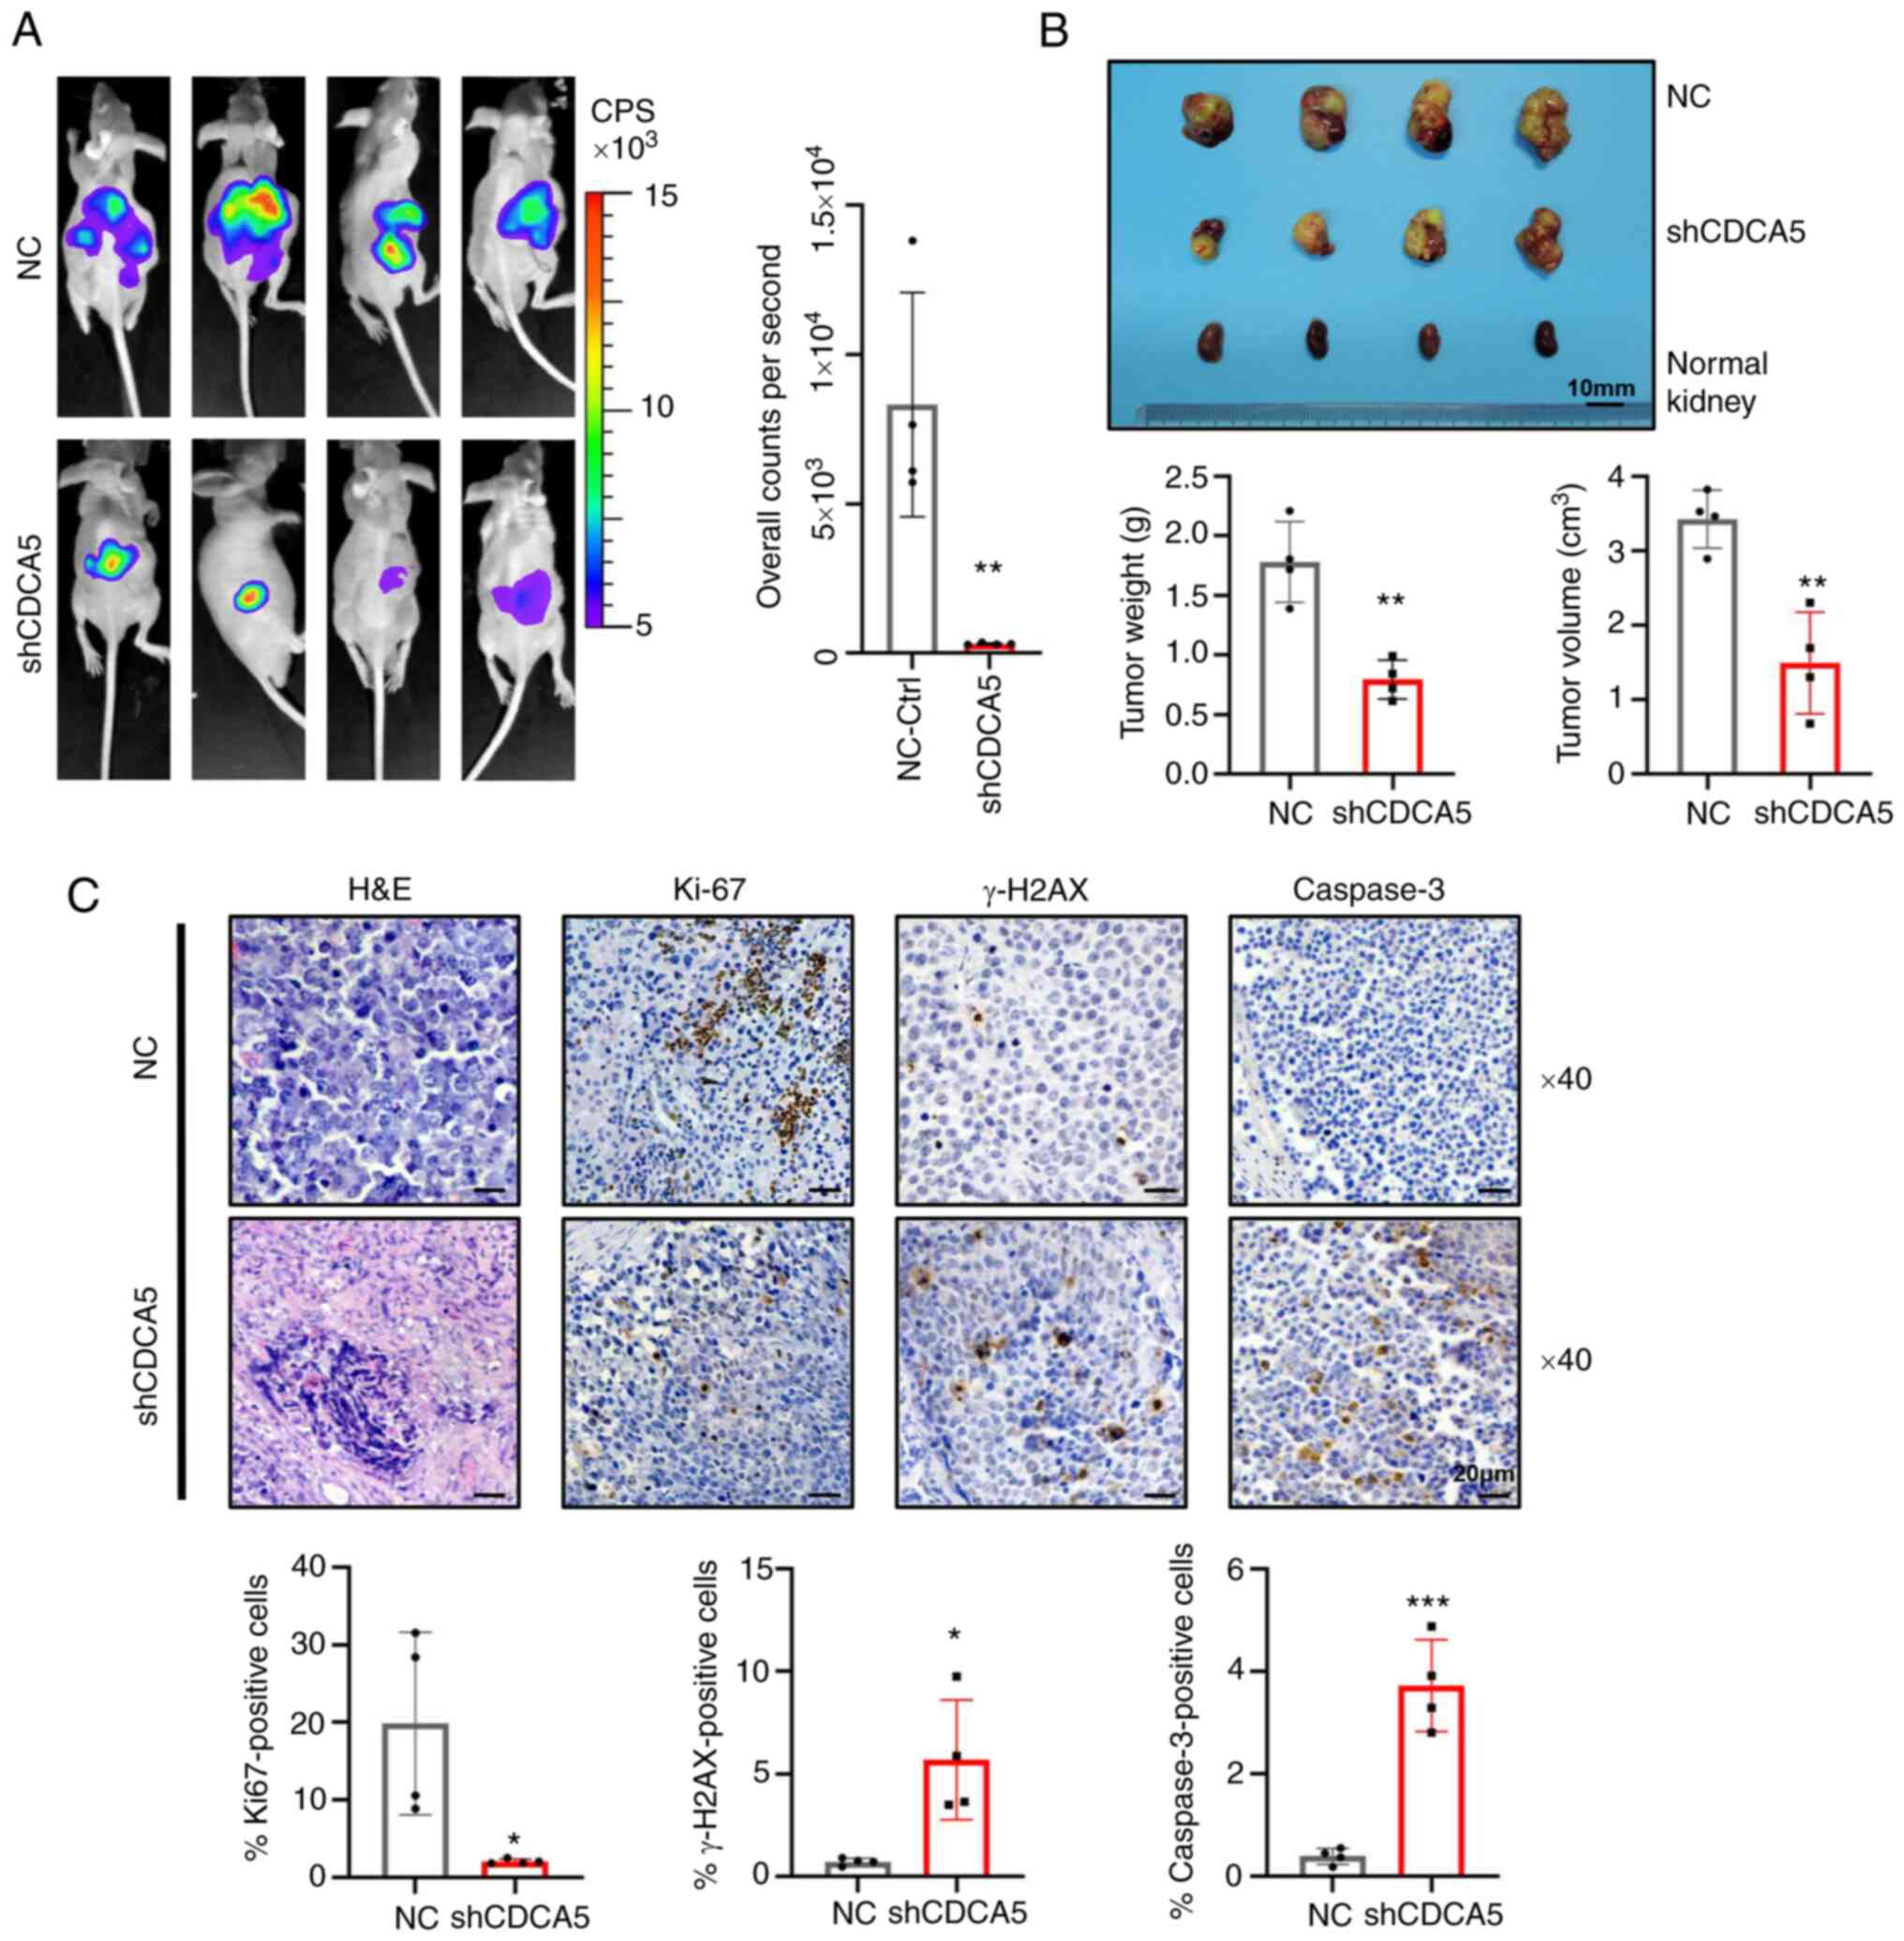 | Figure 8Knockdown of CDCA5 suppresses
tumorigenesis and tumor growth of ccRCC cells in vivo. (A)
Bioluminescence imaging by luciferase in an orthotopic ccRCC
xenograft mouse model. The luciferase signaling intensity of
overall counts per second was decreased in the shCDCA5 group with
statistical significance. (B) The xenograft tumors were collected
at 4 weeks after injection. Compared to the NC control group,
tumors were smaller in the shCDCA5 group. The weight and volume of
the excised xenograft tumors were analyzed between the two groups.
Scale bar, 10 mm. (C) Representative graphs and quantification of
H&E staining and immunohistochemistry assays for Ki67, γ-H2AX
and caspase-3 in the tumor sections. Magnification, ×40; scale bar,
20 µm. *P<0.05, **P<0.01 and
***P<0.001 vs. negative control. CDCA5, cell division
cycle-associated 5; ccRCC, clear cell renal cell carcinoma; NC,
negative control; γ-H2AX, γ-H2A histone family member X. |
To determine the effects of CDCA5 inhibition on DDR
and tumor cell apoptosis in tumor xenografts, tumors were resected
and embedded for H&E staining and IHC (Fig. 7C). IHC analysis confirmed that
tumors derived from cells in which shCDCA5 was knocked down
displayed a significantly decreased Ki67 expression compared with
the control tumors (P<0.05; Fig.
8C). Moreover, the knockdown of CDCA5 significantly promoted
γ-H2AX accumulation (P<0.05; Fig.
8C), confirming the potential pivotal role of CDCA5 in DDR.
Caspase-3 expression was upregulated in the shCDCA5 group. This
revealed the induction of cell apoptosis in vivo
(P<0.001; Fig. 8C). Thus, the
orthotopic model demonstrated that shCDCA5 knockdown significantly
suppressed tumor proliferation and growth in vivo through
the induction of DDR and apoptosis.
Discussion
With the increasing prevalence of urological cancer,
ccRCC still lacks reliable biomarkers and has a refractory response
to various chemotherapeutics. The development of genomic
instability is one of enabling characteristics of cancer (22), which is frequently induced by gene
alterations in DNA damage repair and chromatin remodeling (23). In addition, cohesin, with its
essential substrate, CDCA5, regulates chromatin segregation in
metaphase-to-anaphase transition, maintains genomic stability, and
drives cancer pathogenesis (24).
CDCA5 has been found to be overexpressed in a number of types of
cancer (16,25,26). However, to the best of our
knowledge, no study to date has profiled the expression and
function of CDCA5 in ccRCC.
In the present study, CDCA5 expression was found to
be upregulated in ccRCC tissue and its high expression was
positively associated with a larger tumor size, distant metastasis,
advanced TNM stage and a higher WHO/ISUP grade. The high expression
of CDCA5 was associated with an aggressive tumor status and a poor
survival. Accordingly, univariate and multivariate Cox regression
analyses identified CDCA5 overexpression as an independent
indicator of a poorer DFS and OS. Likewise, in in vitro
experiments, the knockdown of CDCA5 inhibited the proliferation and
migration, promoted the apoptosis of SN12-PM6 and 786-O cells, and
suppressed tumorigeneses in an orthotopic implantation model of
ccRCC. Thus, shCDCA5 suppresses the progression and promotes the
apoptosis of ccRCC cells, contributing to a beneficial outcome.
Taken together, in accordance with the findings of previous studies
(14,26,27), the results of the present study
support the oncogenic role of CDCA5 in ccRCC progression; thus,
CDCA5 may be a possible candidate for a novel therapeutic target
for selective patients with ccRCC.
The knockdown of CDCA5 markedly induced DDR. In
response to DNA damage, the recruitment of γ-H2AX was enriched at
sites of damage. However, the knockdown of CDCA5 markedly decreased
the expression of BRCA1 and p-BRAC1, which can abrogate the
homologous repair of DNA double-strand breaks. In addition, when
forced into mitosis in CDCA5-depleted cells, chromosomal fragments
were observed and genome integrity was not maintained (10). In turn, difficulty to repair
damaged DNA resulted in several potential tumor suppressive effects
in cell proliferation inhibition, cell cycle arrest and eventually,
apoptosis. As for the induction of G2/M arrest following the
knockdown of CDCA5, p-histone H3, a cell cycle specific marker
helped to determine the nature of cell cycle-progression manner
(28). Flow cytometry and the
decreased expression of p-histone-H3 in IF confirmed the presence
of cell cycle arrest at the G2/M checkpoint.
Mechanistic defects in DNA repair can be exploited
as potential therapeutic approaches in synthetic lethality, such as
PARP inhibitors in patients carrying BRCA1/BRCA2 mutations
(29). Additionally, the genome
sequencing of ccRCC has revealed comprehensive mutations in
tumorigenesis, including VHL, PBRM1, BAP1, etc. (3). PBRM1 is involved in the formation of
the SWI/SNF chromatin remodeling complex, which facilitates DNA
repair, as well as the maintenance of genomic stability (30). By antagonizing WAPL (31), the recruitment of CDCA5 is
continuously required for sister chromatid cohesion maintenance,
which involves DNA looping and transcriptional regulation (8,32).
Molecules that are involved in DDR and chromatin remodeling may
provide therapeutic strategies for ccRCC treatment.
Previous studies have demonstrated that DNA damage
interacts with inflammation, activating both the innate and
adaptive immune responses (33,34). Under DNA damage, one of the
important pattern recognition receptors for accumulating cytosolic
DNA is sensed by cyclic GMP-AMP (cGAMP) synthase (cGAS), followed
by activating the stimulator of interferon genes (STING) (35). The cGAS/cGAMP/STING pathway then
triggers interferon regulatory factor 3 and NF-κB, respectively
(36). Furthermore, the
transcriptional production of interferons and cytokines interacts
with the Stat family (37). In
the present study, it was found that DDR was induced by CDCA5
knockdown; CDCA5 knockdown decreased the level sof Stat3, p-Stat3,
NF-κB and p-NF-κB that mainly weaken the inflammatory response.
Correspondingly, the levels of inflammation-related factors, such
as AKT and p-AKT were inactivated by CDCA5 knockdown; this finding
is consistent with that of another study on bladder cancer, in
which CDCA5 was shown to function through the PI3K/AKT/mTOR pathway
(16). The inhibition of the
AKT/mTOR and Stat3 signaling pathways can attenuate inflammation
and reduce tumor cell proliferation (38). However, in response to DDR, the
present study demonstrated the inhibition of Stat3 and NF-κB
following CDCA5 knockdown; this was in contrast to the activation
of STAT1/2 and NF-κB through the cGAS-STING pathway (39). Thus, further investigations are
warranted to fully elucidate the underlying mechanisms of CDCA5
knockdown.
Collectively, in response to DNA damage following
the knockdown CDCA5, sequential cellular processes occurred,
including DDR, cell cycle arrest and the promotion of cell
apoptosis. Bcl-2 functions in blocking apoptosis (40). PARP regulates several biological
functions, mainly in the cell survival and cell-death programs
(41). PARP is predominantly
activated in DDR to cleave PARP and activate target downstream
regulators, such as p53 (42). Of
note, in the present study, following the knockdown of CDCA5, the
decreased expression of transcription factors, such as NF-κB and
Stat3 suggested the inhibition of inflammation. As DDR ws induced
by the knockdown of CDCA5, CDCA5 may thus be a potential target
which may be used in combination with immunotherapy for cancer
treatment in the future. As neo-antigens are generated by damaged
DNA accumulations, this could increase immunogenicity by
stimulating the T-cell response and rendering tumors more
susceptible to immunotherapies (43). However, further studies are
required to reveal the functions CDCA5 in immune modulation.
In conclusion, the present study demonstrated that
CDCA5 overexpression in ccRCC was associated with an advanced TNM
stage and pathological grade. The increased expression of CDCA5
predicted a poor survival outcome, whereas its knockdown attenuated
cell proliferation and malignancies in vitro and in
vivo. CDCA5 may thus serve as a credible biomarker for the
pathological stratification and prognosis of patients, and may
prove to be a prospective therapeutic target in the treatment of
ccRCC.
Supplementary Data
Availability of data and materials
The datasets used and/or analyzed during the current
study are available from the corresponding author on reasonable
request.
Authors' contributions
XH, YH and XZ conceptualized the study and designed
the experiments. XH and ZL performed the experiments, and analyzed
and visualized the data. TW, HW and HF assisted with the flow
cytometry, animal experiments and processing of images. HF
followed-up patients after nephrectomy and generated the tables.
SD, SW and DS collected the clinical data. HW and CW were in charge
of data mining and curation. XH and YH prepared the manuscript. HL,
BW and XZ reviewed and revised the manuscript. XZ, XM, BW and HL
provided clinical insight, secured funding and supervised the
research. All authors have read and approved the final manuscript
for publication. XH, YH, ZL, XM and XZ confirm the authenticity of
all the raw data.
Ethics approval and consent to
participate
The present study was performed on human cell lines,
on animals and retrospectively on formaldehyde-fixed
paraffin-embedded tissues from patients. Written informed consent
was obtained from all patients. The study was approved by the
Protection of Human Subjects Committee of Chinese People's
Liberation Army General Hospital (Beijing, China) (S2019-219-07).
The scientific use of orthotopic animal models was approved
(approval no. ACU20-245) by the Institutional Animal Care and Use
Committee (IACUC) of Cyagen Biosciences (Jiangsu, China). The study
was performed under the supervision and inspection of the committee
and the Cyagen Research Centre for model organisms.
Patient consent for publication
Not applicable.
Competing interests
The authors declare that they have no competing
interests.
Acknowledgements
The authors would like to thank Professor Xue-Min
Zhang (State Key Laboratory of Proteomics, National Center of
Biomedical Analysis, Beijing, China) for providing technical
support.
Funding
The present study was funded by the National Natural Science
Foundation of China (NSFC; grant nos. 81972389 and 81770790).
Abbreviations:
|
ccRCC
|
clear cell renal cell carcinoma
|
|
CDCA5
|
cell division cycle-associated 5
|
|
TMA
|
tissue microarray
|
|
DFS
|
disease-free survival
|
|
OS
|
overall survival
|
|
DDR
|
DNA damage response
|
|
shRNA
|
short hairpin RNA
|
|
RT-qPCR
|
reverse-transcription quantitative
polymerase chain reaction
|
References
|
1
|
Bray F, Ferlay J, Soerjomataram I, Siegel
RL, Torre LA and Jemal A: Global cancer statistics 2018: GLOBOCAN
estimates of incidence and mortality worldwide for 36 cancers in
185 countries. CA Cancer J Clin. 68:394–424. 2018. View Article : Google Scholar : PubMed/NCBI
|
|
2
|
Ricketts CJ, De Cubas AA, Fan H, Smith CC,
Lang M, Reznik E, Bowlby R, Gibb EA, Akbani R, Beroukhim R, et al:
The cancer genome atlas comprehensive molecular characterization of
renal cell carcinoma. Cell Rep. 23:313–326.e5. 2018. View Article : Google Scholar : PubMed/NCBI
|
|
3
|
Cancer Genome Atlas and Research Network:
Comprehensive molecular characterization of clear cell renal cell
carcinoma. Nature. 499:43–49. 2013. View Article : Google Scholar
|
|
4
|
Vasan N, Baselga J and Hyman DM: A view on
drug resistance in cancer. Nature. 575:299–309. 2019. View Article : Google Scholar : PubMed/NCBI
|
|
5
|
Peters JM: The anaphase promoting
complex/cyclosome: A machine designed to destroy. Nat Rev Mol Cell
Biol. 7:644–656. 2006. View
Article : Google Scholar : PubMed/NCBI
|
|
6
|
Rankin S, Ayad NG and Kirschner MW:
Sororin, a substrate of the anaphase-promoting complex, is required
for sister chromatid cohesion in vertebrates. Mol Cell. 18:185–200.
2005. View Article : Google Scholar : PubMed/NCBI
|
|
7
|
Haarhuis JHI, Elbatsh AMO and Rowland BD:
Cohesin and its regulation: On the logic of X-shaped chromosomes.
Dev Cell. 31:7–18. 2014. View Article : Google Scholar : PubMed/NCBI
|
|
8
|
Ladurner R, Kreidl E, Ivanov MP, Ekker H,
Idarraga-Amado MH, Busslinger GA, Wutz G, Cisneros DA and Peters
JM: Sororin actively maintains sister chromatid cohesion. EMBO J.
35:635–653. 2016. View Article : Google Scholar : PubMed/NCBI
|
|
9
|
Sjögren C and Nasmyth K: Sister chromatid
cohesion is required for postreplicative double-strand break repair
in Saccharomyces cerevisiae. Curr Biol. 11:991–995. 2001.
View Article : Google Scholar : PubMed/NCBI
|
|
10
|
Watrin E and Peters JM: The cohesin
complex is required for the DNA damage-induced G2/M checkpoint in
mammalian cells. EMBO J. 28:2625–2635. 2009. View Article : Google Scholar : PubMed/NCBI
|
|
11
|
Gruber S, Haering CH and Nasmyth K:
Chromosomal cohesin forms a ring. Cell. 112:765–777. 2003.
View Article : Google Scholar : PubMed/NCBI
|
|
12
|
Zhang N and Pati D: Sororin is a master
regulator of sister chromatid cohesion and separation. Cell Cycle.
11:2073–2083. 2012. View Article : Google Scholar : PubMed/NCBI
|
|
13
|
Tian Y, Wu J, Chagas C, Du Y, Lyu H, He Y,
Qi S, Peng Y and Hu J: CDCA5 overexpression is an Indicator of poor
prognosis in patients with hepatocellular carcinoma (HCC). BMC
Cancer. 18:11872018. View Article : Google Scholar : PubMed/NCBI
|
|
14
|
Shen A, Liu L, Chen H, Qi F, Huang Y, Lin
J, Sferra TJ, Sankararaman S, Wei L, Chu J, et al: Cell division
cycle associated 5 promotes colorectal cancer progression by
activating the ERK signaling pathway. Oncogenesis. 8:192019.
View Article : Google Scholar : PubMed/NCBI
|
|
15
|
Chang IW, Lin VCH, He HL, Hsu CT, Li CC,
Wu WJ, Huang CN, Wu TF and Li CF: CDCA5 overexpression is an
indicator of poor prognosis in patients with urothelial carcinomas
of the upper urinary tract and urinary bladder. Am J Transl Res.
7:710–722. 2015.PubMed/NCBI
|
|
16
|
Fu G, Xu Z, Chen X, Pan H, Wang Y and Jin
B: CDCA5 functions as a tumor promoter in bladder cancer by
dysregulating mitochondria-mediated apoptosis, cell cycle
regulation and PI3k/AKT/mTOR pathway activation. J Cancer.
11:2408–2420. 2020. View Article : Google Scholar : PubMed/NCBI
|
|
17
|
Paner GP, Stadler WM, Hansel DE, Montironi
R, Lin DW and Amin MB: Updates in the eighth edition of the
tumor-node-metastasis staging classification for urologic cancers.
Eur Urol. 73:560–569. 2018. View Article : Google Scholar : PubMed/NCBI
|
|
18
|
Livak KJ and Schmittgen TD: Analysis of
relative gene expression data using real-time quantitative PCR and
the 2(-Delta Delta C(T)) method. Methods. 25:402–408. 2001.
View Article : Google Scholar
|
|
19
|
Saremi N and Lam AK: Application of tissue
microarray in esophageal adenocarcinoma. Methods Mol Biol.
1756:105–118. 2018. View Article : Google Scholar : PubMed/NCBI
|
|
20
|
Faustino-Rocha A, Oliveira PA,
Pinho-Oliveira J, Teixeira-Guedes C, Soares-Maia R, da Costa RG,
Colaço B, Pires MJ, Colaço J, Ferreira R and Ginja M: Estimation of
rat mammary tumor volume using caliper and ultrasonography
measurements. Lab Anim (NY). 42:217–224. 2013. View Article : Google Scholar
|
|
21
|
Ma N, Kawanishi M, Hiraku Y, Murata M,
Huang GW, Huang Y, Luo DZ, Mo WG, Fukui Y and Kawanishi S: Reactive
nitrogen species-dependent DNA damage in EBV-associated
nasopharyngeal carcinoma: The relation to STAT3 activation and EGFR
expression. Int J Cancer. 122:2517–2525. 2008. View Article : Google Scholar : PubMed/NCBI
|
|
22
|
Hanahan D: Hallmarks of cancer: New
dimensions. Cancer Discov. 12:31–46. 2022. View Article : Google Scholar : PubMed/NCBI
|
|
23
|
Ui A, Chiba N and Yasui A: Relationship
among DNA double-strand break (DSB), DSB repair, and transcription
prevents genome instability and cancer. Cancer Sci. 111:1443–1451.
2020. View Article : Google Scholar : PubMed/NCBI
|
|
24
|
Waldman T: Emerging themes in cohesin
cancer biology. Nat Rev Cancer. 20:504–515. 2020. View Article : Google Scholar : PubMed/NCBI
|
|
25
|
Xu J, Zhu C, Yu Y, Wu W, Cao J, Li Z, Dai
J, Wang C, Tang Y, Zhu Q, et al: Systematic cancer-testis gene
expression analysis identified CDCA5 as a potential therapeutic
target in esophageal squamous cell carcinoma. EBioMedicine.
46:54–65. 2019. View Article : Google Scholar : PubMed/NCBI
|
|
26
|
Chen H, Chen J, Zhao L, Song W, Xuan Z,
Chen J, Li Z, Song G, Hong L, Song P and Zheng S: CDCA5,
Transcribed by E2F1, promotes oncogenesis by enhancing cell
proliferation and inhibiting apoptosis via the AKT pathway in
hepatocellular carcinoma. J Cancer. 10:1846–1854. 2019. View Article : Google Scholar : PubMed/NCBI
|
|
27
|
Nguyen MH, Koinuma J, Ueda K, Ito T,
Tsuchiya E, Nakamura Y and Daigo Y: Phosphorylation and activation
of cell division cycle associated 5 by mitogen-activated protein
kinase play a crucial role in human lung carcinogenesis. Cancer
Res. 70:5337–5347. 2010. View Article : Google Scholar : PubMed/NCBI
|
|
28
|
Nowak SJ and Corces VG: Phosphorylation of
histone H3: A balancing act between chromosome condensation and
transcriptional activation. Trends Genet. 20:214–220. 2004.
View Article : Google Scholar : PubMed/NCBI
|
|
29
|
Lord CJ and Ashworth A: PARP inhibitors:
Synthetic lethality in the clinic. Science. 355:1152–1158. 2017.
View Article : Google Scholar : PubMed/NCBI
|
|
30
|
Mittal P and Roberts CWM: The SWI/SNF
complex in cancer-biology, biomarkers and therapy. Nat Rev Clin
Oncol. 17:435–448. 2020. View Article : Google Scholar : PubMed/NCBI
|
|
31
|
Nishiyama T, Ladurner R, Schmitz J, Kreidl
E, Schleiffer A, Bhaskara V, Bando M, Shirahige K, Hyman AA,
Mechtler K and Peters JM: Sororin mediates sister chromatid
cohesion by antagonizing Wapl. Cell. 143:737–749. 2010. View Article : Google Scholar : PubMed/NCBI
|
|
32
|
Losada A: Cohesin in cancer: Chromosome
segregation and beyond. Nat Rev Cancer. 14:389–393. 2014.
View Article : Google Scholar : PubMed/NCBI
|
|
33
|
Bednarski JJ and Sleckman BP: At the
intersection of DNA damage and immune responses. Nat Rev Immunol.
19:231–242. 2019. View Article : Google Scholar : PubMed/NCBI
|
|
34
|
Chen Q, Sun L and Chen ZJ: Regulation and
function of the cGAS-STING pathway of cytosolic DNA sensing. Nat
Immunol. 17:1142–1149. 2016. View Article : Google Scholar : PubMed/NCBI
|
|
35
|
Cai X, Chiu YH and Chen ZJ: The
cGAS-cGAMP-STING pathway of cytosolic DNA sensing and signaling.
Mol Cell. 54:289–296. 2014. View Article : Google Scholar : PubMed/NCBI
|
|
36
|
Ishikawa H, Ma Z and Barber GN: STING
regulates intracellular DNA-mediated, type I interferon-dependent
innate immunity. Nature. 461:788–792. 2009. View Article : Google Scholar : PubMed/NCBI
|
|
37
|
Schoggins JW, Wilson SJ, Panis M, Murphy
MY, Jones CT, Bieniasz P and Rice CM: A diverse range of gene
products are effectors of the type I interferon antiviral response.
Nature. 472:481–485. 2011. View Article : Google Scholar : PubMed/NCBI
|
|
38
|
Wang J, Lv X, Guo X, Dong Y, Peng P, Huang
F, Wang P, Zhang H, Zhou J, Wang Y, et al: Feedback activation of
STAT3 limits the response to PI3K/AKT/mTOR inhibitors in
PTEN-deficient cancer cells. Oncogenesis. 10:82021. View Article : Google Scholar : PubMed/NCBI
|
|
39
|
Reisländer T, Groelly FJ and Tarsounas M:
DNA damage and cancer immunotherapy: A STING in the Tale. Mol Cell.
80:21–28. 2020. View Article : Google Scholar : PubMed/NCBI
|
|
40
|
Danial NN and Korsmeyer SJ: Cell death:
Critical control points. Cell. 116:205–219. 2004. View Article : Google Scholar : PubMed/NCBI
|
|
41
|
Schreiber V, Dantzer F, Ame JC and de
Murcia G: Poly(ADP-ribose): Novel functions for an old molecule.
Nat Rev Mol Cell Biol. 7:517–528. 2006. View Article : Google Scholar : PubMed/NCBI
|
|
42
|
Malanga M and Althaus FR: The role of
poly(ADP-ribose) in the DNA damage signaling network. Biochem Cell
Biol. 83:354–364. 2005. View Article : Google Scholar : PubMed/NCBI
|
|
43
|
Schumacher TN and Schreiber RD:
Neoantigens in cancer immunotherapy. Science. 348:69–74. 2015.
View Article : Google Scholar : PubMed/NCBI
|