Introduction
Pancreatic ductal adenocarcinoma (PDAC) is one of
the most lethal malignancies, accounting for ~8% of all
cancer-related deaths in the United States (1). Despite recent advances in cancer
treatment, the prognosis of patients with PDAC remains poor, with a
5-year overall survival rate of <10% (1). This poor prognosis is mainly
attributed to an aggressive tumor biology and diagnosis at advanced
stages when curative treatment is no longer an option. The vast
majority of patients with PDAC will receive chemotherapy during the
course of multimodality treatment; either as a neoadjuvant
treatment for borderline resectable tumors, as an adjuvant
treatment following surgical resection or as definitive
chemotherapy in a palliative setting (2,3).
However, the strong chemoresistance of PDAC remains a major
obstacle to its cure (4).
Therefore, agents enhancing the efficacy of systemic treatment are
urgently required to improve patient outcome. Clinical standard
chemotherapeutic regimes include gemcitabine, 5-fluoruracil (5-FU),
or the combination of 5-FU, leucovorin, irinotecan and oxaliplatin
(FOLFIRINOX) (5). FOLFIRINOX has
gained increasing attention due to its superior response rates
compared with previously established chemotherapeutic regimens
(6).
Natural compounds have always been a major resource
for drug development. In this context, the group of bitter
compounds has emerged as potential antineoplastic agents (7-9);
however, the mechanisms underlying these anticancer effects remain
to be elucidated. Notably, since all of these bitter compounds are
able to activate bitter taste receptors (T2Rs), these receptors
have emerged as a novel focus of research (10). T2Rs are G protein-coupled receptors
that were initially identified in the oral cavity where they
mediate bitter taste (10-12). However, in recent years, functional
expression of T2Rs has been reported extra-orally and T2Rs have
been shown to be involved in a wide range of biological functions,
including antineoplastic effects (13,14).
The first T2R identified in PDAC tissue was T2R38.
In 2016, our previous study reported its expression in pancreatic
cancer tumor tissue and tumor derived-cell lines. Upon activation,
T2R38 was shown to modulate key transcription factors and to induce
overexpression of the multi-drug resistance (MDR) protein ABCB1
(15). MDR proteins are major
contributors to chemoresistance by shuttling drugs, including
chemotherapeutics, outside of the cell (16). In a subsequent study, another T2R,
T2R10, was also revealed to be functionally expressed in pancreatic
adenocarcinoma. T2R10 was shown to be partially involved in
caffeine-induced chemosensitization in tumor-derived cell lines
(17). Increased susceptibility to
chemotherapeutics has been reported to be associated with
inhibition of AKT activation and downregulation of ABCG2 (17), both of which serve key roles in the
induction of chemoresistance (18-21).
Therefore, different T2R subtypes may have opposing roles in the
modulation of response to chemotherapy.
T2R14 is a broadly tuned T2R (12), which has been identified as an
important modulator of innate immune responses in various cell
types (22-24). In 2014, Singh et al
(25) identified T2R14 expression
in normal and breast cancer cells. This receptor was also shown to
confer antiproliferative and anti-migratory effects on highly
metastatic breast cancer cells upon activation (26). More recently, T2R14 was reported to
be differentially expressed in various solid tumor subtypes.
Elevated T2R14 gene expression has been shown to be associated with
prolonged survival in non-papillary bladder cancer, but with worse
survival in patients with esophageal and adrenocortical
adenocarcinoma (27). To date, to
the best of our knowledge, there are no reported studies on T2R14
expression at the protein level or its functional role in PDAC. A
well-known ligand for T2R14 is apigenin. Besides signaling via
T2R14, apigenin has been described to activate another T2R family
member, T2R39 (28). It is a
natural flavonoid found in most vegetables and fruits (29-31).
In 1986, Birt et al (32)
first reported that apigenin could confer anticancer effects. Since
then, numerous studies have revealed that apigenin can exhibit
antiproliferative effects and can act in synergy with certain
anticancer agents in various tumor types (33,34).
In PDAC, apigenin has been reported to inhibit cell proliferation
in human tumor cells (35,36). The chemosensitizing effects of
apigenin in PDAC have to date only been reported in the context of
the single chemotherapeutic agent gemcitabine (37,38).
Although there is evidence of potential antitumor mechanisms
involving apigenin and T2R14, to the best of our knowledge, these
have not yet been investigated and reported. Therefore, the present
study aimed to investigate T2R14 in PDAC and to explore whether the
chemosensitizing effects induced by its agonist apigenin are
mediated via T2R14.
Materials and methods
Chemicals, reagents and antibodies
Apigenin (MilliporeSigma) was dissolved in dimethyl
sulfoxide (DMSO; MilliporeSigma). Gemcitabine (Hexal AG), 5-FU
(medac GmbH), oxaliplatin (Accord Healthcare GmbH) and leucovorin
(TEVA GmbH) were dissolved in phosphate-buffered saline (PBS;
MilliporeSigma). SN-38 (irinotecan; Selleck Chemicals), the active
metabolite of irinotecan, was dissolved in DMSO. For
immunocytochemistry, immunohistochemistry and flow cytometry, the
following antibodies were used: T2R14 polyclonal antibody (cat. no.
OSR00161W), rabbit IgG isotype control (cat. no. 31235), goat
anti-rabbit IgG (H+L) highly cross-adsorbed secondary antibody,
Alexa Fluor™ 568 (cat. no. A-11036) and goat anti-rabbit IgG (H+L)
cross-adsorbed secondary antibody, Alexa Fluor 488 (cat. no.
A-11008) (all from Invitrogen; Thermo Fisher Scientific, Inc.) and
Envision Flex+Rabbit Linker (cat. no. DM825; lot no. 20079633;
Dako; Agilent Technologies, Inc.).
Cell culture
All listed cell lines were obtained from American
Type Culture Collection. The PDAC cell lines BxPC-3, MiaPaCa-2,
PANC-1, SU.86.86, T3M4 and the breast cancer cell line MCF-7 were
cultured in RPMI 1640 (MilliporeSigma) supplemented with 10% fetal
bovine serum (FBS; Gibco; Thermo Fisher Scientific, Inc.) and 1%
penicillin-streptomycin (Gibco; Thermo Fisher Scientific, Inc.).
293T cells were cultured in DMEM (MilliporeSigma) supplemented with
10% FBS and 1% penicillin-streptomycin. The normal human pancreatic
cell line HPDE was cultured in keratinocyte serum-free medium
supplemented with 30 µg/ml bovine pituitary extract, 200
pg/ml epidermal growth factor and 1% antibiotic-antimycotic (10,000
U/ml penicillin, 10,000 µg/ml streptomycin and 25
µg/ml Amphotericin B; cat. no. 15240062; Gibco) (all from
Thermo Fisher Scientific, Inc.). All cells were maintained in a
humidified atmosphere containing 5% CO2 at 37°C. Cell
culture flasks, dishes, cell scraper and serological pipettes were
obtained by Sarstedt AG & Co. KG. Inc. Accutase™ (PAN-Biotech
GmbH) was used for detaching cells.
Gene expression analysis
The data of T2R14 mRNA expression in PDAC tumors of
75 patients, aged between 41 and 83 years were obtained from the
database of the Heidelberg Institute of Personalized Oncology
(HIPO) biobank. Tumor samples with reads per kilobase million
(rpkm) ≥1 for T2R14 were defined as T2R14 positive. Kaplan-Meier
analysis and log-rank test were used to assess survival between
patients with relatively high (≥5.8 rpkm; n=48) and low (<5.8
rpkm; n=37) mRNA expression levels of T2R14.
Patient and biopsies
Pancreatic tissue samples were obtained from the
databank of the Institute of Pathology, University Medical Center
Mainz (Mainz, Germany) in accordance with the regulations of the
tissue bank. The histological examination of formalin-fixed,
paraffin-embedded and hematoxylin and eosin-stained pancreatic
tissue sections was performed during clinical routine diagnostics
at the Pathology Department, University Medical Center Mainz, by
board-certified pathologists, and the diagnosis was established
according to the criteria of the World Health Organization
Classification of Tumors of the digestive system (39). From this cohort, a tissue
microarray (TMA) was created. Briefly, representative areas were
selected by two independent pathologists for each patient and two
array spots were included for each of the following areas: Normal
ducts, low-grade pancreatic intraepithelial neoplasia (PanIN), high
grade PanIN, tumor center, tumor periphery, and if available, lymph
node metastasis. The core diameter was 1 mm for each core. Tissue
slides were cut at 3 µm and immunohistochemistry was
conducted. Patient demographics and clinical data are summarized in
Table I.
 | Table IPatient data for immunohistochemistry
analysis. |
Table I
Patient data for immunohistochemistry
analysis.
| Diagnosis | Value |
|---|
| Sex,
female/male | 49/53 |
| Age, years (mean;
median) | 37-82 (67; 69) |
| Tumor sizea | |
| pT1 | 10 |
| pT2 | 64 |
| pT3 | 28 |
| Lymph node
metastasesa | |
| pN0 | 34 |
| pN1 | 38 |
| pN2 | 30 |
| Distant
metastases | |
| pM0 | 15 |
| pM1 | 4 |
| No data | 83 |
| Histological
gradinga | |
| G1 | 5 |
| G2 | 61 |
| G3 | 35 |
| G4 | 1 |
| Resection
margina | |
| R0 | 79 |
| R1 | 20 |
| No data | 3 |
Immunohistochemistry
After deparaffinization and rehydration of the
tissue in xylene and a descending alcohol series, the tissues were
incubated with anti-human T2R14 antibody (1:300) for 1 h at room
temperature. The antigen retrieval was performed with Dako
EnVision™ Flex Target Retrieval Solution high pH (pH 9.0; Dako;
Agilent Technologies, Inc.) at 95°C for 20 min. For
permeabilization, the Dako EnVision™ Flex (20X) Wash Buffer (1:20;
cat. no. DM831; lot no. 20058883; Dako; Agilent Technologies, Inc.)
was used for 10 min at room temperature. To block non-specific
binding, the DakoEnvion™ Flex Peroxidase Blocking Reagent (cat. no.
DM821; lot no. 20062978; Dako; Agilent Technologies, Inc.) was used
for 5 min at room temperature. As a secondary antibody, the
EnVision™ Flex+Rabbit Linker (cat. no. DM825; lot no. 20079633;
Dako; Agilent Technologies, Inc.) was used for 15 min at room
temperature, followed by a color reaction with Dako EnVision™ Flex
Substrate buffer (cat. no. DM823; lot no. 20062842; Dako; Agilent
Technologies, Inc.) and Dako EnVision™ Flex DAB+ Chromogen (cat.
no. DM827; lot no. 20065471; Dako; Agilent Technologies, Inc.)
according to the manufacturer's protocol (one drop per 1,000
µl) twice for 5 min. Subsequently, the tissues were
counterstained with hematoxylin (Dako; Agilent Technologies, Inc.)
for 5 min at room temperature. The presence of T2R14 was evaluated
using the established Allred immunoreactive scoring system
(40) giving a range of 0-8 (0,
negative; 2-3, low; 4-6, medium; 7-8, high). In brief, the Allred
score is the sum of the proportion of positive cells score (0,
absent; 1, <1% positive cells; 2, 1-10% positive cells; 3,
11-33% positive cells; 4, 34-66% positive cells; 5, ≥ 67% positive
cells) and the staining intensity score (0, absent; 1, mild
reaction; 2, moderate reaction; 3, intense reaction). T2R14
expression was stained in PDAC tumor tissues (n=102) and visually
assessed by analysis of areas in the tumor periphery and center
using Olympus BX51 light microscope (Olympus Corporation).
RNA isolation and reverse
transcription-quantitative polymerase chain reaction (RT-qPCR)
Total RNA was isolated from BxPC-3, MiaPaCa-2,
PANC-1, SU.86.86, T3M4, MCF-7 and HPDE cell lines with
TRIzol® (Invitrogen; Thermo Fisher Scientific, Inc.),
and the purity and quantity of collected RNA was determined using a
NanoDrop ND-1000 spectrophotometer (NanoDrop; Thermo Fisher
Scientific, Inc.). For cDNA synthesis, 500 ng (1 µl) RNA, 2
µl 10X RT buffer, 0.8 µl dNTP mix (100 mM), 2
µl 10X RT random primers, 1 µl MultiScribe reverse
transcriptase (50 U/µl) and 0.5 µl RNAse inhibitor
(20 U/µl) (all obtained from Applied Biosystems; Thermo
Fisher Scientific, Inc.) and 12.7 µl DEPC H2O
(MilliporeSigma) were used. cDNA synthesis was performed using a
C1000 Touch™ thermal cycler (temperature protocol: 25°C for 10 min,
37°C for 120 min and 85°C for 5 min). T2R14 and HPRT (internal
control) cDNA was quantified using StepOnePlus™ Real-Time PCR
System (Applied Biosystems; Thermo Fisher Scientific, Inc.). The
final reaction volume included 2.5 µl PCR master mix
(TaqMan™ Fast Advanced Master Mix; cat. no. 4444558; Applied
Biosystems; Thermo Fisher Scientific, Inc.), 0.25 µl
predesigned TaqMan™ Gene Expression Assays for T2R14 (Assay ID:
Hs00256800_s1; cat. no. 4331182; Applied Biosystems; Thermo Fisher
Scientific, Inc.) or HPRT (Assay ID: Hs02800695_m1; cat. no.
4331182; Applied Biosystems; Thermo Fisher Scientific, Inc.), 1.25
µl DEPC H2O and 1 µl cDNA. The qPCR
reaction consisted of 20 sec of initial denaturation at 95°C
(holding stage) followed by 40 cycles with 1 sec at 95°C for
denaturation, and 20 sec at 60°C for annealing and extension
(cycling stage). Expression was analyzed using StepOne™ Real-Time
PCR v2.2 software (Applied Biosystems; Thermo Fisher Scientific,
Inc.). T2R14 gene expression was normalized to HPRT expression
using the 2−ΔΔCq method (41). For quality control, reactions were
performed using water instead of DNA. The breast cancer cell line
MCF-7 was used as positive control since it is known to express
T2R14 (42).
Flow cytometry
Before BxPC-3, MiaPaCa-2, PANC-1, SU.86.86, T3M4,
MCF-7 and HPDE cell lines were subjected to flow cytometry, they
were grown to 80-90% confluence, harvested with Accutase, and then
washed and resuspended in PBS. Initially, the cells were
pre-incubated with Zombie UV™ Fixable Viability Kit (1:200;
BioLegend, Inc.) and Fc Blocking Reagent (1:100; BD Biosciences) in
100 µl PBS for 15 min. After washing with PBS, the cells
were incubated with T2R14 polyclonal antibody or rabbit IgG isotype
control primary antibodies (both 1:100) in 100 µl PBS-1% FBS
for 30 min. After further washing with PBS-1% FBS, the cells were
incubated with secondary fluorochrome-conjugated goat anti-rabbit
IgG (H+L) highly cross-adsorbed secondary antibody, Alexa Fluor 568
(1:1,000) in 100 µl PBS-1% FBS for 15 min in the dark. All
incubation steps were performed at 4°C. Finally, the cells were
washed in PBS-1% FBS, resuspended in 100 µl PBS-1% FBS and
analyzed with the BD LSRFortessa™ flow cytometer (BD Biosciences).
Results were analyzed with FlowJo 10.7.1 software (FlowJo LLC). The
difference in mean fluorescence intensity (MFI) between the isotype
control and T2R14 primary antibody was used to determine
expression. For visualization of MFI differences between
populations with deviating sample numbers, peak heights of the
overlaid curves were scaled to their mode=100%. In the knockdown
experiments, the MFI of the short hairpin RNA (shRNA) control was
defined as 100%. Knockdown efficacy was expressed as percentage
decrease of MFI.
Immunocytochemistry
BxPC-3, MiaPaCa-2, PANC-1, SU.86.86, T3M4, MCF-7 and
HPDE cell lines were seeded on coverslips in 24-well culture plates
and examined at 80-90% confluence. First, cells were washed with
PBS and fixed for 10 min at room temperature using 4%
paraformaldehyde (Morphisto GmbH). For permeabilization, the cells
were treated with 1% bovine serum albumin (BSA)/PBS-Triton X-100
(all from MilliporeSigma). After blocking with 5% BSA for 1 h at
room temperature, the cells were incubated overnight at 4°C with
T2R14 primary antibody or rabbit IgG isotype control (both
1:1,000). The following day, cells were washed repeatedly with PBS
and were then incubated with secondary fluorochrome-conjugated
antibodies for 2 h at room temperature. For wild-type cells, Alexa
Fluor 488-conjugated antibodies (1:1,000) and Texas Red™-X
Phalloidin (1:500; Thermo Fisher Scientific, Inc.) were used. For
knockdown cell lines, Alexa Fluor 568-conjugated anti-bodies
(1:1,000) were used. The cells were finally washed in PBS
repeatedly. The nuclei were stained using fluoroshield DAPI
mounting medium (MilliporeSigma). Image acquisition was performed
on a Leica TCS SP5 confocal microscope (Leica Microsystems
GmbH).
shRNA transduction
shRNA-mediated T2R14 knockdown was established in
PANC-1 and SU.86.86 cells. Third generation T2R14 pGFP-C-shLenti
shRNA vectors (cat. no. 50840) and non-targeting pGFP-C-shLenti
shRNA control vectors (cat. no. TR30021) were purchased from
OriGene Technologies, Inc. The following four vectors were tested:
TL301238A: 5′-TTT GGT GCT GCT TCT TGT GAC TTC GGT CT-3′, TL301238B:
5′-TCA CTG CTT TGG CAA TCT CTC GAA TTA GC-3′, TL301238C: 5′-ATC GCA
AGA AGA TGC AGC ACA CTG TCA A-3′, TL301238D: 5′-TCT CTG TCA GTG CTA
CTG TGG CTG AGG TA-3′. For PANC-1 cells, the vector TL301238A and
for SU.86.86 cells, another vector TL301238B was found to work most
efficiently and used for all functional experiments. Lentiviral
particles were produced in 5×10⁶ 293T cells using the
calcium phosphate transfection method (CAPHOS Calcium Phosphate
Transfection Kit; MilliporeSigma) with 15 µg of one of the
four third generation T2R14 shRNAs (TL301238A-D) or non-targeting
shRNA pGFP-C-shLenti shRNA vector plasmids, 10 µg
Gag/Pol-(pMDLg/pRRE; Addgene, Inc.), 5 µg Rev-(pRSV-Rev;
Addgene, Inc.) and 2 µg Envelope-(phCMV-VSV-G; Addgene,
Inc.) plasmids. Transfected 293T cells were incubated for 8 h in a
humidified atmosphere containing 5% CO2 at 37°C before
the medium was changed. The supernatant was then collected after
every 12 h and filtered through a 0.22 µm syringe filter.
Success of transfection was estimated using Carl Zeiss™ Axiovert 40
CFL light microscope with fluorescence light source HXP 120 (both
from Carl Zeiss AG). Titration of lenti-vectors and calculation of
multiplicity of infection ratio were not performed as no repetitive
transduction was intended. Instead, 5×10⁶ PANC-1 and
SU.86.86 cells were transduced with half of the supernatant (5 ml
each) that was collected after 12 h incubation. The transduction of
PANC-1 and SU.86.86 cells with lentiviral particles was
accomplished for 48 h in a humidified atmosphere containing 5%
CO2 at 37°C. Success of transduction was estimated using
Carl Zeiss™ Axiovert 40 CFL light microscope with fluorescence
light source HXP 120 (both from Carl Zeiss AG). Post-transduction,
both cell lines were cultured in RPMI 1640 medium supplemented with
10% FBS, 1% penicillin-streptomycin. For selection and maintenance
of stably transfected cell lines, 1.4 µg/ml puromycin
(MilliporeSigma) was added according to previously performed
puromycin titration. Knockdown efficacy was measured using RT-qPCR
and flow cytometry in the first 3 weeks after transduction. All
treatments were carried out at 37°C in a humidified atmosphere
containing 5% CO2. Cells transduced with the scrambled
shRNA are referred to as the control-shRNA group and those
transduced with the T2R14 shRNA are referred to as the T2R14-shRNA
group.
Drug treatment
For cell viability tests, 5×10³ PANC-1
cells and 2×10³ SU.86.86 cells were seeded in 96-well
plates. For FOLFIRINOX treatment, all of the component drugs were
mixed and diluted in PBS. The final concentration of 75 µM
5-FU, 100 µM leucovorin, 60 µM oxaliplatin and 0.8
µM irinotecan was regarded as 100X. Prior to MTS assays,
cells were treated according to the schemes shown in Fig. S1A and B and cultured in total for
96 h in a humidified atmosphere containing 5% CO2 at
37°C. To assess the cytotoxicity of apigenin treatment alone, a
single dose of apigenin was administered 24 h after seeding
(Fig. S1A). For chemotherapeutic
response experiments, cells were pretreated with apigenin 12 h
after seeding; 24 h after seeding, the medium was refreshed and
another dose of apigenin plus different dosages of either
gemcitabine (5-50 nM for SU.86.86 and 1-1,000 nM for PANC-1), 5-FU
(0.3-50 µM) or FOLFIRINOX (0.1-10X) was administered. The
final concentration of apigenin never exceeded 10 µM
(Fig. S1B). Control cells for
FOLFIRINOX were treated with DMSO and for all other drugs with PBS,
according to the respective solvent used.
Chemosensitivity assays
To assess cytotoxicity and viability, the half
maximal inhibitory concentration (IC50) values of
apigenin, gemcitabine, 5-FU, FOLFIRINOX and combination treatments
were determined using the MTS cell viability assay. Cell viability
was measured after 96 h of cell culture and respective treatments
as illustrated in Fig. S1A and B.
Media were completely replaced with 100 µl fresh medium.
Using a Repeater® M4-Multi-Dispenser Pipette (Eppendorf
AG) 20 µl MTS CellTiter 96 Aqueous One Solution (Promega
Corp.) was added to each well. After 2 h of incubation at 37°C
absorbance was measured at 490 and 630 nm using
FLUOstar® Omega Multi-Mode Microplate Reader (BMG
Labtech). Cell viability was defined as the difference in
absorbance at 490 nm and background at 630 nm. For normalization,
absorbance values obtained on day 0 were defined as 0% viability,
and absorbance values obtained from untreated cells on day 3 were
defined as 100% viability. In order to assess the effects of
apigenin on the responsiveness to the aforementioned
chemotherapeutic drugs, this normalization was done separately for
the control (PBS) and apigenin treatment group. The coefficient of
drug interaction (CDI) was used to assess the synergy of apigenin
and the aforementioned chemotherapeutic drugs as previously
described (43). The CDI was
calculated as follows: CDI=AB/(A x B) where AB is the ratio of
number of living tumor cells after the combined treatment of
apigenin and chemotherapeutic drug. A is the ratio of number of
living tumor cells after the single treatment with apigenin and B
the ratio of number of living tumor cells after the single
treatment with one of the chemotherapeutic drugs. In this method, a
CDI value >1, =1 or <1 suggests that drugs are antagonistic,
additive or synergistic, respectively.
Migration assay
A total of 1×10⁵ cells were seeded in 100
µl serum-free media in the upper compartment of 6.5 mm
Transwell inserts in a 24-well plate (Corning, Inc.). For PANC-1
cells, inserts with 5.0 µm pores were used; for SU.86.86
cells, inserts with 8.0 µm pores were used. After 15 min of
pre-incubation, 600 µl media supplemented with 10% calf
serum containing 10, 30 or 50 µM apigenin was added to the
lower compartment. The cells were incubated in a humidified
atmosphere containing 5% CO2 at 37°C for 24 h.
Non-migrated cells in the upper compartment were carefully removed
with a cotton swab. The migrated cells were then fixed with 4%
paraformaldehyde for 10 min at room temperature and stained with 1%
crystal violet solution for 20 min at room temperature
(MilliporeSigma). The inserts were washed several times with PBS to
remove excess dye and finally dried completely. The mean number of
migrated cells was counted in seven random spots at ×200
magnification using a Carl Zeiss™ Axio Scope. A1 transmitted-light
microscope and images were acquired with Zeiss Axiocam MRc (both
from Carl Zeiss AG).
Statistical analysis
IC50 doses were calculated using GraphPad
Prism Software 5.0 (GraphPad Software Inc.). Other statistical
analyses were carried out with GraphPad Prism Software and SPSS
software (version 26; IBM Corp.). For all in vitro studies
at least three independent experimental repeats were carried out.
The statistical significance of data was obtained from viability
assays was tested by running extra-sum-of-squares F tests, and data
from migration assays were assessed using one-way ANOVA followed by
Dunnett post-hoc-tests. Statistical analysis of expression data was
performed using and Kaplan-Meier curves and log-rank test were used
to assess survival data. For the univariate survival analysis, the
median T2R14 expression level was used as the cut-off. P<0.05
was considered to indicate a statistically significant
difference.
Results
T2R14 is expressed in human pancreatic
cancer tissue and tumor-derived cell lines
The analysis of RNA sequencing data derived from the
HIPO databank revealed that T2R14 mRNA was detected in all tested
human pancreatic cancer tissue samples. PDAC tumors with >1 rpkm
were considered T2R14 positive (44,45).
Overall, the expression level was found to be low (median, 5.8
rpkm) (Fig. 1A). Patients with
relatively high T2R14 expression (≥5.8 rpkm) exhibited a
significantly prolonged survival rate compared with that of
patients with low T2R14 expression (<5.8 rpkm) (652 days vs. 429
days; P=0.03; Fig. 1B).
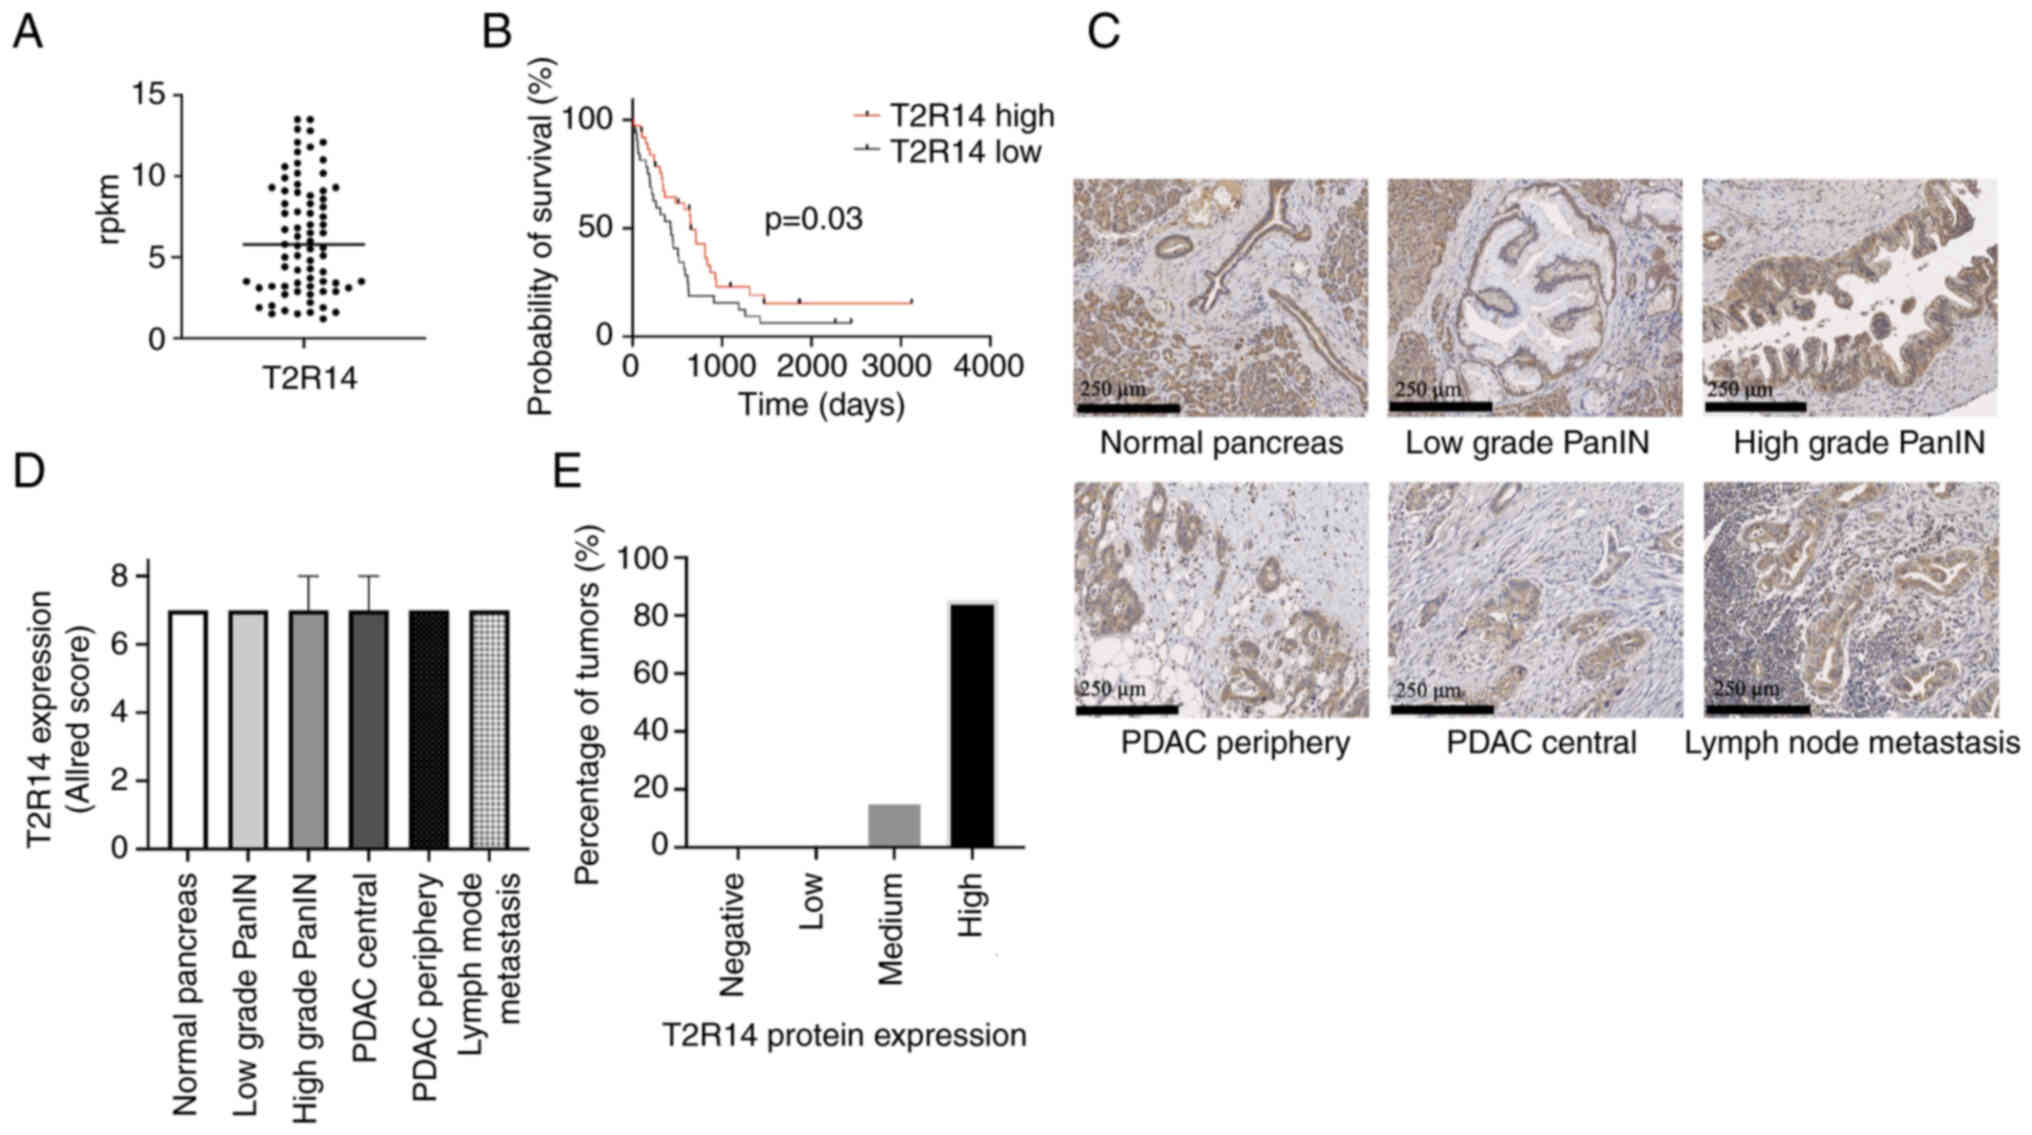 | Figure 1Expression of T2R14 in human
pancreatic tissue. (A) T2R14 mRNA transcripts from 75 patients with
PDAC derived from the HIPO databank (median, 5.8 rpkm). Data are
presented as quantified transcript levels in rpkm. (B) Kaplan-Meier
univariate survival analysis comparing patients with PDAC and high
(≥5.8 rpkm; n=38) or low (<5.8 rpkm; n=37) T2R14 expression
levels of T2R14. The median T2R14 expression level was used as the
cut-off. (C) Representative images of T2R14 staining (brown) in
normal pancreas, low grade PanIN, high grade PanIN, PDAC from the
periphery and the center, and lymph node metastasis tissue
specimens. (D) Allred scoring system was used to semi-quantify
T2R14 protein expression in 102 PDAC tumor samples. Data are
presented as the median ± IQR (E) Distribution of T2R14 protein
expression intensity in PDAC tumors. Samples were categorized
according to the Allred scoring system: Negative, score 0; low,
score 2-3; medium, score 4-6; high, score 7-8. Bars represent the
proportion of PDAC tumors with respective Allred scores. HIPO,
Heidelberg Institute of Personalized Oncology; PanIN, pancreatic
intraepithelial neoplasia; PDAC, pancreatic ductal adenocarcinoma;
rpkm, reads per kilobase million; T2R14, bitter taste receptor
14. |
For T2R14 detection at the protein level,
immunohistochemistry was carried out on TMAs. Tissue samples from
102 patients with PDAC, including invasive carcinoma, precursor
lesions and non-neoplastic tissue from each patient, were analyzed.
Patient data are summarized in Table
I. All tumors exhibited T2R14 positivity. T2R14 expression was
additionally seen in non-cancerous tissue and precursor lesions
(Fig. 1C and D); however, stromal
components revealed no marked expression. The vast majority of
patient tissue samples expressed T2R14 at a high level (85%;
Fig. 1E). Within PDAC, the
expression patterns did not differ between the tumor center and the
periphery. T2R14 protein was localized not only on the cell surface
but also in the cytoplasm. These findings are in accordance with a
previous report on T2R10 protein expression patterns in human PDAC
(17). Regarding
immunohistochemistry results, there was no association between
T2R14 expression and clinicopathological parameters (data not
shown).
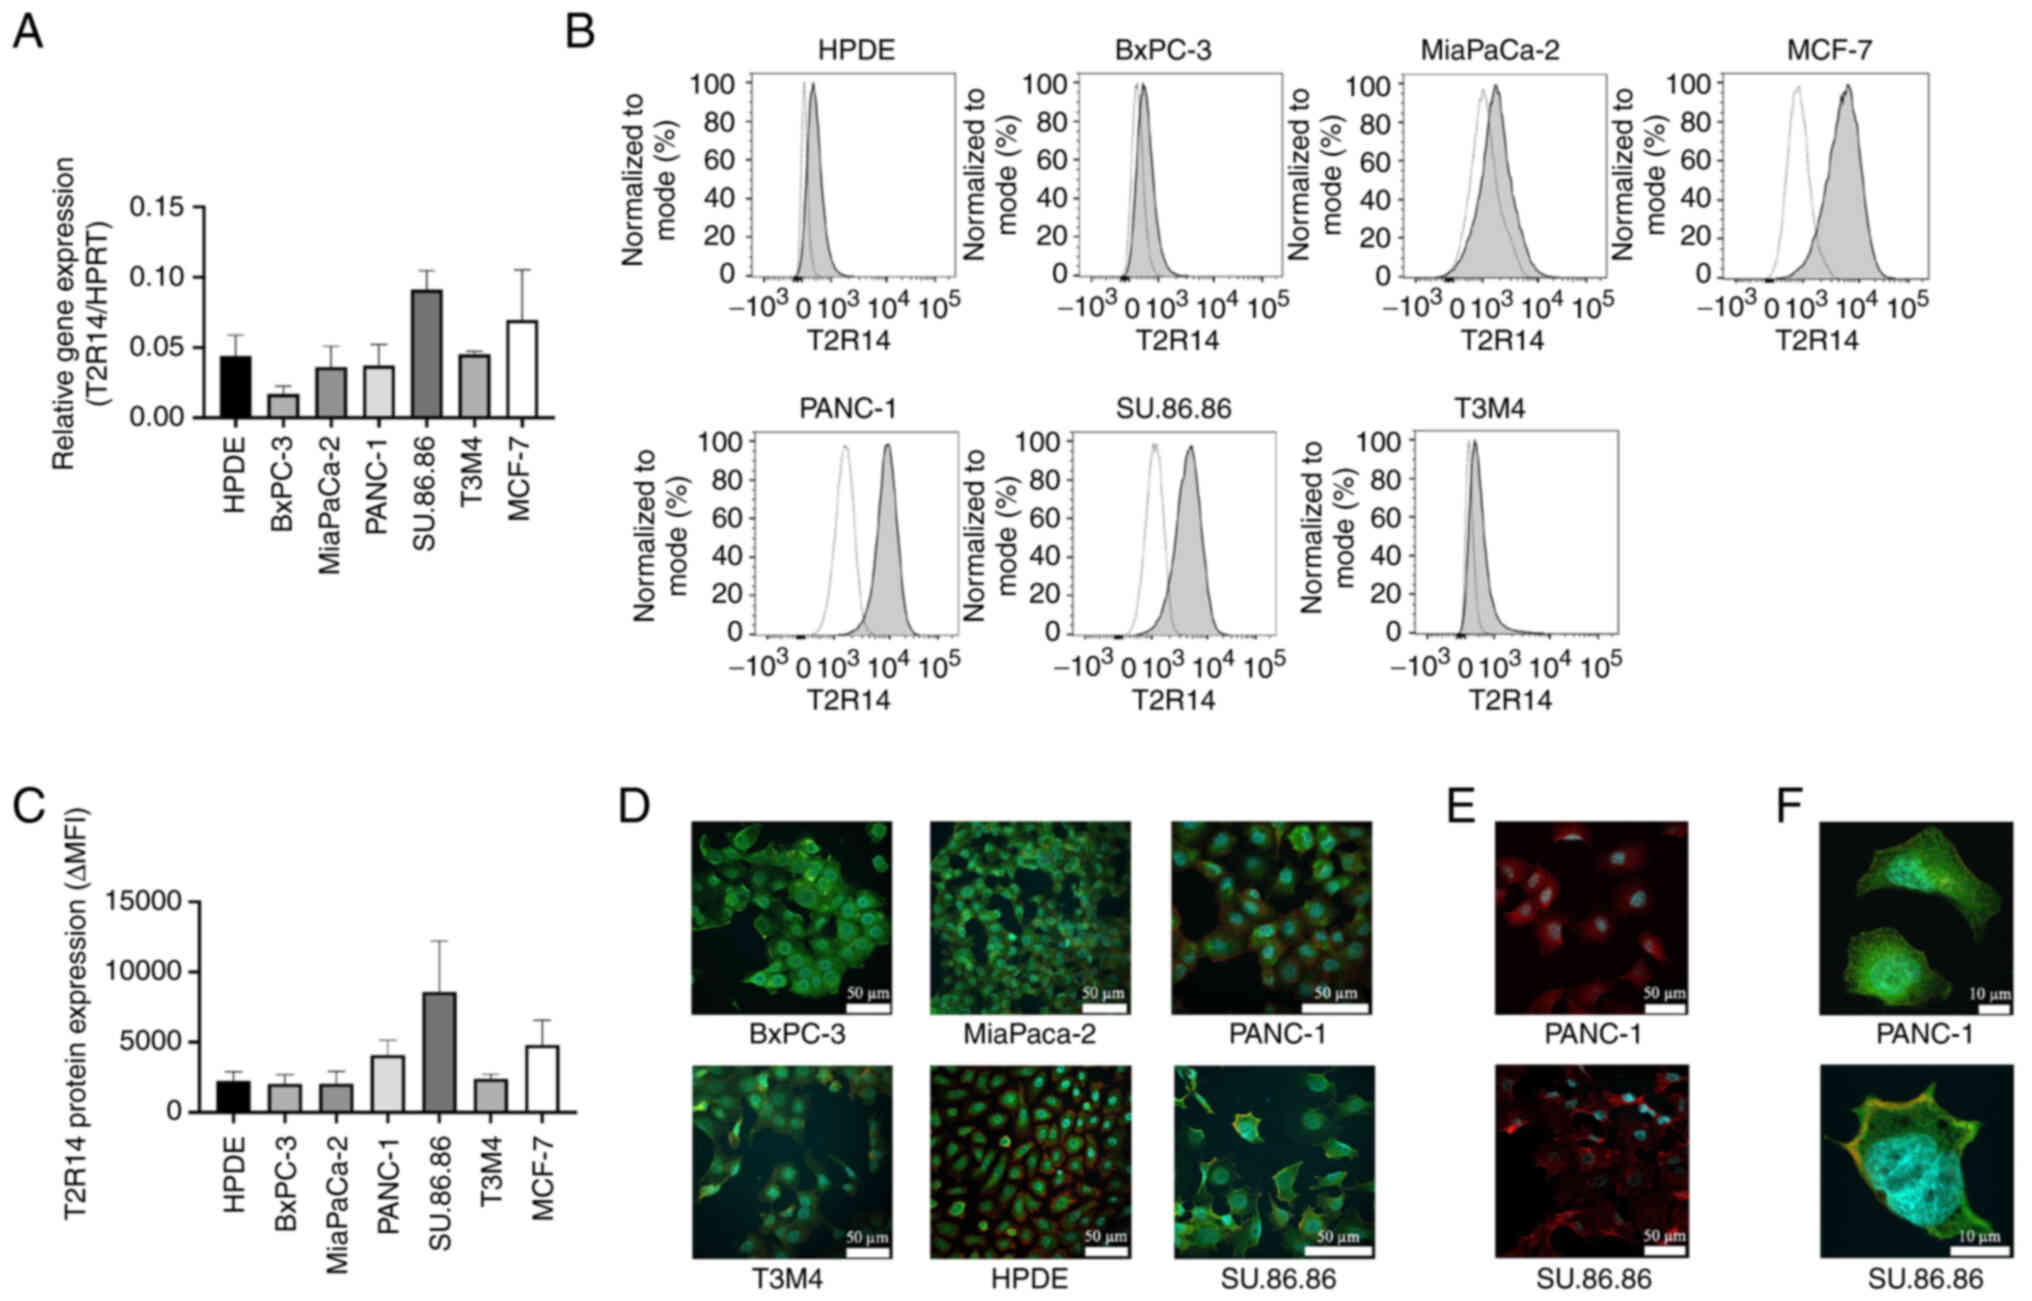
Subsequently, five human pancreatic cancer cell
lines, one normal pancreatic cell line (HPDE) and a breast cancer
cell line (MCF-7) were tested for T2R14 expression at mRNA and
protein levels. T2R14 mRNA expression was detected by RT-qPCR in
all cell lines and varying expression levels were detected
(Fig. 2A). Notably, the pancreatic
cancer cell line SU.86.86 exhibited the highest T2R14 mRNA
expression. For the detection of T2R14 protein expression, flow
cytometric analyses were carried out. In line with the
immunohistochemical findings, both normal pancreatic and
tumor-derived cell lines expressed T2R14, with SU.86.86 and PANC-1
cells exhibiting the strongest signal (Fig. 2B and C). For further validation,
immunofluorescence was used to visualize T2R14 protein expression
(Fig. 2D-F). T2R14 staining was
located both on the cell membrane and the cytoplasm, which is in
concordance with the results of the aforementioned
immunohistochemical staining (Fig.
2F). For subsequent studies, the two cell lines with the
highest expression levels of T2R14, SU.86.86 and PANC-1, were
chosen. PANC-1 is a primary pancreatic tumor cell line, whereas the
SU.86.86 cell line was derived from PDAC liver metastasis.
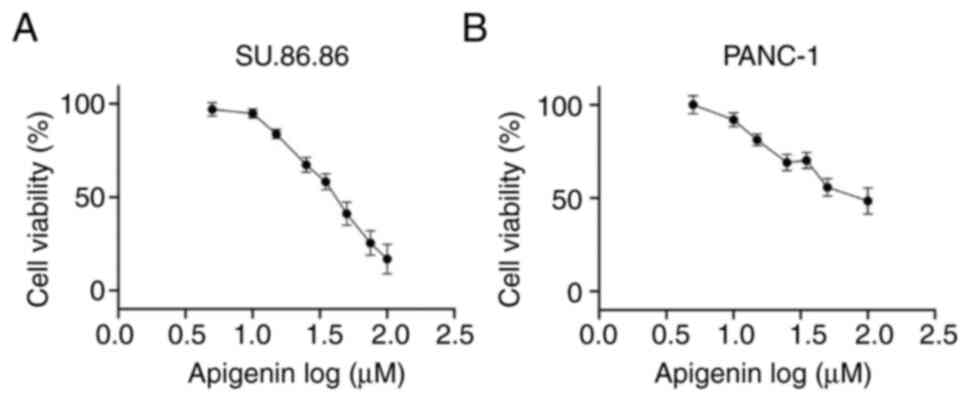
Apigenin inhibits cell viability in
SU.86.86 and PANC-1 cells in a dose-dependent manner
The present study evaluated the effects of apigenin,
a known T2R14 agonist, on the chemo-responsiveness of PDAC cells.
The effects of apigenin on the viability of SU.86.86 and PANC-1
pancreatic cancer cell lines was determined using the MTS assay.
Treatment with apigenin inhibited the viability of cells; with an
IC50 of 42 µM in SU.86.86 cells and 75 µM
in PANC-1 cells (Fig. 3).
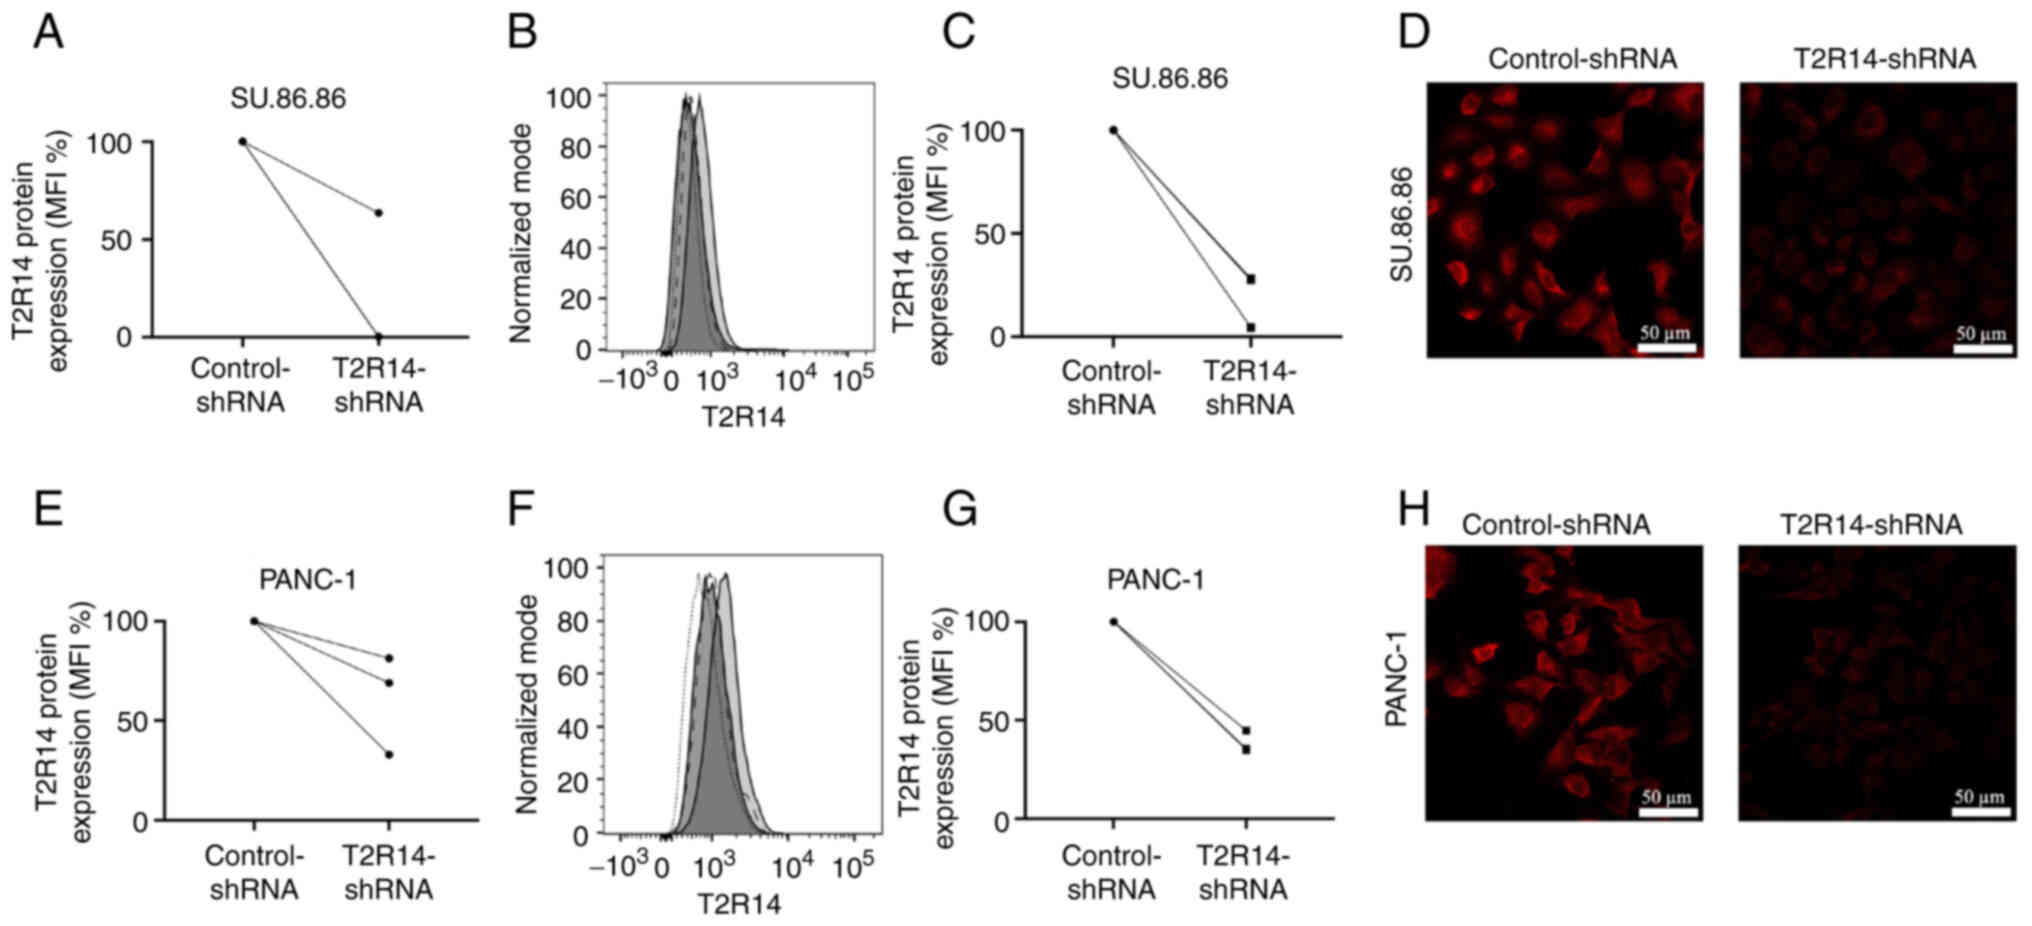
Effects of apigenin on cell viability are
independent of T2R14
To assess whether the cytotoxic effects induced by
apigenin were mediated via T2R14 signaling, T2R14 was knocked down
using shRNA. Knockdown efficacy was tested at the mRNA and protein
levels. According to the results of RT-qPCR, the mRNA expression
levels of T2R14 were reduced by 36% in SU.86.86 cells and 31% in
PANC-1 cells compared with in cells transduced with control-shRNA
(Fig. 4A and E). Flow cytometry
demonstrated a reduction in T2R14 protein expression of 83% in
Su.86.86 cells and 65% PANC-1 cells (Fig. 4B, C, F and G). In line with these
results, immunofluorescence confirmed that silencing of the T2R14
protein resulted in a clearly visible decrease in fluorescence
intensity (Fig. 4D and H).
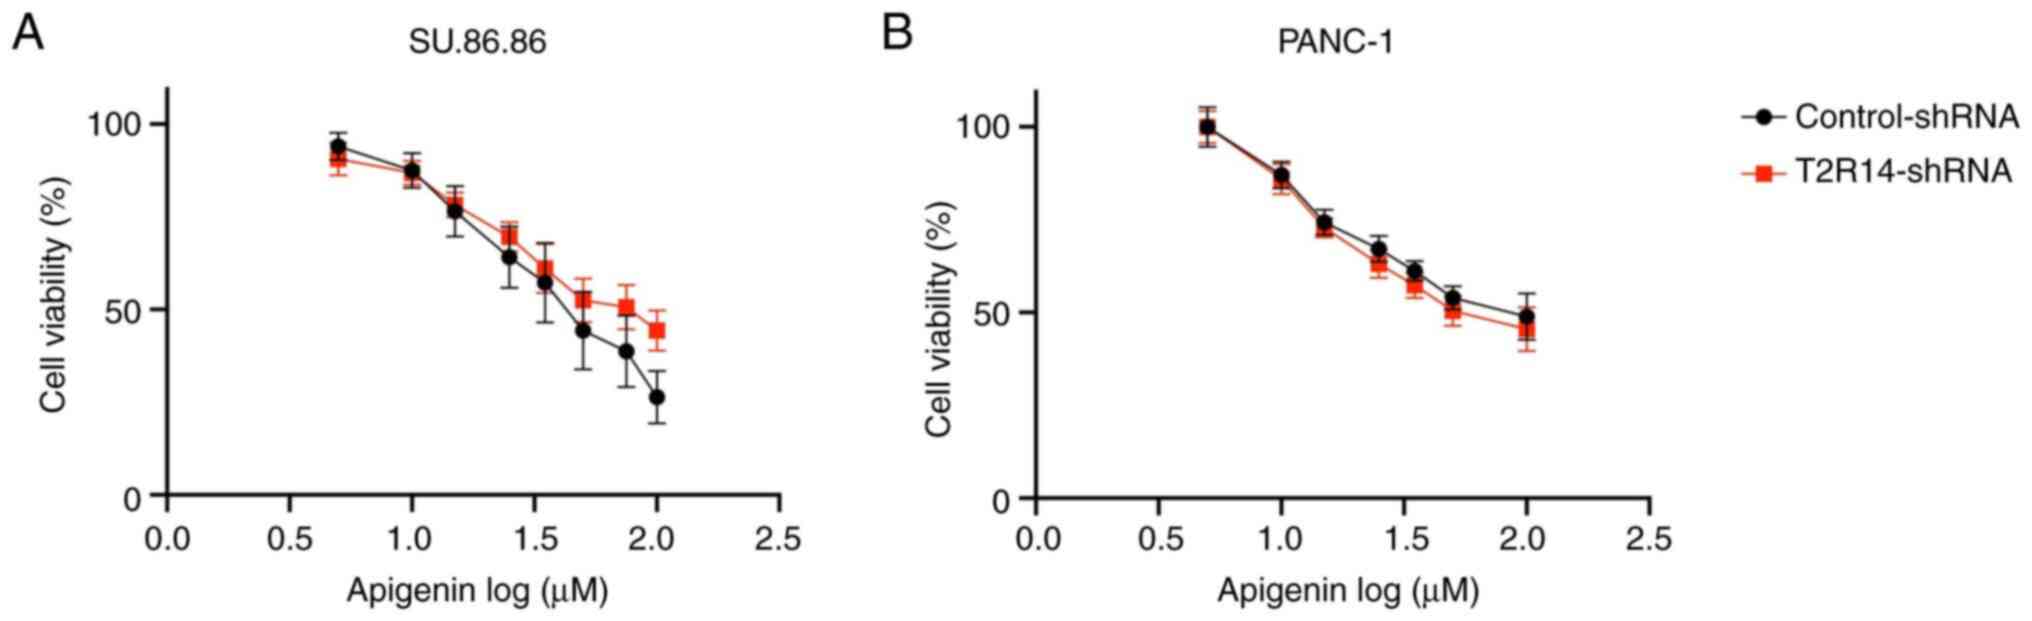
Having confirmed effective knockdown of T2R14
expression via shRNA transduction, the effect of T2R14 silencing on
apigenin-induced cytotoxicity was examined. In both cell lines
there was no significant difference in the IC50 values
between cells in the control-shRNA and T2R14-shRNA groups,
suggesting apigenin-induced cytotoxicity may be mediated by
alternative pathways other than T2R14 (Fig. 5).
Apigenin synergistically attenuates the
cytotoxic effects of 5-FU and FOLFIRINOX in SU.86.86 cells,
independent of T2R14
To assess the potential effects of T2R14 activation
on chemoresistance, cells were pretreated with apigenin and then
exposed to various concentrations of clinically used
chemotherapeutic drugs. Apigenin was applied at a concentration (10
µM) that had previously been shown to induce no relevant
cytotoxic effect on SU.86.86 or PANC-1 cells. For chemotherapeutic
treatment, gemcitabine, 5-FU and the combination chemotherapy
regimen FOLFIRINOX were applied since these are the most frequently
used cytotoxic agents in the treatment of patients with PDAC
(2,3).
In SU.86.86 cells, exposure to 10 µM apigenin
significantly reduced the IC50 of FOLFIRINOX by 61%
(P<0.0001; Fig. 6A). The CDI
for SU.86.86 cells was <1 suggesting a synergistic behavior
between apigenin and FOLFIRINOX for all concentrations of
FOLFIRINOX except for the highest (Table II). The highest level of synergy,
represented by the lowest CDI (0.74), was thereby achieved when
FOLFIRINOX was used at concentrations around its IC50
value (1.5X). A similar trend was observed for the combination
treatment with 5-FU and apigenin. In the presence of apigenin, the
IC50 of 5-FU was reduced by 42% (P<0.05; Fig. 6B). CDI values of <1 for all
concentrations of 5-FU except for one, suggested a predominantly
positive synergistic interaction in SU.86.86 cells. The lowest CDI
values (0.86) were detected when 5-FU was used at concentrations
around its IC50 value (5 µM). By contrast,
SU.86.86 cells became less susceptible to gemcitabine when exposed
to apigenin, but this effect was not statistically significant
(P>0.05) (Fig. 6C). Silencing
T2R14 did not eliminate the apigenin-induced chemosensitization
towards FOLFIRINOX or 5-FU (Fig. 6D
and E); however, the level of synergy between apigenin and
FOLFIRINOX was slightly reduced, as indicated by higher CDI values
for FOLFIRINOX at concentrations ranging from 0.5 to 2.5X.
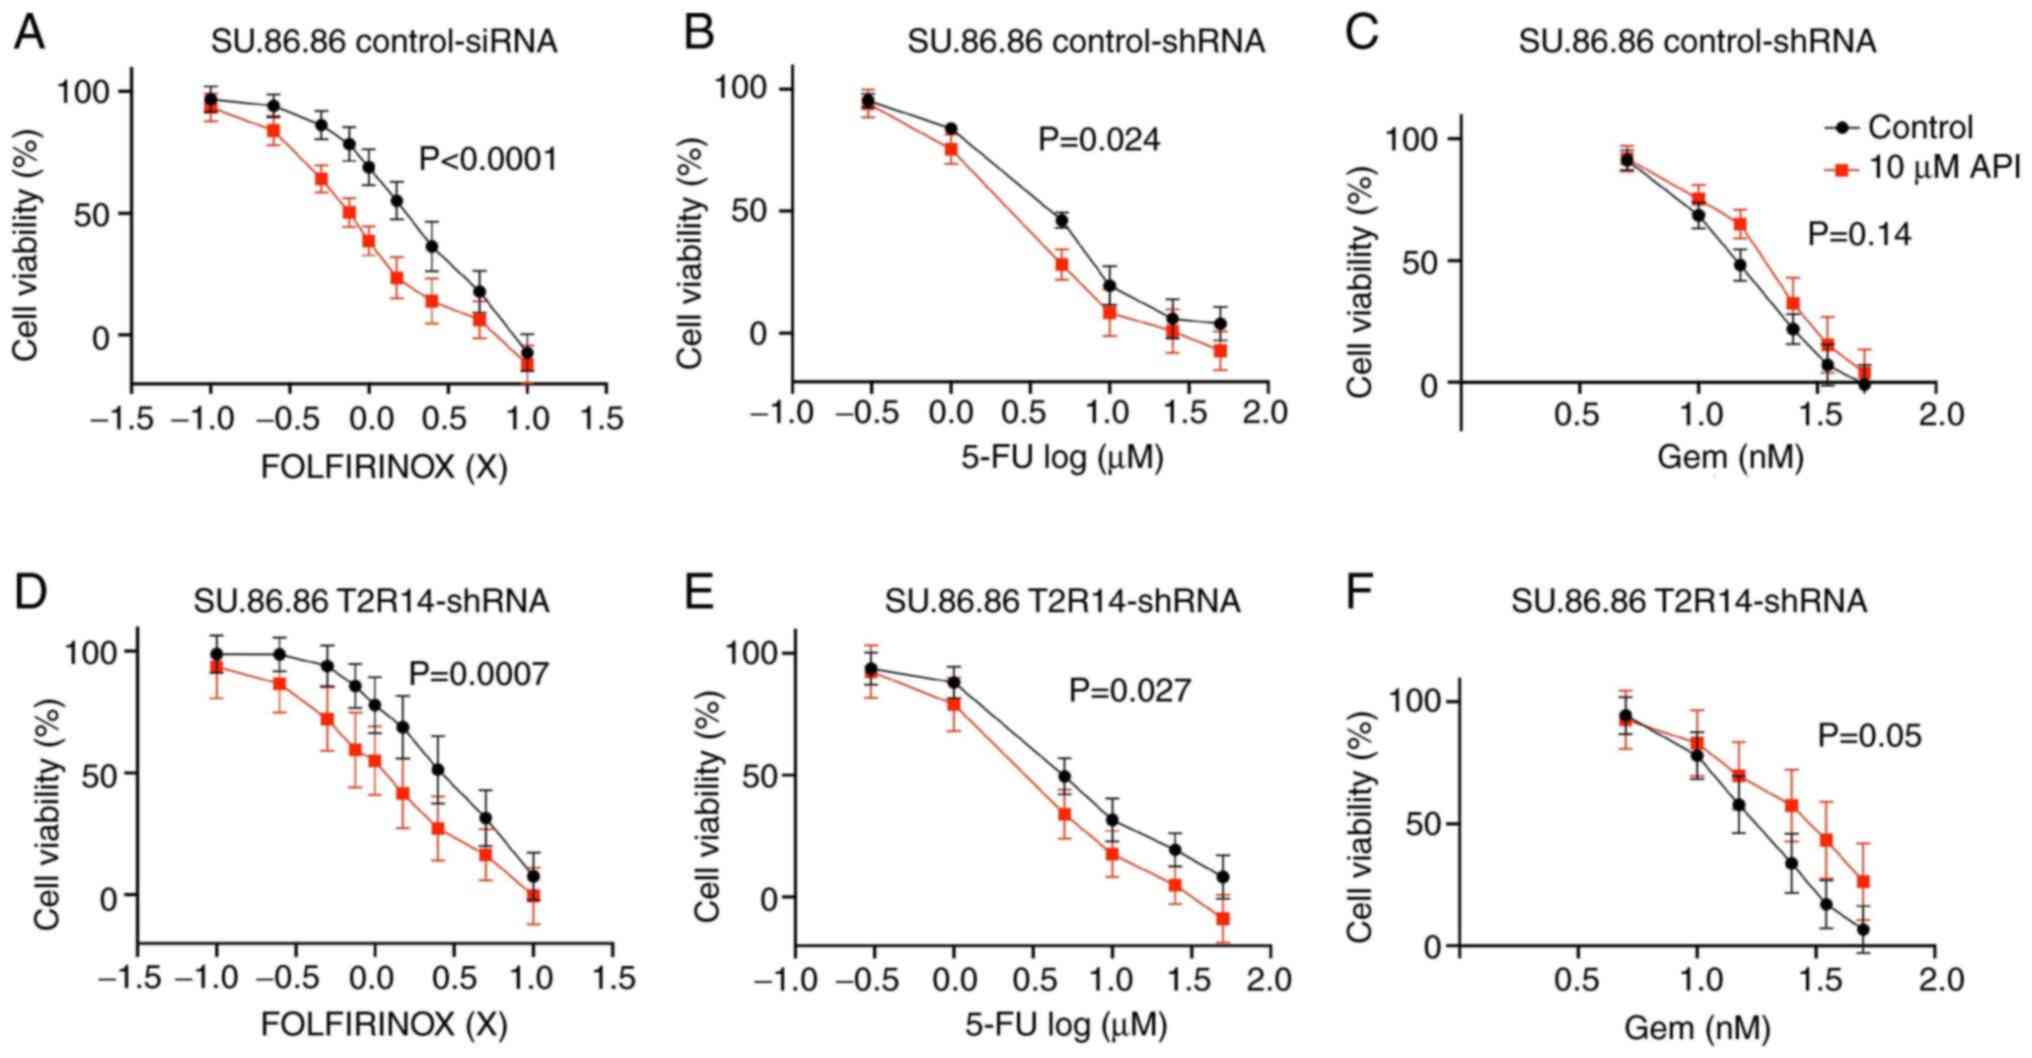 | Figure 6Apigenin synergistically enhances the
cytotoxicity of FOLFIRINOX and 5-FU in SU.86.86 cells. (A-C)
SU.86.86 cells were exposed to a range of concentrations of
chemotherapeutic treatments (Gem, 5-FU and FOLFIRINOX), in the
presence or absence of 10 µM apigenin. (D-F)
T2R14-shRNA-transfected cells were exposed to a range of
concentrations of chemotherapeutic treatments (Gem, 5-FU and
FOLFIRINOX), in the presence or absence of 10 µM apigenin.
MTS assays were applied for the determination of cell viability.
Values were normalized to untreated cells. Data are presented as
the mean ± SD of at least three independent experiments, each of
them performed in triplicate. Statistical significance was assessed
using the extra sum-of-squares F test. 5-FU, 5-fluorouracil;
FOLFIRINOX, 5-FU, leucovorin, irinotecan and oxaliplatin; Gem,
gemcitabine; shRNA, short hairpin RNA; T2R14, bitter taste receptor
14. |
| Table IISynergistic effect of apigenin and
FOLFIRINOX, 5-FU or Gem in SU.86.86 cells. |
Table II
Synergistic effect of apigenin and
FOLFIRINOX, 5-FU or Gem in SU.86.86 cells.
A, FOLFIRINOX
|
|---|
| Concentration of
chemotherapeutic agent | CDI value
|
|---|
| Control-shRNA | T2R14-shRNA |
|---|
| 0.1X | 0.98 | 0.97 |
| 0.25X | 0.93 | 0.93 |
| 0.5X | 0.85 | 0.87 |
| 0.75X | 0.8 | 0.84 |
| 1X | 0.77 | 0.86 |
| 1.5X | 0.74 | 0.82 |
| 2.5X | 0.79 | 0.83 |
| 5X | 0.91 | 0.91 |
| 10X | 1.04 | 1.01 |
B, 5-FU
|
| Concentration of
chemotherapeutic agent | CDI value
|
| Control-shRNA | T2R14-shRNA |
|
| 0.3 µM | 0.99 | 1 |
| 1 µM | 0.95 | 0.95 |
| 5 µM | 0.86 | 0.92 |
| 10 µM | 0.92 | 0.93 |
| 25 µM | 1.02 | 0.93 |
| 50 µM | 0.92 | 0.9 |
C, Gem
|
| Concentration of
chemotherapeutic agent | CDI value
|
| Control-shRNA | T2R14-shRNA |
|
| 5 nM | 1.01 | 0.99 |
| 10 nM | 1.07 | 1.05 |
| 15 nM | 1.2 | 1.13 |
| 25 nM | 1.21 | 1.32 |
| 35 nM | 1.25 | 1.45 |
| 50 nM | 1.23 | 1.44 |
For PANC-1 cells, pretreatment with apigenin did not
have any apparent effect on the chemoresistance towards any of the
three tested chemotherapeutic agents, with CDI values ~1 (Fig. 7; Table III). In addition, knockdown of
T2R14 had no effect on chemosensitivity.
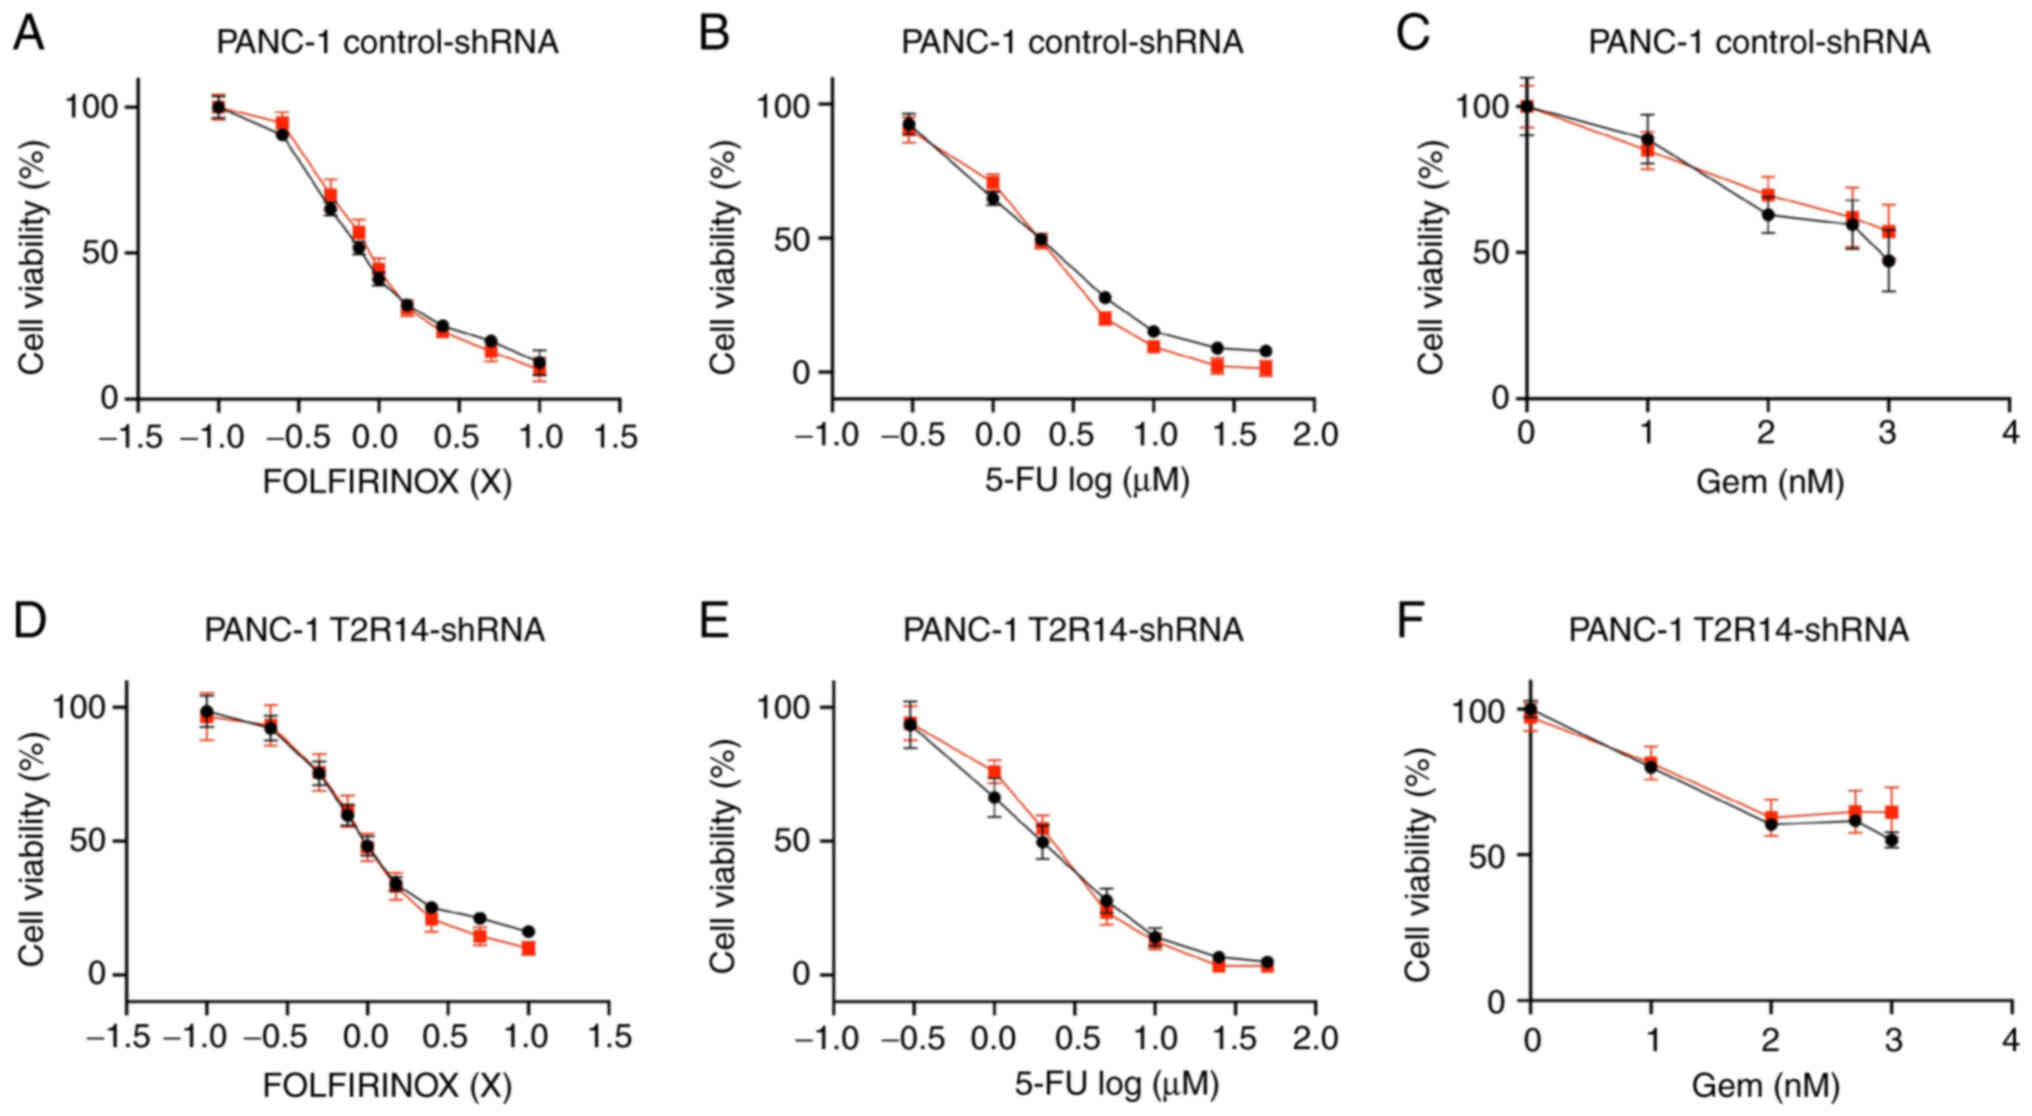 | Figure 7Apigenin does not affect the
cytotoxicity of FOLFIRINOX, 5-FU or Gem in PANC-1 cells. (A-C)
PANC-1 cells were exposed to a range of concentrations of
chemotherapeutic treatments (Gem, 5-FU and FOLFIRINOX), in the
presence or absence of 10 µM apigenin. (D-F)
T2R14-shRNA-transfected cells were exposed to a range of
concentrations of chemotherapeutic treatments (Gem, 5-FU and
FOLFIRINOX), in the presence or absence of 10 µM apigenin.
MTS assays were applied for the determination of cell viability.
Values were normalized to untreated cells. Data are presented as
the mean ± SD of at least three independent experiments, each of
them performed in triplicate. Statistical significance was assessed
using the extra sum-of-squares F test. 5-FU, 5-fluorouracil;
FOLFIRINOX, 5-FU, leucovorin, irinotecan and oxaliplatin; Gem,
gemcitabine; shRNA, short hairpin RNA; T2R14, bitter taste receptor
14. |
| Table IIISynergistic effects of apigenin and
FOLFIRINOX, 5-FU or Gem in PANC-1 cells. |
Table III
Synergistic effects of apigenin and
FOLFIRINOX, 5-FU or Gem in PANC-1 cells.
A, FOLFIRINOX
|
|---|
| Concentration of
chemotherapeutic agent | CDI value
|
|---|
| Control-shRNA | T2R14-shRNA |
|---|
| 0.1X | 0.99 | 0.99 |
| 0.25X | 1.02 | 1.01 |
| 0.5X | 1.05 | 1.03 |
| 0.75X | 1.07 | 1.06 |
| 1X | 1.06 | 1.06 |
| 1.5X | 1.03 | 1.09 |
| 2.5X | 1.03 | 1.07 |
| 5X | 1.01 | 1.05 |
| 10X | 1.04 | 1.07 |
B, 5-FU
|
| Concentration of
chemotherapeutic agent | CDI value
|
| Control-shRNA | T2R14-shRNA |
|
| 0.3 µM | 0.99 | 1.01 |
| 1 µM | 1.07 | 1.11 |
| 2 µM | 1.04 | 1.1 |
| 5 µM | 1 | 1.06 |
| 10 µM | 1.05 | 1.13 |
| 25 µM | 1.04 | 1.14 |
| 50 µM | 1.05 | 1.18 |
C, Gem
|
| Concentration of
chemotherapeutic agent | CDI value
|
| Control-shRNA | T2R14-shRNA |
|
| 1 nM | 1.01 | 0.98 |
| 10 nM | 0.99 | 1.02 |
| 100 nM | 1.08 | 1.05 |
| 500 nM | 1.05 | 1.05 |
| 1,000 nM | 1.13 | 1.12 |
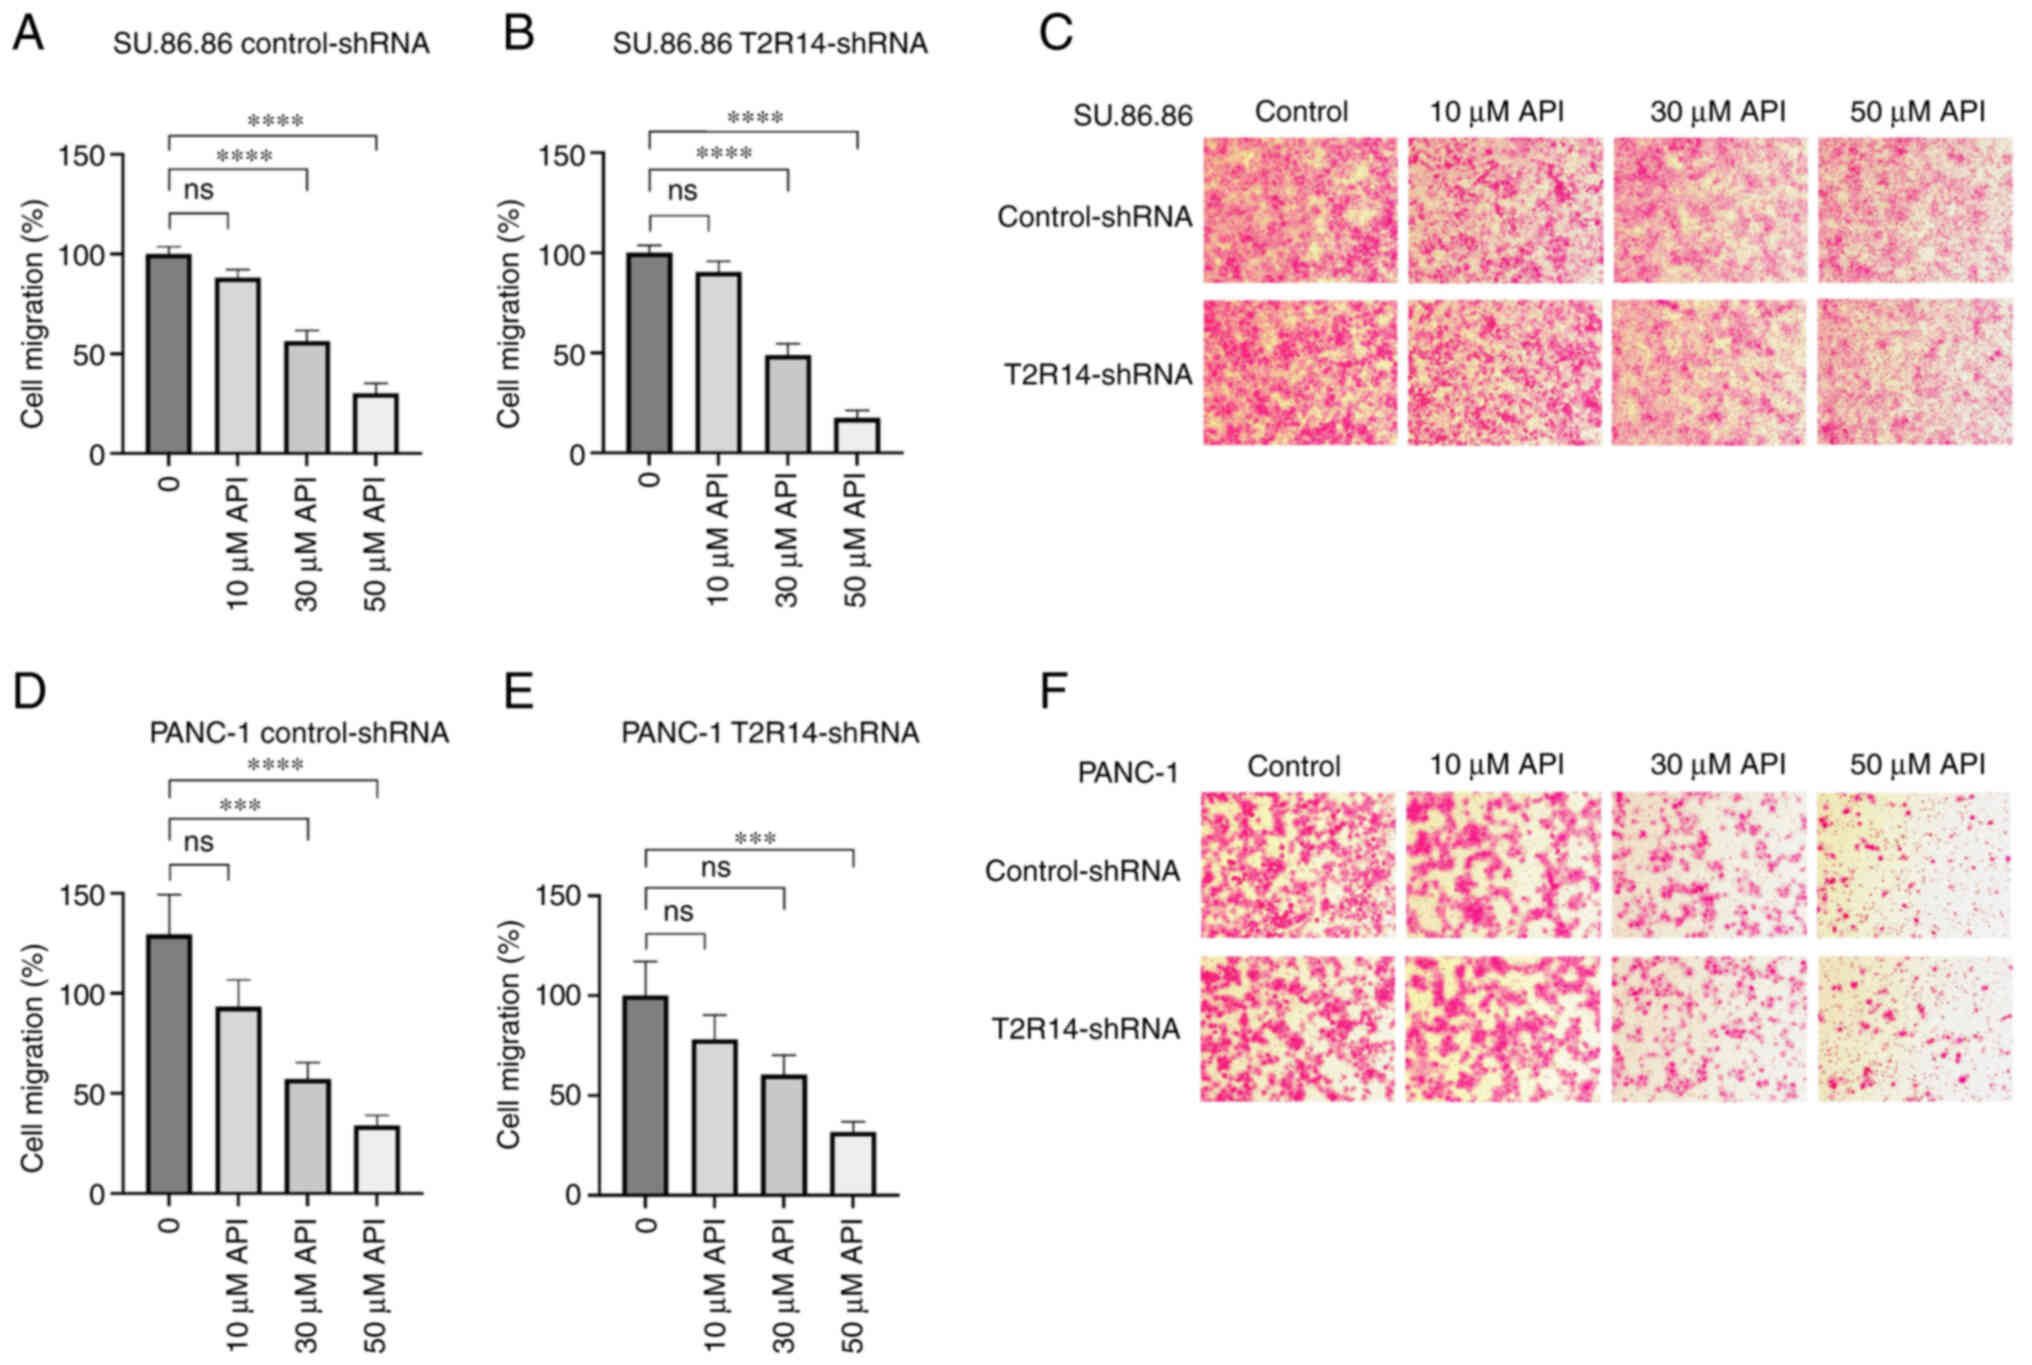
Apigenin inhibits cell migration
independent of T2R14 activation
A previous study on PDAC cell lines have reported
the inhibitory effects of apigenin on migration (46). To evaluate whether T2R14 mediated
these effects in SU.86.86 and PANC-1 cells, a migration assay was
carried out following treatment with a range of concentrations of
apigenin. In both SU.86.86 and PANC-1 cells, apigenin inhibited
migration in a concentration-dependent manner. Again, apigenin was
applied at a concentration (10 µM) that had previously been
shown to induce no relevant cytotoxic effect on SU.86.86 or PANC-1
cells. In the presence of 10 µM apigenin, cell migration was
slightly reduced; however, not to a statistically significant level
(Fig. 8). Further increasing the
concentration of apigenin to 30 and 50 µM resulted in a
significant decrease in cell migration by 51% (P<0.001) and 68%
(P<0.0001) for PANC-1 cells, and 44% (P<0.0001) and 70%
(P<0.0001) for SU.86.86 cells, respectively (Fig. 8A and D). However, at these
concentrations, cytotoxic side effects contributing to the reduced
number of migrating cells cannot be ruled out conclusively.
Silencing T2R14 did not affect the anti-migratory effects induced
by apigenin, neither in PANC-1 or in SU.86.86 cells (Fig. 8B and E).
Discussion
Pancreatic cancer remains a fatal disease with a
lack of sufficient systemic treatment options due to early and
aggressive progression, late diagnosis and intrinsic
chemoresistance (2,4). To overcome the obstacle of
chemoresistance, combination treatment approaches have been
intensively studied with the aim of improving therapeutic efficacy.
In this context, beyond the regularly used cytotoxic agents,
various bitter compounds have been reported to exhibit
chemosensitizing effects through signaling via T2Rs (7-9).
T2Rs have recently emerged as potential therapeutic targets in the
context of anticancer therapy (13,14).
The present study aimed to investigate whether a certain type of
T2R, namely T2R14, was expressed in PDAC and to assess its
functional abilities. To test this hypothesis, the expression of
T2R14 was detected in PDAC tissues and pancreatic cancer-derived
cell lines. Subsequently, the low toxicity T2R agonist apigenin was
used, which has been reported to exert anticancer effects on
pancreatic tumor cells, albeit via as yet unknown mechanisms
(31,33-36).
The present study demonstrated that T2R14 was
expressed in PDAC tissue, and also in cell lines derived from
primary or metastatic tumors. All tumor samples were revealed to be
T2R14 positive. In contrast to previous reports on other members of
the T2R family in PDAC, namely T2R10 and T2R38 (15,17),
T2R14 was present in normal pancreatic tissue, precursor lesions
and pancreatic cancer. Furthermore, patients with PDAC and with
relatively high T2R14 expression displayed a significantly longer
survival time compared with that of patients with low T2R14
expression, suggesting a functional role for T2R14 in PDAC.
To investigate the potential effects of T2R14
activation on PDAC, two pancreatic cancer cell lines with the
highest expression levels of T2R14, but differing in their origin,
were chosen: PANC-1, a cell line derived from primary PDAC in the
head of the pancreas (47), and
SU.86.86, which was initially obtained from a liver metastasis of
pancreatic cancer (48). In both
cell lines, apigenin inhibited cell viability in a dose-dependent
manner. Furthermore, the presence of apigenin significantly
enhanced the responsiveness of SU.86.86 cells to FOLFIRINOX and
5-FU in a synergistic manner; however, the chemoresponsiveness of
cells to gemcitabine was not affected. To the best of our
knowledge, the present study is the first to show the
chemosensitizing effects of apigenin towards 5-FU and FOLFIRINOX in
a pancreatic cancer cell line. FOLFIRINOX was first introduced to
clinical practice in 2010 and has since rapidly emerged as the
standard treatment option for patients with PDAC due to its
superior response rates compared with previously established
chemotherapeutic regimens (6,49).
In PANC-1 cells, no substantial modulation of chemoresistance was
detected. This may result from the fact that PANC-1 cells display a
very high intrinsic chemoresistance compared with other cell lines
(17).
To assess whether the effects of apigenin were
mediated by T2R14, the expression of T2R14 was silenced via the
transduction of cells with shRNA-containing lentiviral particles.
The knockdown of T2R14 did not modify the cytotoxic or
antimigratory activity of apigenin. Furthermore, apigenin-induced
chemosensitization in SU.86.86 cells was not fully dependent on
T2R14 expression. However, there was a reduced synergistic effect
between apigenin and FOLFIRINOX or 5-FU in SU.86.86 cells in which
T2R14 expression was silenced compared with that in the
control-shRNA-transduced cells. Notably, T2R14-shRNA transduction
resulted in incomplete knockdown of T2R14; therefore, the remaining
T2R14 may still have participated. Whilst this is a possibility,
the results suggested that alternative signaling pathways of
apigenin independent of T2R14 may also be involved, since apigenin
has other biotargets. In particular, apigenin has been reported to
activate another T2R subtype, T2R39 (28), which is not expressed in PDAC
tissue according to our own not yet published data. Recently, the
effects of apigenin were assessed on all human T2Rs; this previous
study confirmed that it could activate T2R14, but not T2R39, and
identified T2R43 as the only additional T2R activated by apigenin
(50). However, T2R43 was
activated by 30 µM apigenin and not by 10 µM, which
is the concentration that was used in the present study. In
addition, several other mechanisms underlying the antiproliferative
and chemosensitizing effects of apigenin have been proposed in
previous studies: In PDAC, apigenin has been reported to inhibit
the activation of NF-κB, HIF-1α and AKT (37,38,51,52),
all of which are involved in key oncogenic signaling pathways that
are relevant to chemoresistance (18,53).
Moreover, apigenin has been shown to induce cell cycle arrest and
apoptosis via activation of the oncosupressor gene p53 (36). Thus, T2R14 may synergize with
multiple mechanisms to induce chemosensitizing effects.
For various natural bitter compounds exhibiting
chemosensitizing effects, the modulation of ABC transporters has
been proposed as a common molecular mechanism. Notably, xanthines
have been reported to downregulate ABCG2 in breast cancer and
choriocarcinoma cell lines (7).
Similarly, bitter melon extract has been shown to reduce the
expression of ABCG2 and increase the efflux of doxorubicin in colon
cancer cells (8). In line with
this, our previous studies demonstrated that T2R10 and T2R38 could
affect ABCG2 and ABCB1 in pancreatic adenocarcinoma cell lines, as
determined following activation with their respective natural
bitter agonists (15,17). Therefore, we tested the expression
of multiple ABC transporters in response to the T2R14 agonist
apigenin; however, no significant change in expression levels was
found (data not shown). An investigation of potential alternative
downstream targets of T2R14 is required to gain a better
understanding of the underlying molecular mechanisms. Studying
cells overexpressing T2R14 could also potentially provide
additional information on the involvement of T2R14 in
apigenin-induced effects. Furthermore, a major challenge in
applying natural compounds as chemosensitizing treatments is to
achieve a biologically active concentration at the target site.
Therefore, despite the good bioavailability and low toxicity of
apigenin it remains to be determined as to whether a sufficient
concentration can be reached in the pancreas of human patients
(29,54). In addition to that, the exact serum
level of the different components of the multi-component treatment
FOLFIRINOX are not well studied and could differ from the in
vitro conditions established in a previous study (55). Therefore, in vivo
experiments are required to gain a better understanding and confirm
these in vitro data. Furthermore, testing the relationship
between T2R14 expression in PDAC and responsiveness to chemotherapy
in patients could be informative for evaluating the clinical impact
of the in vitro findings described in this study.
In conclusion, to the best of our knowledge, the
present study is the first to detect T2R14 expression in PDAC, both
at the mRNA and protein levels. Notably, the findings of prolonged
survival in patients with relatively high T2R14 expression,
compared with that of patients with low T2R14 expression, strongly
suggested a functional role of T2R14 in pancreatic cancer.
Furthermore, the known T2R14 agonist, apigenin, was shown to elicit
cytotoxic, anti-migratory and chemosensitizing effects on
pancreatic cancer cells; however, this was not exclusively
dependent on T2R14 expression. Therefore, identifying other
possible involvements of T2R14 in PDAC requires further study.
Supplementary Data
Availability of data and materials
The datasets used and/or analyzed during the
current study are available from the corresponding author on
reasonable request.
Authors' contributions
LS mainly conceived the study, analyzed the data,
and wrote and edited the manuscript. MMG and TG made substantial
contributions to the conception and design of the study, and
critically reviewed and edited the manuscript. LFB performed the
majority of the experiments, contributed to the conception and
design of the study and edited the manuscript. AG and TZ assisted
with the PCR. AH performed the immunohistochemistry. SH made
substantial contributions to tissue acquisition and assisted in
interpretation of data. NG and TH provided access to expression
data and were involved in data interpretation and revision of the
manuscript critically for important intellectual content. JRI, MR,
CG, MRG, CN, RF and MYN assisted in data interpretation and revised
the article critically. All authors have read and approved the
final manuscript. LS and LFB confirm the authenticity of all the
raw data.
Ethics approval and consent to
participate
The present study was approved by the ethics
committee of the University Medical Center Mainz (approval mo.
2019-14390; Rhineland-Palatinate Medical Association) and written
informed consent was obtained from all patients.
Patient consent for publication
Not applicable.
Competing interests
The authors declare that they have no competing
interest.
Acknowledgments
The authors would like to thank Ms. Bonny Adami,
Institute of Pathology, University Medical Center Mainz for
excellent technical support and gratefully acknowledge Professor
Maria Hänsch, Institute of Immunology, University Hospital of
Heidelberg for critical reading of the manuscript. The authors also
thank the UKE Light Microscopy Facility for providing the Leica TCS
SP5 and induction into confocal microscopy.
Funding
The authors gratefully acknowledge funding by a grant from the
Roggenbuck-Stiftung to LS. The funders had no role in study design,
data analysis or preparation of the manuscript. The work of MMG was
supported by the German Research Foundation (grant nos. GA1818 2-3
and SFB1292 Project Number 318346496, TPQ1 and TP22).
References
|
1
|
Siegel RL, Miller KD, Fuchs HE and Jemal
A: Cancer statistics, 2022. CA Cancer J Clin. 72:7–33. 2022.
|
|
2
|
Spadi R, Brusa F, Ponzetti A, Chiappino I,
Birocco N, Ciuffreda L and Satolli MA: Current therapeutic
strategies for advanced pancreatic cancer: A review for clinicians.
World J Clin Oncol. 7:27–43. 2016.
|
|
3
|
Neoptolemos JP, Ghaneh P and Hackert T:
Multimodality standard of care treatment of resectable and
borderline resectable pancreatic cancer. Hepatobiliary Surg Nutr.
10:714–716. 2021.
|
|
4
|
Wang Z, Li Y, Ahmad A, Banerjee S, Azmi
AS, Kong D and Sarkar FH: Pancreatic cancer: Understanding and
overcoming chemoresistance. Nat Rev Gastroenterol Hepatol. 8:27–33.
2011.
|
|
5
|
Ducreux M, Cuhna AS, Caramella C,
Hollebecque A, Burtin P, Goéré D, Seufferlein T, Haustermans K, Van
Laethem JL, Conroy T, et al: Cancer of the pancreas: ESMO clinical
practice guidelines for diagnosis, treatment and follow-up. Ann
Oncol. 26(Suppl 5): v56–v68. 2015.
|
|
6
|
Conroy T, Hammel P, Hebbar M, Abdelghani
MB, Wei AC, Raoul JL, Choné L, Francois E, Artru P, Biagi JJ, et
al: FOLFIRINOX or gemcitabine as adjuvant therapy for pancreatic
cancer. N Engl J Med. 379:2395–2406. 2018.
|
|
7
|
Ding R, Shi J, Pabon K and Scotto KW:
Xanthines down-regulate the drug transporter ABCG2 and reverse
multidrug resistance. Mol Pharmacol. 81:328–337. 2012.
|
|
8
|
Kwatra D, Venugopal A, Standing D,
Ponnurangam S, Dhar A, Mitra A and Anant S: Bitter melon extracts
enhance the activity of chemotherapeutic agents through the
modulation of multiple drug resistance. J Pharm Sci. 102:4444–4454.
2013.
|
|
9
|
Lyn-Cook BD, Rogers T, Yan Y, Blann EB,
Kadlubar FF and Hammons GJ: Chemopreventive effects of tea extracts
and various components on human pancreatic and prostate tumor cells
in vitro. Nutr Cancer. 35:80–86. 1999.
|
|
10
|
Behrens M and Meyerhof W: Bitter taste
receptors and human bitter taste perception. Cell Mol Life Sci.
63:1501–1509. 2006.
|
|
11
|
Adler E, Hoon MA, Mueller KL,
Chandrashekar J, Ryba NJ and Zuker CS: A novel family of mammalian
taste receptors. Cell. 100:693–702. 2000.
|
|
12
|
Meyerhof W, Batram C, Kuhn C, Brockhoff A,
Chudoba E, Bufe B, Appendino G and Behrens M: The molecular
receptive ranges of human TAS2R bitter taste receptors. Chem
Senses. 35:157–170. 2010.
|
|
13
|
Zehentner S, Reiner AT, Grimm C and Somoza
V: The role of bitter taste receptors in cancer: A systematic
review. Cancers (Basel). 13:58912021.
|
|
14
|
Jeruzal-Swiatecka J, Fendler W and
Pietruszewska W: Clinical role of extraoral bitter taste receptors.
Int J Mol Sci. 21:51562020.
|
|
15
|
Gaida MM, Mayer C, Dapunt U, Stegmaier S,
Schirmacher P, Wabnitz GH and Hänsch GM: Expression of the bitter
receptor T2R38 in pancreatic cancer: Localization in lipid droplets
and activation by a bacteria-derived quorum-sensing molecule.
Oncotarget. 7:12623–12632. 2016.
|
|
16
|
Gottesman MM, Fojo T and Bates SE:
Multidrug resistance in cancer: Role of ATP-dependent transporters.
Nat Rev Cancer. 2:48–58. 2002.
|
|
17
|
Stern L, Giese N, Hackert T, Strobel O,
Schirmacher P, Felix K and Gaida MM: Overcoming chemoresistance in
pancreatic cancer cells: Role of the bitter taste receptor T2R10. J
Cancer. 9:711–725. 2018.
|
|
18
|
Vivanco I and Sawyers CL: The
phosphatidylinositol 3-kinase AKT pathway in human cancer. Nat Rev
Cancer. 2:489–501. 2002.
|
|
19
|
Mundi PS, Sachdev J, McCourt C and
Kalinsky K: AKT in cancer: New molecular insights and advances in
drug development. Br J Clin Pharmacol. 82:943–956. 2016.
|
|
20
|
Mo W and Zhang JT: Human ABCG2: Structure,
function, and its role in multidrug resistance. Int J Biochem Mol
Biol. 3:1–27. 2012.
|
|
21
|
Doyle L and Ross DD: Multidrug resistance
mediated by the breast cancer resistance protein BCRP (ABCG2).
Oncogene. 22:7340–7358. 2003.
|
|
22
|
Medapati MR, Singh N, Bhagirath AY, Duan
K, Triggs-Raine B, Batista EL Jr and Chelikani P: Bitter taste
receptor T2R14 detects quorum sensing molecules from cariogenic
Streptococcus mutans and mediates innate immune responses in
gingival epithelial cells. FASEB J. 35:e213752021.
|
|
23
|
Medapati MR, Bhagirath AY, Singh N,
Schroth RJ, Bhullar RP, Duan K and Chelikani P: Bitter taste
receptor T2R14 modulates gram-positive bacterial internalization
and survival in gingival epithelial cells. Int J Mol Sci.
22:99202021.
|
|
24
|
Hariri BM, McMahon DB, Chen B, Freund JR,
Mansfield CJ, Doghramji LJ, Adappa ND, Palmer JN, Kennedy DW, Reed
DR, et al: Flavones modulate respiratory epithelial innate
immunity: Anti-inflammatory effects and activation of the T2R14
receptor. J Biol Chem. 292:8484–8497. 2017.
|
|
25
|
Singh N, Chakraborty R, Bhullar RP and
Chelikani P: Differential expression of bitter taste receptors in
non-cancerous breast epithelial and breast cancer cells. Biochem
Biophys Res Commun. 446:499–503. 2014.
|
|
26
|
Singh N, Shaik FA, Myal Y and Chelikani P:
Chemosensory bitter taste receptors T2R4 and T2R14 activation
attenuates proliferation and migration of breast cancer cells. Mol
Cell Biochem. 465:199–214. 2020.
|
|
27
|
Carey RM, Kim T, Cohen NA, Lee RJ and Nead
KT: Impact of sweet, umami, and bitter taste receptor (TAS1R and
TAS2R) genomic and expression alterations in solid tumors on
survival. Sci Rep. 12:89372022.
|
|
28
|
Dagan-Wiener A, Di Pizio A, Nissim I,
Bahia MS, Dubovski N, Margulis E and Niv MY: BitterDB: Taste
ligands and receptors database in 2019. Nucleic Acids Res.
47:D1179–D1185. 2019.
|
|
29
|
Meyer H, Bolarinwa A, Wolfram G and
Linseisen J: Bioavailability of apigenin from apiin-rich parsley in
humans. Ann Nutr Metab. 50:167–172. 2006.
|
|
30
|
Hostetler GL, Ralston RA and Schwartz SJ:
Flavones: Food sources, bioavailability, metabolism, and
bioactivity. Adv Nutr. 8:423–435. 2017.
|
|
31
|
Zhang J, Liu D, Huang Y, Gao Y and Qian S:
Biopharmaceutics classification and intestinal absorption study of
apigenin. Int J Pharm. 436:311–317. 2012.
|
|
32
|
Birt DF, Walker B, Tibbels MG and Bresnick
E: Anti-mutagenesis and anti-promotion by apigenin, robinetin and
indole-3-carbinol. Carcinogenesis. 7:959–963. 1986.
|
|
33
|
Imran M, Gondal TA, Atif M, Shahbaz M,
Qaisarani TB, Mughal MH, Salehi B, Martorell M and Sharifi-Rad J:
Apigenin as an anticancer agent. Phytother Res. 34:1812–1828.
2020.
|
|
34
|
Ashrafizadeh M, Bakhoda MR, Bahmanpour Z,
Ilkhani K, Zarrabi A, Makvandi P, Khan H, Mazaheri S, Darvish M and
Mirzaei H: Apigenin as tumor suppressor in cancers: Biotherapeutic
activity, nanodelivery, and mechanisms with emphasis on pancreatic
cancer. Front Chem. 8:8292020.
|
|
35
|
Ujiki MB, Ding XZ, Salabat MR, Bentrem DJ,
Golkar L, Milam B, Talamonti MS, Bell RH Jr, Iwamura T and Adrian
TE: Apigenin inhibits pancreatic cancer cell proliferation through
G2/M cell cycle arrest. Mol Cancer. 5:762006.
|
|
36
|
King JC, Lu QY, Li G, Moro A, Takahashi H,
Chen M, Go VLW, Reber HA, Eibl G and Hines OJ: Evidence for
activation of mutated p53 by apigenin in human pancreatic cancer.
Biochim Biophys Acta. 1823:593–604. 2012.
|
|
37
|
Strouch MJ, Milam BM, Melstrom LG, McGill
JJ, Salabat MR, Ujiki MB, Ding XZ and Bentrem DJ: The flavonoid
apigenin potentiates the growth inhibitory effects of gemcitabine
and abrogates gemcitabine resistance in human pancreatic cancer
cells. Pancreas. 38:409–415. 2009.
|
|
38
|
Lee SH, Ryu JK, Lee KY, Woo SM, Park JK,
Yoo JW, Kim YT and Yoon YB: Enhanced anti-tumor effect of
combination therapy with gemcitabine and apigenin in pancreatic
cancer. Cancer Lett. 259:39–49. 2008.
|
|
39
|
Nagtegaal ID, Odze RD, Klimstra D, Paradis
V, Rugge M, Schirmacher P, Washington KM, Carneiro F and Cree IA:
The 2019 WHO classification of tumours of the digestive system.
Histopathology. 76:182–188. 2020.
|
|
40
|
Allred DC, Harvey JM, Berardo M and Clark
GM: Prognostic and predictive factors in breast cancer by
immunohistochemical analysis. Mod Pathol. 11:155–168. 1998.
|
|
41
|
Livak KJ and Schmittgen TD: Analysis of
relative gene expression data using real-time quantitative PCR and
the 2(-Delta Delta C(T)) method. Methods. 25:402–408. 2001.
|
|
42
|
Singh N, Shaik FA, Myal Y and Chelikani P:
Chemosensory bitter taste receptors T2R4 and T2R14 activation
attenuates proliferation and migration of breast cancer cells. Mol
Cell Biochem. 465:199–214. 2020.
|
|
43
|
Cao SS and Zhen YS: Potentiation of
antimetabolite antitumor activity in vivo by dipyridamole and
amphotericin B. Cancer Chemother Pharmacol. 24:181–186. 1989.
|
|
44
|
Hebenstreit D, Fang M, Gu M, Charoensawan
V, van Oudenaarden A and Teichmann SA: RNA sequencing reveals two
major classes of gene expression levels in metazoan cells. Mol Syst
Biol. 7:4972011.
|
|
45
|
Wagner GP, Kin K and Lynch VJ: A model
based criterion for gene expression calls using RNA-seq data.
Theory Biosci. 132:159–164. 2013.
|
|
46
|
He J, Ning C, Wang Y, Huang H, Ge Y, Liu J
and Jiang Y: Natural plant flavonoid apigenin directly disrupts
Hsp90/Cdc37 complex and inhibits pancreatic cancer cell growth and
migration. J Functional Foods. 18:10–21. 2015.
|
|
47
|
Lieber M, Mazzetta J, Nelson-Rees W,
Kaplan M and Todaro G: Establishment of a continuous tumor-cell
line (panc-1) from a human carcinoma of the exocrine pancreas. Int
J Cancer. 15:741–747. 1975.
|
|
48
|
Drucker BJ, Marincola FM, Siao DY, Donlon
TA, Bangs CD and Holder WD Jr: A new human pancreatic carcinoma
cell line developed for adoptive immunotherapy studies with
lymphokine-activated killer cells in nude mice. In Vitro Cell Dev
Biol. 24:1179–1187. 1988.
|
|
49
|
Lambert A, Gavoille C and Conroy T:
Current status on the place of FOLFIRINOX in metastatic pancreatic
cancer and future directions. Therap Adv Gastroenterol. 10:631–645.
2017.
|
|
50
|
Margulis E, Slavutsky Y, Lang T, Behrens
M, Benjamini Y and Niv MY: BitterMatch: Recommendation systems for
matching molecules with bitter taste receptors. J Cheminform.
14:452022.
|
|
51
|
Melstrom LG, Salabat MR, Ding XZ, Milam
BM, Strouch M, Pelling JC and Bentrem DJ: Apigenin inhibits the
GLUT-1 glucose transporter and the phosphoinositide 3-kinase/Akt
pathway in human pancreatic cancer cells. Pancreas. 37:426–431.
2008.
|
|
52
|
Wu DG, Yu P, Li JW, Jiang P, Sun J, Wang
HZ, Zhang LD, Wen MB and Bie P: Apigenin potentiates the growth
inhibitory effects by IKK-β-mediated NF-κB activation in pancreatic
cancer cells. Toxicol Lett. 224:157–164. 2014.
|
|
53
|
Li Q, Yang G, Feng M, Zheng S, Cao Z, Qiu
J, You L, Zheng L, Hu Y, Zhang T and Zhao Y: NF-kappaB in
pancreatic cancer: Its key role in chemoresistance. Cancer Lett.
421:127–134. 2018.
|
|
54
|
Kashyap P, Shikha D, Thakur M and Aneja A:
Functionality of apigenin as a potent antioxidant with emphasis on
bioavailability, metabolism, action mechanism and in vitro and in
vivo studies: A review. J Food Biochem. 46:e139502022.
|
|
55
|
Deyme L, Barbolosi D and Gattacceca F:
Population pharmacokinetics of FOLFIRINOX: A review of studies and
parameters. Cancer Chemother Pharmacol. 83:27–42. 2019.
|
|
56
|
Brierley JD, Gospodarowicz MK, Wittekind
C, et al: The TNM classification of malignant tumours 8. Oxford:
Wiley Blackwell; 2017
|