


Activated KRAS reprograms neural progenitor cells to glioma stem cell‑like phenotype
- Authors:
- Published online on: June 16, 2023 https://doi.org/10.3892/ijo.2023.5536
- Article Number: 88
-
Copyright: © Qin et al. This is an open access article distributed under the terms of Creative Commons Attribution License.
Abstract
Introduction
Glioma, the most common primary tumor of the human central nervous system, is characterized by rapid proliferation and invasion of surrounding tissues and has a poor prognosis (1,2). In 2020, there were 19.3 million novel cases of tumors worldwide, of which 1.6% were brain and other central nervous system tumors (3). More than two-thirds of adults diagnosed with glioblastoma, the most aggressive type of glioma, will die within 2 years of diagnosis (4). Intratumoral heterogeneity is considered the primary reason for treatment failure in glioma (5). Increasing evidence suggests that glioma stem cells (GSCs) are responsible for tumor initiation, drug resistance, and relapse in glioma (6-8). Regarding the cellular origin of GSCs, some studies have reported that GSCs may originate from dedifferentiation of mature non-stem cells (9-12). However, much published work suggests that they may arise from the transformation of normal neural progenitor cells (NPCs) (13-15). As GSCs share typical features with NPCs, such as expression of stem cell markers, self-renewal and the ability to differentiate into multiple lineages, it is hypothesized that GSCs are transformed from normal NPCs (16-19). Moreover, mouse tumor models have shown that glioma is derived from neural stem/progenitor cells (16-18). However, the underlying mechanisms of neoplastic transformation in normal NPCs are unknown.
Glioma is caused by multiple genetic and epigenetic alterations that affect intracellular signal transduction pathways, leading to cell transformation (16-20). Comprehensive whole-genome landscape analyses have shown that dysregulation of the Ras/Raf/MAPK pathway is the most common cluster of genomic lesions associated with glioma (21,22). Whether the key genes altered in the Ras/Raf/MAPK signaling pathway promote neoplastic transformation of NPCs needs to be investigated.
The use of human stem cells (SCs) and the development of gene editing technology have opened novel avenues for disease research (23-25). Human embryonic SCs (ESCs) are pluripotent SCs with the ability to differentiate into many types of cells in the body, including NPCs. NPCs self-renew and give rise to the three main cell types of the central system, neurons, astrocytes and oligodendrocytes (26,27). Although many genetic disease models have been developed using ESCs or induced pluripotent SCs (iPSCs), to the best of our knowledge, there are few SC-based human cancer models (28,29). The use of iPSCs and their derivatives, in which defined genetic alterations related to cancer are introduced, maybe a suitable strategy to investigate the cell neoplastic transformation for mechanistic studies and drug testing (16,25). Reports have highlighted the potential of reprogramming intracellular signaling, such as by decreasing PTEN and p53, increasing receptor tyrosine kinases (RTK) signaling to induce transformation of NPCs into GSCs or glioma tumor-initiating cell-like phenotypes (30-32). Similarly, Bian et al (33) created a model to study gliomagenesis by introducing the classical oncogenic mutations found in glioblastoma into cerebral organoids derived from iPSCs. These approaches help create more suitable models for studying GSCs initiation from normal NPCs in humans than those based on the induction of differentiated glioma cells to a GSC-like phenotype.
The present study introduced mutations in the Ras/Raf/MAPK pathway of ESCs by targeted gene editing to determine the possible mechanism of the neoplastic transformation of NPCs and aimed to establish a simple cellular model to study gliomagenesis.
Materials and methods
Antibodies
The following commercial primary antibodies were used: Anti-Nanog (R&D Systems, Inc.; cat. no. AF1997; 1:200), anti-CD133 (Abcam; cat. no. ab216323; 1:100), anti-KRAS (Sigma-Aldrich; Merck KGaA; cat. no. WH0003845M1; 1:1,000), anti-Sox2 (R&D Systems, Inc.; cat. no. MAB2018; 1:200), anti-paired box 6 (PAX6; Developmental Studies Hybridoma Bank, Inc.; 1:200), anti-Nestin (Millipore Sigma; cat. no. ABD69; 1:400), anti-Ki67 (BD Pharmingen; cat. no. 556003; 1:200), anti-Tuj (Sigma-Aldrich; Merck KGaA; cat. no. T8578; 1:200), anti-glial fibrillary acidic protein (GFAP; Sigma-Aldrich; Merck KGaA; cat. no. SAB4501162; 1:200), anti-human nuclei (Millipore Sigma; cat. no. MAB1281; 1:200), anti-microtubule associated protein 2 (MAP2; Millipore Sigma; cat. no. MAB3418; 1:200), anti-GAPDH (Proteintech; cat. no. 60004-1-Ig; 1:5,000) and anti-DAPI (Beyotime Biotechnology; cat. no. C1006). The following commercial secondary antibodies were used: Alex Fluor 488 (A21202) and Alexa Fluor 568 (both Thermo Fisher Scientific, Inc.; cat. no. A10042; both 1:500).
Cell culture
Human ESCs (H1 cells) were purchased from WiCell Research Institute (cat. no. WA01) and cultured as previously described (34,35). ESCs and ESCs carrying oncogenic gene alterations were cultured at 37°C under 5% CO2 in mTeSR1 medium (StemCell Technologies, Inc.) on Matrigel-coated (BD Biosciences) 6-well plates (Matrigel diluted 100-fold with DMEM/F12 and plates were coated for overnight at 37°C). Human glioma cell lines U251 and U118MG were obtained from the Cell Bank Type Culture Collection, Chinese Academy of Sciences (Shanghai, China). STR analysis of U118MG cell line is shown in Table SI. The glioma cell lines were cultured at 37°C under 5% CO2 in DMEM supplemented with 10% fetal bovine serum (both Gibco; Thermo Fisher Scientific, Inc.).
Generation of stable KRAS-, BRAF- or EGFR-overexpressing and PTEN knockdown ESCs
ESCs were routinely cultured on Matrigel-coated plates in mTeSR1 medium, as aforementioned. For lentiviral vectors expressing KRAS, BRAF or EGFR, the corresponding cDNA was cloned into the pSIN-EF2-Pur-FLAG-ENNSPC vector (gift from Dr Guangjin Pan, Guangzhou Institutes of Biomedicine and Health, Chinese Academy of Sciences, Guangzhou, China; Table SII). The lentiviral plasmids included the packaging plasmids psPAX2 (Addgene; cat. no. 12260) and pMD2.G (Addgene; cat. no. 12259). This method uses a second-generation system. Plasmids were extracted at a concentration of ~500 ng/µl and the ratio of lentivirus, packaging and envelope plasmids was 4:3:1. Lentiviruses were collected after transfection of 293T cells (American TCC) by calcium phosphate transfection kit (C0508, Beyotime, China) at 1% Penicillin/Streptomycin Solution and 37°C for 72 h. Infection was performed within 24 h of virus collection at a multiplicity of infection (MOI) of 50. Overexpression cell lines were screened with puromycin (5 µg/ml) for 48 h. The coding sequence for the mutant oncogene, KRASG13D, was obtained using the QuikChange Site-Directed Mutagenesis kit, according to the manufacturer's instructions (Agilent Technologies, Inc.; cat. no. 200518).
For generation of lentiviral vectors encoding short hairpin (sh) RNA targeting PTEN, the corresponding shRNA oligos (shRNA#1, TRCN0000002745; shRNA#2, TRCN0000002747 and shRNA#3, TRCN0000002749; sigmainformatics.com/Informatics_tools/batch-search.php#shRNA; Table SIII) were cloned into the pLKO.1-TRC vector (Sigma-Aldrich; Merck KGaA).
Generation of NPCs from ESCs
The induction of NPCs was based on a previous report (34). Briefly, 3×10⁵ wild-type and genetically modified ESCs were seeded onto Matrigel-coated 12-well plates in mTeSR1 medium. For inducing differentiation of ESCs to NPCs, these cells were cultured at 37°C under 5% CO2 in N2B27 medium [50% DMEM/F12, 50% Neurobasal, 0.5X N2, 0.5X B27, 1% Glutamax, 1% NEAA non-essential Amino acids) and 5 µg/ml insulin (all Gibco; Thermo Fisher Scientific, Inc.)], 1 µg/ml heparin (Sigma-Aldrich; Merck KGaA) and 5 µM SB431542 and dorsomorphin (both Selleck Chemicals). Medium was changed every 2 days. After 16 days, canonical neural rosettes appeared and were selected. Then, these neural rosettes were dissociated to single cells using Accutase (Sigma-Aldrich; Merck KGaA and termed NPCs. These NPCs (with 105/ml cell density) were cultured at 37°C under 5% CO2 in NPC medium (N2B27 medium and 20 ng/ml basic Fibroblast Growth Factor (bFGF) and EGF) and medium was changed every 2 days. NPCs were dissociated to single cells using Accutase (Sigma-Aldrich; Merck KGaA), and cells were cultured in 6-well plates at a ratio of 1:2 to obtain P1 generation cells.
Cell Counting Kit (CCK)-8 proliferation assay
NPCs (normal and transformed) were seeded in 96-well plates at a density of 1×10⁴ cells. One plate was tested daily. A total of 10 µl/well CCK-8 (Dojindo Laboratories, Inc.) was added and absorbance was detected directly by a microplate reader (Bio-Tek, Synergy H1, Inc.) at a wavelength of 450 nm following 1 h incubation. The mean value was calculated from five replicates and a growth curve was constructed. The experiment was repeated three times. The optical density, determined by relative absorbance of CCK-8, was evaluated by probit regression analysis in SPSS 13.0 (SPSS).
Reverse transcription-quantitative (RT-q) PCR analysis
Total RNA from cells was extracted with RNAiso Plus (#9109, Takara Bio, Inc.) and reverse-transcribed with oligo dT (37°C, 15 min for reverse transcription, 85°C for 5 sec for heat inactivation of reverse transcriptase, 4°C end) (Takara Bio, Inc.). qPCR was performed according to the TB Green Premix Ex kit (cat. no. RR420A, Takara Bio, Inc.). Thermocycling conditions (95°C for 10 sec, 58°C for 20 sec, 72°C for 15 sec and 32 cycles). 2−ΔΔCq quantification was performed as previously described (36). The expression levels of KRAS, BRAF, EGFR, PTEN, SOX2, OCT4, SOX1, PAX6 and NANOG genes were normalized to GAPDH and are shown as fold-change relative to the control sample. All data were measured in triplicate. All primer sequences are listed in Table SIV.
Single-cell clonal expansion assay
To determine the clonal expansion efficiency of NPCs (normal and transformed), 2,000 cells per well were seeded in a Matrigel-coated 6-well plate (Matrigel was diluted 100-fold with DMEM/F12 and coated plates overnight at 37°C) and cultured at 37°C under 5% CO2 until clear cell colonies (>50 cells and clones of diameter longer than 0.3 mm, confirmed by ImageJ software version 1.48, imagej.nih.gov/ij/) formed (~3 weeks). Colonies were fixed in 4% paraformaldehyde, washed three times with PBS, then stained with 2% crystalline violet for 30 min to determine relative colony numbers and finally counted manually under a 20× magnification bright-field microscope.
Cell migration assay
Migration of NPCs (normal and transformed) through Matrigel in vitro was performed as previously described (18). Briefly, the upper chamber of a Transwell chamber (24-well insert; pore size, 8 mm; Corning Costar, Inc.) precoated with diluted Matrigel (Matrigel:DMEM/F12=1:10; 37°C) was seeded with 5×10³ cells in 100 µl basal medium (50% DMEM/F12, 50% Neurobasal). Complete culture medium (600 µl; 50% DMEM/F12, 50% Neurobasal, 1x N2, 1x B27, 20 ng/ml bFGF, 20 ng/ml EGF) was added to the lower chamber. After 24 h at 37°C, the cells on the back of the upper chamber were fixed with 4% methanol for 20 min at 37°C and stained with 2% crystal violet for 30 min at 37°C. Cells that migrated through the Transwell were counted using ImageJ1 (National Institutes of Health, Inc.) under a light microscope (magnification of 100×).
Cell sorting by flow cytometry
U118MG and U251 cells were labelled with CD133/2 FITC antibody kit (cat. no. 130-113-746, Miltenyi Biotec GmbH) and CD133+ cells were directly sorted and analyzed by flow cytometry. The sorted CD133+ cells were cultured in DMEM/F12 (Gibco; Thermo Fisher Scientific, Inc.) containing 20 ng/ml each EGF and bFGF. All samples were run on a BD Accuri C6 (BD Biosciences) and were analyzed with FlowJo software (v.10; Tree Star, Inc.).
Western blotting
Total cell protein lysate was obtained using RIPA buffer (Beyotime Institute of Biotechnology) with proteinase and phosphatase inhibitor cocktails. Protein concentrations were determined by BCA. Gels (8%) were loaded with 10 µg protein per lane resolved by SDS-PAGE and transferred onto an Immobilon-PSQ Transfer Membrane (Merck KGaA). Blots were blocked with 5% skimmed milk powder for 1 h at 37°C and incubated with antibodies against GAPDH, KRAS, Nestin and CD133 overnight at 4°C. The secondary antibodies were then incubated at room temperature for 2 h. Wash three times using TBST containing Tween 20 (0.05%). Development was carried out with the ECL kit (Beyotime; P0018FM). Densitometry was performed using ImageJ software (version 1.48). All immunoblots were performed at least three times.
Cell metabolism measurement
Cellular oxidative phosphorylation and glycolysis were measured by real-time oxygen consumption rate (OCR) and extracellular acidification rate (ECAR) with the Seahorse Bioscience extracellular flux analyzer (XF96, Agilent Technologies Inc.) by measuring the OCR in real-time as described previously (37). Briefly, 15,000 NPC-control and NPC-KRASG13D cells were treated with PD098059 (MAPK inhibitor; 5 µM) 48 h at 37°C. Then cells were seeded in specific 96-well plates designed for XF96 in 80 µl of the NPC medium (N2B27 medium and 20 ng/ml bFGF and EGF) and incubated at 37°C overnight. Before measurements, cells were washed with unbuffered medium (XF base medium minimal DMEM (Agilent Technologies Inc.; cat. no. 13417002), 1% glutamine (Gibco; Thermo Fisher Scientific, Inc.), glucose (Agilent Technologies Inc.; 4.5 g/l), pH=7.4) once, immersed in 200 ml of unbuffered medium, and incubated in the absence of CO2 at 37°C for 1 h. The OCR and ECAR were measured in a typical 8-min cycle of the mix (2-4 min), dwell (2 min), and measure (2-4 min) as recommended by Seahorse Bioscience (Agilent Technologies Inc.). Add each of the following drugs at different time points: oligomycin, FCCP (Trifluoromethoxy carbonyl cyanide phenylhydrazone), antimycin, rotenone, and 2-DG (2-Deoxy-D-glucose; all Agilent Technologies Inc.; 1 µM). All samples were analyzed with GraphPad Prism 8 (GraphPad Software Inc.)
Reactive oxygen species (ROS) measurement
For reactive oxygen species (ROS) measurements, ROS production was measured with DCFH-DA reagent (Beyotime Biotechnology China Co., Ltd.; cat. no. S0033S). 105 cells were stained with DCFH-DA reagent (1:1,000, 10 µM) by adding the probe to the NPC medium (N2B27 medium and 20 ng/ml bFGF and EGF) and incubating the cells at 37°C for 30 min before analysis. All samples were run in a CytoFLEX flow cytometer (Beckman Coulter, Inc.) and were analyzed with FlowJo software (v.10; Tree Star, BD Biosciences Inc.).
In vivo tumor formation
A total of ten 4-week-old female BALB/c-nu/nu mice (12-14 g, Gempharmatech Co., Ltd) were housed (temperature at 18-22°C, relative humidity of 50-60%; 12/12 h light/dark cycle; ad libitum access to sterile food and water) in a pathogen-free animal facility. For each group (n=5), NPC-Ctrl or NPC-KRASG13D cells (2×10⁵ cells in 3 µl F12 medium (Gibco; Thermo Fisher Scientific, Inc.) with Matrigel were injected into the brain of mice. Intraperitoneal injection of 1% sodium pentobarbital (50 mg/kg) before cell transplantation. There are several previous studies in which induced GSC cells were transplanted into similar sites of the mouse brain (8,16,18,37) to evaluate the tumorigenic ability and biological behaviour of the transplanted cells in vivo. The cell injection site (2 mm lateral and 0.5 mm anterior to the bregma and 2.5 mm under the skull) was selected according to a previous report (37), in which glioma cells or GSCs were transplanted into the brain of mice at the same site.
Mice were monitored daily for the first 48 h to ensure that the wound was not exposed, then daily to observe changes in behaviour and body weight. Humane endpoints were as follows: Not eating or drinking for 24-48 h, resulting in wasting or dehydration; sustained or rapid weight loss of 20-25% or cachexia; persistent hypothermia and central nervous depression, tremors or paralysis, based on euthanasia criteria (China Laboratory animal Guidelines for euthanasia GB/T 39760-2021) (38). No significant weight loss due to cachexia was observed. Some mice injected with NPC-KRASG13D cells showed a slight delay in movement after 6 weeks. However, the behavioral changes were not sufficient to meet the humane endpoints.
At 8 weeks post-injection, the mice were euthanized by cervical dislocation. Death was confirmed by lack response to pain and pressure on the toes by hand or forceps and cessation of heartbeat and breathing. Mouse brains were dissected and fixed using 4% paraformaldehyde at 37°C for 12-14 h. Hematoxylin and eosin (H&E) and immunofluorescence staining were carried out on 5 µm sections. For H&E staining, tissue sections were processed at room temperature by dipping the slides in a series of baths as follow: distilled water (30 sec), hematoxylin (5 min); distilled water (1 min); 0.5% eosin Y (2 min); 95% Ethanol (30 sec; twice); 100% ethanol (30sx2); and xylene (30sx2). Neutral balsam mounting medium and glass cover slips were used to mount the slides. Slides were analyzed by using an upright light microscope (Olympus) at 10× and 20× magnification.
The present study was performed in accordance with the recommendations in the Guide for the Care and Use of Laboratory Animals of the National Institutes of Health (39). In addition, the protocol was approved by the Committee on the Ethics of Animal Experiments and Human Subject Research of Jinan University (Guangzhou, China; approval no. IACUC-20201027-08).
Transcriptome data processing and analysis
A total of 1×10⁶ cells (NPC-Ctrl, NPC-KRASG13D, U118MG-GSC, U251-GSC) were used for RNA isolation using Direct-zol RNA Mini Prep kit (Zymo Research Corp.). The resulting RNA was qualified by Fragment Analyzer (Advanced Analytical Systems, Inc.) and Prep kit (Illumina, Inc.) according to the manufacturer's protocol. Samples were run on a MiSeq and NextSeq 500 system with a MiSeq Reagent kit v2 (Illumina, Inc.; 50 cycles) and NextSeq 500/550 High Output v2 (150 cycles; Illumina, Inc.). For data analysis, the expression was measured in transcripts per million (TPM), which is independent of the mean expressed transcript length and is comparable across samples. Expression correlation was characterized by Pearson's correlation coefficient between TPM of all transcripts. Differentially expressed genes (DEGs) were identified using Cufflinks-Cuffdiff pipelines (cole-trapnell-lab.github.io/cufflinks/). Only genes with adjusted P-value <0.05 were considered as DEGs and used for further analysis. Clustering of genes was performed using the software program Cluster version 2.0.7 (https://cran.r-project.org/web/packages/cluster/index.html). The functional annotation tool DAVID version 6.5 (https://david.ncifcrf.gov/) was used for Gene Ontology (GO) (geneontology.org/) enrichment.
Generation of human brain organoids
Cerebral organoids were generated as described in a previous report (40) with minor modifications. Briefly, ESCs were seeded at 9,000 cells/well in an ultra-low attachment 96-well plate (Corning, Inc.; cat. no. 7007) and cultured at 37°C with 150 µl/well mTeSR1 medium mixed with Rho-associated kinase inhibitor Y-27632 (10 µM). On day 6, embryoid body-like aggregates were transferred to ultra-low attachment 24-well plates (Corning, Inc.; cat. no. 3473) containing neural induction medium (50% DMEM/F12, 50% Neurobasal, 1x N2, 1% Glutamax, 1% NEAA and 1 µg/ml heparin). On day 11, each organoid was embedded in Matrigel for 30 min at 37°C, collected in 6-cm dishes (10 organoids/dish) and cultured in COR media [50% DMEM/F12, 50% neurobasal, 1X N2, 1X B27 (without vitamin A; switched to B27 with vitamin A (Gibco; Thermo Fisher Scientific, Inc.) on day 15), 1% Glutamax, 1% NEAA and 0.025% insulin]. Organoids were cultured at 37°C on an orbital shaker until day 30. Organoids were fixed in 4% paraformaldehyde at 25°C overnight and treated in 20% sucrose overnight at 4°C. Organoids were embedded in optimal cutting temperature compound at 4°C overnight (Sakura Finetek USA, Inc., 4583) and cryosectioned (15 µm thickness) with a cryostat (Leica GmbH) for immunofluorescence staining.
Immunofluorescence staining
For cell immunostaining, cells were fixed with 4% paraformaldehyde in PBS for 15 min at room temperature. After fixation, cells were permeabilized with 0.4% Triton X-100 in PBS for 5 min at room temperature. Following incubation with 10% FBS (Gibco; Thermo Fisher Scientific, Inc.) or 10% BSA (Sigma-Aldrich; Merck KGaA; cat. no. V900933) in PBS for 30 min at room temperature, cells were incubated with primary antibody overnight at 4°C then were incubated with Alex Fluor 488/568-conjugated secondary antibodies at RT for 1 h. Following washing three times with PBS for 10 min each time, cells were counterstained with DAPI (Beyotime Biotechnology China Co., Ltd.) for 15 min at RT. Fluorescence images were captured by Zeiss LSM800 confocal microscope (Zeiss GmbH). The quantification of Tuj-, GFAP-, Nestin-, PAX6-and SOX2-positive cells were analyzed using Welch's t-test. To quantify the percentage of Tuj- and GFAP-positive cells, a semi-automated Cell Counter (ImageJ1, National Institutes of Health, Inc.) was utilized to count the number of nuclei and positive cells. Quantitation of cell immunofluorescent staining was performed using five randomly selected fields of view at 20× magnification.
For organoid immunostaining, sections were permeabilized for 10 min at room temperature in 0.5% Triton X-100-PBS and blocked for 45 min at room temperature with 5% donkey serum (Sigma-Aldrich; Merck KGaA; cat. no. D9663) in 0.01% Triton X-100-PBS. Sections were incubated overnight at 4°C with primary antibodies diluted in 2% donkey serum and 0.01% Triton X-100-PBS. Primary antibodies were as follows: Anti-SOX2 (1:200), anti-PAX6 (1:200), anti-Nestin (1:300), anti-Ki67 (1:100), mouse IgG1 Isotype Control (eBioscience; Thermo Fisher Scientific, Inc.; cat. no. 14-4714-82; 1:200), and Rat IgG2a Isotype Control (eBioscience, Thermo Fisher Scientific, Inc.; cat. no. 14-4321-82; 1:200). Fluorescence-conjugated secondary antibodies (1:500) were added for 1 h at room temperature. For nuclear staining, sections were incubated with DAPI for 10 min at room temperature. Images were acquired with a confocal microscope SP5 (magnification, 200×; Leica GmbH). To quantify the mean fluorescence intensity of Nestin-, PAX6-, SOX2- and Ki67-positive cells, ImageJ was used; quantification of organoid immunostaining was performed using ≥4 organoids in ten randomly selected fields of view.
Statistical analysis
Data are presented as the mean ± SD. Each experiment was performed three times. Data from two groups were compared using the unpaired Student's t-test (two-tailed, unequal variance); comparisons of >2 groups were performed using one- or two-way ANOVA with Bonferroni's post hoc test. Statistical comparisons were performed in GraphPad Prism 8 (GraphPad Software Inc.). P<0.05 was considered to indicate a statistically significant difference.
Results
Generation and characterization of NPCs derived from KRAS-activated ESCs
To investigate the role of the Ras/Raf/MAPK pathway in transformation of NPCs into GSCs, lentiviral plasmids, including overexpression of mutant KRAS (G13D mutation), BRAF and EGFR and PTEN silencing (shPTEN) were transferred individually or in combination into ESCs (Fig. S1A) to generate ESCs as follows: ESC-KRASG13D, ESC-BRAF-shPTEN, ESC-KRASG13D-shPTEN and ESC-BRAF-EGFR-shPTEN (Figs. 1A and S1B). The genetic alterations in PTEN, KARS, EGFR, and BRAF loci were successful, as shown by RT-qPCR (Fig. S1C) and overexpression of the KRAS protein in ESC-KRASG13D was confirmed by western blotting (Fig. 1B). These genetic alterations did not alter cell morphology or expression of pluripotency markers (Nanog, OCT4, and SOX2) in ESCs (Figs. 1A, C and D and S1D).
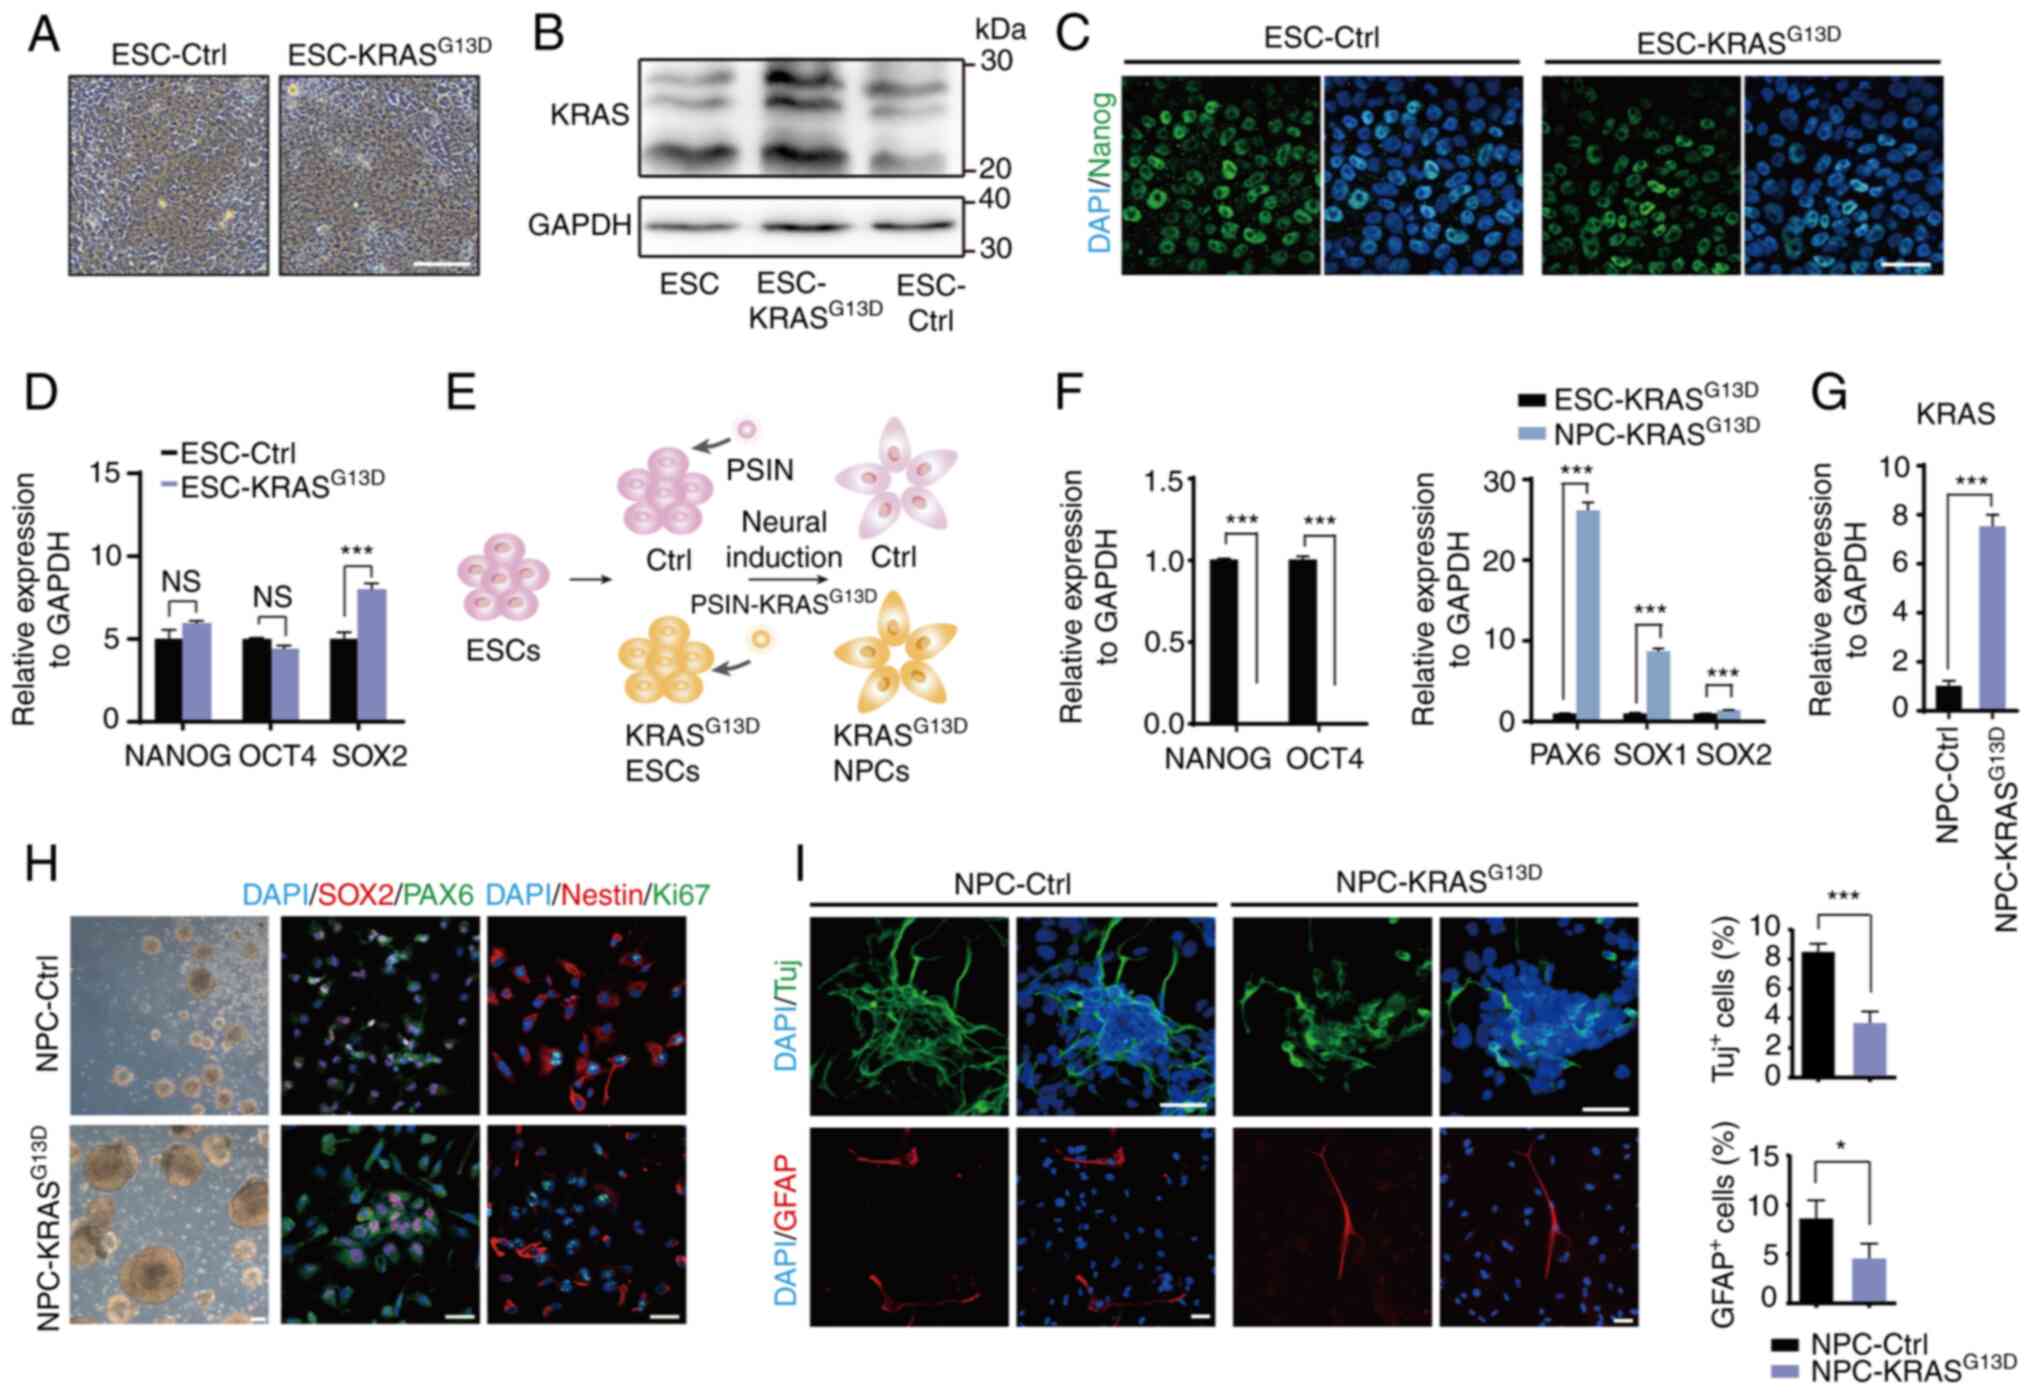
NPCs were derived from normal ESCs (ESC-Ctrl) and ESCs carrying oncogenic gene alterations (Figs. 1E and S1E). Immunofluorescence analysis showed that NPCs carrying oncogenic gene alterations expressed neural progenitor markers PAX6, SOX2 and Nestin (Figs. 1F and H and S1F). However, these NPCs also exhibited accelerated growth. Notably, NPC-KRASG13D exhibited the highest proliferative capacity among these cells (Fig. S2A). Activation of KRAS, decreased expression of pluripotent genes NANOG and OCT4, and increased expression of the neural SC genes PAX6, SOX1 and SOX2 were confirmed in NPC-KRASG13D cells (Figs. 1F and G and S3).
It was investigated whether KRAS-activated NPCs acquired neoplastic potential. NPC-KRASG13D, like NPC-Ctrl, had the ability to differentiate into neuronal and glial lineages but had a lower differentiation ability into neuronal lineages than NPC-Ctrl cells (Fig. 1I). NPCs carrying oncogenic gene alterations exhibited increased cell migration and clonal expansion. Among the NPCs carrying oncogenic gene alterations, NPC-KRASG13D exhibited the most significant increase in cell migration and clonal expansion compared with NPC-Ctrl (Fig. S2B-E). Overall, these in vitro experiments demonstrated that the KRAS mutation conferred neoplastic potential to NPCs.
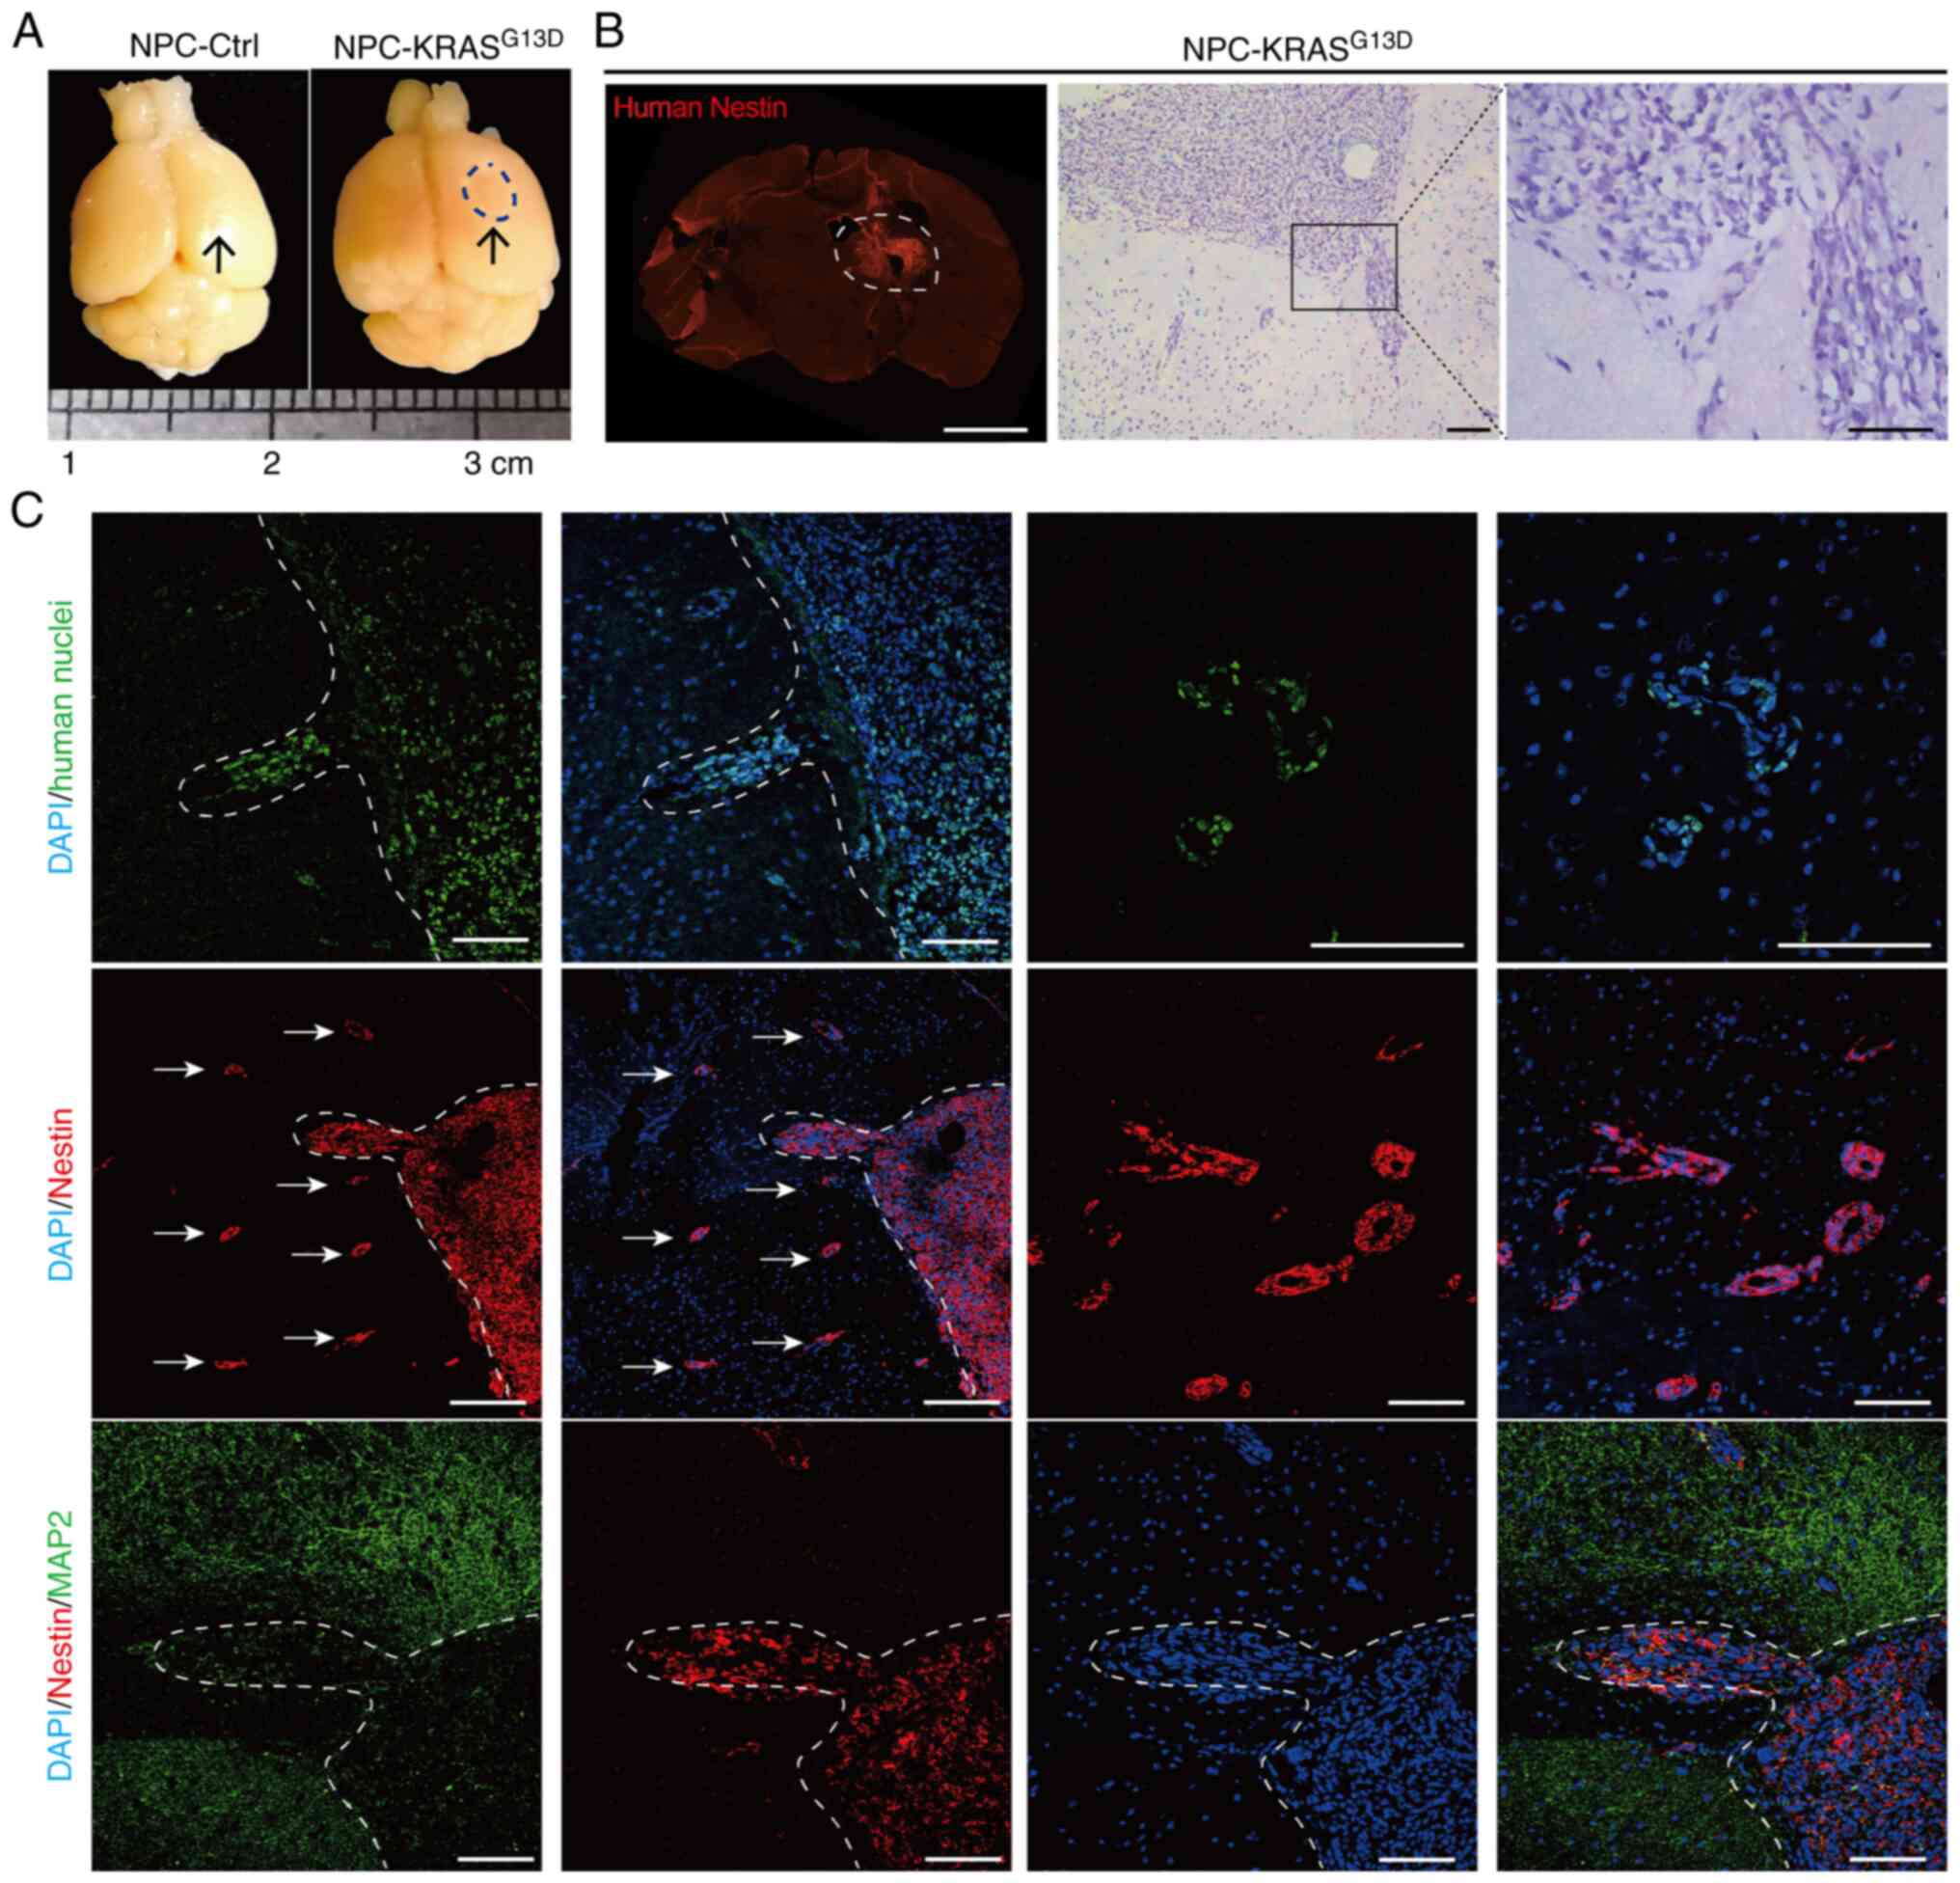
KRAS-activated NPCs demonstrate neoplastic potential in vivo
To investigate whether activated KRAS promotes neoplastic transformation of NPCs in vivo, NPC-Ctrl and NPC-KRASG13D were injected into the brain of immune compromised BALB/c-nu/nu mice. A local tumor-like growth was observed in the mouse brain transplanted with NPC-KRASG13D cells, whereas no expansive growth was observed in the control group (transplanted with NPC-Ctrl cells; Fig. 2A and B). Hematoxylin and eosin staining of brain sections showed that transplanted NPC-KRASG13D cells grew in clusters with disorganized cell arrangement and exhibited marked cell atypia with large cell size, enlarged nuclei, irregular nuclear morphology and pathological mitosis. Transplanted cells invaded the adjacent normal brain tissue and formed multiple foci (Fig. 2B). The observed histological characteristics and biological behavior were similar to those of intracranial tumors derived from the transplanted human GSCs. Immunofluorescence analysis showed that tumor-like cell clusters expressed Nestin, a marker for NPCs and GSCs (18), and that a few cells differentiated into MAP2-positive neuron-like cells (Fig. 2C).
KRAS-activated NPCs show GSC-like gene expression profiles
To identify neoplastic features of NPC-KRASG13D and investigate the effect of KRAS activation on the global transcriptomic landscape of NPCs, global gene expression patterns of normal NPCs (NPC-Ctrl), NPC-KRASG13D and GSCs isolated from glioma cell lines were profiled. According to previous reports (5,8,41,42), CD133 is considered a surface marker of GSC. Therefore, CD133+ cells were isolated from human glioma cell lines U118MG and U251 using flow cytometry (Fig. S4A). U118MG-GSC and U251-GSCs were characterized by increased expression of SC markers (CD133 and Nestin) compared with the U118MG and U251 glioma cell lines (Fig. S4B-D).
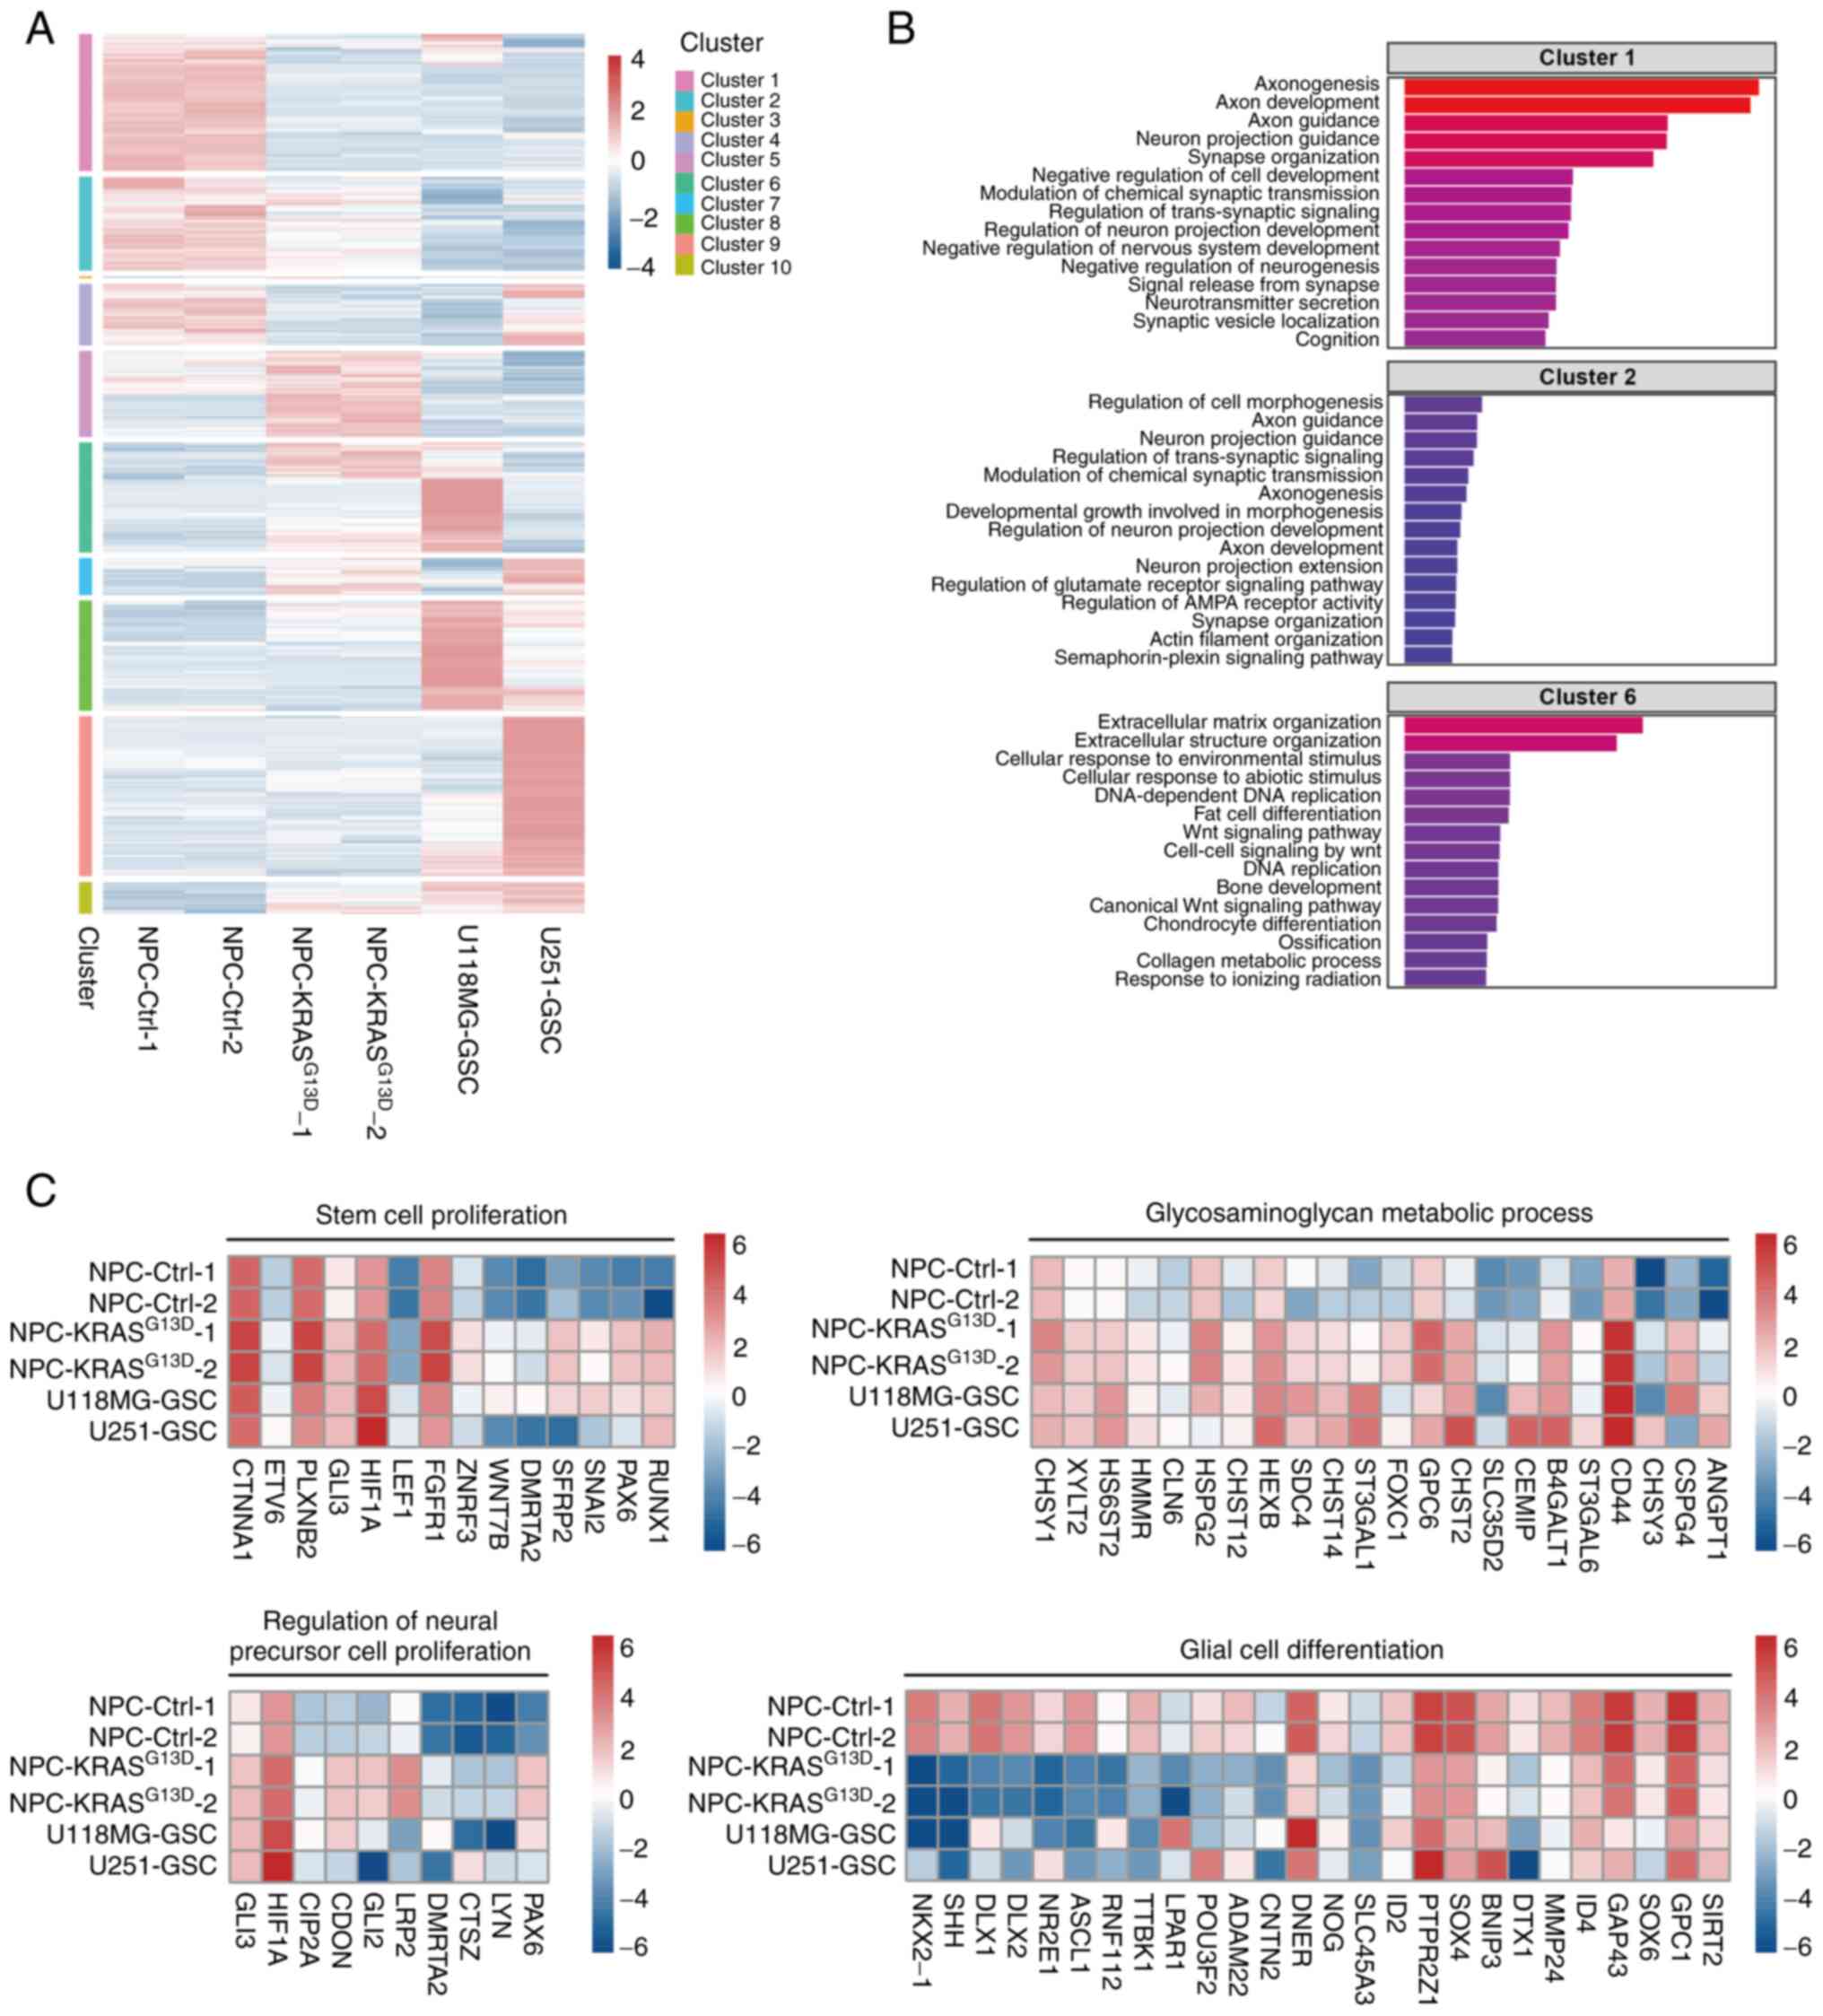
Cluster analysis was performed to compare gene expression profiles of NPC-Ctrl, NPC-KRASG13D and GSC cells (including U251-GSC and U118MG-GSC). The expression of DEGs was grouped into 10 clusters. Gene expression profile of NPC-KRASG13D showed more overlap with GSCs than with NPC-Ctrl (Fig. 3A). Based on the significant differences in gene expression patterns between GSCs and NPCs, the genes in clusters 1, 2 and 6 were selected. GO enrichment of clusters 1 and 2 showed lower gene expression levels in NPC-KRASG13D compared with NPC-Ctrl, while cluster 6 showed higher gene expression levels (Fig. 3B). Gene expression profiles of NPC-KRASG13D and GSCs showed similar expression of genes associated with 'stem cell proliferation, regulation of neural precursor cell proliferation, glycosaminoglycan metabolic process and glial cell differentiation' (Fig. 3C). In summary, gene profiles of NPC-KRASG13D were more similar to GSCs than those of NPC-Ctrl.
KRAS activation induces metabolic reprogramming in transformed NPCs
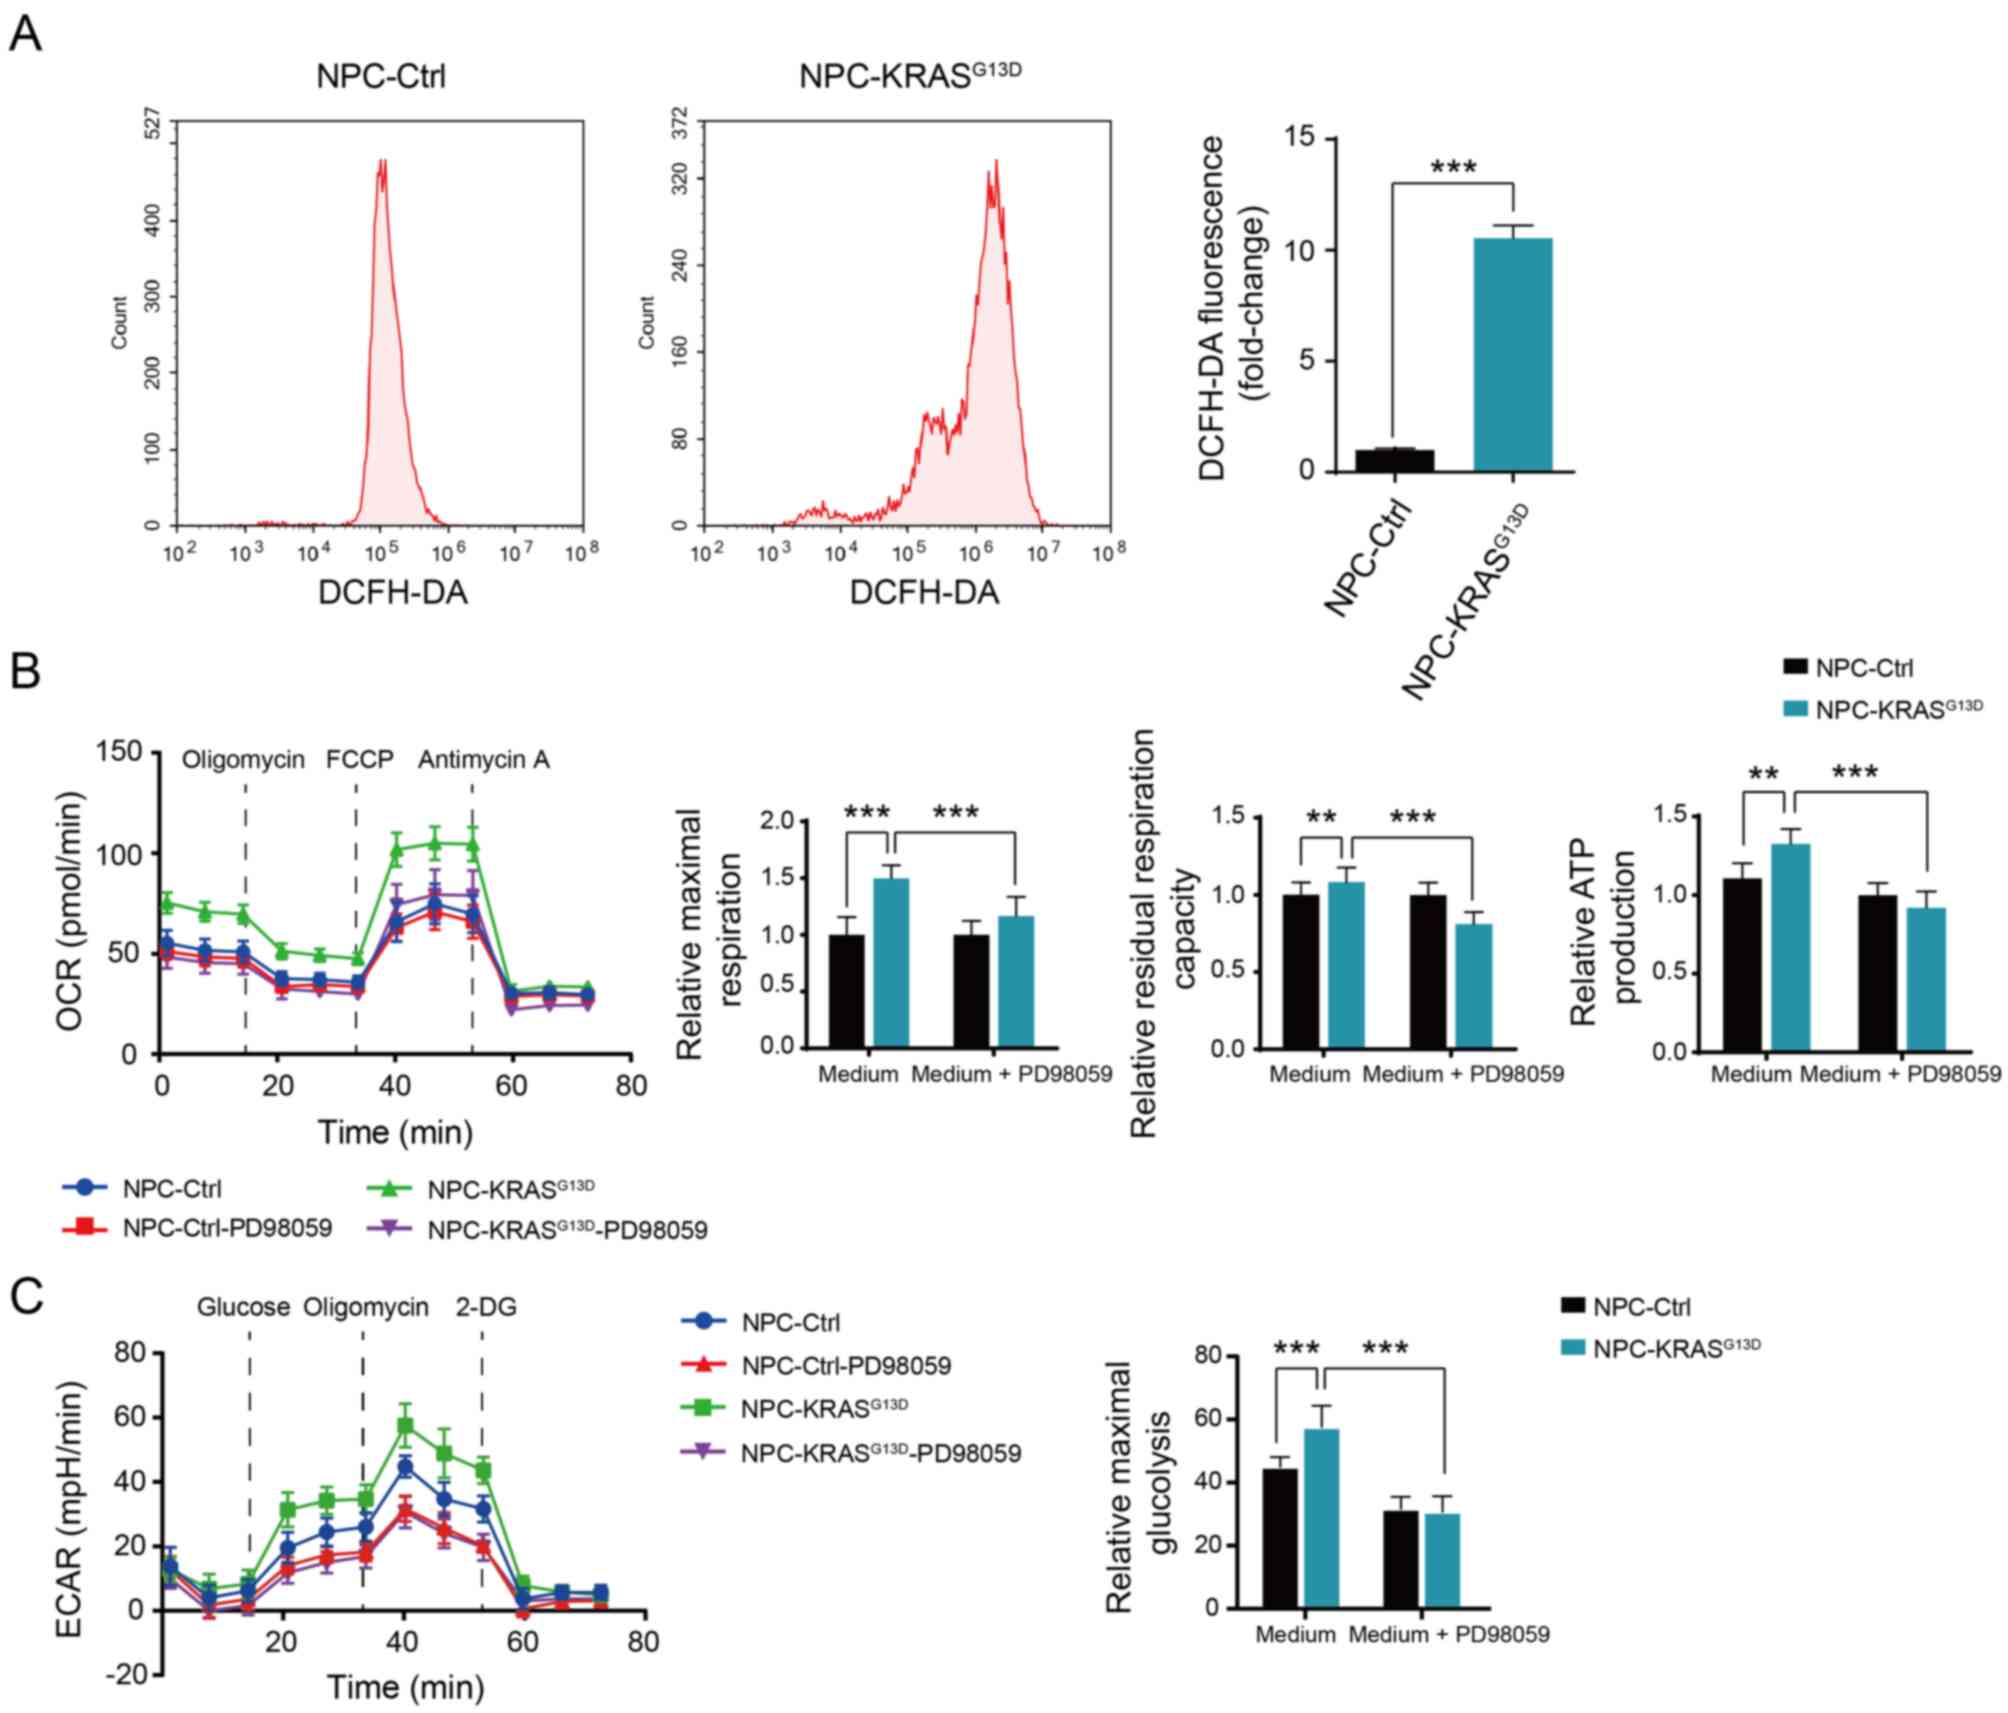
As tumor cells undergo metabolic reprogramming (37,43), the present study investigated the metabolic changes induced by KRAS activation in NPCs. Reactive oxygen species (ROS) levels were detected by DCFH-DA. ROS levels in NPC-KRASG13D cells were significantly higher than in NPC-Ctrl cells (Fig. 4A). Seahorse analysis showed increased oxidative metabolic and glycolytic capacity in NPC-KRASG13D, including ATP productivity, maximum and residual respiratory capacity and maximum glycolytic capacity compared with NPC-Ctrl, which were decreased following inhibition of MAPK pathway with PD098059 (Fig. 4B and C). These results suggest that activated KRAS induced metabolic activation by activating the MAPK pathway in transformed NPCs.
KRAS activation results in elevated cell growth and unorganized structures in brain organoids
Brain organoids have recently emerged as a promising 3D model in numerous aspects of the human brain research, such as modelling neurodevelopmental brain disorder, pathogens infection affecting brain development and modelling tumor invasion in the brain, etc. (44-47). To determine phenotypical changes in NPC-KRASG13D, the role of KRAS activation in brain organoids was investigated. Cerebral organoids were generated from ESC-Ctrl and ESC-KRASG13D as described by Lancaster and Knoblich (40) (Fig. 5A). Shape and size of brain organoids was assessed at days 6,11,21 and 31; organoids from ESC-KRASG13D exhibited irregular morphology and rapid growth compared with those from ESC-Ctrl (Fig. 5B). The size of brain organoids generated from ESC-KRASG13D was significantly larger than those generated from ESC-Ctrl at day 31 (Fig. 5B).
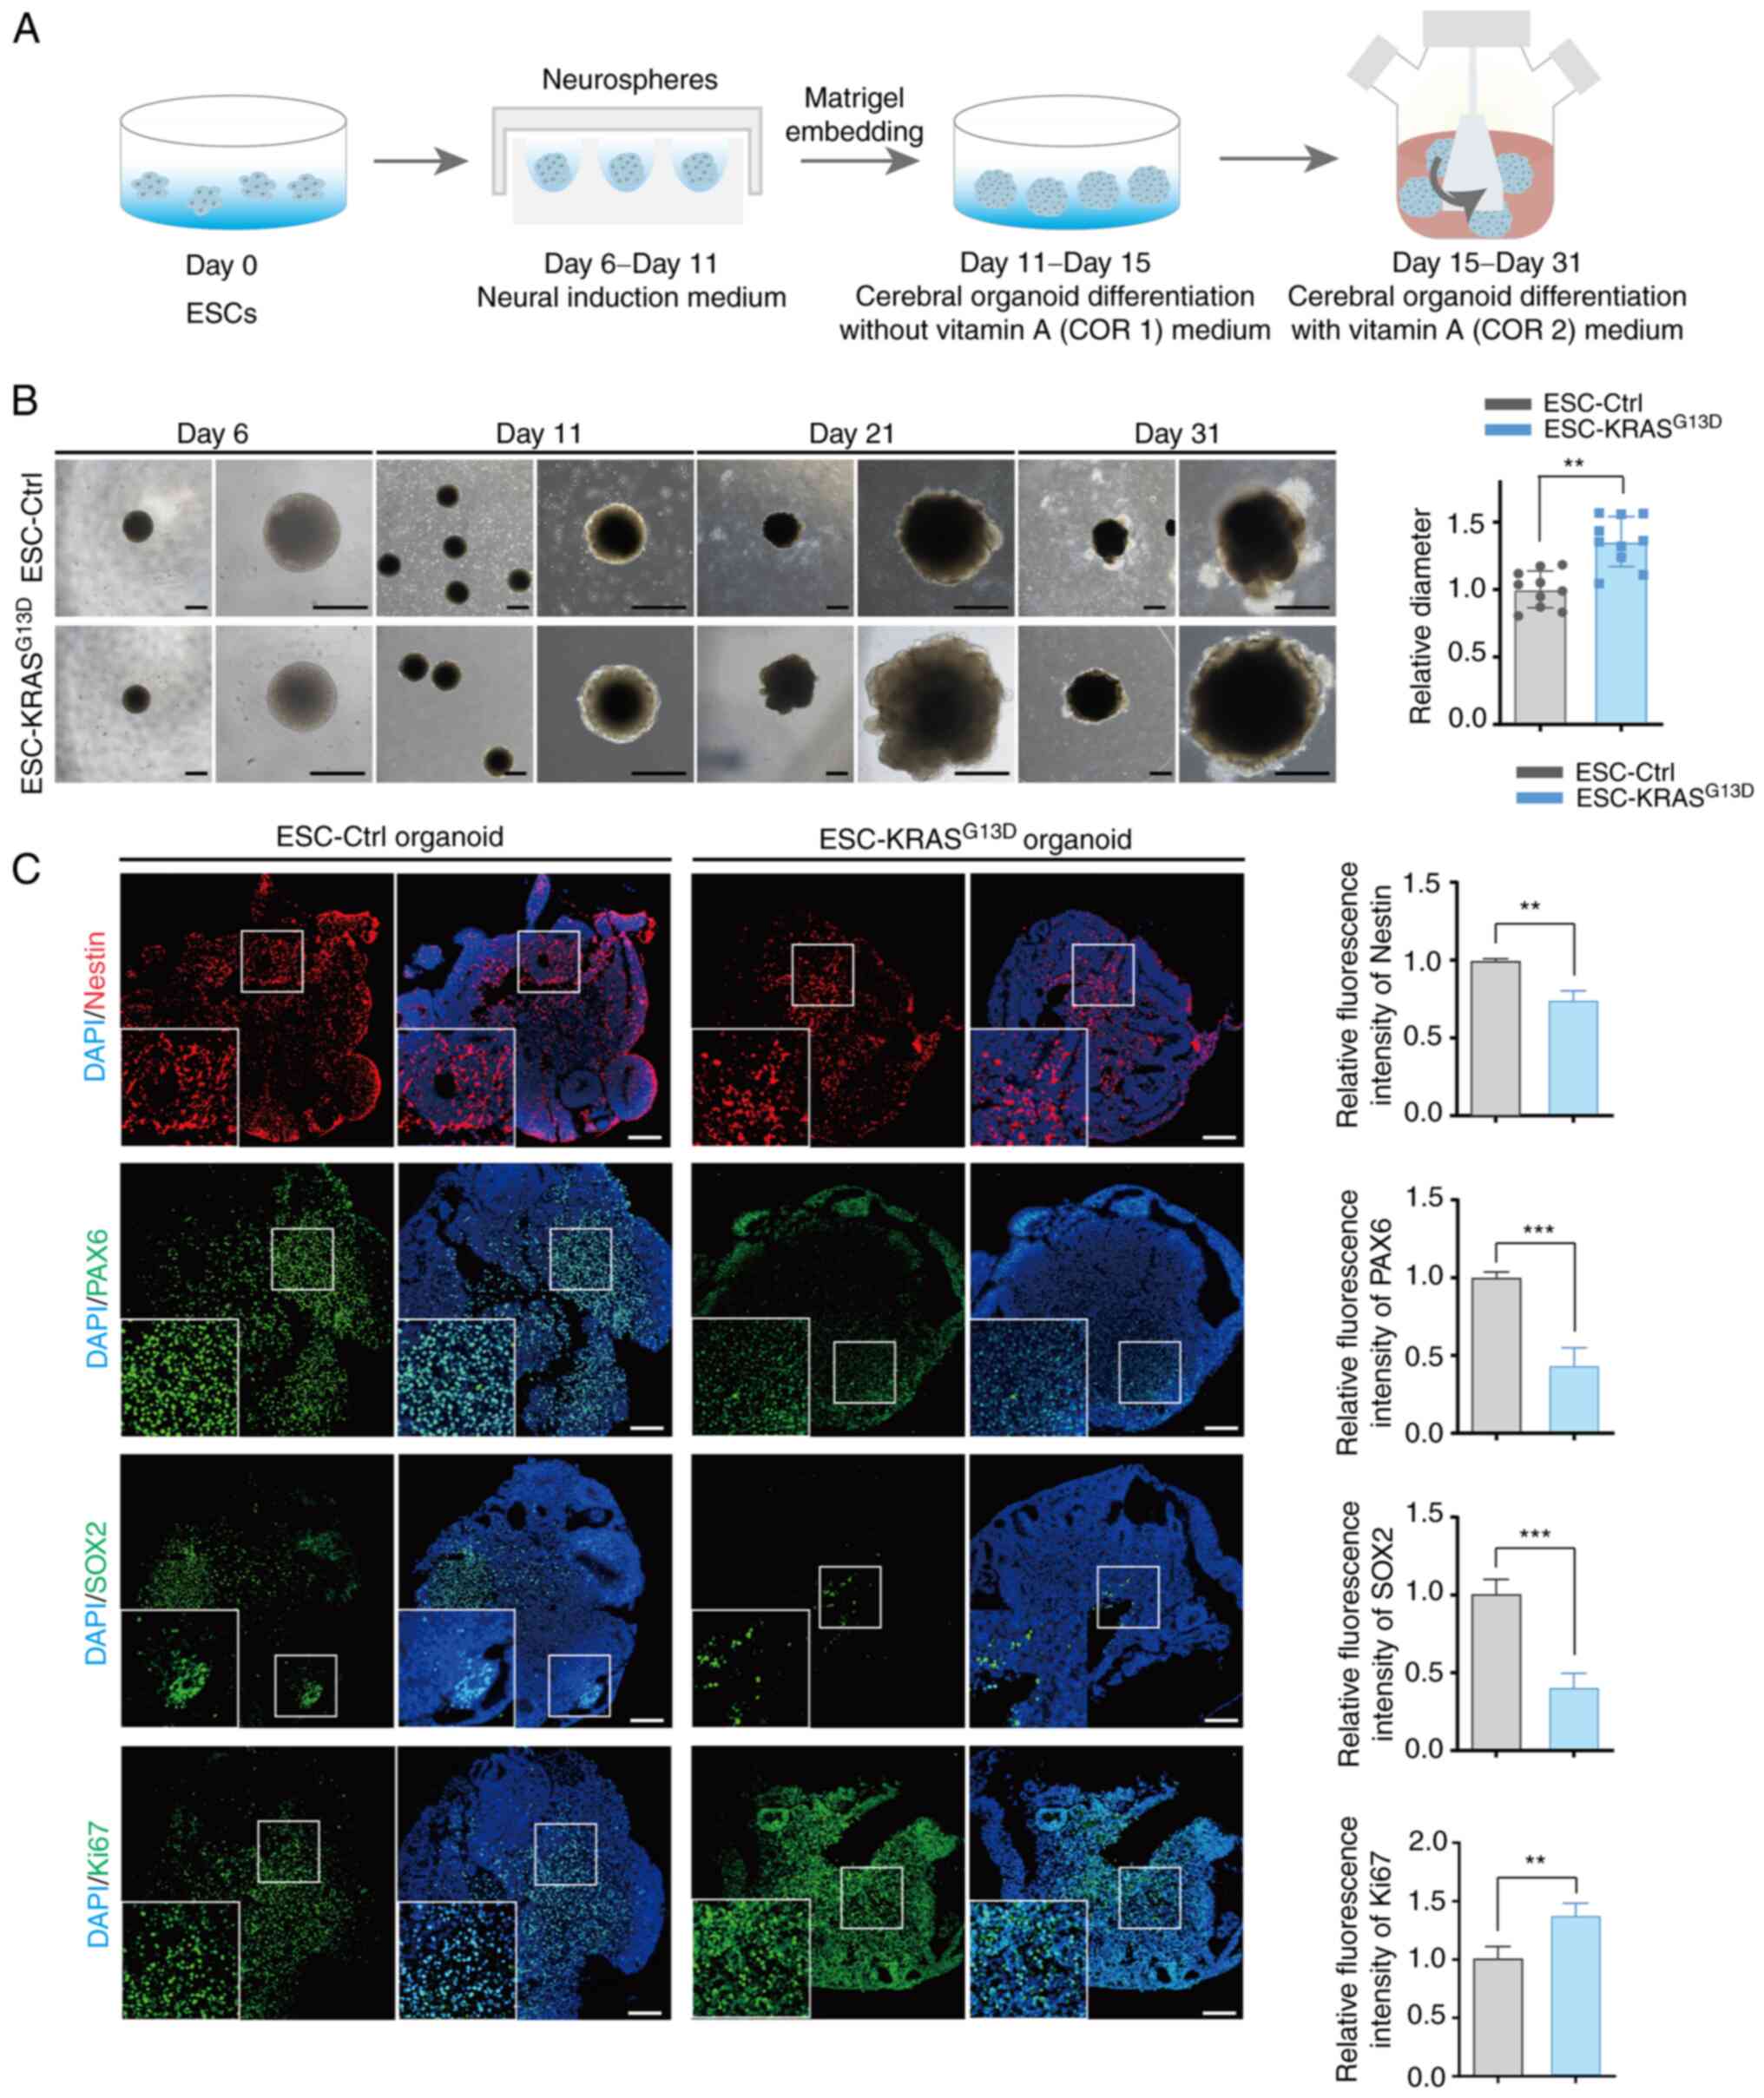
Structures and expression of neural SC markers (Nestin, SOX2 and PAX6) and proliferation protein Ki67 in organoids was assessed by immunofluorescence staining at day 31. There was pseudostratified epithelium with marked expression of neural SC markers in control organoids after 30 days. However, there were fewer pseudostratified structures with irregular morphology in KRAS-activated organoids, as well as significantly lower expression of neural SC markers (Fig. 5C). These data suggested that KRAS overexpression impaired the multilineage differentiation of ESCs. Moreover, relative fluorescence intensity of Ki67 was higher in KRASG13D organoids than in control organoids (Fig. 5C). These results demonstrated that KRASG13D organoids grew faster than control organoids and irregular structure was due to the activation of KRAS, which highlights its role in regulating normal human neurogenesis.
Discussion
Tumorigenesis has a complex molecular basis that primarily involves oncogenes, metabolic reprogramming and epigenetic regulatory alterations. Alterations in tumor driver genes serve a key role in tumor cell formation, and a small population of cells that undergo mutation continue to expand and form tumor masses (1,2,5,19). Studies have shown that tumor SCs (TSCs) are associated with tumorigenesis (5-7). TSCs are a subpopulation of cells within the tumor that self-renew and give rise to various differentiated cell types that form the tumor (5,8,18). Therefore, the study of the formation and transformation of GSCs is of value for the clinical treatment of glioma.
GSCs have a notable similarity to NPCs in terms of genotype and phenotype and are usually considered to have transformed from normal NPCs (16,18,48). However, complex genetic mutations, including the primary, secondary or evolved ones in tumor suppressors and oncogenes in glioma, as well as their interactions make it challenging to investigate how genetic mutations may contribute to the neoplastic transformation of NPCs and development of gliomas.
The identification of driver mutations may allow elucidation and targeting of early events underlying tumor formation. Pluripotent SCs are commonly used to model genetic disorders to create disease models (16,23-25,34,49,50). Several previous studies have modeled cancer in humans (18,30-32). These include reprogramming differentiated glioma cells to generate GSC-like cells (32) and deriving TSC-like cells by knocking down PTEN in ESCs (18). Similar strategies involving modulation of RTK and P53 to create GSC-like cells have also been reported (30,31).
Glioma is associated with genetic alterations and the Ras/Raf/MAPK pathway plays a key role in glioma development (19,51,52). The present study established ESCs carrying oncogenic alterations associated with the Ras/Raf/MAPK pathway and generated ESC-derived NPCs to study GSC transformation. NPCs with different oncogenic gene alterations exhibited differences in cell proliferation and migration ability. In NPCs carrying different oncogenic alterations, NPC-KRASG13D cells exhibited particularly high proliferative and migration ability.
KRAS is activated by the upstream EGFR pathway and serves a pivotal role in disease initiation, progression and drug resistance. Wild-type KRAS protein is rapidly inactivated after passing the signal to the downstream pathway. By contrast, KRAS mutations contribute to tumorigenesis since they lead to sustained activation of downstream pathways independent of EGFR regulation (53,54). Patients with KRAS mutations are clinically resistant to EGFR tyrosine kinase inhibitor treatment (55,56). Here, KRASG13D showed stronger effects than BRAF and EGFR on NPC migration and proliferation, suggesting that G13D mutation-induced activation of KRAS serves a critical role in triggering NPC transformation.
PTEN deficiency is associated with gliomagenesis (18). Here, NPC-KRASG13D-shPTEN did not show increased migration and proliferation ability compared with NPC-KRASG13D. It was hypothesized that this may be due to the inconsistent efficiency of viral infection when manipulating multiple genetic plasmids and the possibility that the two genetic modifications interfered with each other to decrease their effect. Further experiments are required to confirm these findings. In addition, the role of KRAS activation in neoplastic transformation needs to be investigated by directly overexpressing the activated form of KRAS in NPCs. Although the characteristics of NPCs carrying multiple genetic alterations require further investigation, the present results suggested that activated KRAS triggered the transformation of NPCs. This is consistent with reports that KRAS mutations can cause glioblastoma development by inducing abnormal signaling pathways (51,57).
The present study also investigated the tumor-initiating ability of KRAS-transformed NPCs in vivo and found that NPC-KRASG13D showed an aggressive growth phenotype via intracranial implantation assay. However, 2×10⁵ NPC-KRASG13D cells had to be transplanted to form an aggressive tumor; 1×10⁵ transplanted NPC-KRASG13D cells did not form tumor, suggesting that the tumor-forming ability of KRAS-activated NPCs was moderate and resembled low-grade or early stage of glioma formation. Given the complex and diverse clinical and histological characteristics of brain tumors (58), which type of brain tumor this model mimics needs to be investigated in further experiments.
To analyze the gene expression profile of KRAS-activated NPCs and identify the underlying mechanism of NPCs transformation, RNA sequencing was performed on NPC-KRASG13D, normal NPCs and GSCs isolated from tumor cell lines. The gene expression profile of NPC-KRASG13D was similar to that of GSCs. Functional cluster analysis showed NPC-KRASG13D to be significantly different from normal NPCs with regard to the regulatory genes involved in neural cell morphology and differentiation. However, NPC-KRASG13D exhibited a significantly increased expression of regulatory genes involved in cell proliferation, invasion and glucose metabolism, similar to that of GSCs, thus demonstrating its tumorigenic potential. Seahorse analysis showed that KRAS activation-induced increase in aerobic metabolism was reversed by adding a MAPK pathway inhibitor. This indicated that KRAS activation induced metabolism reprogramming, which is one of the hallmarks of cancer (59,60).
To understand the role of KRAS in driving NPC transformation, a human brain organoid model was used. KRAS mutation interfered with normal neural structure formation and induced notable cell proliferation, which contributed to glioma formation. Studies in mice and humans have demonstrated that glioma arises from NPCs with driver mutation in the subventricular zone (17,61,62). Here, NPCs harboring the KRAS mutation induced gliomagenesis in this study.
In conclusion, the present study demonstrated a critical role of KRAS activation in promoting neoplastic transformation of NPCs and established a simple cellular model to investigate gliomagenesis.
Supplementary Data
Availability of data and materials
The datasets used and/or analyzed during the current study are available from the corresponding author on reasonable request. The datasets generated and/or analyzed during the current study are available in the Gene Expression Omnibus repository (accession no. GSE228903).
Authors' contributions
LW conceived and designed the study. ZQ, WL, ZZ, PL, BG, YZ and HK performed the experiments and analyzed the data. TW and QC performed bioinformatics investigation. LW and ZQ wrote the manuscript. ZQ and WL confirm the authenticity of all the raw data. All authors have read and approved the final manuscript and agree to be accountable for all aspects of the research in ensuring that the accuracy or integrity of any part of the work are appropriately investigated and resolved.
Ethics approval and consent to participate
The animal experiments were reviewed and approved by the Animal Care and Experimental Committee of Jinan University (approval no. IACUC-20201027-08; Guangzhou, China).
Patient consent for publication
Not applicable.
Competing interests
The authors declare that they have no competing interests.
Acknowledgments
The authors would like to thank Dr Guangjin Pan (Guangzhou Institutes of Biomedicine and Health, Chinese Academy of Sciences, Guangzhou, China, for providing plasmids. We also thank Dr Yongli Shan and Mr Tiancheng Zhou from Guangzhou Institutes of Biomedicine and Health, Chinese Academy of Sciences, Guangzhou, China, for technical suggestions.
Funding
The present study was supported by the Science and Technology Program of Guangzhou (grant no. 202206010156) and the Guangdong Basic and Applied Basic Research Foundation (grant nos. 2022A1515011451 and 2023A1515010910).
References
|
Cloughesy TF, Cavenee WK and Mischel PS: Glioblastoma: From molecular pathology to targeted treatment. Annu Rev Pathol. 9:1–25. 2014. View Article : Google Scholar | |
|
Westphal M and Lamszus K: The neurobiology of gliomas: From cell biology to the development of therapeutic approaches. Nat Rev Neurosci. 12:495–508. 2011. View Article : Google Scholar : PubMed/NCBI | |
|
Sung H, Ferlay J, Siegel RL, Laversanne M, Soerjomataram I, Jemal A and Bray F: Global Cancer Statistics 2020: GLOBOCAN estimates of incidence and mortality worldwide for 36 cancers in 185 countries. CA Cancer J Clin. 71:209–249. 2021. View Article : Google Scholar : PubMed/NCBI | |
|
Aldape K, Brindle KM, Chesler L, Chopra R, Gajjar A, Gilbert MR, Gottardo N, Gutmann DH, Hargrave D, Holland EC, et al: Challenges to curing primary brain tumours. Nat Rev Clin Oncol. 16:509–520. 2019. View Article : Google Scholar : PubMed/NCBI | |
|
Prager BC, Xie Q, Bao S and Rich JN: Cancer stem cells: The architects of the tumor ecosystem. Cell Stem Cell. 24:41–53. 2019. View Article : Google Scholar : PubMed/NCBI | |
|
Saygin C, Matei D, Majeti R, Reizes O and Lathia JD: Targeting cancer stemness in the clinic: From Hype to Hope. Cell Stem Cell. 24:25–40. 2019. View Article : Google Scholar : PubMed/NCBI | |
|
Wang XX, Prager BC, Wu QL, Kim LJY, Gimple RC, Shi Y, Yang KL, Morton AR, Zhou WC, Zhu Z, et al: Reciprocal signaling between glioblastoma stem cells and differentiated tumor cells promotes malignant progression. Cell Stem Cell. 22:514–528.e5. 2018. View Article : Google Scholar : PubMed/NCBI | |
|
Hu B, Wang Q, Wang YA, Hua S, Sauve CG, Ong D, Lan ZD, Chang Q, Ho YW, Monasterio MM, et al: Epigenetic activation of WNT5A drives glioblastoma stem cell differentiation and invasive growth. Cell. 167:1281–1295.e18. 2016. View Article : Google Scholar : PubMed/NCBI | |
|
Wang P, Wan W, Xiong S, Wang J, Zou D, Lan C, Yu S, Liao B, Feng H and Wu N: HIF1α regulates glioma chemosensitivity through the transformation between differentiation and dedifferentiation in various oxygen levels. Sci Rep. 7:79652017. View Article : Google Scholar | |
|
Wang P, Lan C, Xiong S, Zhao X, Shan Y, Hu R, Wan W, Yu S, Liao B, Li G, et al: HIF1α regulates single differentiated glioma cell dedifferentiation to stem-like cell phenotypes with high tumorigenic potential under hypoxia. Oncotarget. 8:28074–28092. 2017. View Article : Google Scholar : PubMed/NCBI | |
|
Lee G, Auffinger B, Guo D, Hasan T, Deheeger M, Tobias AL, Kim JY, Atashi F, Zhang L, Lesniak MS, et al: Dedifferentiation of glioma cells to glioma stem-like cells by therapeutic Stress-induced HIF signaling in the recurrent GBM model. Mol Cancer Ther. 15:3064–3076. 2016. View Article : Google Scholar : PubMed/NCBI | |
|
Safa AR, Saadatzadeh MR, Cohen-Gadol AA, Pollok KE and Bijangi-Vishehsaraei K: Glioblastoma stem cells (GSCs) epigenetic plasticity and interconversion between differentiated non-GSCs and GSCs. Genes Dis. 2:152–163. 2015. View Article : Google Scholar : PubMed/NCBI | |
|
Biserova K, Jakovlevs A, Uljanovs R and Strumfa I: Cancer Stem Cells: Significance in origin, pathogenesis and treatment of glioblastoma. Cells. 10:6212021. View Article : Google Scholar : PubMed/NCBI | |
|
Lathia JD, Mack SC, Mulkearns-Hubert EE, Valentim CL and Rich JN: Cancer stem cells in glioblastoma. Genes Dev. 29:1203–1217. 2015. View Article : Google Scholar : PubMed/NCBI | |
|
Suva ML, Rheinbay E, Gillespie SM, Patel AP, Wakimoto H, Rabkin SD, Riggi N, Chi AS, Cahill DP, Nahed BV, et al: Reconstructing and reprogramming the tumor-propagating potential of glioblastoma stem-like cells. Cell. 157:580–594. 2014. View Article : Google Scholar : PubMed/NCBI | |
|
Sancho-Martinez I, Nivet E, Xia Y, Hishida T, Aguirre A, Ocampo A, Ma L, Morey R, Krause MN, Zembrzycki A, et al: Establishment of human iPSC-based models for the study and targeting of glioma initiating cells. Nat Commun. 7:107432016. View Article : Google Scholar : PubMed/NCBI | |
|
Llaguno SRA and Parada LF: Cell of origin of glioma: Biological and clinical implications. Brit J Cancer. 115:1445–1450. 2016. View Article : Google Scholar | |
|
Duan S, Yuan G, Liu X, Ren R, Li J, Zhang W, Wu J, Xu X, Fu L, Li Y, et al: PTEN deficiency reprogrammes human neural stem cells towards a glioblastoma stem cell-like phenotype. Nat Commun. 6:100682015. View Article : Google Scholar : PubMed/NCBI | |
|
Louis DN: Molecular pathology of malignant gliomas. Annu Rev Pathol. 1:97–117. 2006. View Article : Google Scholar | |
|
Funato K, Major T, Lewis PW, Allis CD and Tabar V: Use of human embryonic stem cells to model pediatric gliomas with H3.3K27M histone mutation. Science. 346:1529–1533. 2014. View Article : Google Scholar : PubMed/NCBI | |
|
Wang H, Xu T, Jiang Y, Xu H, Yan Y, Fu D and Chen J: The challenges and the promise of molecular targeted therapy in malignant gliomas. Neoplasia. 17:239–255. 2015. View Article : Google Scholar : PubMed/NCBI | |
|
Jones DTW, Gronych J, Lichter P, Witt O and Pfister SM: MAPK pathway activation in pilocytic astrocytoma. Cell Mol Life Sci. 69:1799–1811. 2012. View Article : Google Scholar : | |
|
Smith RC and Tabar V: Constructing and deconstructing cancers using human pluripotent stem cells and organoids. Cell Stem Cell. 24:12–24. 2019. View Article : Google Scholar : | |
|
Shi Y, Inoue H, Wu JC and Yamanaka S: Induced pluripotent stem cell technology: A decade of progress. Nat Rev Drug Discov. 16:115–130. 2017. View Article : Google Scholar | |
|
Tao Y and Zhang SC: Neural subtype specification from human pluripotent stem cells. Cell Stem Cell. 19:573–586. 2016. View Article : Google Scholar : PubMed/NCBI | |
|
Ying QL, Wray J, Nichols J, Batlle-Morera L, Doble B, Woodgett J, Cohen P and Smith A: The ground state of embryonic stem cell self-renewal. Nature. 453:519–523. 2008. View Article : Google Scholar : PubMed/NCBI | |
|
Lederer CW and Santama N: Neural stem cells: Mechanisms of fate specification and nuclear reprogramming in regenerative medicine. Biotechnol J. 3:1521–1538. 2008. View Article : Google Scholar : PubMed/NCBI | |
|
Mungenast AE, Siegert S and Tsai LH: Modeling Alzheimer's disease with human induced pluripotent stem (iPS) cells. Mol Cell Neurosci. 73:13–31. 2016. View Article : Google Scholar | |
|
Okano H and Yamanaka S: iPS cell technologies: Significance and applications to CNS regeneration and disease. Mol Brain. 7:222014. View Article : Google Scholar : PubMed/NCBI | |
|
Marin Navarro A, Pronk RJ, van der Geest AT, Oliynyk G, Nordgren A, Arsenian-Henriksson M, Falk A and Wilhelm M: p53 controls genomic stability and temporal differentiation of human neural stem cells and affects neural organization in human brain organoids. Cell Death Dis. 11:522020. View Article : Google Scholar : PubMed/NCBI | |
|
Modrek AS, Golub D, Khan T, Bready D, Prado J, Bowman C, Deng J, Zhang G, Rocha PP, Raviram R, et al: Low-grade astrocytoma mutations in IDH1, P53 and ATRX cooperate to block differentiation of human neural stem cells via repression of SOX2. Cell Rep. 21:1267–1280. 2017. View Article : Google Scholar : PubMed/NCBI | |
|
Uhrbom L, Dai CK, Celestino JC, Rosenblum MK, Fuller GN and Holland EC: Ink4a-Arf loss cooperates with KRas activation in astrocytes and neural progenitors to generate glioblastomas of various morphologies depending on activated Akt. Cancer Res. 62:5551–5558. 2002.PubMed/NCBI | |
|
Bian S, Repic M, Guo ZM, Kavirayani A, Burkard T, Bagley JA, Krauditsch C and Knoblich JA: Genetically engineered cerebral organoids model brain tumor formation. Nat Methods. 15:631–639. 2018. View Article : Google Scholar : PubMed/NCBI | |
|
Liu JL, Wang LL, Su ZH, Wu W, Cai XJ, Li D, Hou JD, Pei DQ and Pan GJ: A reciprocal antagonism between miR-376c and TGF-beta signaling regulates neural differentiation of human pluripotent stem cells. FASEB J. 28:4642–4656. 2014. View Article : Google Scholar : PubMed/NCBI | |
|
Moody J: Feeder-independent culture systems for human pluripotent stem cells. Methods Mol Biol. 946:507–521. 2013. View Article : Google Scholar | |
|
Livak KJ and Schmittgen TD: Analysis of relative gene expression data using real-time quantitative PCR and the 2(-Delta Delta C(T)) method. Methods. 25:402–408. 2001. View Article : Google Scholar | |
|
Xing F, Luan Y, Cai J, Wu S, Mai J, Gu J, Zhang H, Li K, Lin Y, Xiao X, et al: The Anti-warburg effect elicited by the cAMP-PGC1α pathway drives differentiation of glioblastoma cells into astrocytes. Cell Rep. 23:2832–2833. 2018. View Article : Google Scholar : PubMed/NCBI | |
|
Chuan Qin QK, Li Q, Wei Q, Gao H, Zhu D, Pang W, Sun D, Liu E, Li X and Rong R: Laboratory animal-Guidelines for euthanasia. China, M. o. S. a. T. o. t. P. s. R. o: Ministry of Science and Technology of the People's Republic of China, National standard; 2021 | |
|
Guide for the Care and Use of Laboratory Animals. Washington, (DC): 2011 | |
|
Lancaster MA and Knoblich JA: Generation of cerebral organoids from human pluripotent stem cells. Nat Protoc. 9:2329–2340. 2014. View Article : Google Scholar : PubMed/NCBI | |
|
Brescia P, Ortensi B, Fornasari L, Levi D, Broggi G and Pelicci G: CD133 is essential for glioblastoma stem cell maintenance. Stem Cells. 31:857–869. 2013. View Article : Google Scholar : PubMed/NCBI | |
|
Ludwig K and Kornblum HI: Molecular markers in glioma. J Neurooncol. 134:505–512. 2017. View Article : Google Scholar : PubMed/NCBI | |
|
Koppenol WH, Bounds PL and Dang CV: Otto Warburg's contributions to current concepts of cancer metabolism. Nat Rev Cancer. 11:325–337. 2011. View Article : Google Scholar : PubMed/NCBI | |
|
Qian X, Nguyen HN, Jacob F, Song H and Ming GL: Using brain organoids to understand Zika virus-induced microcephaly. Development. 144:952–957. 2017. View Article : Google Scholar : PubMed/NCBI | |
|
Chen HI, Song H and Ming GL: Applications of human brain organoids to clinical problems. Dev Dyn. 248:53–64. 2019. View Article : Google Scholar : | |
|
Krieger TG, Tirier SM, Park J, Jechow K, Eisemann T, Peterziel H, Angel P, Eils R and Conrad C: Modeling glioblastoma invasion using human brain organoids and single-cell transcriptomics. Neuro Oncol. 22:1138–1149. 2020. View Article : Google Scholar : PubMed/NCBI | |
|
Azzarelli R, Ori M, Philpott A and Simons BD: Three-dimensional model of glioblastoma by co-culturing tumor stem cells with human brain organoids. Biol Open. 10:bio0564162021. View Article : Google Scholar : PubMed/NCBI | |
|
Alcantara Llaguno S, Sun D, Pedraza AM, Vera E, Wang Z, Burns DK and Parada LF: Cell-of-origin susceptibility to glioblastoma formation declines with neural lineage restriction. Nat Neurosci. 22:545–555. 2019. View Article : Google Scholar : PubMed/NCBI | |
|
Li GL, Xie BB, He LW, Zhou TC, Gao GJ, Liu SX, Pan GJ, Ge J, Peng FH and Zhong XF: Generation of retinal organoids with mature rods and cones from urine-derived human induced pluripotent stem cells. Stem Cells Int. 2018:49686582018. View Article : Google Scholar : PubMed/NCBI | |
|
Su ZH, Zhang YQ, Liao BJ, Zhong XF, Chen X, Wang HT, Guo YP, Shan YL, Wang LH and Pan GJ: Antagonism between the transcription factors NANOG and OTX2 specifies rostral or caudal cell fate during neural patterning transition. J Biol Chem. 293:4445–4455. 2018. View Article : Google Scholar : PubMed/NCBI | |
|
Qiu XY, Hu DX, Chen WQ, Chen RQ, Qian SR, Li CY, Li YJ, Xiong XX, Liu D, Pan F, et al: PD-L1 confers glioblastoma multiforme malignancy via Ras binding and Ras/Erk/EMT activation. Biochim Biophys Acta Mol Basis Dis. 1864:1754–1769. 2018. View Article : Google Scholar : PubMed/NCBI | |
|
Ryall S, Tabori U and Hawkins C: Pediatric low-grade glioma in the era of molecular diagnostics. Acta Neuropathol Commun. 8:302020. View Article : Google Scholar : PubMed/NCBI | |
|
Eser S, Schnieke A, Schneider G and Saur D: Oncogenic KRAS signalling in pancreatic cancer. Br J Cancer. 111:817–822. 2014. View Article : Google Scholar : PubMed/NCBI | |
|
Huang L, Guo Z, Wang F and Fu L: KRAS mutation: From undruggable to druggable in cancer. Signal Transduct Target Ther. 6:3862021. View Article : Google Scholar : PubMed/NCBI | |
|
Zacher A, Kaulich K, Stepanow S, Wolter M, Kohrer K, Felsberg J, Malzkorn B and Reifenberger G: Molecular diagnostics of gliomas using next generation sequencing of a glioma-tailored gene panel. Brain Pathol. 27:146–159. 2017. View Article : Google Scholar | |
|
Bannoura SF, Uddin MH, Nagasaka M, Fazili F, Al-Hallak MN, Philip PA, El-Rayes B and Azmi AS: Targeting KRAS in pancreatic cancer: New drugs on the horizon. Cancer Metastasis Rev. 40:819–835. 2021. View Article : Google Scholar : PubMed/NCBI | |
|
Ding H, Roncari L, Shannon P, Wu XL, Lau N, Karaskova J, Gutmann DH, Squire JA, Nagy A and Guha A: Astrocyte-specific expression of activated p21-ras results in malignant astrocytoma formation in a transgenic mouse model of human gliomas. Cancer Res. 61:3826–3836. 2001.PubMed/NCBI | |
|
Bienkowski M, Furtner J and Hainfellner JA: Clinical neuropathology of brain tumors. Handb Clin Neurol. 145:477–534. 2017. View Article : Google Scholar : PubMed/NCBI | |
|
Sancho P, Barneda D and Heeschen C: Hallmarks of cancer stem cell metabolism. Brit J Cancer. 114:1305–1312. 2016. View Article : Google Scholar : PubMed/NCBI | |
|
Bernards R, Jaffee E, Joyce JA, Lowe SW, Mardis ER, Morrison SJ, Polyak K, Sears CL, Vousden KH and Zhang ZM: A roadmap for the next decade in cancer research. Nat Cancer. 1:12–17. 2020. View Article : Google Scholar : PubMed/NCBI | |
|
Zong H, Verhaak RG and Canoll P: The cellular origin for malignant glioma and prospects for clinical advancements. Expert Rev Mol Diagn. 12:383–394. 2012. View Article : Google Scholar : PubMed/NCBI | |
|
Wang Z, Sun D, Chen YJ, Xie X, Shi Y, Tabar V, Brennan CW, Bale TA, Jayewickreme CD, Laks DR, et al: Cell lineage-based stratification for glioblastoma. Cancer Cell. 38:366–379.e8. 2020. View Article : Google Scholar : PubMed/NCBI |