Introduction
Glioblastoma (GBM), the most frequent and most
lethal primary malignant brain tumor, represents a highly complex
tumor consisting in cancer cells and various non-neoplastic cells
(1,2). This complexity represents a challenge
to achieve an effective therapy to overcome the current median
survival of 14 months even after conventional therapy which
combines surgical resection, radiotherapy and chemotherapy
(3). Additionally, GBM is one of
the tumors in which a subpopulation of cancer initiating cells with
properties of stem cells has been clearly identified. This glioma
initiating cells (GICs) and their differentiated counterpart (tumor
bulk cells) may represent opposite extremes of cells forming the
highly heterogenous GBM mass in vivo (4,5).
GICs not only resist current treatments and repopulate the tumor
but are also able to evade the host immune system. Thus, the
greater proportion of GICs, the higher tumor aggressivity and
poorer prognosis (6), as current
therapies show poor efficacy against GICs (4,6). For
these reasons, understanding the differences between both types of
cancer cells and the heterogenicity of the tumor could help to move
cancer therapy towards less conventional but more efficient
approaches.
It must also be considered that the subpopulation of
cancer stem cells (CSCs) is not ‘immovable’ and that new stem cells
may appear depending on multiple factors. Evidence suggests that
stem cell properties can be acquired as a consequence of mutations
and metabolic changes occurring in normal stem cells or
differentiated cancer cells that move up the cancer cell hierarchy
for their expression of pluripotent genes. In this sense, numerous
of the identified CSCs' biomarkers have some role in cellular
metabolism. These metabolic changes, capable of inducing CSCs
reprogramming are collectively called ‘metabo-stemness’ (7).
Loss of control of mitochondrial metabolism is one
of the main hallmarks of cancer (8). Numerous tumor cells, including GBM,
have an altered glucose metabolism known as Warburg effect
(9), which favors the
transformation of pyruvate to lactate instead of its incorporation
into the tricarboxylic acid cycle and the subsequent electron
transport chain (ETC) in the mitochondria. This metabolic
adaptation, although it is energetically less favorable, has other
advantages for tumor cells in terms of redox balance and synthesis
of intermediate metabolites (10).
However, while Warburg effect has been described for GBM, data
appear to indicate that metabolism could vary between different
tumor populations and can be also modulated within same tumor
population by tumor microenvironment (11). Thus, a previous study showed that
GICs are less glycolytic than differentiated glioma cells (12). But on the other hand, there is also
abundant literature that supports aerobic glycolysis as the main
bioenergetic source in CSCs of various tumor types including GBM
(13).
Moreover, it has been also described that glycolysis
does not account for the total production of ATP in GBM, suggesting
the role of other metabolic routes (9) such as beta oxidation of fatty acids
in the mitochondria (14) that
requires the endoplasmic reticulum (ER) participation too. ER plays
a central role in regulation of the adaptative response needed for
a tumoral cell in order to survive to the hostile microenvironment
generated as a consequence of the high proliferation rate that
includes oxidative stress, nutrient and lipid deprivation and
hypoxia (15). Although the
mitochondria and ER were classically considered to function
independently, electron microscopy ultrastructural studies already
described points of great proximity between the two organelles that
made researchers suspect an interrelation between them. These
points, known as mitochondria-ER contact sites (MERCS) are sites of
close proximity between both organelles where several different
proteins are recruited. Among these proteins is the mitochondrial
membrane voltage-dependent anionic channel (VDAC) that interacts
with the inositol trisphosphate receptor (IP3R) of the ER through
the chaperone GPR75, being responsible for the transfer of calcium
from the ER to the mitochondria (16). This calcium is essential for the
activity of dehydrogenases of the Krebs cycle, the production of
energy and consequently cell survival (17). Of interest, a previous electron
microscopy ultrastructural study has described differences at the
level of MERCS between GICs and differentiated tumor cells
(18), suggesting an important
role of ER-mitochondria interactions in the biology of GBM
cells.
It was hypothesized that there are differences at
the level of ER and mitochondrial functionality between GICs and
their differentiated counterparts that plays a central role in
regulation of glucose metabolism and that these differences are key
to maintaining the glioma stem cell subpopulation.
Materials and methods
Cell culture and reagents
Neurospheroid cultures were established from acute
cell dissociation of human GBM post-surgical specimens and
maintained in DMEM/F12 medium supplemented with B27 and N2
(Invitrogen; Thermo Fisher Scientific, Inc.) plus EGF and bFGF (20
ng/ml each; MilliporeSigma) according to the previously described
procedures (19,20). Neurospheroid cultures display a
GICs phenotype (self-renewal, proliferation, expression of stem
cell markers, pluripotency and ability to form tumors in
vivo). For differentiation of GICs, neurospheroids were
dissociated using accutaseTM (Invitrogen; Thermo Fisher
Scientific, Inc.) and seeded in serum DMEM/F12 supplemented with
10% fetal bovine serum (FBS) for 10 days. Culture cells were
maintained at 37°C in a humidified atmosphere of 5% CO2.
The present study was conducted in accordance with the Declaration
of Helsinki and was approved (approval no. 2021.008; approved on
January 22nd, 2021) by the Clinical Research Ethics Committee of
the Principality of Asturias (Oviedo, Spain). Written informed
consent was obtained by all patients who participated in the
present study.
Cell culture reagents were purchased from
MilliporeSigma except for FBS, which was obtained from GIBCO
(Invitrogen; Thermo Fisher Scientific, Inc.). Culture flasks and
dishes were acquired from Thermo Fisher Scientific, Inc. All other
reagents were purchased from MilliporeSigma, unless otherwise
indicated.
Compound concentrations used for the experiments
were as follows: 20 mM oxamate (cat. no. O2751; Sigma-Aldrich;
Merck KGaA), 500 nM rotenone (cat. no. R8875; Sigma-Aldrich; Merck
KGaA), 10 µM BAPTA/AM (cat. no. sc-202488; Santa Cruz
Biotechnologies, Inc.), 5 µM thapsigargin (cat. no. 586005;
Sigma-Aldrich; Merck KGaA), 500 ng/ml tunicamycin (cat. no.
sc-3506; Santa Cruz Biotechnologies, Inc.), 1 µM MKT-077 (cat. no.
M5449; Sigma-Aldrich; Merck KGaA) and 1–10 µM temozolomide (cat.
no. 16437308; Thermo Fisher Scientific, Inc.).
Self-renewal assessment
Self-renewal was determined by the limiting dilution
assay, which indicates the number of cells from a primary NS that
are needed to form a secondary NS. For this experiment, primary
neurospheres were treated overnight with different drugs and then
counted with an automatic cell counter and seeded in 96-well plates
at dilutions that ranged from 100 cells/well to 1 cell/well. After
7 days of culture, each well was examined for the formation of
tumor spheres. Data were analyzed using the web-based tool ‘ELDA’
(extreme limiting dilution analysis) (http://bioinf.wehi.edu.au/software/elda/).
Evaluation of cell viability
Cell death was determined by means of Trypan blue
exclusion assay. Trypan blue uptake is indicative of irreversible
membrane damage preceding cell death, giving as a result a blue
staining in non-viable cells. For these assays, cells were seeded
in 12-well plates at a density of 104 cells/ml. After
treatments, cells were harvested and resuspended in 400 µl of PBS
and 100 µl of 0.4% (w/v) trypan blue solution. The number of cells
and the percentage of viable and non-viable cells were determined
using an automatic cell counter (Countess™ 3, Invitrogen; Thermo
Fisher Scientific, Inc.).
For drug combination studies, cell viability was
evaluated using a colorimetric assay, 3-(4,
5-dimethylthiazol-2-yl)-2,5-diphenyltetrazolium bromide (MTT).
Briefly, cells were seeded onto 96-well plates and once the
treatments were completed, 10 µl of a MTT solution in PBS (5 mg/ml)
w added. After 4 h of incubation at 37°C, one volume of the lysis
solution [sodium dodecyl sulphate (SDS) 20% and dimethylformamide
pH 4.7, 50%] was added. The mixture was incubated at 37°C overnight
and the samples were measured in an automatic microplate reader
(µQuant; Bio-Tek Instruments, Inc.) at the wavelength of 540 nm. It
must be taken into account that none of these protocols allow the
determination of the exact mechanism of cell death.
Measurement of glucose uptake using
2-NBDG
Glucose uptake activity was measured using a
fluorescent D-glucose analogue
2-[N-(7-nitrobenz-2-oxa-1,3-diazol-4-yl) amino]-2-deoxy-D-glucose
(2-NBDG). Cells were seeded in six-well plates at a density of
104 cells/ml and treated with the different compounds
for 24 h. After treatments, cells were collected and incubated with
10 µM 2-NBDG for 35 min. Fluorescence was measured in a microplate
fluorimeter FLX-800 (Bio-Tek Instruments, Inc.) at an excitation
wavelength of 467 nm and an emission wavelength of 542 nm. The
obtained fluorescence was normalized with total number of cells
determined using an automatic cell counter (Countess™ 3).
Determination of mitochondrial calcium
levels
Cells were seeded in six-well plates at a density of
104 cells/ml. After treatments, cells were collected and
incubated with a fluorescent probe specific for mitochondrial
Ca2+ [3 µM Rhod-2 AM] for 30 min at 37°C. The
fluorescence signal from these cells was measured using a
microplate fluorimeter FLX-800 (Bio-Tek Instruments, Inc.) at an
excitation and emission wavelength of 552 and 581 nm, respectively.
The obtained fluorescence was normalized with total number of cells
using an automatic cell counter (Countess™ 3).
Evaluation of mitochondrial membrane
potential
The fluorescent probe Rhodamine 123 was used to
monitor the electrochemical gradient in mitochondria (ΔΨm). Cells
were seeded in six-well plates at a density of 104
cells/ml and treated with the different compounds for 24 h. After
treatments, cells were collected and incubated with 1 µg/ml
Rhodamine 123 in serum-free medium for 30 min at 37°C. Fluorescence
was measured using a microplate fluorimeter FLX-800 (Bio-Tek
Instruments, Inc.) at an excitation and emission wavelength of 488
and 515 nm, respectively. The obtained fluorescence was normalized
with total number of cells using an automatic cell counter
(Countess™ 3).
Evaluation of reactive oxygen species
(ROS)
The fluorescent probe DCFH-DA (Invitrogen; Thermo
Fisher Scientific, Inc.) was used to monitor ROS. Cells were seeded
in six-well plates at a density of 104 cells/ml and
treated with the different compounds for 24 h. After treatments,
cells were collected and incubated with 10 µM DCFH-DA in serum-free
medium for 30 min at 37°C. Fluorescence was measured using a
microplate fluorimeter FLX-800 (Bio-Tek Instruments, Inc.,) at an
excitation and emission wavelength of 485 and 530 nm, respectively.
The obtained fluorescence was normalized with total number of cells
using an automatic cell counter (Countess™ 3).
Evaluation of lactate dehydrogenase
(LDH) activity
Cells were seeded in 24-well plates at a density of
104 cells/ml. Determination of LDH activity was
accomplished following specifications of the lactic dehydrogenase
based In Vitro Toxicology Assay kit (cat. no. MAK066;
MilliporeSigma). Absorbance was determined using an automatic
microplate reader (µQuant; Bio-Tek Instruments, Inc.) at 490 nm and
then the obtained data was relativized with total protein
concentration.
Western blot analysis
For protein expression analysis, cells were lysed in
ice-cold lysis buffer (150 mM NaCl, 1 mM EDTA, 1 mM EGTA, 1% v/v
Triton X-100, 2.5 mM sodium pyrophosphate, 1 mM β-glycerophosphate,
1 mM Na3VO4, 1 µg/ml leupeptin, 2 µg/ml aprotinin, 1 µg/ml
pep-statin-A, 110 nM NaF, 1 mM PMSF, 20 mM Tris-HCl pH 7.5). Total
protein (30 µg) was separated by 10% SDS-polyacrylamide gel
electrophoresis and transferred to polyvinylidene difluoride
membranes (Amersham Bioscience; Cytiva). Blots were blocked using
Pierce Clear Milk Blocking Buffer (cat. no. 13494209; Pierce;
Thermo Fisher Scientific, Inc.) for 1 h at room temperature and
incubated overnight at 4°C with appropriate antibodies (Table SI). Immunoreactive polypeptides
were visualized after incubation for 1.5 h at room temperature
using horseradish peroxidase conjugated secondary antibodies
(anti-rabbit or anti-mousse IgG peroxidase conjugated; 1:4,000;
cat. no. sc-2357 and sc-516102 respectively; Santa Cruz
Biotechnology, Inc.) and enhanced-chemiluminescence detection
reagents (Merck Millipore) following manufacturer-supplied
protocols. Chemiluminescence signals were acquired using the
Odyssey Fc Imaging System equipment (LI-COR Biosciences) and
subsequently processed with the Image Studio 5.2 software (LI-COR
Biosciences).
Reverse transcription-quantitative PCR
(RT-qPCR)
Total RNA was extracted from cells using GenElute™
Mammalian Total RNA Miniprep kit (cat. no. RTN70-1KT;
MilliporeSigma). cDNA was constructed by reverse-transcribing 1 µg
of total RNA using Applied Biosystems™ High-Capacity cDNA Reverse
Transcription kit following manufacturer's protocol (cat. no.
4368814, Thermo Fisher Scientific, Inc.). Quantitative analysis of
CD133, SOX 2, OCT3/4 and NANOG levels was performed by the SYBR
Green real time PCR method using Green PCR Core Reagents in an
AB7700 Real-Time System (both from Applied Biosystems; Thermo
Fisher Scientific, Inc.). Thermal cycling parameters were as
follows: 95°C for 10 min, followed by 40 cycles of amplification at
95°C for 15 sec, 55°C for 30 sec and 72°C for 30 sec, with a final
elongation step at 72°C for 5 min. The primers used are presented
in Table SII. Each sample was
tested in triplicate, and relative gene expression data was
analyzed by means of the 2−ΔΔCq method (21).
For evaluation of the levels of expression of
glucose metabolism-related genes, RNA was converted to cDNA using
the RT2 First Strand kit (cat. no. 330404; Qiagen GmbH), and
RT-qPCR was performed using the Qiagen Glucose Metabolism RT2
Profiler PCR Array with the RT2 SYBR Green qPCR Mastermix (Qiagen)
on an AB7700 Real-Time System (Applied Biosystems; Thermo Fisher
Scientific, Inc.). Data analysis was performed as described by the
manufacturer.
Statistical analysis
Experiments were repeated at least three times, and
data was calculated as the average ± standard error. Significance
was tested by unpaired t-test when two groups were compared, while
one-way ANOVA followed by a Tukey's post hoc test was used for
multiple group comparison, using the software SigmaStat 3.5 (Systat
Software, Inc.). P≤0.05 was considered to indicate a statistically
significant difference.
Results
GICs have been reported to differentiate into
non-stem differentiated glioma cell under serum culture conditions
(22–24). Differences between stem cells and
differentiated counterparts were compared in GBM (GBM grade IV)
patient-derived neurospheroid cultures, GIC-A and GIC-B (isolated
from two different patients). As expected, after 10 days of culture
in a serum containing medium, both displayed a differentiated
phenotype with an astrocyte-like morphology and numerous processes
forming well-delineated bushy territories (Fig. S1A). Moreover, mRNA expression
levels of several stem cells' markers including sox2, oct4, nanog
and CD133 revealed a decrease after culture in serum-containing
medium (Fig. S1B). Decrease of
sox2, a transcription factor whose activity has been described to
be essential for GBM stem cells (25) was also demonstrated at the protein
levels, together with an increase of glial fibrillary acidic
protein expression (GFAP)-a marker of differentiation (Fig. S1C).
GICs are dependent on mitochondrial
metabolism
Glucose metabolism in GICs remains unclear since
both aerobic glycolysis and mitochondrial dependent glucose
metabolism have been described in the literature (13). To assess this discrepancy, glucose
uptake, mitochondrial membrane potential and LDH activity (main
enzyme in the production of lactate during aerobic glycolysis) were
evaluated in the present experimental model. A decrease in glucose
uptake (Fig. 1A) and a disruption
in mitochondrial membrane potential-as determined by rhodamine 123
fluorescence- (Fig. 1B) was found
after differentiation of cells (10 days of serum containing-medium
incubation), while LDH activity increased under those culture
conditions (Fig. 1C). Moreover, a
decrease in intracellular ROS (mainly produced in the mitochondria)
also occured during differentiation of glioma stem cells (Fig. 1D). The aforementioned data appeared
to indicate that under differentiated conditions, GICs change their
metabolism, moving from a greater dependence on mitochondria to a
greater dependence on aerobic glycolysis. In this sense, the
expression of 84 glucose metabolism-related genes was evaluated
using the Qiagen Glucose Metabolism RT2 Profiler PCR Array
(Fig. 1E); a decrease was
demonstrated in the expression of 36 of those genes after
differentiation in serum-containing medium, including certain key
genes such as hexokinase 2 (HK2) or pyruvate dehydrogenase (PDH).
Only one of the studied genes-TPI-, that encodes for the
triosephosphate isomerase-one of the key glycolytic enzymes-,
demonstrated increased expression in differentiated glioma cells.
Downregulation of HK2 and PDH was also confirmed at the protein
level (Fig. 1F and G). Although
the higher expression of HK2 in GICs may be unexpected, it must be
considered that it is not entirely correct to affirm that HK2 is a
glycolytic enzyme since, being the enzyme that participates in the
first step of the glucose metabolism pathway. Thus, its expression
is necessary both in the cells that then shunt metabolites to
mitochondria as well as those that shunt metabolites to lactate
production.
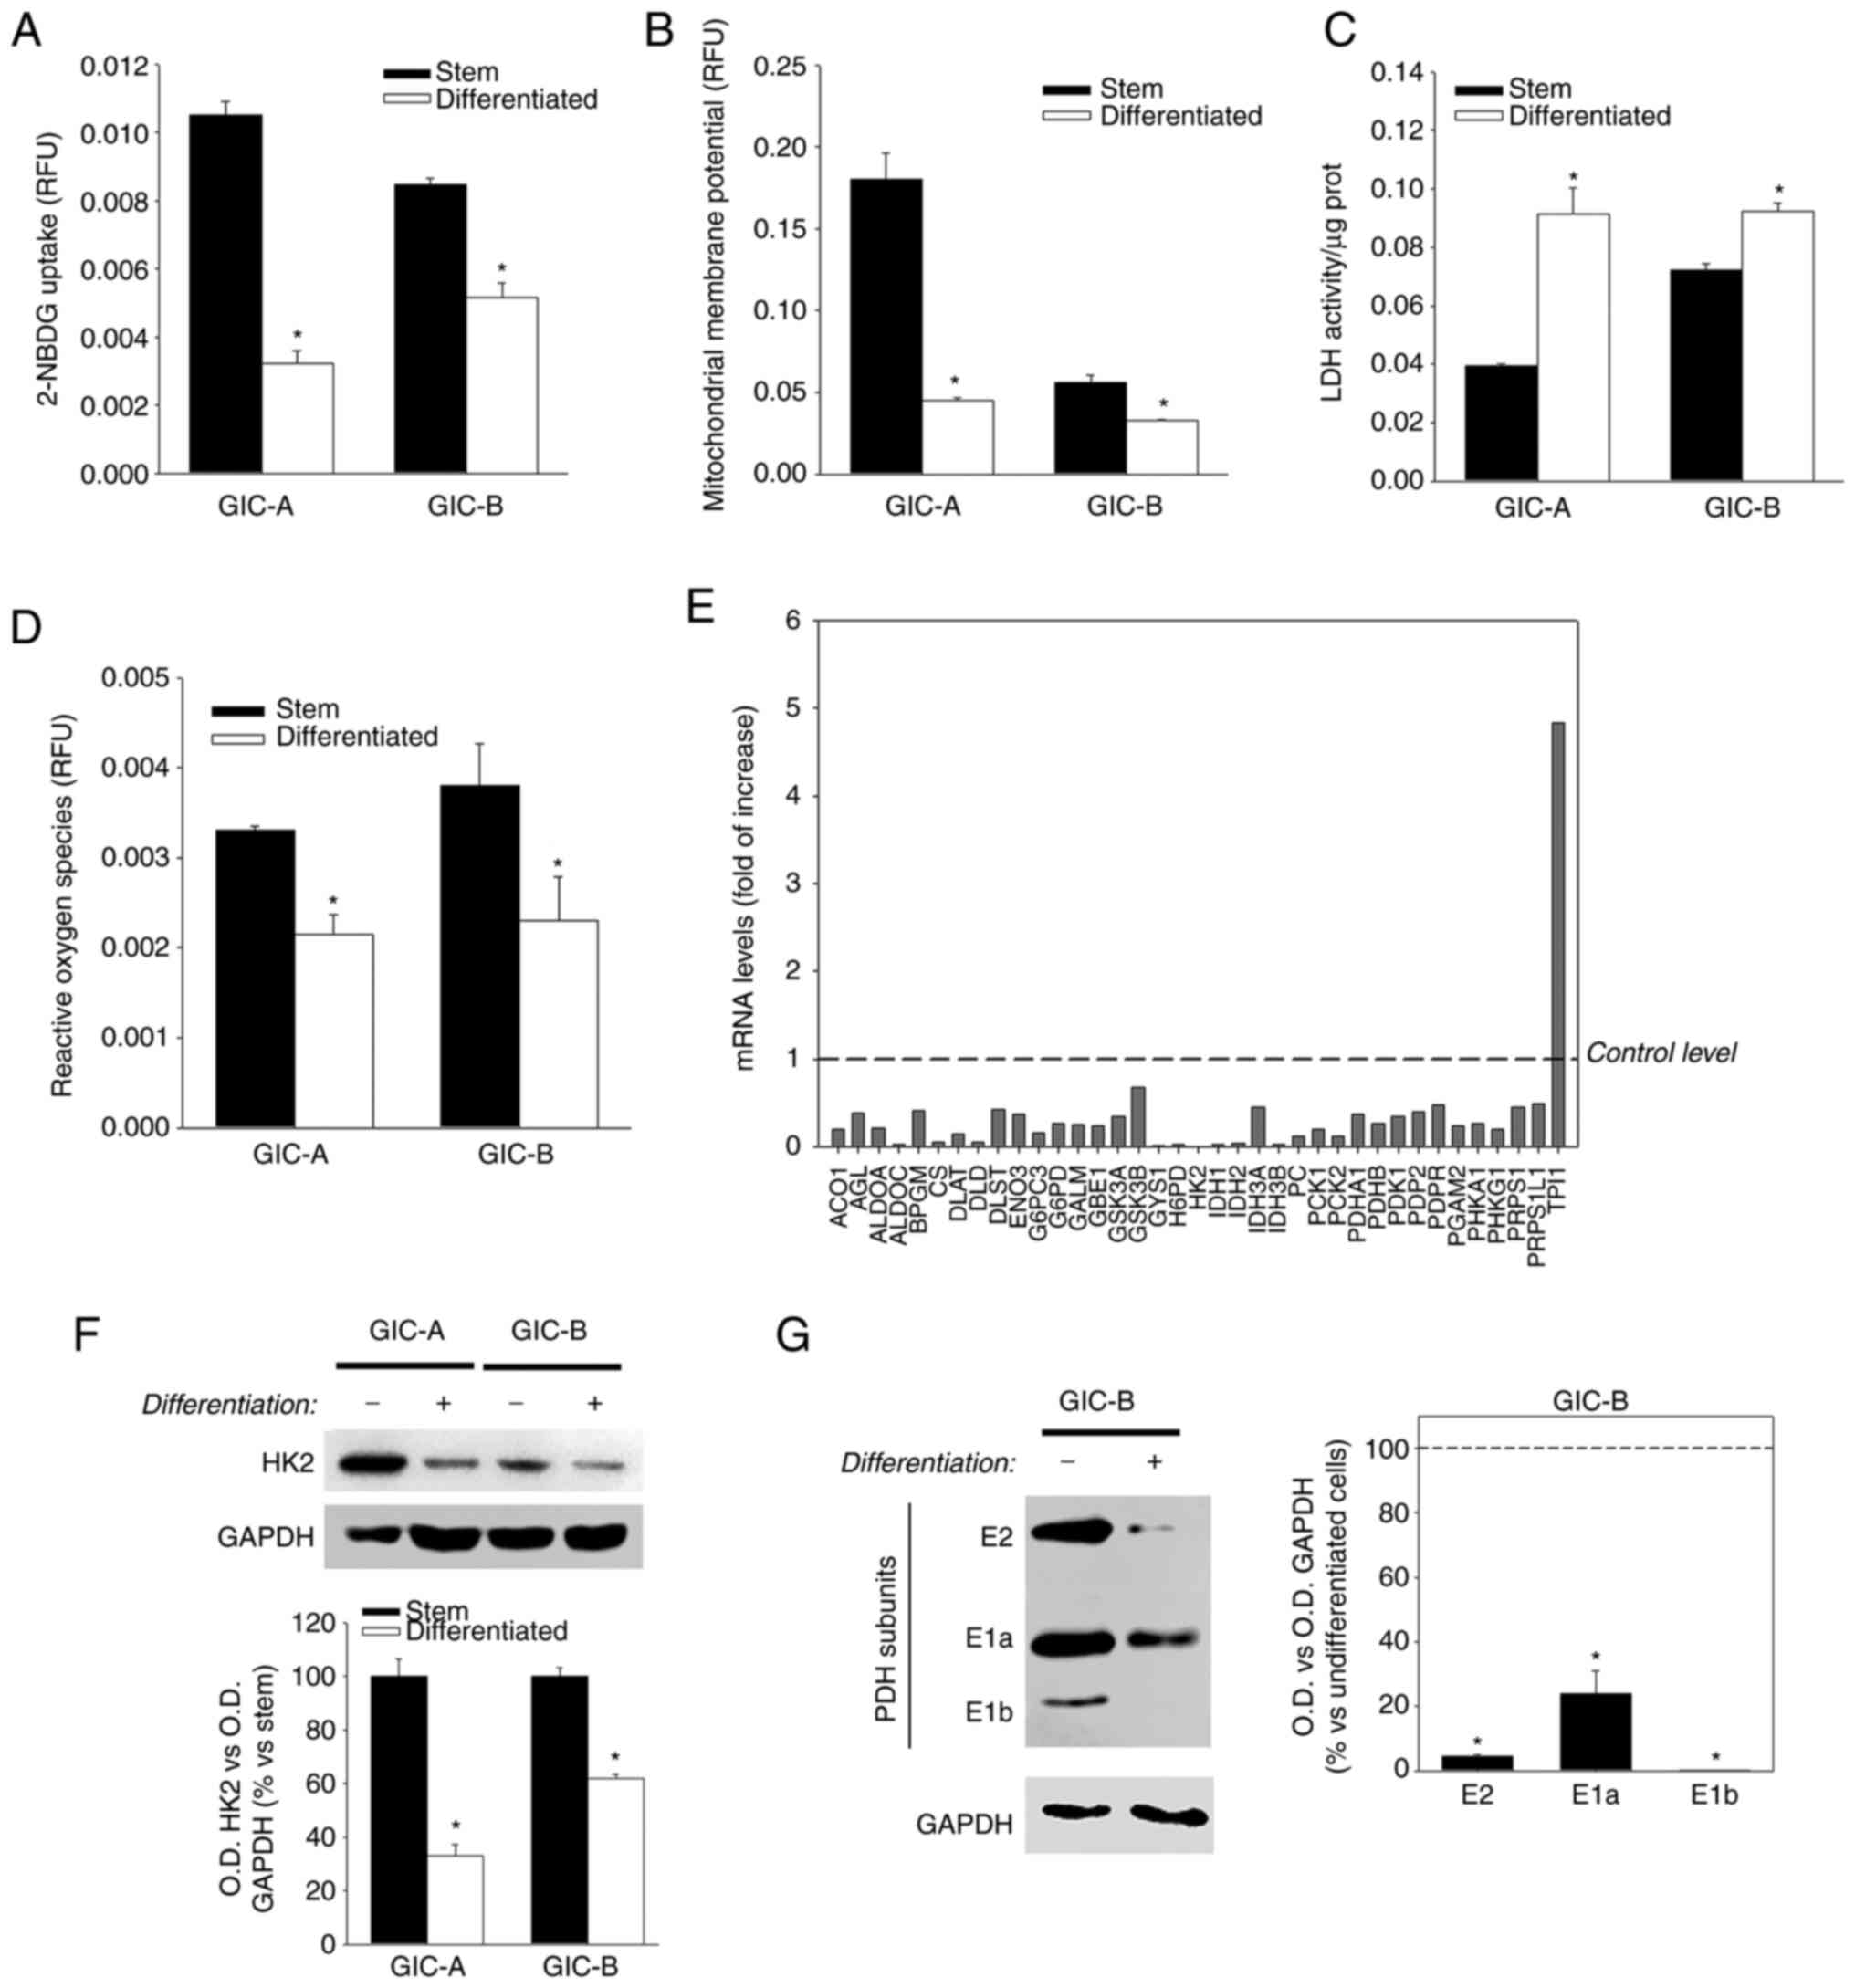 | Figure 1.GICs relay more on mitochondrial
metabolism that their differentiated progeny. (A) Glucose uptake,
(B) mitochondrial membrane potential-as rhodamine 123 fluorescence
per cell-, (C) LDH activity and (D) reactive oxygen species were
determined in neutrospheres cultures (stem) and their
differentiated counterpart. (E) mRNA expression levels of glucose
metabolism related genes in differentiated vs. stem cells
determined by reverse transcription-quantitative PCR. Only those
genes with a decrease in their expression of at least half or an
increase in their expression of at least double have been
represented. Dashed line represents the level of expression of stem
cell. (F and G) Representative blot showing the protein expression
of HK2 and PDH (E1a, E1b and E2 subunits) in both stem cells and
their differentiated counterparts. GAPDH expression has been used
as loading control. Dashed line represents levels of expression of
stem cells. *P≤0.05 vs. stem. GICs, glioma initiating cells; LDH,
lactate dehydrogenase; ACO1, aconitase 1, soluble; AGL,
amylo-alpha-1, 6-glucosidase, 4-alpha-glucanotransferase; ALDOA,
aldolase A, fructose-bisphosphate; ALDOC, aldolase C,
fructose-bisphosphate; BPGM, 2,3-bisphosphoglycerate mutase; CS,
citrate synthase; DLAT, dihydrolipoamide S-acetyltransferase; DLD,
dihydrolipoamide dehydrogenase; DLST, dihydrolipoamide
S-succinyl-transferase (E2 component of 2-oxo-glutarate complex);
ENO3, enolase 3 (beta, muscle); G6PC3, glucose 6 phosphatase,
catalytic, 3; G6PD, glucose-6-phosphate dehydrogenase; GALM,
galactose mutarotase (aldose 1-epimerase); GBE1, glucan
(1,4-alpha-), branching enzyme 1; GSK3A, glycogen synthase kinase 3
alpha; GSK3B, glycogen synthase kinase 3 beta; GYS1, glycogen
synthase 1 (muscle); H6PD, hexose-6-phosphate dehydrogenase
(glucose 1-dehydrogenase); HK2, hexokinase 2; IDH1, isocitrate
dehydrogenase 1 (NADP+), soluble; IDH2, isocitrate
dehydrogenase 2 (NADP+), mitochondrial; IDH3A,
isocitrate dehydrogenase 3 (NAD+) alpha; IDH3B,
isocitrate dehydrogenase 3 (NAD+) beta; PC, pyruvate
carboxylase; PCK1, phos-phoenolpyruvate carboxykinase 1 (soluble);
PCK2, phosphoenolpyruvate carboxykinase 2 (mitochondrial); PDHA1,
pyruvate dehydrogenase (lipoamide) alpha 1; PDHB, pyruvate
dehydrogenase (lipoamide) beta; PDK1, pyruvate dehydrogenase
kinase, isozyme 1; PDP2, pyruvate dehydrogenase phosphatase
catalytic subunit 2; PDPR, pyruvate dehydrogenase phosphatase
regulatory subunit; PGAM2, phosphoglycerate mutase 2 (muscle);
PHKA1, phosphorylase kinase, alpha 1 (muscle); PHKG1, phosphorylase
kinase, gamma 1 (muscle); PRPS1, phosphoribosyl pyrophosphate
synthetase 1; PRPS1L1, phosphoribosyl pyrophosphate synthetase
1-like 1; TPI1, triosephosphate isomerase 1. |
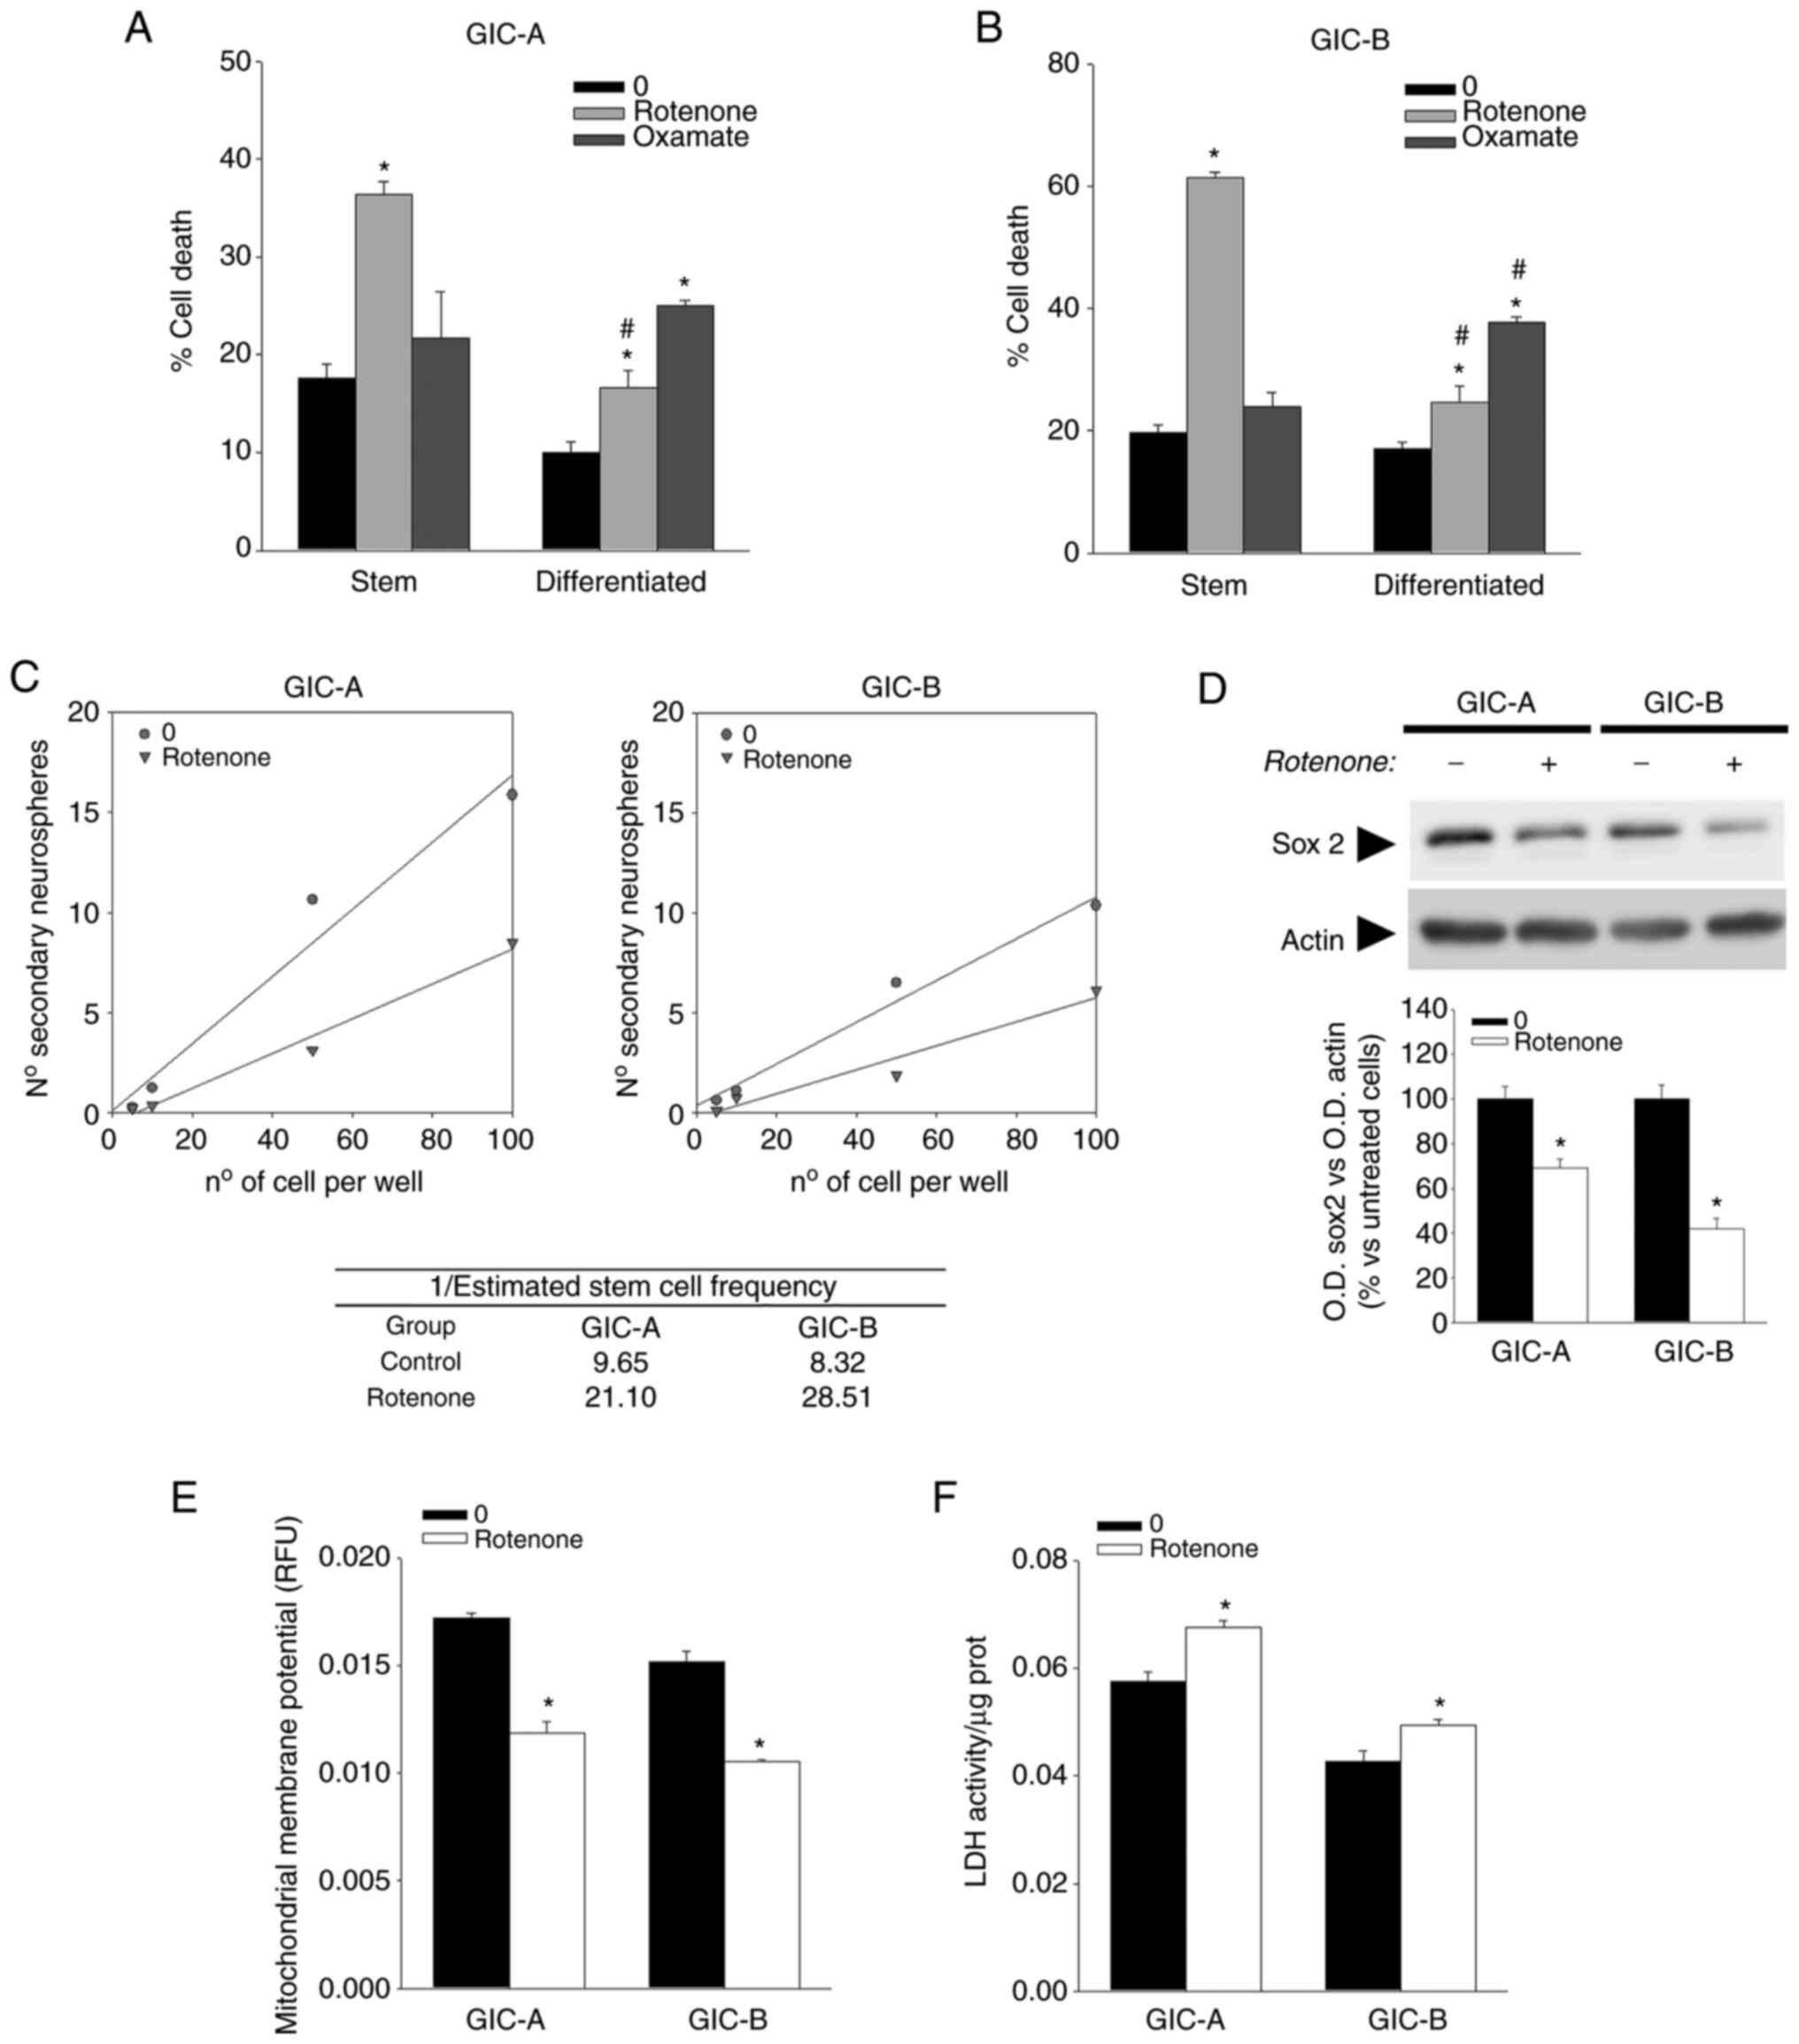
According to the aforementioned results, disruption
of mitochondrial ETC by rotenone resulted in the induction of GICs'
cell death with a significantly fewer effect on the population of
differentiated cells (Fig. 2A and
B). In the same line, inhibition of LDH by oxamate had not a
significant effect on GICs while it induced cell death in
differentiated cells (Fig. 2A and
B). Although the type of cell death induced by the treatments
has not been determined, the data are sufficient to reinforce the
idea that after differentiation, cells become more dependent on
aerobic glycolysis than mitochondrial metabolism. It also has to be
noted that the present data appeared to indicate that
differentiation with serum can improve the basal survival of cells
in culture in one of the GICs (GIC-A). However, the overall results
regarding glucose metabolism parameters did not differ between both
GICs, indicating that this fact appears to be rather an artifact
due to the particularities of primary cell culture. Disruption of
ETC by rotenone also resulted in a decrease of self-renewal
(Fig. 2C) that associated with a
decrease in the expression of the stem cell marker sox2 (Fig. 2D) which has been described to play
a key role in GBM cell stemness and tumor propagation (26). Rotenone treatment not only affected
stemness but also induced a shift in cellular metabolism with a
disruption of mitochondrial membrane potential, as determined by a
decrease in Rhodamine 123 fluorescence (Fig. 2E) and a slight but significant
increase in LDH activity (Fig.
2F).
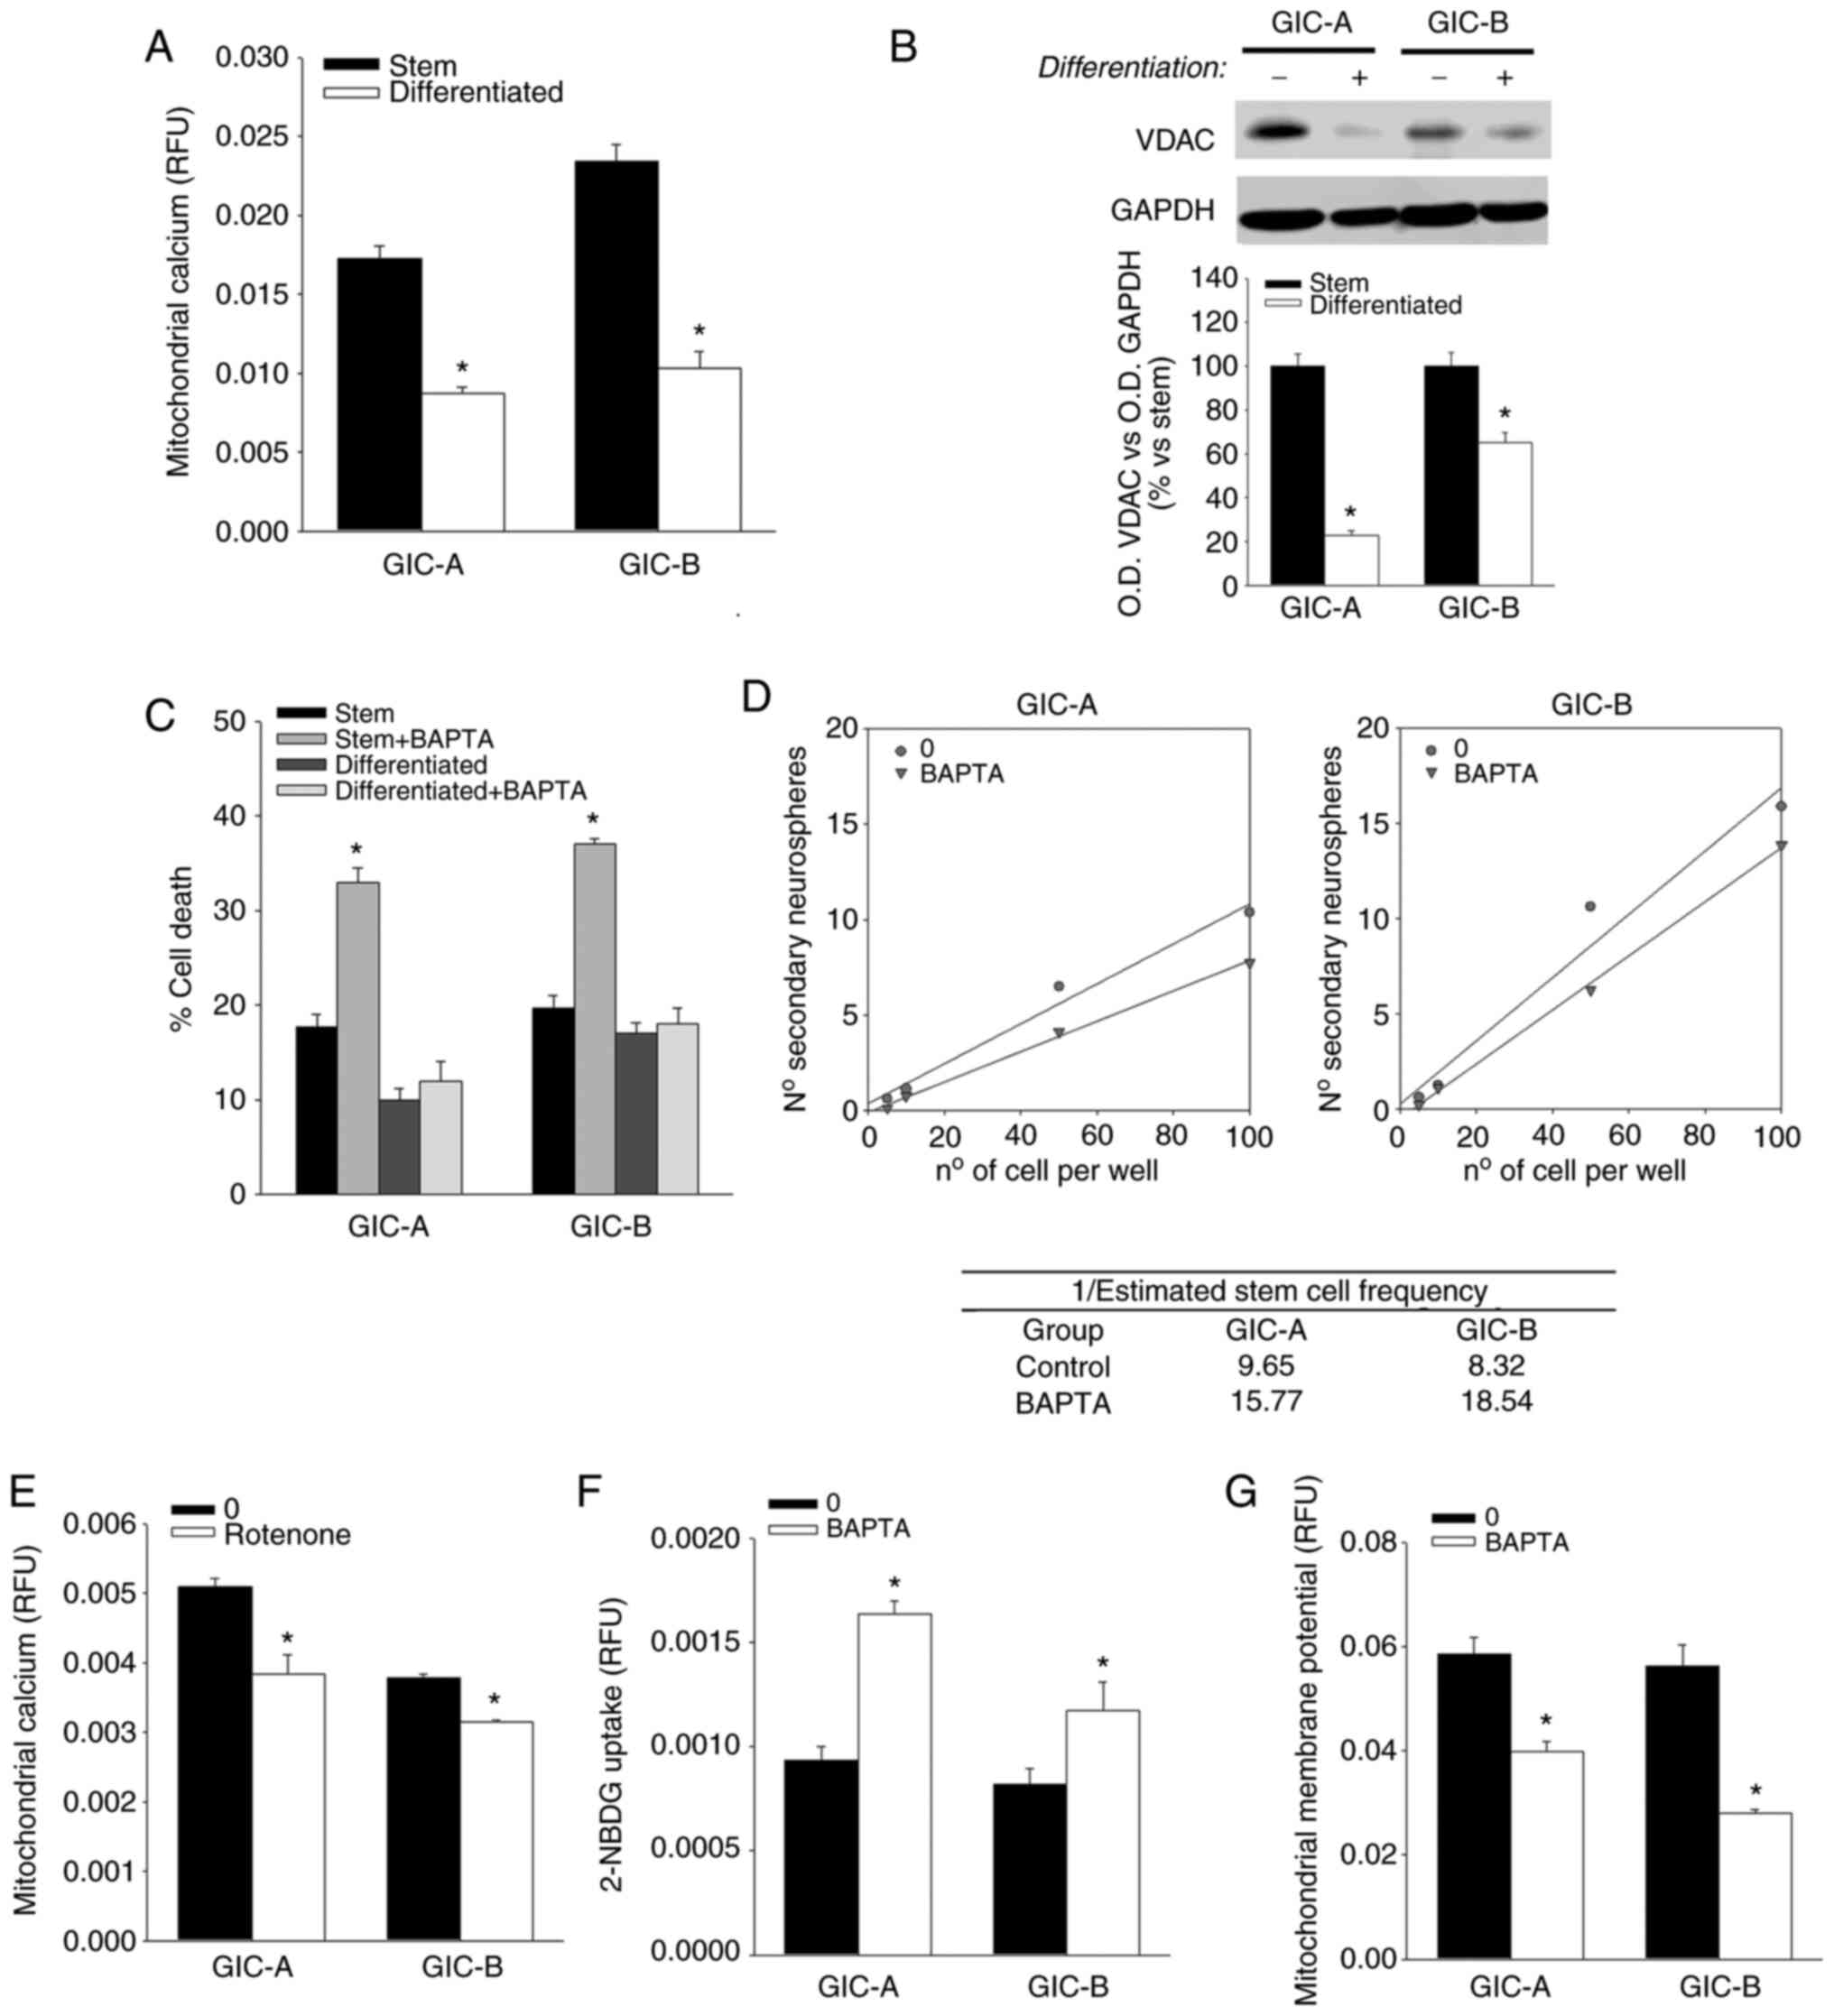
Differences in mitochondrial
metabolism between GICs and differentiated tumor cells are related
to calcium flux
It is well known that calcium uptake by the
mitochondria is essential for the activity of dehydrogenases of the
Krebs cycle and therefore the production of energy at the
mitochondria (27). In this sense,
a decrease in the calcium levels inside the mitochondria was
identified (Fig. 3A), which can be
implicated in the decrease of the mitochondrial activity observed.
A decrease in the expression of VDAC, the main carrier of
Ca2+ in the outer mitochondrial membrane, was also
observed after differentiation, which can be responsible of the
observed decrease in mitochondrial calcium (Fig. 3B). In addition, treatment of cells
with an intracellular calcium chelator, BAPTA, resulted in the
induction of cell death in the GICs subpopulation without any
effect on their differentiated counterparts (Fig. 3C) and also a decrease in the
self-renewal capability of GICs (Fig.
3D), indicating an essential role of cellular calcium flux in
the maintenance of GICs.
As previously stated (27), among the numerous functions that
calcium plays in the mitochondria is the regulation of the
dehydrogenases of the Krebs cycle and therefore it is closely
related with cellular energy metabolism. In this regard, it was
revealed that disruption of ETC by rotenone in GICs results in a
decrease in the mitochondrial calcium levels (Fig. 3E). In the same way, BAPTA
treatment, although it was capable of inducing an increase in
glucose uptake (Fig. 3F), it also
induced a disruption of mitochondrial membrane potential, as
determined by a decrease in the Rhodamine 123 fluorescence in GICs
(Fig. 3G), reinforcing the idea of
a close relationship between calcium flux to the mitochondria and
glucose metabolism in GICs.
ER-mitochondria interaction is
determinant for metabolism and maintenance of GICs
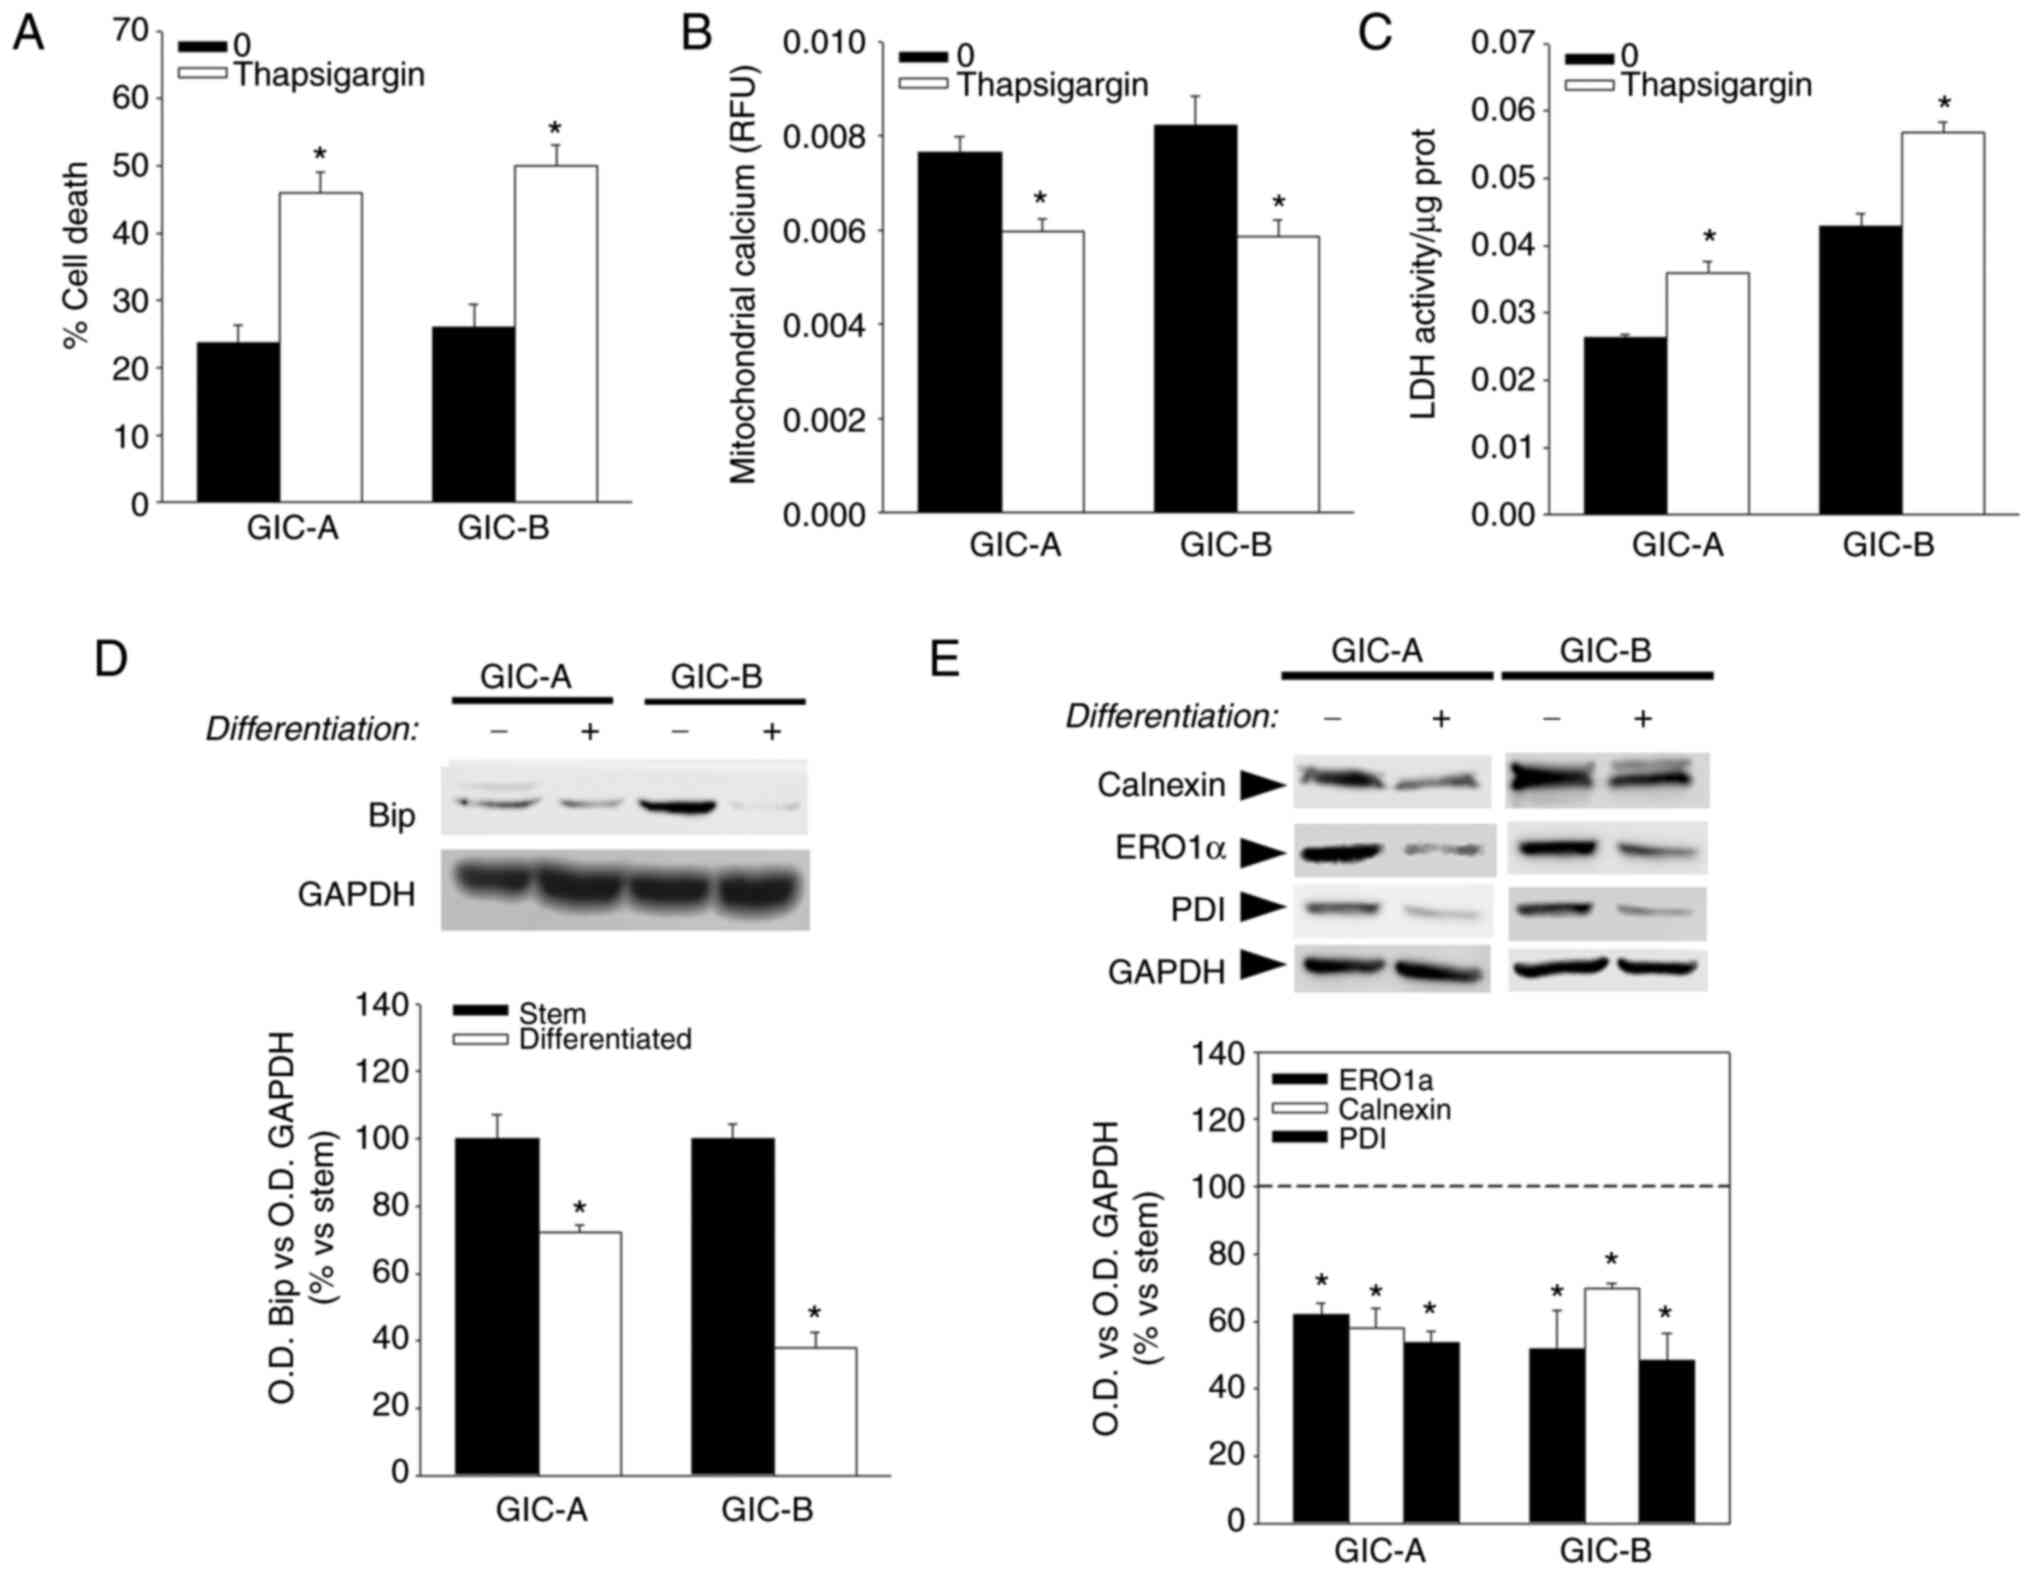
In agreement with data obtained after BAPTA
treatment, incubation of GICs with thapsigargin, a potent inhibitor
of the ion transport activity of sarco/ER Ca2+−ATPases
(SERCA), that disrupt calcium homeostasis at the ER-the main
calcium reservoir in the cell-also induced cell death (Fig. 4A). Moreover, thapsigargin treatment
of GICs also induced a decrease in mitochondrial calcium (Fig. 4B) that was accompanied by an
increase in LDH activity (Fig. 4C)
suggesting that disruption of calcium homeostasis at the ER results
in an alteration of mitochondrial calcium that is probably related
to a swift from mitochondrial metabolism to aerobic glycolysis.
Since thapsigargin, due to its action on SERCA, is
commonly used as an ER stress inducer, these results also pointed
out the possible relevance of ER homeostasis in GICs maintenance.
Interestingly, a decrease was found in the expression of Bip, a
central regulator for ER stress (28), after differentiation of
serum-induced GICs (Fig. 4D).
Moreover, a decrease was also identified in the expression of
endoplasmic reticulum oxidoreductase 1 alpha (ERO1α), protein
disulfide isomerase (PDI) and the ER calcium-binding protein
calnexin (Fig. 4E) under
differentiation culture conditions. ERO1α and PDI have been
described to play a crucial role in ER calcium homeostasis and
calcium transfer to the mitochondria (29).
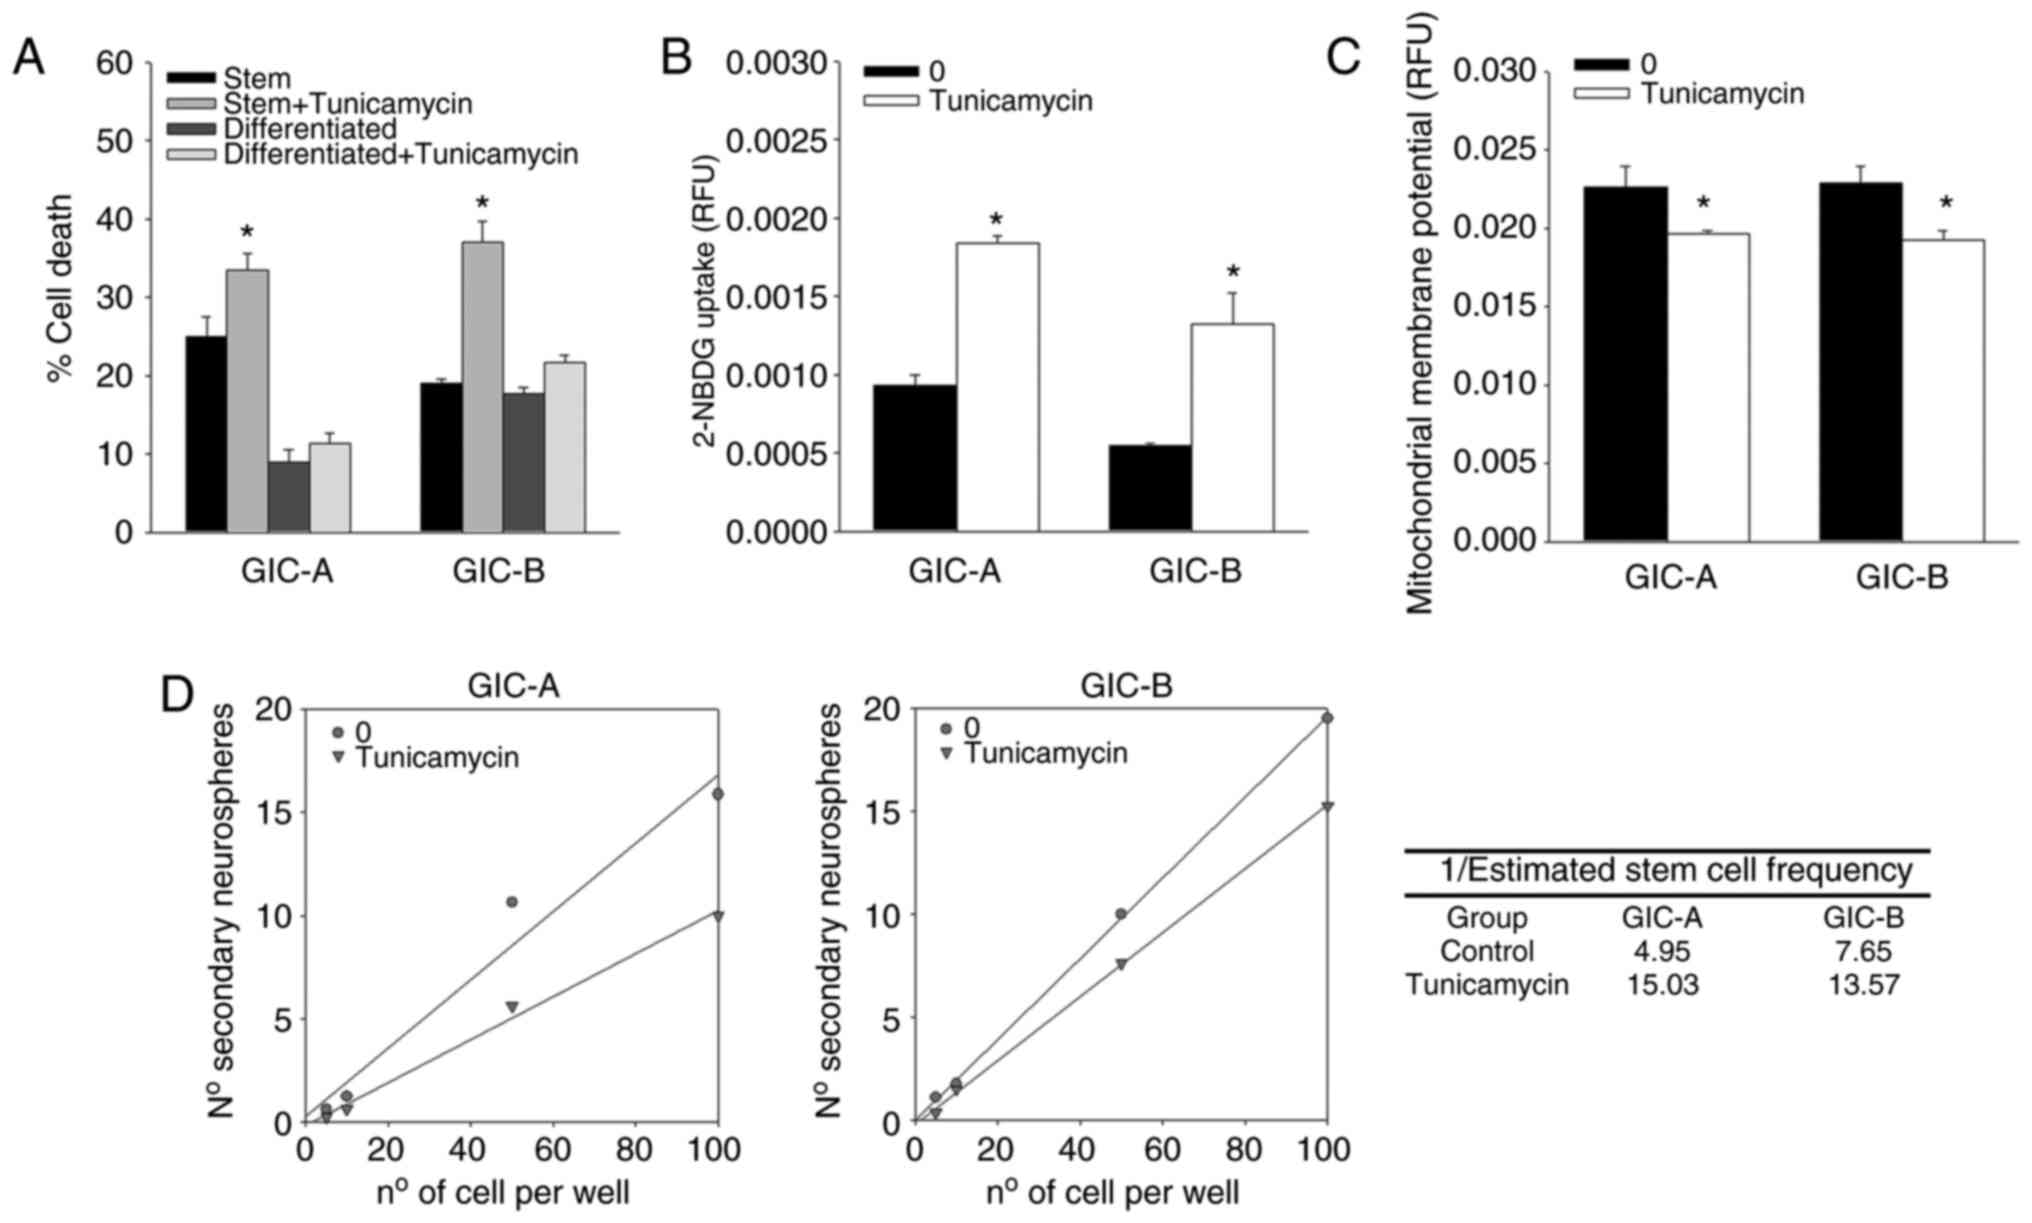
The use of modulators of ER activity also reflected
differences between GIC and their differentiated counterparts.
Thus, treatment of cells with tunicamycin, another ER stress
inducer, also resulted in death of GICs without any cytotoxic
effect in their differentiated counterparts cells (Fig. 5A), while treatment of cells with
the chemical chaperone 4-phenyl butyric acid, that attenuates ER
stress, had no cytotoxic effects on GICs or differentiated (data
not shown). Moreover, tunicamycin treatment also induced an
increase in glucose uptake that associated with a decrease in
rhodamine 123 fluorescence (Fig. 4B
and C), as it was observed for treatment with BAPTA, indicating
that this glucose is probably derived to a metabolic pathway other
than mitochondrial. Tunicamycin treatment also induced a decrease
in self-renewal capability in GICs (Fig. 5D).
Collectively, the aforementioned data suggested an
important role of ER in the regulation of calcium flux and glucose
metabolism in GICs. It is important to note that mitochondrial
calcium influx represents one of the main functions of
ER-mitochondria connections through MERCS (16). In this regard, it is well known
that the tight connection between VDAC1 and the IP3R through the
chaperone GPR75 represents the main mechanism of ER to mitochondria
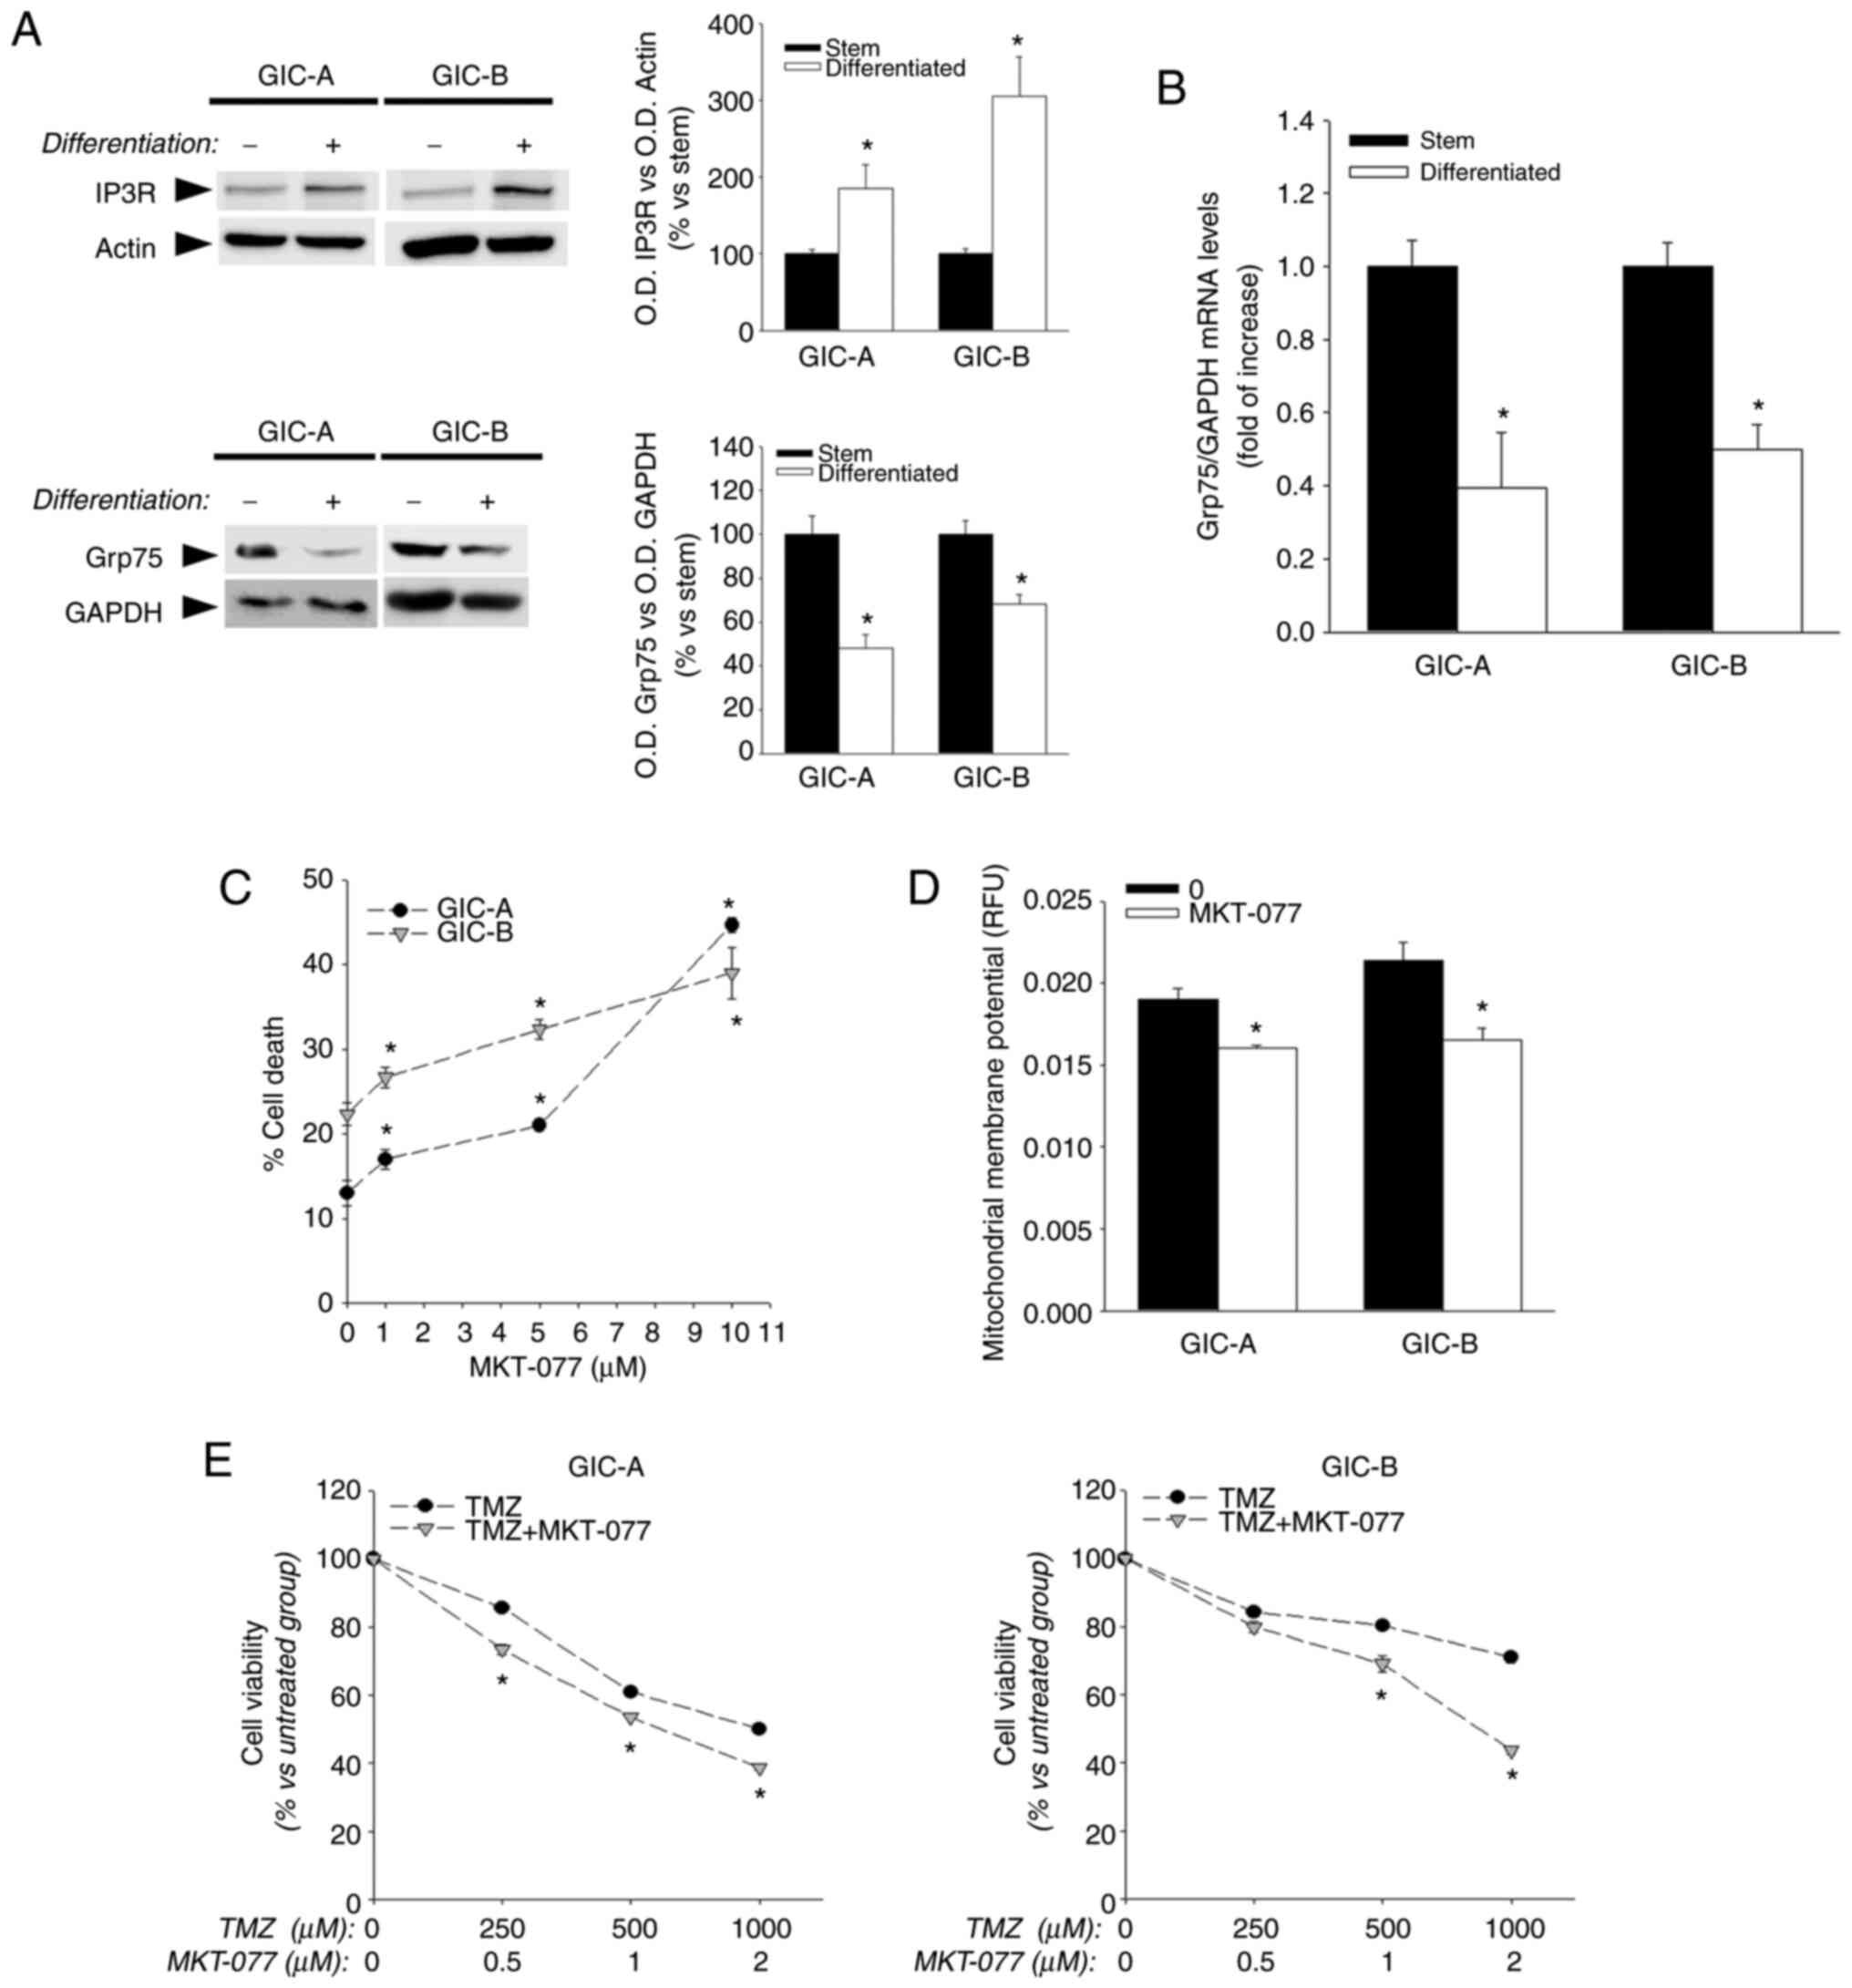
calcium influx. Of interest, although an increase in the expression
of IP3R was identified after serum-induced differentiation
(Fig. 6A), a decrease was also
observed in the expression of GRP75, both at mRNA (Fig. 6B) and protein levels (Fig. 6A), in addition to the decrease in
VDAC expression that was already observed. The use of a chemical
GRP75 inhibitor, MKT-077 revealed that inhibition of this protein
was toxic for GICs (Fig. 6C).
MKT-077 treatment also induced a disruption of the mitochondrial
membrane potential on GICs, as reflected by a decrease in rhodamine
123 fluorescence (Fig. 6D),
reinforcing the idea of a key function of these ER-mitochondria
connections in the regulation of GICs' metabolism; MKT-077 also
enhanced the effect of temozolomide on GICs (Fig. 6E) -current treatment for malignant
gliomas-opening the possibility of using this protein as a target
for the development of new therapies.
Discussion
The present study indicated that GBM cells are
heterogeneous in their metabolic phenotypes, being GICs more
dependent on oxidative phosphorylation (OXPHOS) at the mitochondria
than their differentiated progeny. This distinct metabolic state
appears to be related to ER homeostasis that affects functioning of
ER-mitochondrial contact sites. Although the impact of the
ER-mitochondrial contact sites on metabolism has not been evaluated
in normal stem cells from same patients (since they cannot be
isolated from tumor tissue) or in commercial cell lines (since
there are no commercial cell lines of human glial precursors
derived from adults, to the best of our knowledge), the present
study attempted to establish differences between two different
tumor subpopulations within the tumor rather to compare between
normal and tumor cells.
Genetic alterations and environmental modifications,
such as hypoxia, converge in one of the traits that define tumor
cells and that are in the spotlight for the design of new
therapeutic strategies. In fact, metabolic adaptation is considered
one of the hallmarks of cancer (8), being aerobic glycolysis or the
Warburg effect the main change in cancer cells. Thus, cancer cells
move from OXPHOS as a way of obtaining their energy towards lactate
production, even at normal oxygen concentrations. However, there
are relatively few studies and quite a few discrepancies in
relation to the metabolic pathways used by CSCs in general and GICs
in particular. Some studies indicated that CSCs have a distinctive
metabolic phenotype compared with tumor bulk cells, although there
is so far no consensus on this. Thus, both the preferential use of
aerobic glycolysis and the mitochondrial oxidative metabolism have
been described (13). Trying to
address this discrepancy, the present results demonstrated that
GICs use mitochondrial metabolism preferably and that this
metabolic pathway decreases after differentiation to tumor bulk
cells by incubation in a medium with serum for 10 days. Despite
measurements have not been performed on differentiated cells
isolated directly from the patient tissue due to the GICs isolation
protocol, differentiation in serum is a well-established protocol
in the literature. Although a decrease was found in glucose
uptake-which can be considered contrary to what happens in the
Warburg effect-glioma cells increased LDH activity in association
to an alteration of mitochondrial activity when differentiated.
This change in mitochondrial activity was accompanied by a decrease
in intracellular ROS. In this sense, although ROS produced by
mitochondria were not directly evaluated, it is well established
that the mitochondria, through the ETC, is the main producer of ROS
inside the cell. Moreover, GICs were more sensitive to the
inhibition of ETC by rotenone and less sensitive to LDH inhibition
by oxamate compared with their differentiated counterparts. These
results are in consistency with previous studies that described a
decrease of stemness in CSCs from different tumors, such as breast
or prostate cancer, after inhibition of complex I of the ETC
(30,31). It must be considered that several
studies carried out on different types of tumors appear to indicate
that the metabolic phenotype of CSCs can be modified depending on
the state of differentiation, tumor microenvironment, or expression
of certain oncogenes, which could explain divergence results
already published, even within the same tumor type (32).
Mitochondrial bioenergetics is largely controlled by
extra mitochondrial events whose activity are frequently altered in
cancer such as calcium homeostasis. Mitochondria can act both as a
reservoir of Ca2+ and as an effector that utilize
Ca2+ to regulate cell survival, proliferation, redox
state and metabolic changes (33).
This mitochondrial Ca2+ homeostasis requires an
efficient interplay between ER, where most intracellular
Ca2+ is stored, and mitochondria through MERCS (34,35).
Thus, controlled raises in matrix Ca2+ concentration
have important metabolic effects, as Ca2+ enhances the
activity of mitochondrial dehydrogenases of the TCA cycle, IDH and
αKGDH, and of PDH (34). The
decrease in mitochondrial calcium that was observed after
differentiation of GICs could be responsible, at least in part, for
the distinct metabolic phenotype observed between GICs and their
differentiated progeny. In fact, it was found that alterations in
calcium homeostasis using calcium chelators not only resulted toxic
for the subpopulation of GICs, decreasing also self-renewal
capacity, but also induced changes in glucose metabolism such as an
increase in glucose uptake and a disruption in mitochondrial
membrane potential. Although these results may appear
contradictory, the fact that an increase in glucose uptake in GICs
does not correlate to an increase in mitochondrial activity could
be explained by the fact that use of that glucose may be derived to
other metabolic pathways. As an example, it has been described that
quiescent breast CSCs have a high metabolic rate of the pentose
phosphate pathway, which favors the generation of reducing power
(NADPH), essential for the maintenance of the state cellular redox
(36).
The decrease in the expression of Bip, central
regulator of ER stress responses, after differentiation of GICs,
together with the fact that similar effects were observed in cell
viability, self-renewal and glucose metabolism when using ER stress
inducers compared with calcium chelators, appears to indicate that
ER homeostasis also plays a key role in GICs' maintenance and
metabolism. Moreover, a decrease was also identified in the
expression of ERO1α, PDI and the ER calcium-binding protein
calnexin after differentiation. ERO1α-PDI have been described to be
enriched at the MERCS interface and to play a crucial role in
calcium flux from ER to mitochondria. Thus, downregulation of Ero1α
inhibits mitochondrial Ca2+ fluxes and modifies the
activity of mitochondrial Ca2+ uniporters (29).
In this sense, it is important to note that
mitochondrial calcium influx represents one of the main functions
of ER-mitochondria connections (16), being the IP3Rs-Grp75-VDACs complex
the basis for the mitochondrial Ca2+ transfer in MERCS
(37). In this regard, a decrease
was revealed in VDAC expression in differentiated cells that can be
responsible for the observed decrease in mitochondrial calcium
level. The relevance of VDAC expression in GBM has been already
described. Thus, inhibition of VDAC expression by siRNA has been
described to inhibit GBM growth and to reduce angiogenesis,
invasiveness and stemness (38). A
decrease was also demonstrated in the expression of Grp75, also
known as mortalin, after differentiation of GICs. This protein has
been described to be enriched in a large variety of cancers and it
is also considered to act as a regulatory factor in the maintaining
the stemness of the CSCs (39).
Thus, it has been reported that mortalin is able to upregulate the
activity of some CSCs signaling pathways such as the
Wnt/GSK3β/β-catenin in breast and colorectal cancer (40,41).
Moreover, upregulation of mortalin expression in correlation with
malignant progression in brain tumors has been described several
years ago (42). The use of a
chemical Grp75 inhibitor revealed an essential role of this protein
in GICs' survival, chemoresistance and mitochondrial metabolism
maintenance. It is well known that GICs resist current treatments
and repopulate the tumor being responsible for patient death. Thus,
the greater proportion of GICs, the higher tumor aggression and
poorer prognosis as current therapies show poor efficacy against
GICs. Understanding the differences between both tumor
subpopulation can help to move cancer therapy towards less
conventional but more efficient approaches. Combination of Grp75
inhibitor and temozolomide, current chemotherapeutic treatment for
malignant gliomas, resulted in an increased GICs' death, suggesting
that Grp75, and therefore the ER-mitochondria connection through
the IP3Rs-Grp75-VDACs complex, is also important for
chemoresistance of this CSC subpopulation and could perhaps be
taken into account as a target for the development of new and more
efficient therapies.
Supplementary Material
Supporting Data
Supporting Data
Acknowledgements
The authors would like to acknowledge support from
the BioISI/FCUL Microscopy Facility, a node of the Portuguese
Platform of BioImaging (PPBI-POCI-01-0145-FEDER-022122).
Funding
The present study was supported by the UIDB/04046/2020 and
UIDP/04046/2020, and individual grants (grant nos.
PTDC/MED-NEU/31417/2017 and PTDC/FIS-MAC/2741/2021) through
Fundação para a Ciência e Tecnologia (FCT, Portugal). It was also
supported by the Spaniard Association Against Cancer (AECC; grant
no. SV-19-AECC-FPI) and the Consejería de Economía y Empleo del
Principado de Asturias (FICYT; grant no. Severo-Ochoa BP20-073)
fellowships. IUOPA is supported by the ‘Obra Social Cajastur’ and
the Government of the Principality of Asturias.
Availability of data and materials
The datasets used and/or analyzed during the current
study are available from the corresponding author upon reasonable
request.
Authors' contributions
IA, CR and VM conceptualized the present study. MTC,
AMSS, NPM and MAAV performed laboratory experiments. VM supervised
the study. MTC performed data visualization. IA, CR and VM wrote
the original draft. FH, JRB contributed to the interpretation of
the data and reviewing the manuscript. MTC and VM confirm the
authenticity of all the raw data. All authors read and approved the
final manuscript.
Ethics approval and consent to
participate
The present study was conducted in accordance with
the Declaration of Helsinki and was approved (approval no.
2021.008; approved on January 22nd, 2021) by the Clinical Research
Ethics Committee of the Principality of Asturias (Oviedo, Spain).
Written informed consent was obtained by all patients who
participated in the present study.
Patient consent for publication
Not applicable.
Competing interests
The authors declare that they have no competing
interests.
References
|
1
|
Hussain SF, Yang D, Suki D, Aldape K,
Grimm E and Heimberger AB: The role of human glioma-infiltrating
Mi-croglia/Macrophages in mediating antitumor immune responses.
Neuro Oncol. 8:261–279. 2006. View Article : Google Scholar : PubMed/NCBI
|
|
2
|
Charalambous C, Chen T and Hofman FM:
Characteristics of tumor-associated endothelial cells derived from
glioblastoma multiforme. Neurosurg Focus. 20:E222006. View Article : Google Scholar : PubMed/NCBI
|
|
3
|
Castro MG, Cowen R, Williamson IK, David
A, Jimenez-Dalmaroni MJ, Yuan X, Bigliari A, Williams JC, Hu J and
Lowenstein PR: Current and future strategies for the treatment of
malignant brain tumors. Pharmacol Ther. 98:71–108. 2003. View Article : Google Scholar : PubMed/NCBI
|
|
4
|
Binello E and Germano IM: Targeting glioma
stem cells: A novel framework for brain tumors. Cancer Sci.
102:1958–1966. 2011. View Article : Google Scholar : PubMed/NCBI
|
|
5
|
Suvà ML, Rheinbay E, Gillespie SM, Patel
AP, Wakimoto H, Rabkin SD, Riggi N, Chi AS, Cahill DP, Nahed BV, et
al: Reconstructing and reprogramming the tumor-propagating
potential of glioblastoma stem-like cells. Cell. 157:580–594. 2014.
View Article : Google Scholar : PubMed/NCBI
|
|
6
|
Bao S, Wu Q, McLendon RE, Hao Y, Shi Q,
Hjelmeland AB, Dewhirst MW, Bigner DD and Rich JN: Glioma stem
cells promote radioresistance by preferential activation of the DNA
damage response. Nature. 444:756–760. 2006. View Article : Google Scholar : PubMed/NCBI
|
|
7
|
Menendez JA, Corominas-Faja B, Cuyàs E and
Alarcón T: Metabostemness: Metaboloepigenetic reprogramming of
cancer stem-cell functions. Oncoscience. 1:803–806. 2014.
View Article : Google Scholar : PubMed/NCBI
|
|
8
|
Hanahan D and Weinberg RA: Hallmarks of
cancer: The next generation. Cell. 144:646–674. 2011. View Article : Google Scholar : PubMed/NCBI
|
|
9
|
Vander Heiden MG, Cantley LC and Thompson
CB: Understanding the Warburg Effect: The metabolic requirements of
cell proliferation. Science. 324:1029–1033. 2009. View Article : Google Scholar : PubMed/NCBI
|
|
10
|
Brand KA and Hermfisse U: Aerobic
glycolysis by proliferating cells: A protective strategy against
reactive oxygen species. FASEB J. 11:388–395. 1997. View Article : Google Scholar : PubMed/NCBI
|
|
11
|
Menendez JA, Joven J, Cufí S,
Corominas-Faja B, Oliveras-Ferraros C, Cuyàs E, Martin-Castillo B,
Lopez-Bonet E, Alarcón T and Vazquez-Martin A: The warburg effect
version 2.0: Metabolic reprogramming of cancer stem cells. Cell
Cycle. 12:1166–1179. 2013. View
Article : Google Scholar : PubMed/NCBI
|
|
12
|
Vlashi E, Lagadec C, Vergnes L, Matsutani
T, Masui K, Poulou M, Popescu R, Della Donna L, Evers P, Dekmezian
C, et al: Metabolic state of glioma stem cells and nontumorigenic
cells. Proc Natl Acad Sci USA. 108:16062–16067. 2011. View Article : Google Scholar : PubMed/NCBI
|
|
13
|
Martin V, Turos-Cabal M, Sanchez-Sanchez
AM and Rodríguez C: Metabolism-redox interplay in tumor stem cell
signaling. Handbook of oxidative stress in cancer: Mechanistic
Aspects. pp1–22. 2021. View Article : Google Scholar
|
|
14
|
Lin H, Patel S, Affeck VS, Wilson I,
Turnbull DM, Joshi AR, Maxwell R and Stoll EA: Fatty acid oxidation
is Required for the respiration and proliferation of malignant
glioma cells. Neuro Oncol. 19:43–54. 2017. View Article : Google Scholar : PubMed/NCBI
|
|
15
|
Wang M and Kaufman RJ: The impact of the
endoplasmic reticulum protein-folding environment on cancer
development. Nat Rev Cancer. 14:581–597. 2014. View Article : Google Scholar : PubMed/NCBI
|
|
16
|
Rowland AA and Voeltz GK: Endoplasmic
reticulum-mitochondria contacts: Function of the junction. Nat Rev
Mol Cell Biol. 13:607–625. 2012. View
Article : Google Scholar : PubMed/NCBI
|
|
17
|
Cardenas C, Miller RA, Smith I, Bui T,
Molgo J, Müller M, Vais H, Cheung KH, Yang J, Parker I, et al:
Essential regulation of cell bioenergetics by constitutive InsP3
Receptor Ca2+ Transfer to Mitochondria. Cell. 142:270–283. 2010.
View Article : Google Scholar : PubMed/NCBI
|
|
18
|
Arismendi-Morillo G, Castellano-Ramírez A
and Seyfried TN: Ultrastructural characterization of the
mitochon-dria-associated membranes abnormalities in human
astrocytomas: Functional and therapeutics implications. Ultrastruct
Pathol. 41:234–244. 2017. View Article : Google Scholar : PubMed/NCBI
|
|
19
|
Galli R, Binda E, Orfanelli U, Cipelletti
B, Gritti A, de Vitis S, Fiocco R, Foroni C, Dimeco F and Vescovi
A: Isolation and Characterization of Tumorigenic, Stem-like Neural
Precursors from Human Glioblastoma. Cancer Res. 64:7011–7021. 2004.
View Article : Google Scholar : PubMed/NCBI
|
|
20
|
Singh SK, Hawkins C, Clarke ID, Squire JA,
Bayani J, Hide T, Henkelman RM, Cusimano MD and Dirks PB:
Identification of human brain tumour initiating cells. Nature.
432:396–401. 2004. View Article : Google Scholar : PubMed/NCBI
|
|
21
|
Livak KJ and Schmittgen TD: Analysis of
relative gene expression data using real-time quantitative PCR and
the 2(−Delta Delta C(T)) method. Methods. 25:402–408. 2001.
View Article : Google Scholar : PubMed/NCBI
|
|
22
|
Zheng H, Ying H, Wiedemeyer R, Yan H,
Quayle SN, Ivanova EV, Paik JH, Zhang H, Xiao Y, Perry SR, et al:
PLAGL2 regulates Wnt signaling to impede differentiation in neural
stem cells and gliomas. Cancer Cell. 17:497–509. 2010. View Article : Google Scholar : PubMed/NCBI
|
|
23
|
Hong X, Chedid K and Kalkanis SN:
Glioblastoma cell line-derived spheres in serum containing medium
versus serum-free medium: A comparison of cancer stem cell
properties. Int J Oncol. 41:1693–1700. 2012. View Article : Google Scholar : PubMed/NCBI
|
|
24
|
Kim EJ, Jin X, Kim OR, Ham SW, Park SH and
Kim H: Glioma stem cells and their non-stem differentiated glioma
cells exhibit differences in mitochondrial structure and function.
Oncol Rep. 39:411–416. 2018.PubMed/NCBI
|
|
25
|
Gangemi RM, Griffero F, Marubbi D, Perera
M, Capra MC, Malatesta P, Ravetti GL, Zona GL, Daga A and Corte G:
SOX2 silencing in glioblastoma tumor-initiating cells causes stop
of proliferation and loss of tumorigenicity. Stem Cells. 27:40–48.
2009. View Article : Google Scholar : PubMed/NCBI
|
|
26
|
Lopez-Bertoni H, Johnson A, Rui Y, Lal B,
Sall S, Malloy M, Coulter JB, Lugo-Fagundo M, Shudir S, Khela H, et
al: Sox2 induces glioblastoma cell stemness and tumor propagation
by repressing TET2 and deregulating 5hmC and 5mC DNA modifications.
Signal Transduct Target Ther. 7:372022. View Article : Google Scholar : PubMed/NCBI
|
|
27
|
Contreras L, Drago I, Zampese E and Pozzan
T: Mitochondria: The calcium connection. Biochim Biophys Acta.
1797:607–618. 2010. View Article : Google Scholar : PubMed/NCBI
|
|
28
|
Kopp MC, Larburu N, Durairaj V. Adams CJ
and Ali MMU: UPR Proteins IRE1 and PERK Switch BiP from Chaperone
to ER Stress Sensor. Nat Struct Mol Biol. 26:1053–1062. 2019.
View Article : Google Scholar : PubMed/NCBI
|
|
29
|
Anelli T, Bergamelli L, Margittai E,
Rimessi A, Fagioli C, Malgaroli A, Pinton P, Ripamonti M, Rizzuto R
and Sitia R: Ero1α Regulates Ca2+ fluxes at the endoplasmic
reticulum-mitochondria interface (MAM). Antioxid Redox Signal.
16:1077–1087. 2012. View Article : Google Scholar : PubMed/NCBI
|
|
30
|
Jung JW, Park SB, Lee SJ, Seo MS, Trosko
JE and Kang KS: Metformin represses self-renewal of the human
breast carcinoma stem cells via inhibition of estrogen
receptor-mediated OCT4 Expression. PLoS One. 6:e280682011.
View Article : Google Scholar : PubMed/NCBI
|
|
31
|
Mayer MJ, Klotz LH and Venkateswaran V:
Metformin and prostate cancer stem cells: A novel therapeutic
target. Prostate Cancer Prostatic Dis. 18:303–309. 2015. View Article : Google Scholar : PubMed/NCBI
|
|
32
|
Snyder V, Reed-Newman TC, Arnold L, Thomas
SM and Anant S: Cancer stem cell metabolism and potential
therapeutic targets. Front Oncol. 8:2032018. View Article : Google Scholar : PubMed/NCBI
|
|
33
|
Cannino G, Ciscato F, Masgras I,
Sánchez-Martín C and Rasola A: Metabolic plasticity of tumor cell
mitochondria. Front Oncol. 8:3332018. View Article : Google Scholar : PubMed/NCBI
|
|
34
|
Filadi R and Pozzan T: Generation and
functions of second messengers microdomains. Cell Calcium.
58:405–414. 2015. View Article : Google Scholar : PubMed/NCBI
|
|
35
|
Tarasov AI, Griffiths EJ and Rutter GA:
Regulation of ATP production by mitochondrial Ca(2+). Cell Calcium.
52:28–35. 2012. View Article : Google Scholar : PubMed/NCBI
|
|
36
|
Debeb BG, Lacerda L, Larson R, Wolfe AR,
Krishnamurthy S, Reuben JM, Ueno NT, Gilcrease M and Woodward WA:
Histone deacetylase inhibitor-induced cancer stem cells exhibit
high pentose phosphate pathway metabolism. Oncotarget.
7:28329–28339. 2016. View Article : Google Scholar : PubMed/NCBI
|
|
37
|
Wang N, Wang C, Zhao H, He Y, Lan B, Sun L
and Gao Y: The MAMs structure and its role in cell death. Cells.
10:6572021. View Article : Google Scholar : PubMed/NCBI
|
|
38
|
Arif T, Krelin Y, Nakdimon I, Benharroch
D, Paul A, Dadon-Klein D and Shoshan-Barmatz V: VDAC1 is a
molecular target in glioblastoma, with its depletion leading to
reprogrammed metabolism and reversed oncogenic properties. Neuro
Oncol. 19:951–964. 2017. View Article : Google Scholar : PubMed/NCBI
|
|
39
|
Yun CO, Bhargava P, Na Y, Lee JS, Ryu J,
Kaul SC and Wadhwa R: Relevance of mortalin to cancer cell stemness
and cancer therapy. Sci Rep. 7:420162017. View Article : Google Scholar : PubMed/NCBI
|
|
40
|
Wei B, Cao J, Tian JH, Yu CY, Huang Q, Yu
JJ, Ma R, Wang J, Xu F and Wang LB: Mortalin maintains breast
cancer stem cells stemness via activation of Wnt/GSK3β/β-Catenin
signaling pathway. Am J Cancer Res. 11:2696–2716. 2021.PubMed/NCBI
|
|
41
|
Xu M, Zhang Y, Cui M, Wang X and Lin Z:
Mortalin contributes to colorectal cancer by promoting
proliferation and epithelial-mesenchymal transition. IUBMB Life.
72:771–781. 2020. View Article : Google Scholar : PubMed/NCBI
|
|
42
|
Takano S, Wadhwa R, Yoshii Y, Nose T, Kaul
SC and Mitsui Y: Elevated levels of mortalin expression in human
brain tumors. Exp Cell Res. 237:38–45. 1997. View Article : Google Scholar : PubMed/NCBI
|