Introduction
In recent years, different molecular subtypes of pancreatic ductal adenocarcinoma (PDAC) have been described based on gene expression patterns. The consensus is a two-group classification into a classical and basal-like subtype, with significantly lower survival rates for patients with a basal-like PDAC phenotype (1,2). However, novel single-cell RNA sequencing studies have shown that few PDAC cases represent pure classical or basal-like subtypes (3,4). Most tumors are composed of a mixture of classical and basal-like tumor cell populations or intermediate hybrid tumor cells, and thus exhibit a high degree of intratumoral heterogeneity (3,4). The evolution of PDAC is driven by somatic mutations, which primarily affect KRAS, CDKN2A (p16), TP53 and SMAD4. Genomic alterations equally occur in classical and basal-like tumors, indicating that subtype identity is defined by other mechanisms (5). In the present study, it was hypothesized that differences in the transcriptional programs are induced by histone acetylation.
Lomberk et al (6) determined histone modifications in classical and basal-like PDAC samples and linked transcriptional phenotypes to distinct chromatin states. In classical tumors, open enhancer regions characterized by histone acetylation are associated with transcription factors involved in pancreatic differentiation, such as GATA6 (GATA binding protein 6) and ELF3 (E74 like ETS transcription factor 3). On the other hand, active gene enhancer regions in basal-like tumor samples are associated with genes that regulate epithelial-to-mesenchymal transition (EMT) and TGFβ signaling, which promote tumor cell aggressiveness (6). The acetylation of lysine 9 (H3K9ac) and 27 (H3K27ac) at histone H3 in promoter or enhancer regions is linked with gene activation. Histone acetylation and deacetylation are catalyzed by histone acetyltransferases (HATs) and histone deacetylases (HDACs), respectively (7). Notably, previous investigations have demonstrated that the expression of HDAC1 and HDAC2 in pancreatic tumor cells induces loss of histone acetylation at the gene promoter of E-cadherin, which is a marker gene for the classical PDAC subtype (8,9). Epigenetic silencing of E-cadherin results in EMT and increased metastatic potential of pancreatic cancer cells. Treatment of pancreatic cancer cells with an HDAC inhibitor (HDACi) restores E-cadherin expression and attenuates migration of a basal-like human cell line in vitro (8,9). These data suggest that epigenetic drugs affecting histone acetylation may reprogram aggressive tumor cells with EMT and metastatic characteristics into a more differentiated tumor cell phenotype.
Several studies have examined the effects of epigenetic drugs that modify histone acetylation to improve the response of pancreatic cancer cells to standard-of-care chemotherapy, such as gemcitabine (10-13). Although the aforementioned studies have shown promising functional and synergistic effects of combination therapy in experimental PDAC models, the translation into clinical trials is limited (14). One aspect that might have led to failure is the lack of patient stratification and prior selection of patients who would benefit from an epigenetic therapy. It is unknown if epigenetic drugs have a similar or distinct effects on tumor cells of the two molecular PDAC subtypes. As histone acetylation profiles contribute to phenotypical PDAC variants in low- and high-grade PDAC (15) or classical and basal-like PDAC subtypes (6), the present study investigated if classical and basal-like cell lines differ in their epigenetic reprogramming ability. Seven human PDAC cell lines were divided into a classical and basal-like subtype and the association between the expression of subtype marker genes and histone acetylation profiles were investigated. The overall differences of histone acetylation levels and corresponding catalyzing histone modifiers were determined in classical and basal-like cell lines. Moreover, short- and long-term treatment with HATi A485 and the pan-HDACi vorinostat (SAHA) was performed to assess PDAC subtype-specific transcriptomic and phenotypical changes.
Materials and methods
Cell culture
The human pancreatic cancer cell lines PaTu-S, Colo357, PaTu-T, PANC-1 and MIAPaCa-2 were cultivated in Dulbecco's Modified Eagle Medium (DMEM; cat. no. D5796), supplemented with 10% FBS (cat. no. F9665) and 1% penicillin/streptomycin (PS; cat. no. P0781; all Sigma-Aldrich; Merck KGaA). The cell lines Capan-1 and Capan-2 were cultured in RPMI-1640 medium (cat. no. 21875091; Thermo Fisher Scientific, Inc.) with 20% FBS and 1% PS. All cell lines were obtained from the cell bank of the Department of Medicine II at LMU University Hospital and verified using STR profiling. All cell lines were incubated at 37°C in a humidified chamber with saturated atmosphere containing 5% CO2. Cell lines were passaged at a confluency of 80-90% with 1X Trypsin/EDTA (cat. no. T3924; Sigma-Aldrich; Merck KGaA) in Dulbecco's PBS. Cell lines were mycoplasma-negative, as tested by PCR Mycoplasma Detection Kit (cat. no. ABM-G238, Biozol). Light microscopy images (magnification, ×100) were taken under normal cell culture conditions.
Cell proliferation and viability assays
Cell proliferation and viability was measured with colorimetric conversion of MTT (cat. no. M2128; Sigma-Aldrich; Merck KGaA). To determine cell proliferation PaTu-S, Colo357, PaTu-T, PANC-1 and MIAPaCa-2 cells were seeded at a density of 2,000 cells/well and Capan-1 and Capan-2 cells were seeded at a density of 5,000 cells/well in 96-well plates. At 0, 24, 48, 72 and 96 h, 20 μl MTT (2.5 mg/ml) was added to the cell culture media and incubated for 3 h at 37°C with 5% CO2. Media was aspirated and replaced with 100 μl DMSO. Following 30 min incubation, optical density was measured at 570/690 nm using a microplate reader. Gemcitabine cytotoxicity was determined by seeding 8,000-10,000 cells/well in 96-well plates. After 24 h, cell lines were treated with 1×10⁻¹⁰–1×10⁻⁵ M gemcitabine (cat. no. G6423; Sigma-Aldrich; Merck KGaA) for 72 h before adding MTT.
Epigenetic drug treatment
A selective p300/CREB-binding protein (CBP) HAT domain inhibitor A485 (cat. no. 6387; Tocris Bioscience) and a pan-HDACi, SAHA (cat. no. SML0061; Sigma-Aldrich; Merck KGaA) inhibiting class I and class II HDACs were used for short-(24 or 96 h) and long-term treatment (4-30 weeks) of PDAC cell lines, both dissolved in DMSO. To determine the half-maximal inhibitory concentration (IC50) for A485 and SAHA, 6,000 cells/well were seeded in 96-well plates. After 24 h, cell lines were treated with A485 (1×10⁻¹⁰–1×10⁻⁵ M) or SAHA (1×10⁻⁸–1×10⁻⁵ M) for 72 h before MTT assay. For short-term treatment, all cell lines were treated with 10 nM or 1 μM A485 or 10 nM or 0.5 μM SAHA. For long-term treatment all cell lines were treated with 1 μM A485 or 0.5 μM SAHA, except MIAPaCa-2, which was treated with 0.05 μM SAHA because of cell toxicity. Controls were treated with DMSO. Cell lines for long-term treatment were treated Monday, Wednesday and Friday each week.
Colony formation assay
A total of 500 PaTu-T and MIAPaCa2 and 2,000 PaTu-S, Capan-1, Capan-2, Colo357 and PANC-1 cells/well were seeded on six-well plates. Capan-2, PaTu-T and MIAPaCa2 cell were cultured for 10 days; PaTu-S, Capan-1, Colo357 and PANC-1 cells were cultured for 14 days as stated above. Cell colonies were washed with PBS and fixed with 100% methanol. Colonies were stained with 1% crystal violet (cat. no. C3886; Sigma-Aldrich; Merck KgaA) in 25% methanol, 10 min each step at room temperature. Pictures were taken with a camera. Colony density was measured with ImageJ (1.53t) software (NIH) and normalized to controls.
Cell migration assay
Tumor cells were seeded on six-well plates and grown to 100% confluence. PANC-1 cells were treated with 3 μg/ml Mitomycin C (cat. no. 4150.1; Carl Roth); PaTu-S, Capan-2, Colo357, PaTu-T and MIAPaCa-2 cells were treated with 15 μg/ml Mitomycin C for 3 h to inhibit proliferation. Capan-1 was not used due to cell death under low concentration treatment with Mitomycin C. A wound was made with a 200-μl sterile pipette-tip. Cells were washed with PBS and incubated at 37°C with 5% CO2. Light microscopy pictures (magnification, ×50) of wound closure were captured at 0, 6, 15 and 24 h. Size of the area was measured by using wound healing size tool plugin (16) for ImageJ (1.53t) software and calculated as cell migration in percent over time.
Immunofluorescence staining
5,000-10,000 tumor cells were seeded on 8-well chamber slides (cat. no. 154534; Thermo Fisher Scientific, Inc.) and staining was performed according to the manufacturer's protocol using 5% donkey serum for blocking (cat. no. D9663¸ Sigma-Aldrich; Merck KgaA) and the following antibodies: Primary epithelial cell adhesion molecule (EpCAM, 1:200; cat. no. 2929; Cell Signaling Technology, Inc.) and vimentin (VIM; 1:200; cat. no. 5741; Cell Signaling Technology, Inc.) and secondary fluorescence-conjugated Cy™3 AffiniPure Donkey Anti-Mouse IgG (H+L; 1:500; cat. no. 715-165-150; Jackson ImmunoResearch) and fluorescein AffiniPure Donkey Anti-Rabbit IgG (H+L; 1:500; cat. no. 711-095-152; Jackson ImmunoResearch). Nuclei were stained using mounting medium with DAPI (cat. no. ab104139; Abcam). Fluorescence images (magnification, ×200) were taken with Axio Imager M2 microscope using ZEN 3.4.91.0 software (Carl Zeiss Microscopy GmbH).
Protein extraction and immunoblot analysis
For protein extraction, tumor cells were lysed in 50 mM Tris-HCl (pH, 7.4) containing 2% SDS. Protein concentration was measured with Pierce™ BCA Protein assay kit (cat. no. 23225; Thermo Fisher Scientific, Inc.). A total of 5-20 μg total protein extract/lane (10% gel) was subjected to western blotting according to manufacturer's instructions with the following antibodies: Primary H3K27ac (cat. no. 8173), H3K9ac (cat. no. 9649), HDAC1 (cat. no. 5356), HDAC2 (cat. no. 5113) and β-actin (cat. no. 4967; all 1:1,000; all Cell Signaling Technology, Inc.) and GAPDH (cat. no. H86504M; 1:5,000; Meridian Bioscience) and secondary Amersham ECL Rabbit (cat. no. NA934) and Mouse IgG, HRP-linked whole Ab (cat. no. NA931; both 1:5,000; both GE Healthcare). Bands were visualized in a Fusion Fx Instrument (Vilber) using Clarity or Clarity Max Western ECL Substrate (cat. nos. 1705060 and 1705062, respectively; Bio-Rad Laboratories, Inc.) and quantified by using ImageJ (1.53t) software.
RNA isolation and reverse transcription-quantitative PCR (qPCR)
From cell lines, total RNA was extracted using the RNeasy® Plus Mini kit (cat. no. 74134; Qiagen GmbH) according to manufacturer's protocol. A total of 2 μg RNA was reverse-transcribed to cDNA with the RevertAid First Strand cDNA Synthesis kit (cat. no. K1621; Thermo Fisher Scientific, Inc.). qPCR was carried out using 20 ng cDNA, 500 nM forward and reverse primer and FastStart Essential DNA Green Master (cat. no. 06924204001; Roche Diagnostics). The reaction (35 cycles consisting of 15 sec denaturation at 95°C, primer annealing for 15 sec at 55°C, and extension for 15 sec at 68°C) was performed on a LightCycler®96 (Roche Diagnostics). Primer pairs (Invitrogen™ Custom DNA Oligos, Thermo Fisher Scientific, Inc.) are listed in Table SI. The gene encoding TATA box binding protein (TBP) was used as housekeeping gene and relative mRNA expression was calculated with ΔΔCq method (17).
RNA sequencing (seq
RNAseq was performed at the Laboratory for Functional Genome Analysis LMU Munich, Germany. PolyA-selected RNAseq libraries were prepared using Version 2: CORALL RNA-Seq V2 Library Prep Kits and Bundles (Lexogen GmbH) and quality controlled on 2100 Bioanalyzer (Agilent Technologies, Inc.). Illumina Nextseq 1000 (NextSeq 1000/2000 P2 reagent kit v3 (100 cycles, cat no. 20046811, Illumina, Inc., loading concentration 1 nM) was used to obtain 50 bp single-end reads, with a depth of 10-20 million reads/sample. RNA-seq reads were trimmed using trim galore (version 0.6.5, https://www.bioinformatics.babraham.ac.uk/projects/trim_galore/). Ribosomal (r)RNA reads and non-eukaryotic RNA contamination were removed using sort- MeRNA (version 4.3.6) (18). Reads were aligned to the human reference genome (GRCh38, Ensembl annotation release 100) and counted using STAR aligner (version 2.7.3a) (19). Count matrix was normalized using DEseq2 package (20) and rlog transformation was performed for principal component analysis. Differentially expressed genes (DEGs) were analyzed using DEseq2 package. To identify subtype marker genes, a cutoff of P<0.05 was set for the comparison of classical and basal-like cell lines. Candidate genes for treatment comparisons were selected based on a cutoff of adjusted P<0.1. Enriched candidate genes were further subjected to Gene Ontology (GO) and Kyoto Encyclopedia of Genes and Genomes (KEGG) pathway enrichment analyses using clusterProfiler package (21,22). EMT and gemcitabine score were defined based on published genes signatures (23,24).
Chromatin immunoprecipitation (ChIP)
Cell lines were cross-linked with 1% PBS-buffered formaldehyde for 10 min at room temperature. The reaction was quenched with 125 mM glycine for 5 min and cells were lysed in cell lysis buffer (5 mM PIPES, 85 mM KCl, 0.5% NP-40). Isolated nuclei (centrifuged at 500 × g, 5 min, 4°C) were resuspended in MNase reaction buffer (50 mM Tris-HCl, 5 mM CaCl2) and DNA was fragmented with 20 U MNase (cat. no. 88216, Thermo Fisher Scientific, Inc.) for 5 min for Capan-1, Capan-2, PaTu-T and MIAPaCa-2, 6 min for PaTu-S and Colo357 and 3 min for PANC-1. The reaction was inactivated by 20 mM EGTA. Nuclei were pelleted (centrifuged at 500 × g, 10 min, 4°C), lysed in nuclei lysis buffer (1% SDS, 10 mM EDTA, 50 mM Tris-HCl) on ice for 1 h and sonicated for 10 sec for two cycles at 10% amplitude. Samples were centrifuged (12,000 × g, 10 min, 4°C) and supernatant was brought to a total volume of 2 ml using ChIP Dilution buffer (0.01% SDS, 1% Triton X-100, 1.2 mM EDTA, 16.7 mM Tris-HCl, 167 mM NaCl) and pre-cleared with 100 μl Protein A Agarose/Salmon Sperm DNA beads (cat. no. 16-157; Merck Millipore) for 1 h at 4°C. After removing the pre-clearing agarose beads (centrifuged at 4,000 × g, 1 min, 4°C), 1% Input was collected from each sample. Subsequently, samples were equally divided for ChIP antibody reaction with H3K27ac (0.25 μg; cat. no. 8173; Cell Signaling Technology, Inc.) and IgG control (2.5 μg; cat. no. 3900; Cell Signaling Technology, Inc.) and incubated at 4°C overnight. Protein/DNA complexes were precipitated with agarose beads for 1 h at 4°C. After washing the agarose beads with low (0.1% SDS, 1% Triton X-100, 2 mM EDTA, 20 mM Tris-HCl, 150 mM NaCl) and high salt (0.1% SDS, 1% Triton X-100, 2 mM EDTA, 20 mM Tris-HCl, 500 mM NaCl), LiCl (250 mM LiCl, 1% NP-40, 1% sodiumdeoxycholat, 1 mM EDTA, 10 mM Tris-HCl) and twice with TE (10 mM Tris-HCl, 1 mM EDTA) washing buffer (centrifuged at 4,000 × g, 1 min, 4°C), Chromatin was eluted two times in elution buffer (1% SDS, 100 mM NaHCO3) for 15 min at room temperature. Chromatin was reverse cross-linked in 75 μM NaCl overnight at 65°C and RNA and proteins were digested in 0.05 μg/μl RNase (cat. no. 19101; Qiagen GmbH) for 30 min at 37°C and 0.05 μg/μl proteinase K (cat. no. EO0492; Thermo Fisher Scientific, Inc.) including 10 μM EDTA and 30 μM Tris-HCl for 2 h at 45°C, respectively. DNA was purified with the QIAquick PCR Purification kit (cat. no. 28104; Qiagen GmbH) and quantified by qPCR, as aforementioned. ChIP-specific primers are listed in Table SI. Sample values were calculated according to the % input method [ΔCt=Ct[ChIP]−(Ct[Input]-Input dilution factor), 2^(−ΔCt [normalized ChIP]) ×100).
Statistical analysis
GraphPad Prism version 9.0 (Dotmatics) was used for statistical analysis using two-tailed, unpaired Student's t test, one-way ANOVA followed by Fisher's LSD post hoc test or non-parametric Mann-Whitney or Kruskal-Wallis test followed by Dunn's post hoc test. P<0.05 was considered to indicate a statistically significant difference. RNAseq data preprocessing and analyses were performed using R 4.0.3 software and visualized in RStudio 1.3.959 (RStudio). Changes in EMT and gemcitabine scores were tested using Wilcoxon test.
Results
Classification of classical and basal-like PDAC cell lines based on subtype marker gene expression
To determine the epigenetic reprogramming ability of pancreatic cancer cells of different molecular subtypes, human PDAC cell lines PaTu-S, Capan-1, Capan-2, Colo357, PaTu-T, PANC-1 and MIAPaCa-2 were used. Cell morphology and expression of specific subtype marker proteins were determined by immunofluorescence staining. PaTu-S, Capan-1, Capan-2 and Colo357 cells showed an epithelial phenotype and expressed epithelial marker EPCAM, which indicated a classical subtype. PaTu-T, PANC-1 and MIAPaCa-2 cells exhibited mesenchymal, spindle-shape morphology and a positive staining for the mesenchymal marker VIM, which is associated with a basal-like subtype (Fig. 1A) (25). Whole-transcriptome analysis was performed by RNAseq and the cell lines clustered into two main groups in the principal component analysis (Fig. 1B). Differential gene expression analysis demonstrated expression of classical subtype genes, such as EPCAM, ELF3 and KLF5 (KLF transcription factor 5), in PaTu-S, Capan-1, Capan-2 and Colo357 cells, whereas PaTu-T, PANC-1 and MIAPaCa-2 cells showed high expression of VIM, ZEB1 and JUN, which are markers of a basal-like gene expression network (Figs. 1C and S1A) (25). Classical cell lines were associated with lower proliferation rates compared with the basal-like cell lines, except for Colo357 (Fig. 1D).
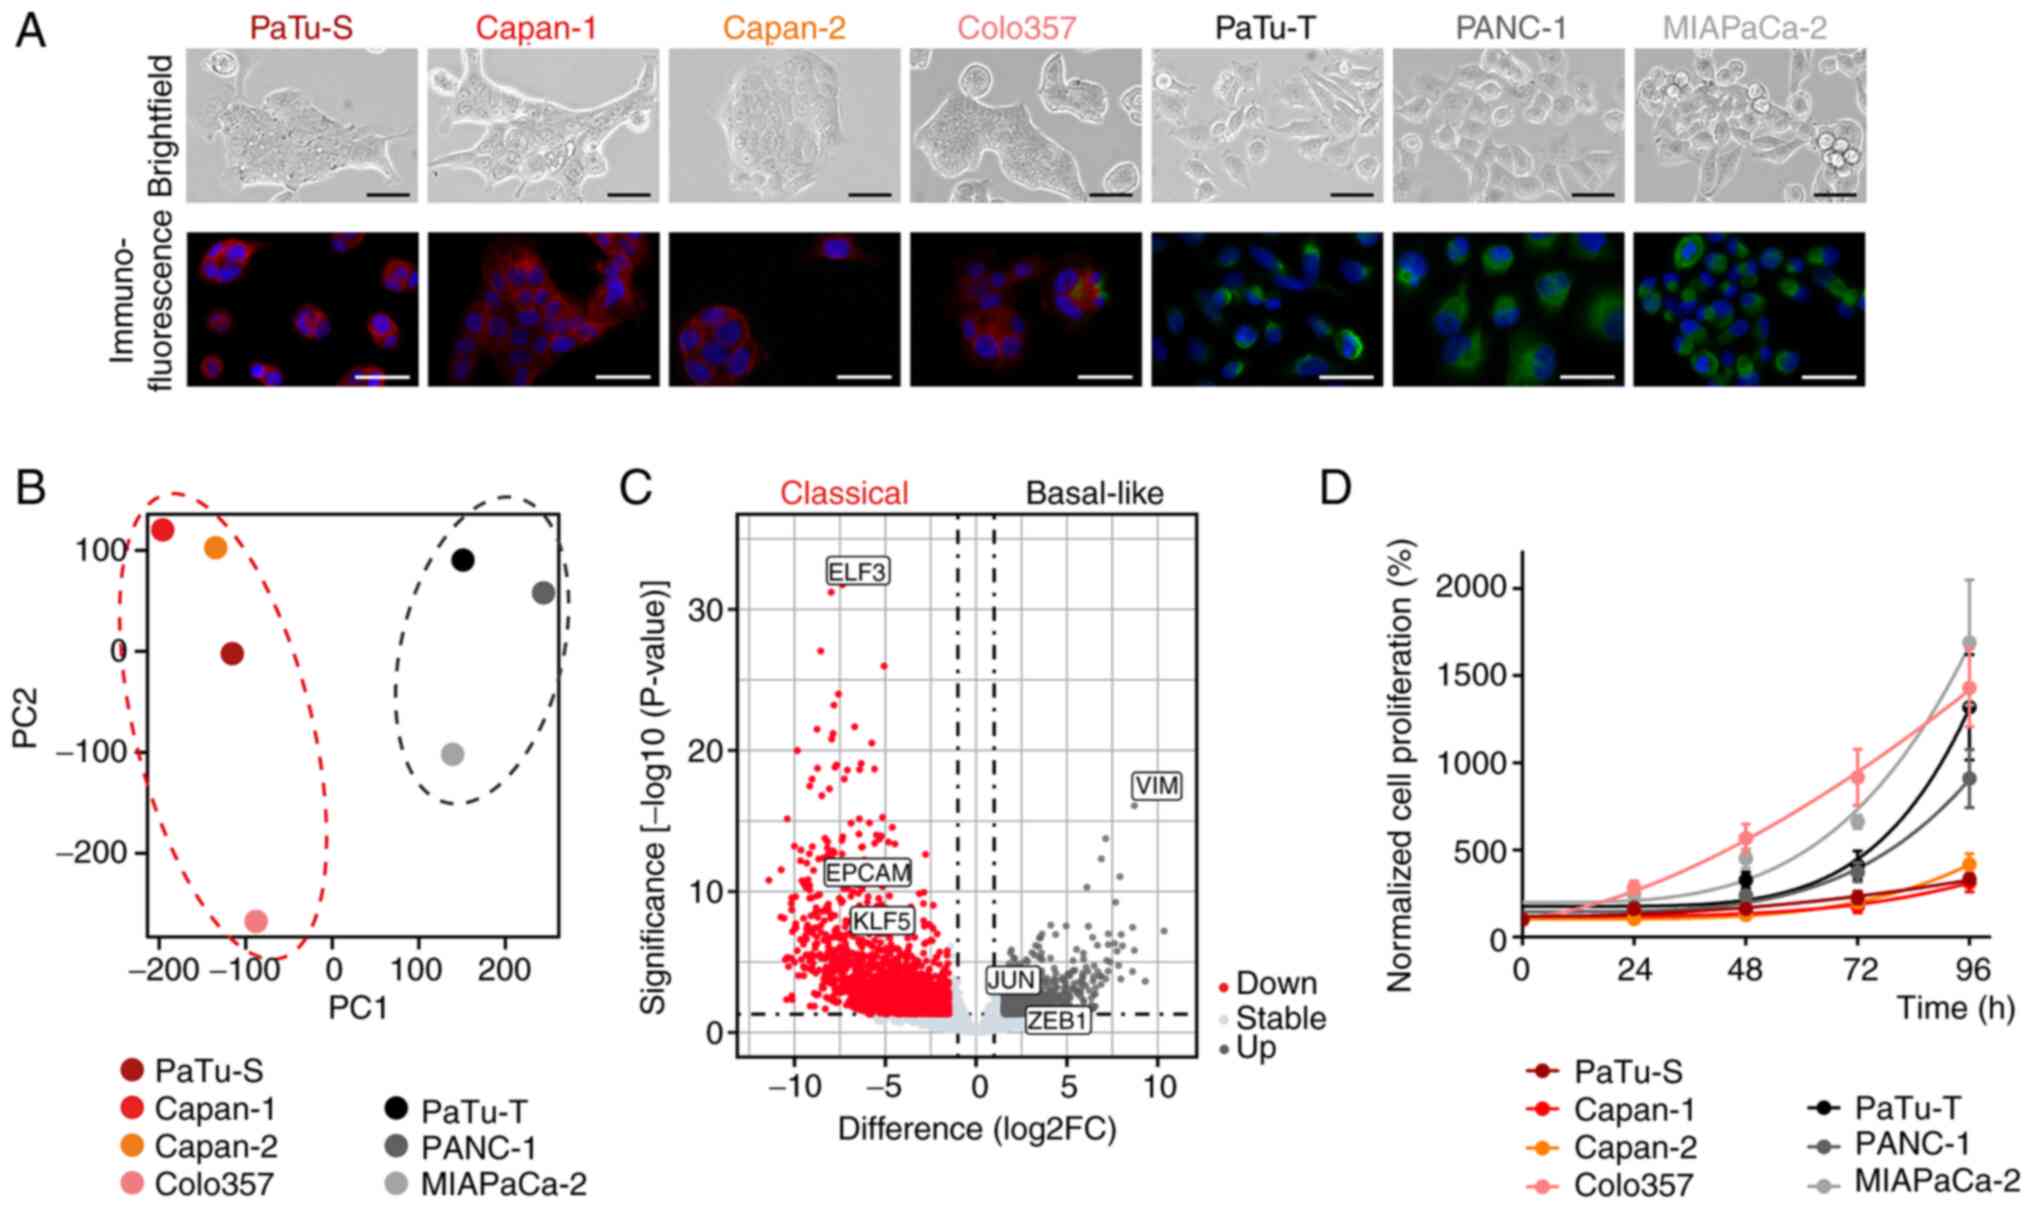 |
Figure 1.
H3K27ac regulates the expression of subtype marker genes in classical and basal-like cell lines. (A) Light microscope images of PaTu-S, Capan-1, Capan-2, Colo357, PaTu-T, PANC-1 and MIAPaCa-2 cells (brightfield; magnification, ×100; scale bar, 50 μm) and immunofluorescence staining of EPCAM (red), VIM (green) and nuclei (DAPI, blue); magnification, ×200; scale bar, 100 μm. (B) Principal component analysis of RNA sequencing data demonstrated two cell clusters. (C) Volcano plot of differentially expressed genes in classical and basal-like cell lines. Marker genes for classical (ELF3, EPCAM, KLF5) and basal-like (VIM, JUN, ZEB1) subtype are highlighted. (D) Normalized proliferation of cell lines measured by MTT assay (n=3). All data are presented as mean ± SEM. EPCAM, epithelial cell adhesion molecule; VIM, vimentin; ELF3, E74 like ETS transcription factor 3; KLF5, KLF transcription factor 5; ZEB1, zinc finger E-box binding homeobox 1.
|
Classical and basal-like cell lines exhibit distinct histone acetylation levels
Next, it was determined whether the expression of selected subtype marker genes for classical and basal-like PDAC cell lines was regulated by the activating histone modification H3K27ac. ChIP-qPCR demonstrated high levels of H3K27ac at the promoter of classical marker genes EPCAM and ELF3 and low levels at the basal-like marker gene VIM in classical cell lines. In basal-like cell lines low levels of H3K27ac were detected at the promoter of classical marker genes EPCAM and ELF3 and high levels at the basal-like marker gene VIM (Figs. 2A and S1B). Notably, H3K27ac levels were associated with the gene expression of EPCAM, ELF3 and VIM (Fig. 2A). To assess whether the classical and basal-like PDAC cell lines exhibited differences in the overall H3K27ac levels and associated histone modifying enzymes, immunoblot and qPCR analyses were performed. Basal-like cell lines showed a significantly increased protein expression of HDAC2 and low abundance of H3K27ac in comparison with the classical cell lines (Fig. 2B). On the other hand, HDAC1 was slightly reduced in basal-like cells. The overall abundance of histone marker H3K9ac did not differ between classical and basal-like PDAC cell lines (Fig. 2B). In line with lower H3K27ac levels in basal-like cell lines, the basal-like cells expressed significantly lower levels of the HAT genes EP300 (E1A binding protein p300) and CREBBP (CREB binding protein) compared with the classical cell lines and showed reduced gene expression of BRD4 (bromodomain containing 4) and SMARCA4 (SWI/SNF related, matrix associated, actin dependent regulator of chromatin, subfamily a, member 4), two epigenetic readers that bind to acetylated histone residues to activate transcription (26) (Fig. 2C). The aforementioned data demonstrated a H3K27ac-driven epigenetic regulation of specific PDAC subtype marker genes. Moreover, the classical cell lines revealed high abundance of H3K27ac and strong expression of HAT genes, whereas basal-like cell lines showed low H3K27ac levels and high HDAC2 expression.
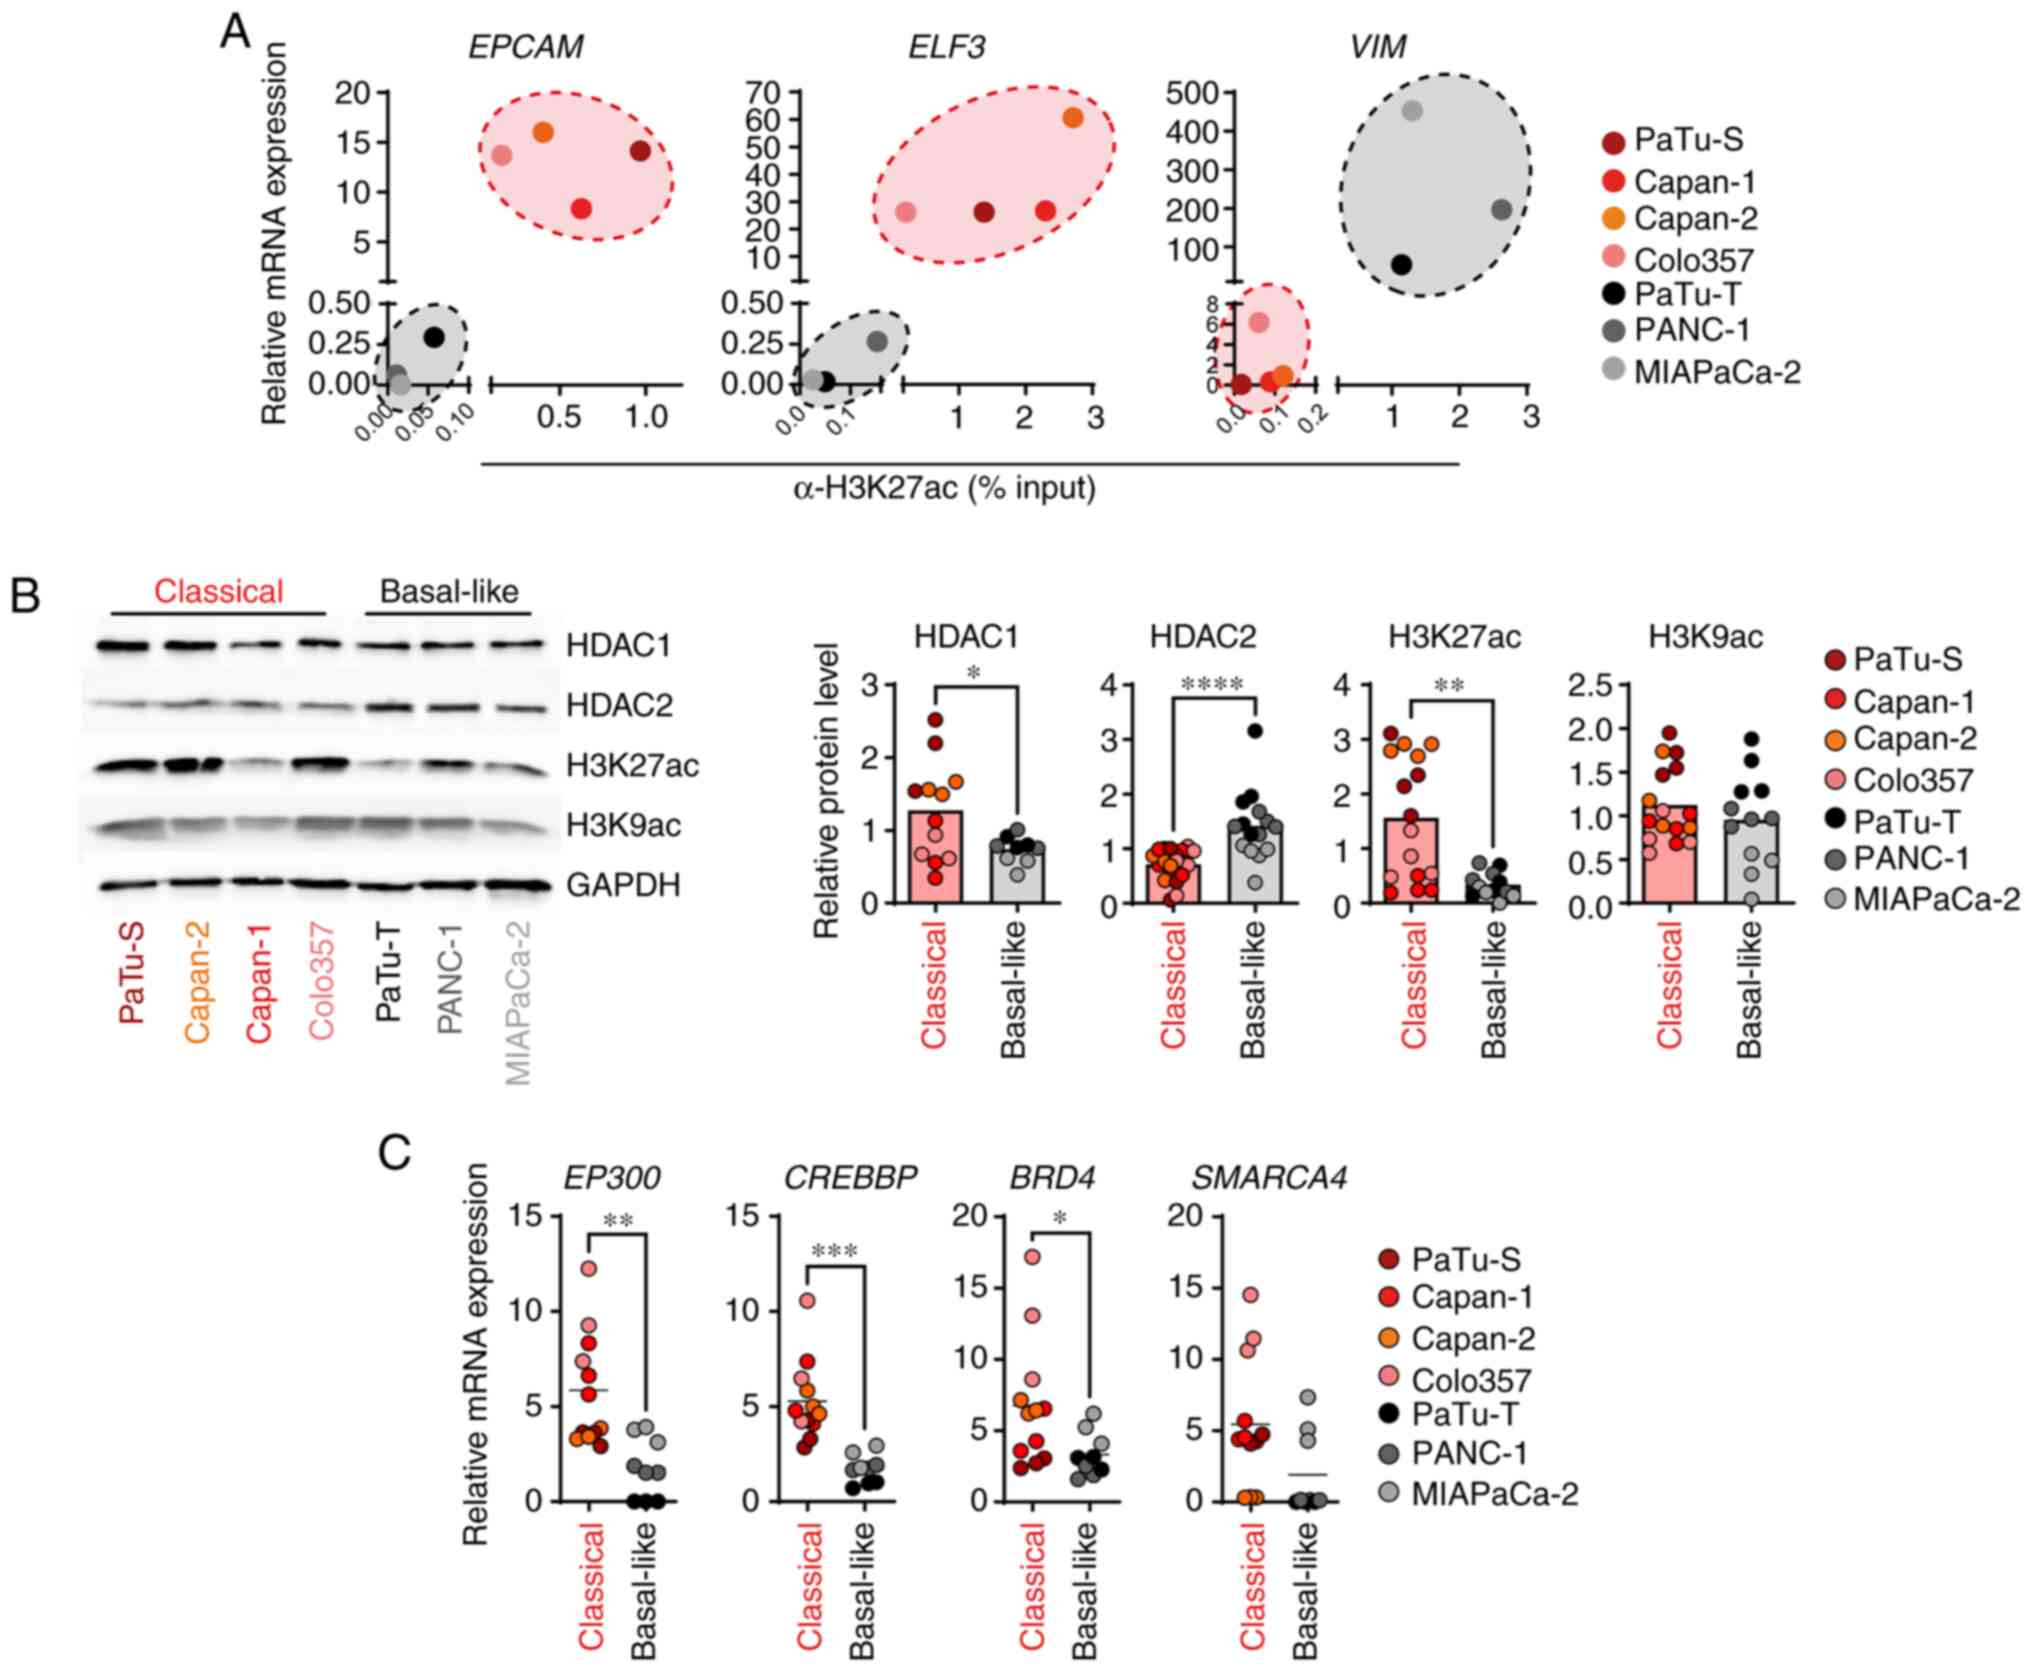 |
Figure 2.
Classical and basal-like cell lines exhibit distinct histone acetylation levels. (A) Relative mRNA expression of EPCAM, ELF3 and VIM, as well as H3K27ac levels at promoter regions, were measured by qPCR and ChIP, respectively. mRNA expression was calculated in relation to the housekeeper gene TBP (n=3). ChIP data were quantified by qPCR and normalized as % of input (n=2-4). (B) Representative immunoblot analysis of indicated proteins and histone modifications. Band intensities were quantified and normalized to GAPDH (n=3-5). (C) mRNA expression was determined by qPCR and calculated in relation to the housekeeper gene TBP (n=3). P-values were calculated by two-tailed, unpaired Student's t test; *P<0.05, **P<0.01, ***P<0.001, ****P<0.0001. EPCAM, epithelial cell adhesion molecule; ELF3, E74-like ETS transcription factor 3; VIM, vimentin; q, quantitative; ChIP, chromatin immunoprecipitation; EP300, E1A binding protein p300); CREBBP, CREB binding protein; BRD4, bromodomain containing 4; SMARCA4, SWI/SNF related, matrix associated, actin dependent regulator of chromatin, subfamily a, member 4; TBP, TATA box binding protein.
|
Classical and basal-like cell lines respond differently to epigenetic drug treatment
Following identification of distinct histone acetylation levels and differences in the expression of associated histone acetylation key factors, HATi A485 and HDACi SAHA were used to treat classical and basal-like cell lines to determine epigenetic reprogramming abilities. For cell lines Capan-1, Capan-2, PaTu-T and PANC-1, it was not possible to determine IC50 for A485 and SAHA because the cell lines did not respond to A485 or SAHA treatment (Fig. S2). Therefore, the cell lines were treated with two dosages of A485 (10 nM and 1 μM) and SAHA (10 nM and 0.5 μM) for 24 h and overall H3K27ac levels were determined by immunoblot analysis (Fig. 3A and B). The classical and basal-like cell lines responded well to the treatment with 1 μM A485 and showed significantly decreased H3K27ac levels (Fig. 3A). Only the basal-like cell lines exhibited significantly increased H3K27ac levels after treatment with 0.5 μM SAHA. The high abundance of H3K27ac in the classical cell lines was not further increased by treatment with SAHA (Fig. 3B), indicating that SAHA treatment did not affect PDAC cells of the classical subtype. To assess the effect of HATi and HDACi treatment on epigenetic reprogramming of classical and basal-like cell lines, cell lines were treated with 1 μM A485 and 0.5 μM SAHA for 24 h and analyzed by RNAseq to detect changes in gene expression. The classical and basal-like cell lines treated with A485 showed 619 and 120 downregulated genes, respectively (Fig. 3C; Tables SII and SIII). Although the basal-like cell lines exhibited increased H3K27ac levels after SAHA treatment, the number of DEGs was low. SAHA treatment of classical and basal-like cell lines resulted in an upregulation of 49 and 25 genes, respectively (Fig. 3C; Tables SIV and SV). To identify biological effects of HATi and HDACi treatment for each tumor subtype, GO and KEGG pathway analyses were conducted based on DEGs. The comparison of the top 100 GO terms between classical and basal-like cell lines for genes downregulated after A485 treatment revealed 54 subtype-specific GO terms. The downregulated genes of classical cell lines were involved in 'lipid metabolic process' and 'drug metabolisms cytochrome P450', while basal-like cell lines showed decreased expression of genes associated with 'mesenchymal cell differentiation' and 'extracellular matrix organization' (Fig. 3D; Table SVI). The comparison of the top 100 GO terms for genes upregulated after SAHA treatment, showed 87 subtype-specific GO terms. However, only the classical cell lines revealed significantly enriched GO terms, which were related to 'cytoskeleton organization', 'leukocyte mediated immunity' and 'secretion by cell' (Fig. 3D; Table SVII). Based on enriched GO terms and KEGG pathways associated with 'mesenchymal cell differentiation' and drug metabolisms, it was analyzed in more detail whether HATi and HDACi treatment had a subtype-specific impact on EMT and chemosensitivity of classical and basal-like cell lines. An EMT signature published by Gröger et al (23) was assessed to determine changes after HATi and HDACi treatment. Notably, basal-like cell lines generally had a higher EMT score than the classical cell lines, but the EMT score of basal-like cell lines did not change after epigenetic drug treatment. However, when treated with 1 μM HATi A485, classical cell lines showed an increased EMT score, indicating an enrichment of an EMT phenotype (Fig. 3E). In addition, a transcriptomic signature to predict gemcitabine sensitivity generated by Nicolle et al (24) was analyzed. Classical cell lines had an overall higher gemcitabine score, indicating higher gemcitabine sensitivity, than basal-like cells. Upon A485 HATi treatment, classical cell lines showed a decreased gemcitabine score, whereas no effect was detected for basal-like cell lines following HATi or HDACi treatment (Fig. 3E). The data suggested that HATi treatment of classical PDAC cells had a negative effect resulting in an increased EMT phenotype and decreased drug response towards gemcitabine.
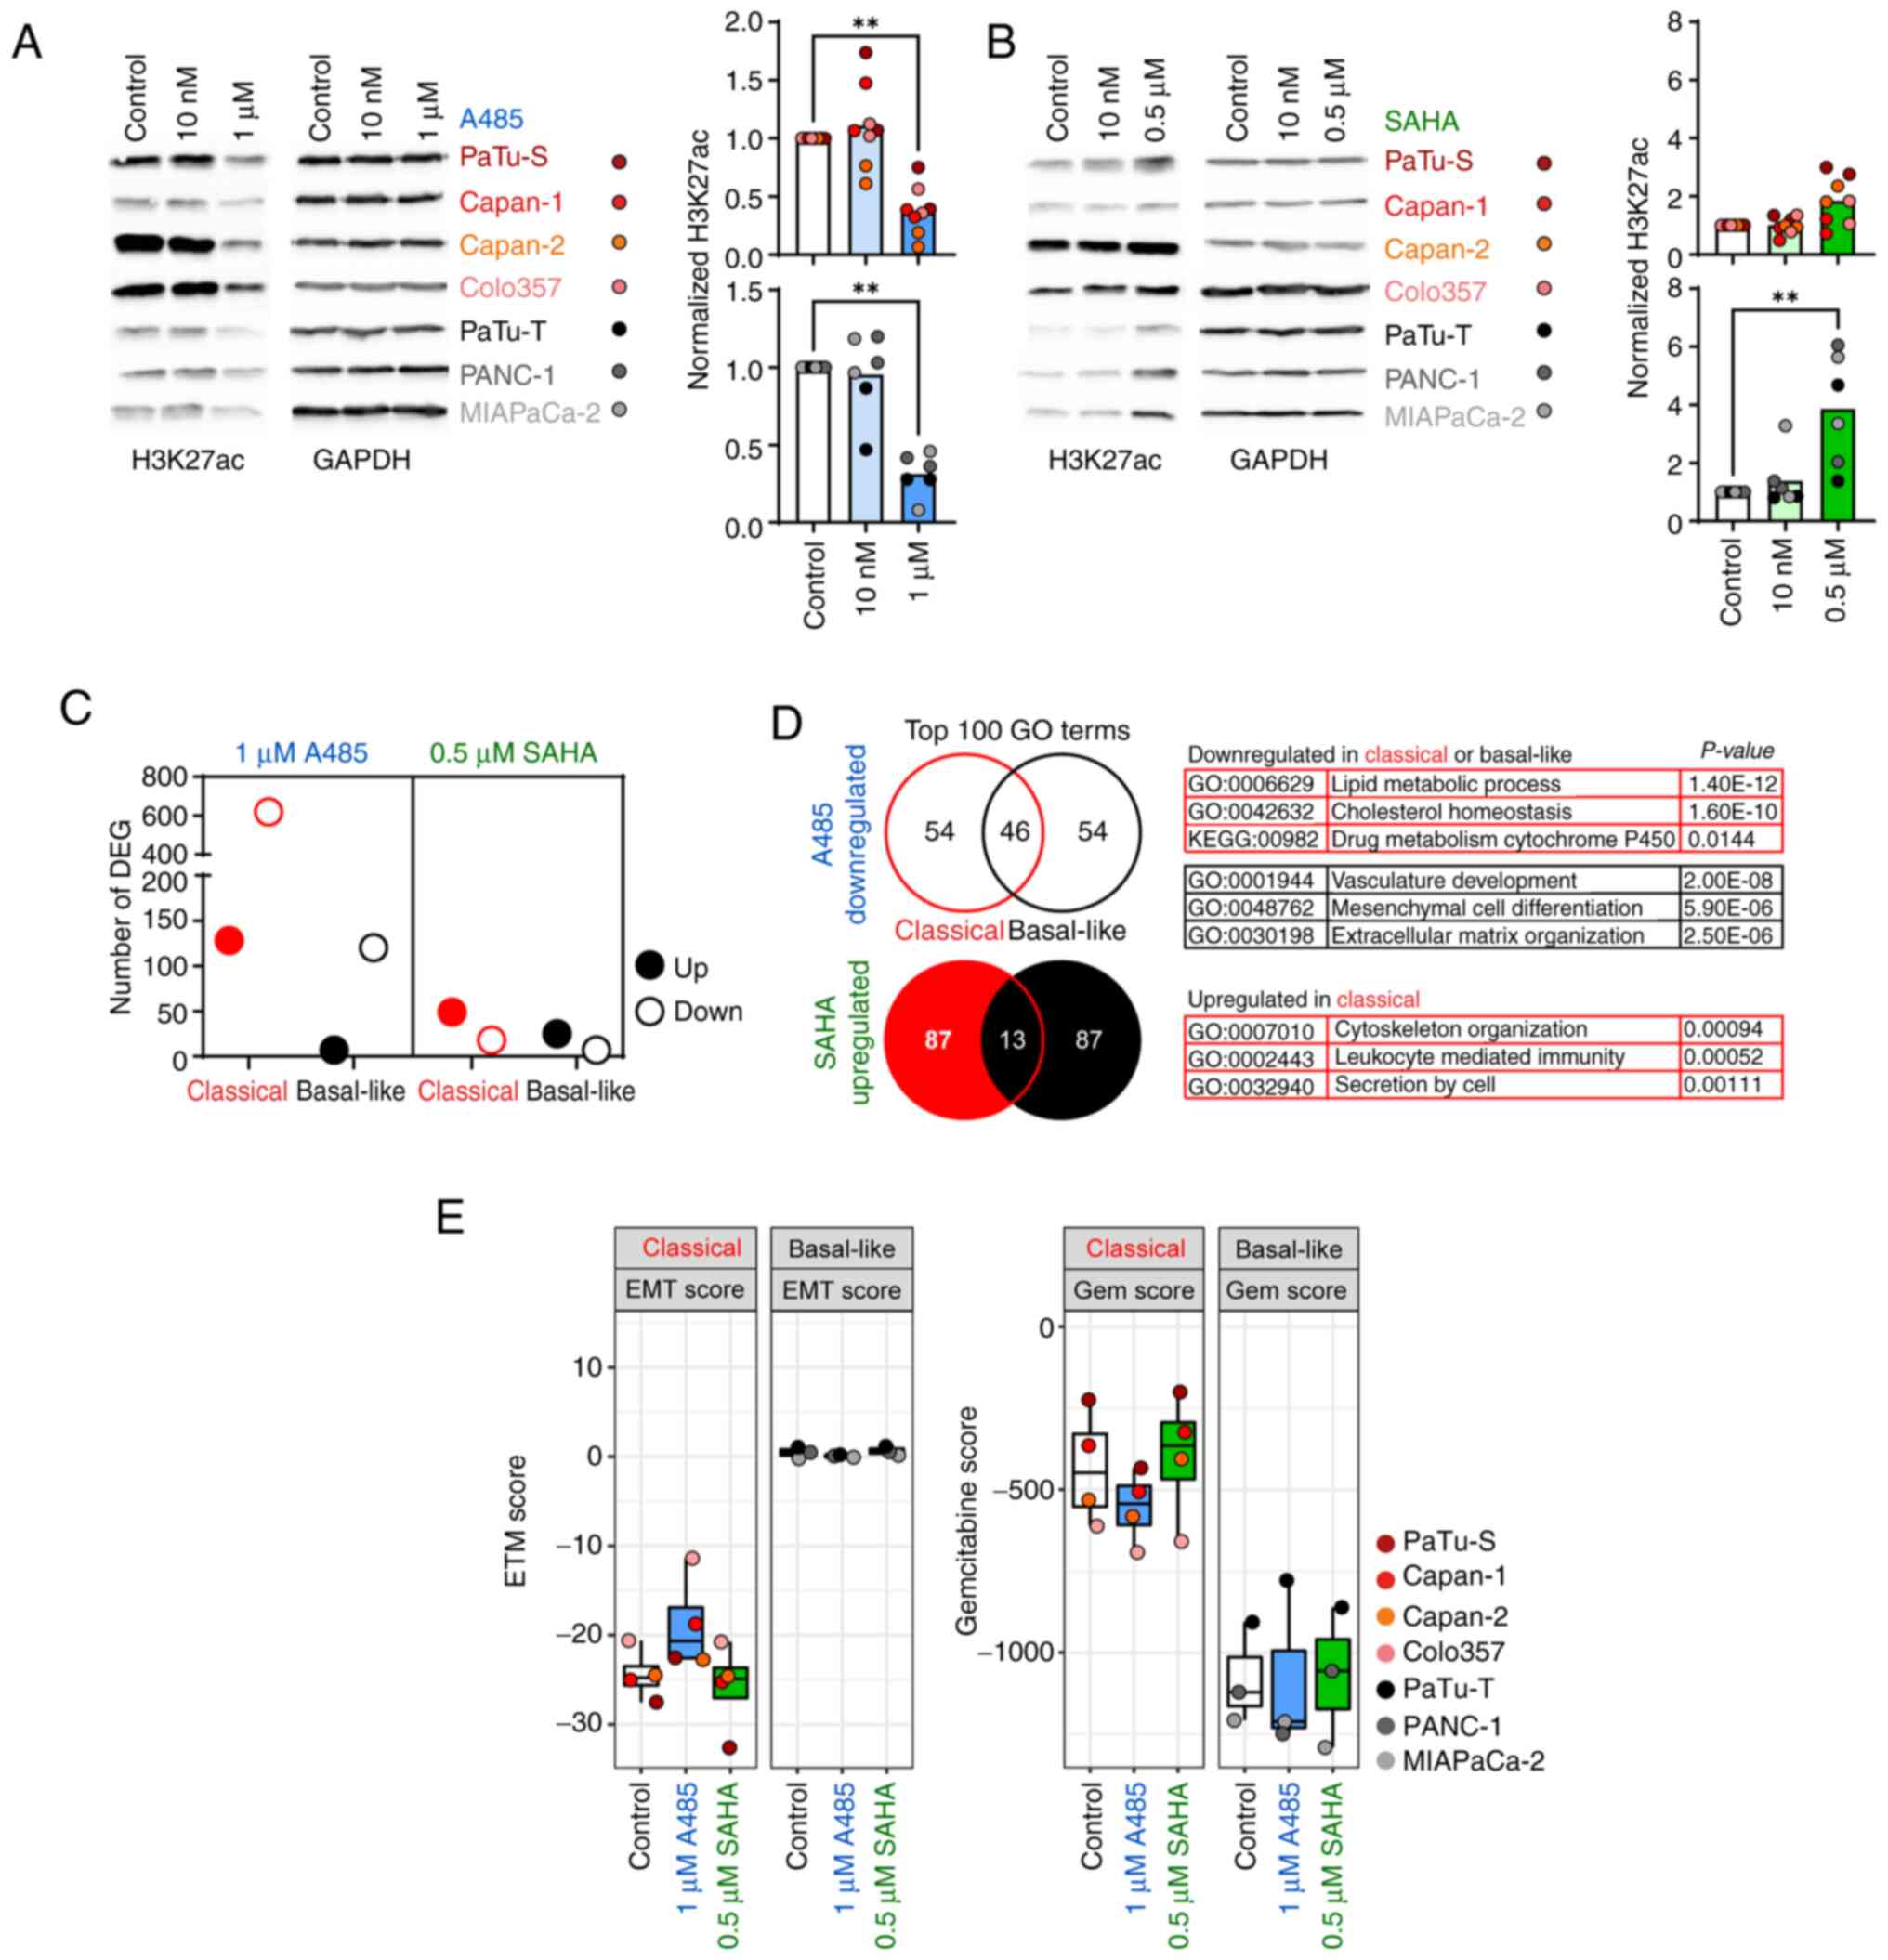 |
Figure 3.
Classical and basal-like cell lines respond differently to epigenetic drug treatment. Representative immunoblot analysis of H3K27ac levels in (A) A485- and (B) SAHA-treated cell lines. Band intensities were quantified and normalized to GAPDH (n=2). (C) Number of DEGs, assessed by RNAseq. (D) Venn diagram of top 100 GO terms generated from A485-down- and SAHA-upregulated genes with selected subtype-specific significantly enriched GO terms. No pathway was significantly enriched in basal-like cell lines after SAHA treatment. (E) Published genes signatures defining EMT (23) and Gem (24) score of A485- and SAHA-treated cell lines using RNAseq data. All data are presented as mean ± SD; P-values were calculated by non-parametric Kruskal-Wallis followed by Dunn or by Wilcoxon test. **P<0.01. SAHA, suberoylanilide hydroxamic acid; DEG, differentially expressed gene; seq, sequencing; GO, gene ontology; EMT, epithelial-to-mesenchymal transition; Gem, Gemcitabine.
|
Short-term epigenetic drug treatment has no influence on gemcitabine sensitivity
To determine the effects of HATi and HDACi treatment on gemcitabine chemosensitivity, drug response to gemcitabine alone was measured first in classical and basal-like cell lines (Fig. 4A). The drug response assay revealed that classical cell lines responded better to gemcitabine treatment with lower relative IC50 values than basal-like cell lines (Fig. 4B), which was consistent with the transcriptomic gemcitabine score (24). Solute carrier family 29 member 1 (SLC29A1, also known as hENT1) is an important transporter for gemcitabine uptake and its expression is associated with gemcitabine sensitivity in patients with pancreatic cancer (27-29). Thus, it was investigated whether SLC29A1 expression was regulated by histone acetylation and altered by epigenetic drug treatment. Although the comparison of SLC29A1 expression and presence of H3K27ac at the gene promoter revealed two clusters of cell lines, in which the abundance of H3K27ac was associated with gene expression, these were independent of the tumor subtypes (Figs. 4C and S3A and B). Treatment with 1 μM HATi A485 resulted in a significant reduction of H3K27ac at the SLC29A1 promoter in all classical cell lines, whereas the SLC29A1 promoter showed an enrichment of H3K27ac in basal-like cell lines after 0.5 μM SAHA treatment (Fig. 4D). In line with this, SLC29A1 expression was decreased in all cell lines after A485 treatment, whereas SAHA treatment did not result in increased SLC29A1 expression (Fig. S3C). Next, the impact of HATi and HDACi treatment on gemcitabine sensitivity was assessed by pre-treating cell lines with 1 μM and 0.5 μM SAHA for 96 h, followed by 72 h gemcitabine treatment. There were no significant changes in gemcitabine response after HATi or HDACi pre-treatment (Figs. 4E and S3D). In summary, the epigenetic reprogramming efficiency after short-term HATi or HDACi treatment was low and did not change chemosensitivity of pancreas tumor cells.
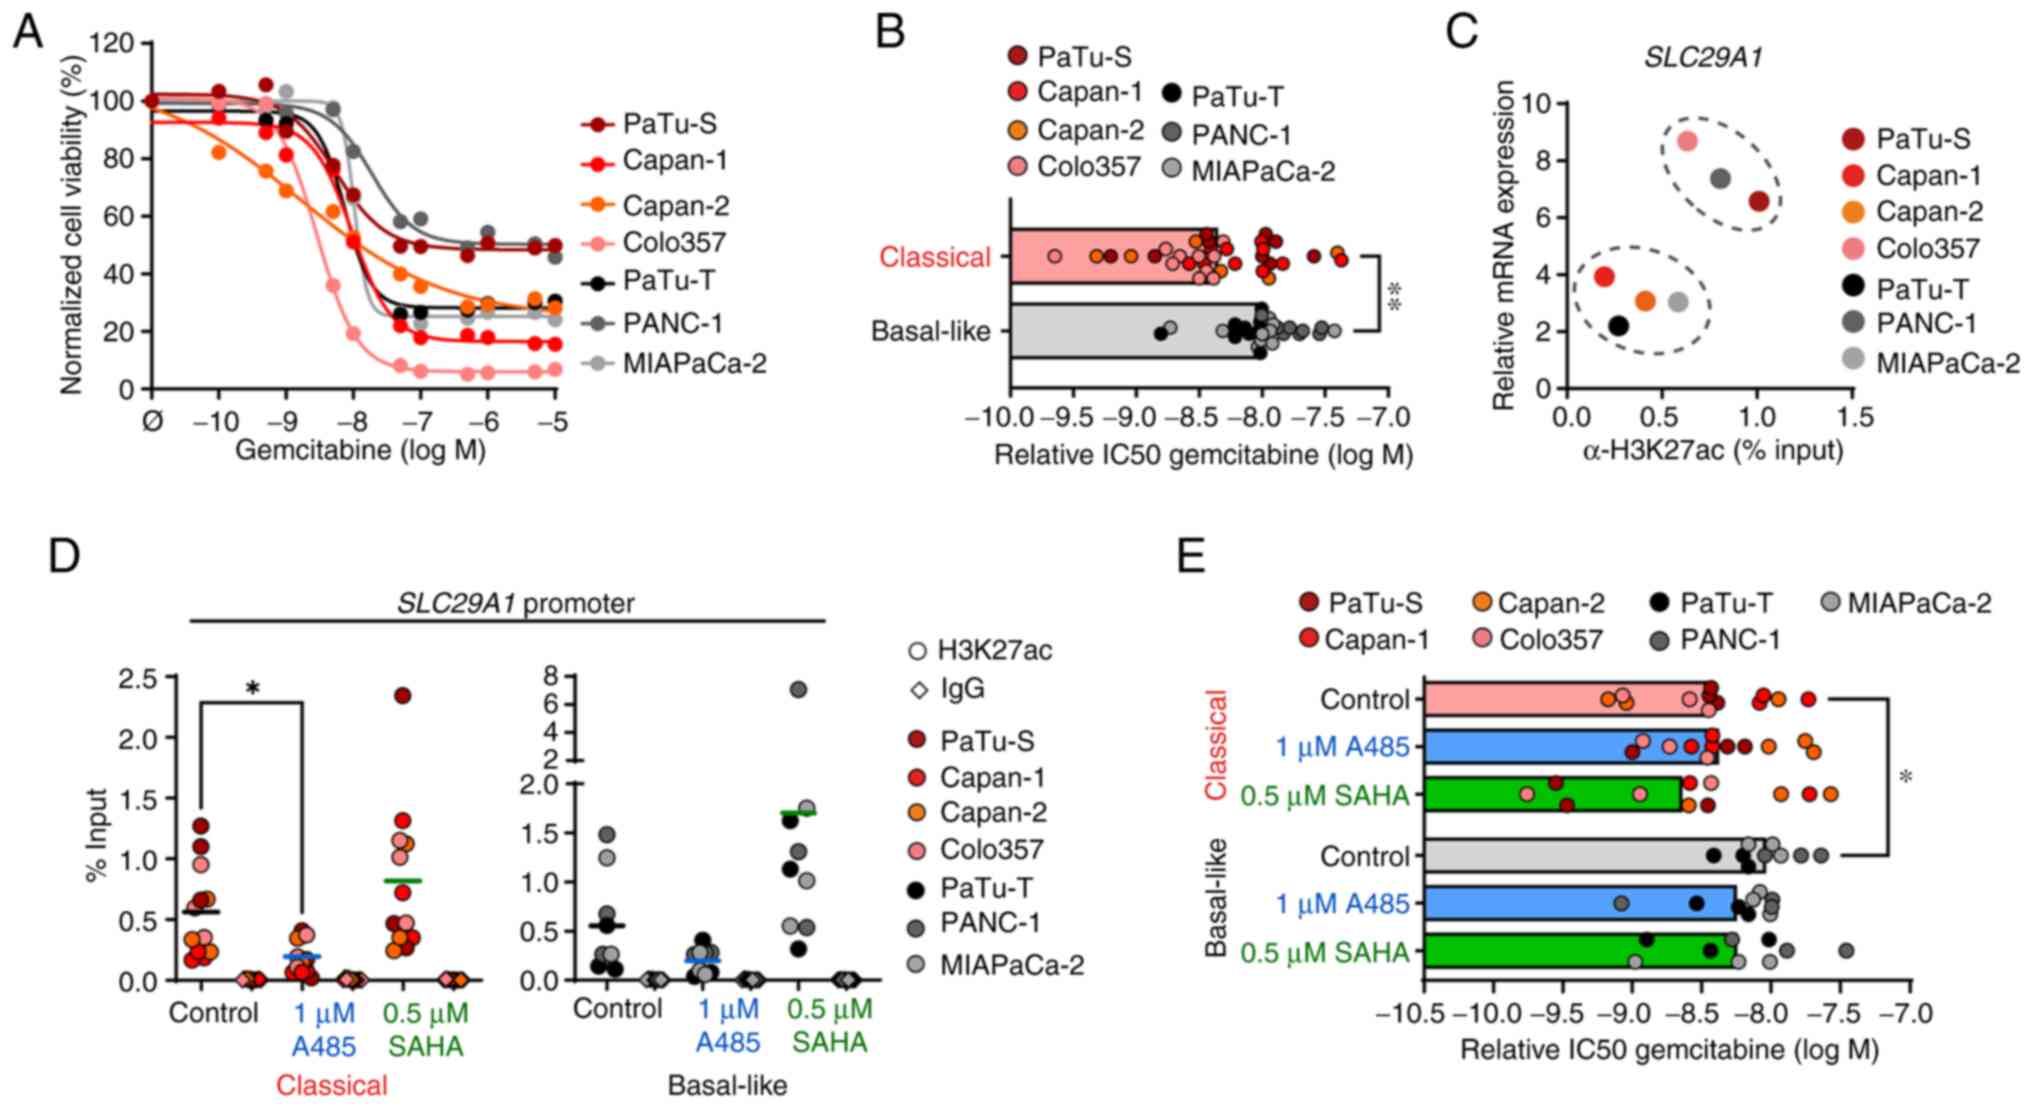 |
Figure 4.
Short-term epigenetic drug treatment has no influence on gemcitabine sensitivity. (A) Cell viability was measured by MTT assay and normalized to untreated control cells following 72 h gemcitabine treatment. (B) Relative IC50 values of gemcitabine treatment were calculated (n=6-10). (C) Relative mRNA expression of SLC29A1 and H3K27ac levels at the promoter were measured by qPCR and ChIP, respectively. mRNA expression was calculated in relation to the housekeeper gene TBP (n=3). ChIP DNA was quantified by qPCR and normalized as % of input (n=3). (D) ChIP analysis of H3K27ac and IgG (antibody control) for the SLC29A1 promoter following 1 μM A485 and 0.5 μM SAHA treatment for 24 h. ChIP-qPCR data are normalized as % of input (n=3). (E) Cell viability following 1 μM A485 and 0.5 μM SAHA treatment for 96 h followed by 72 h gemcitabine treatment was measured by MTT assay. Relative IC50 values of gemcitabine were calculated. All data are presented as mean. P-values were calculated by non-parametric Mann-Whitney or Kruskal-Wallis followed by Dunn's test. *P<0.05, **P<0.01. SLC29A1, solute carrier family 29 member 1; q, quantitative; ChIP, chromatin immunoprecipitation; TBP, TATA box binding protein; IC50, half-maximal inhibitory concentration; SAHA, Suberoylanilide hydroxamic acid.
|
Long-term epigenetic drug treatment has different effects in classical and basal-like PDAC cell lines
To analyze if longer epigenetic treatment had a more pronounced effect on the transcriptional reprogramming of tumor cells, cell lines were treated for 4-30 weeks with 1 μM and 0.5 μM SAHA. With the exception of MIAPaCa-2, for which SAHA dose was decreased to 0.05 μM, the long-term epigenetic treatment was well-tolerated by all cell lines showing no visible signs of cell death. Long-term HATi treatment with 1 μM A485 significantly decreased H3K27ac levels in classical and basal-like cell lines, whereas long-term SAHA treatment with 0.5 μM (or 0.05 μM for MIAPaCa-2) caused no subtype-dependent H3K27ac enrichment (Fig. 5A). Next, it was investigated whether long-term HATi or HDACi treatment affected the epithelial and mesenchymal phenotype of classical and basal-like cell lines, respectively, by determining H3K27ac levels at promoter regions of the classical marker gene ELF3 and basal-like marker gene VIM. Classical cell lines showed a significant loss of H3K27ac at the ELF3 promoter and a significant enrichment of H3K27ac at the VIM promoter after long-term A485 treatment, whereas basal-like cell lines exhibited no such changes (Fig. 5B). In line with the epigenetic changes, the classical cell lines showed significantly decreased ELF3 expression and increased VIM expression after long-term treatment with A485, indicating a switch from an epithelial to a mesenchymal phenotype (Fig. 5C). Notably, these data were consistent with short-term A485 treatment of the classical cell lines, which showed an increased EMT score (Fig. 3E). To evaluate the effects of HATi and HDACi treatment on the phenotypical behavior of the tumor cells, classical and basal-like cell lines were analyzed for changes in cell proliferation, colony formation and migration upon epigenetic drug treatment. Only the classical cell lines exhibited decreased cell proliferation after long-term SAHA treatment, while long-term A485 treatment did not affect proliferation of classical and basal-like cell lines (Figs. 5D and S4A). Although long-term A485 treatment resulted in significantly lower colony forming ability in classical and basal-like cell lines (Fig. 5E), the migration of classical cell lines was significantly increased under long-term A485 treatment (Figs. 5F and S4B). In summary, prolonged treatment with HATi induced changes in overall H3K27ac abundance in classical and basal-like cells. Classical cell lines revealed decreased epithelial and increased EMT marker gene expression after HATi treatment, as well as increased cell migration.
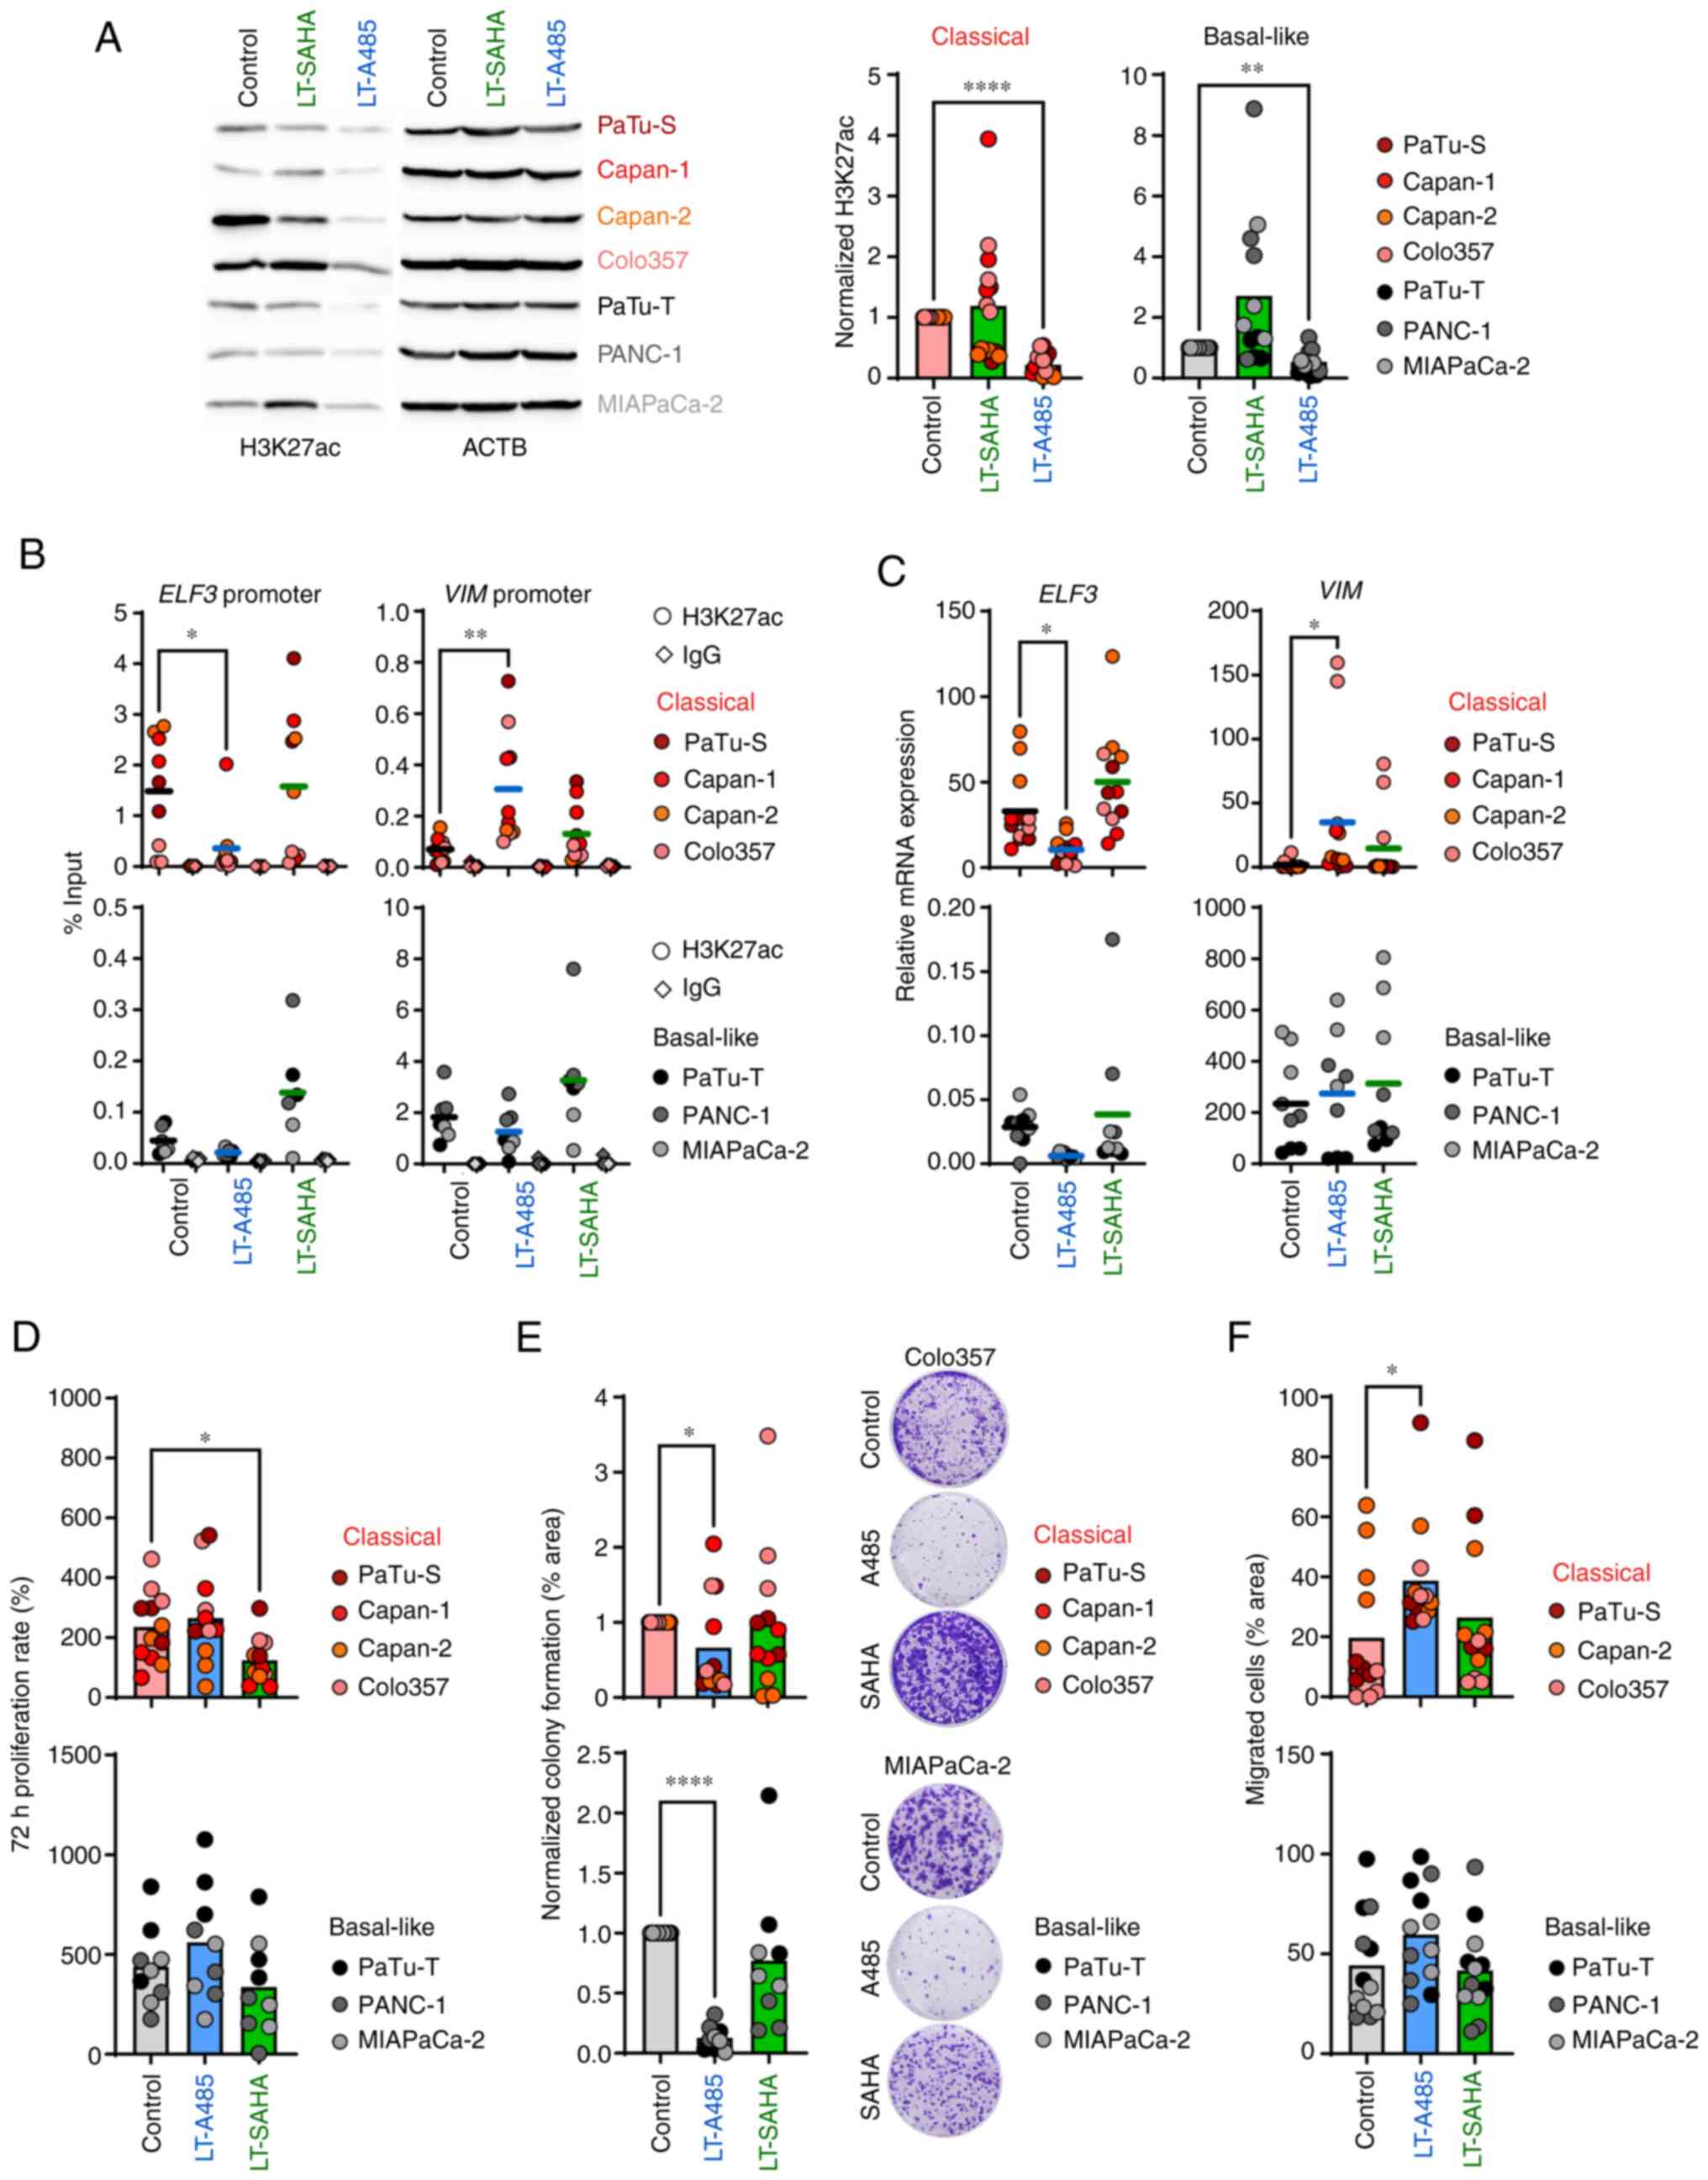 |
Figure 5.
Long-term epigenetic drug treatment has different effects in classical and basal-like cell lines. Cell lines were treated with 1 μM A485 or 0.5 or 0.05 μM (MIAPaCa-2) SAHA between 4-30 weeks before use. (A) Representative immunoblot analysis of H3K27ac. Band intensities were quantified and normalized to ACTB levels (n=3-4). (B) ChIP analysis of H3K27ac and IgG (antibody control) for ELF3 and VIM promoter. ChIP-qPCR data are normalized as % of input (n=2-3). (C) mRNA expression of ELF3 and VIM was determined by qPCR and calculated in relation to the housekeeper gene TBP (n=3). (D) 72 h proliferation rate of cells was measured by MTT assay (n=3). (E) Colony formation normalized to control cells (n=3). (F) Cell migration (n=4). All data are presented as mean. P-values were calculated by one-way ANOVA with Fisher's LSD post hoc test or non-parametric Kruskal-Wallis followed by Dunn's test. *P<0.05, **P<0.01, ****P<0.0001. ACTB, actin beta; ChIP, chromatin immunoprecipitation; ELF3, E74 like ETS transcription factor 3; VIM, vimentin; q, quantitative; TBP, TATA box binding protein; SAHA, Suberoylanilide hydroxamic acid; LT, long-term treatment.
|
Long-term epigenetic drug treatment affects expression of the gemcitabine transporter SLC29A1
As mentioned above, long-term epigenetic treatment of PDAC cell lines caused a significant transcriptional and phenotypical reprogramming, particularly of classical cells. Thus, it was investigated if long-term epigenetic drug treatment also had an influence on tumor cell chemosensitivity to gemcitabine. After long-term HATi treatment with 1 μM A485, there was a significant reduction of H3K27ac at the SLC29A1 promoter only in classical cells (Fig. 6A). The loss of H3K27ac following HATi treatment resulted in a significant decreased expression of SLC29A1 in classical cell lines (Fig. 6B). In contrast, the SLC29A1 expression was not affected by HATi in basal-like cell lines. Likewise, long-term HDACi treatment had no effect on epigenetic regulation of SLC29A1 in all tumor cell lines (Fig. 6A and B). Next, it was tested whether long-term epigenetic drug treatment affected gemcitabine drug response of classical and basal-like cell lines. The classical cell lines exhibited impaired gemcitabine drug response after long-term treatment with SAHA, whereas no alterations were detected following A485 treatment. Notably, neither long-term A485 nor SAHA treatment altered the gemcitabine drug response of basal-like cell lines (Figs. 6C and S5). Overall, the data suggested that epigenetic and transcriptional changes of SLC29A1 induced by long-term A485 or SAHA treatment did not affect the gemcitabine response of the tumor cells. However, pancreatic tumor cells respond with decreased chemosensitivity to epigenetic drug treatment depending on the molecular subtype.
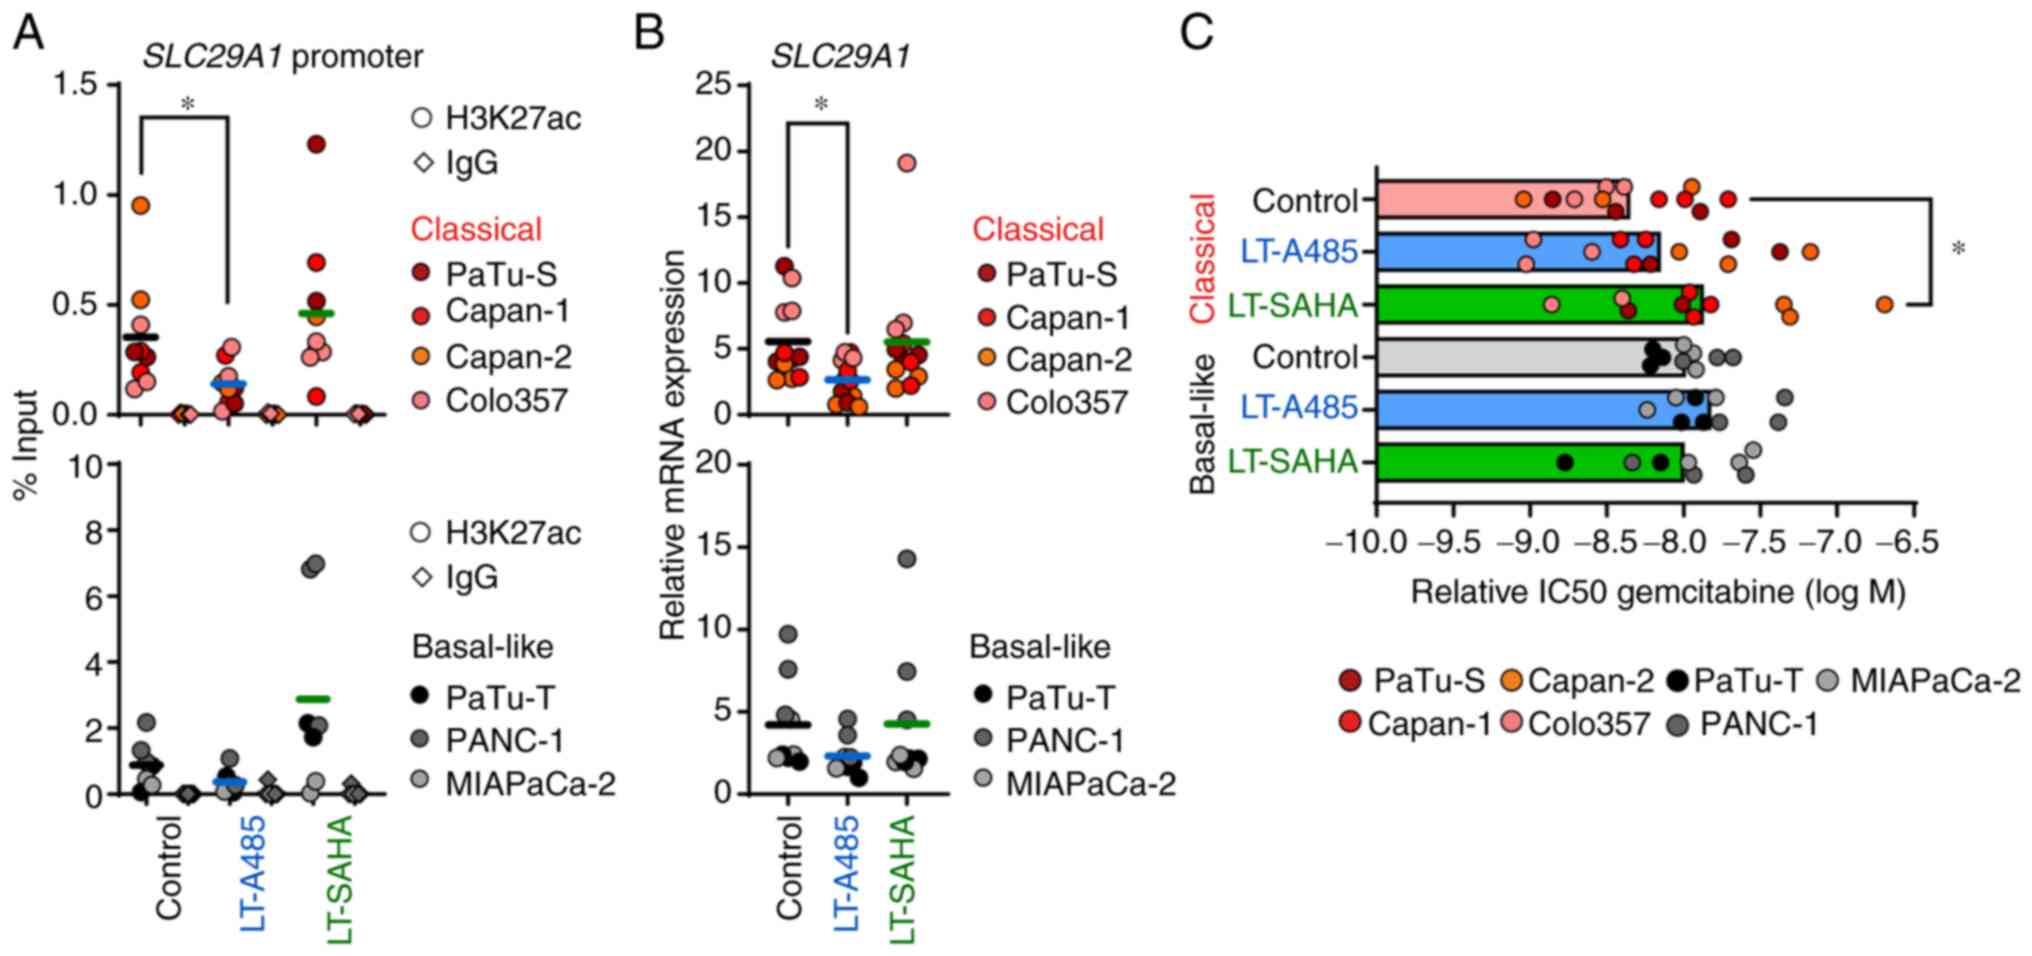 |
Figure 6.
Long-term epigenetic drug treatment affects expression of the gemcitabine transporter SLC29A1. Cell lines were treated with 1 μM A485 or 0.5 or 0.05 μM (MIAPaCa-2) SAHA between 4-30 weeks before use. (A) ChIP analysis of H3K27ac and IgG (antibody control) for SLC29A1 promoter. ChIP-qPCR data are normalized as % of input (n=2-3). (B) mRNA expression of SCL29A1 was determined by qPCR and calculated in relation to the housekeeper gene TBP (n=3). (C) Cell viability after gemcitabine treatment for 72 h was measured by MTT assay. Relative IC50 values of gemcitabine treatment were calculated (n=3). All data are presented as mean. P-values were calculated by one-way ANOVA with Fisher's LSD post-hoc test or non-parametric Kruskal-Wallis followed by Dunn's test. *P<0.05. SLC29A1, solute carrier family 29 member 1; ChIP, chromatin immunoprecipitation; q, quantitative; SAHA, Suberoylanilide hydroxamic acid; TBP, TATA box binding protein; IC50, half-maximal inhibitory concentration; LT, long-term treatment.
|
Discussion
The present study uncovered an H3K27ac-driven epigenetic regulation of specific PDAC subtype marker genes, differences in the overall abundance of H3K27ac and an altered expression of histone acetylation remodeler EP300 and CREBBP in classical and basal-like PDAC cell lines. In addition, classical and basal-like cell lines responded differently to epigenetic treatment with HATi and HDACi.
Analysis of the association between gene expression and the abundance of transcriptionally active histone modification H3K27ac at the promoter region of the classical marker genes EPCAM and ELF3 and the basal-like marker gene VIM demonstrated a strong epigenetic regulation of these genes in classical and basal-like PDAC cell lines. This was consistent with a genome-wide ChIPseq analysis of selected histone modifications performed by Diaferia et al (15) that revealed subtype-specific clustering of PDAC cell lines based on H3K27ac profiles. Specifically, a pronounced enrichment of H3K27ac at enhancer regions associated with epithelial genes is observed in PDAC cell lines exhibiting a classical phenotype (15). A distinct epigenetic landscape of classical and basal-like tumor tissues has been identified in xenograft tumor models derived from patients with PDAC. Lomberk et al (6) detected, for example, that epigenetically active gene programs in basal-like tumors are associated with EMT, Wnt or TGFβ signaling pathways, which promotes tumor aggressiveness. It has been frequently reported that HDACs are upregulated primarily in undifferentiated PDACs (30,31). Specifically, HDAC1 and HDAC2 bind to EMT transcription factors SNAIL and ZEB1 to suppress transcription of the epithelial marker E-cadherin, which promotes tumor progression to an aggressive EMT phenotype (8,9). The role of HATs in PDAC is contradictory: EP300 is downregulated in highly metastatic PDAC cell lines due to increased expression of several regulatory miRNAs (32). Loss of EP300 leads to a suppression of cell differentiation programs, resulting in a phenotypical switch from classical to basal-like PDAC subtype (33). On the other hand, another study reported high EP300 protein expression in the majority of human PDAC specimens (34). The present study demonstrated decreased expression of HATs EP300 and CREBBP and epigenetic readers BRD4 and SMARCA4 in basal-like PDAC cell lines. In line with these data, basal-like cell lines showed higher HDAC2 expression and overall lower H3K27ac levels compared with classical cell lines. High HDAC2 levels in basal-like PDAC cell lines shift the gene network to a more aggressive and metastatic cell state (35) that may be epigenetically reprogrammable. The establishment of tumor-promoting programs and upregulation of multiple key epigenetic regulators in PDAC tissues suggest the ability of epigenetic drugs to reprogram tumor cells into a less aggressive phenotype (36).
Classical and basal-like tumor cells differ in response to standard chemotherapy. Tumor cells with a basal-like phenotype are less responsive to gemcitabine (25,37). In general, PDAC is characterized by resistance to current treatment options, such as gemcitabine (38). Previous attempts to overcome chemoresistance with epigenetic drugs were promising in experimental approaches, but failed in clinical trials because patients were not stratified according to molecular characteristics (14). In the present study, histone acetylation status of tumor cells with classical or basal-like subtype was determined before the cell lines were treated with short- or long-term HATi and HDACi to assess their ability to undergo epigenetic reprogramming. Following short- or long-term HATi treatment with A485, classical cell lines were negatively affected and revealed enriched EMT features and decreased gemcitabine sensitivity. A485-treated classical cell lines exhibited downregulation of the epithelial marker gene ELF3 and upregulation of mesenchymal marker gene VIM, which was associated with decreased and increased changes in H3K27ac levels, respectively. Moreover, A485-treated classical cell lines showed increased cell migration. Although gene expression of the gemcitabine transporter SLC29A1 was decreased in classical cell lines after short- and long-term HATi treatment, the response to gemcitabine was not affected. In other studies, high doses of various HATi, which caused complete inhibition of histone acetylation, led to cell cycle arrest and apoptosis in pancreatic tumor cells (34,39). In combination with gemcitabine, HATi treatment results in synergistic or additive cell death effects (34,39), rather than epigenetic reprogramming. The impact of HATi must be evaluated, as administration may have detrimental effects in patients with PDAC with classical tumor subtype. Thus, the function of HATi is dependent on the dose and the molecular subtype of the tumor cell. Although HDAC-driven tumor progression has been reported primarily in basal-like PDAC (6,35), the present study treated PDAC cell lines from both subtypes with an HDACi to investigate functional differences and molecular stratification options. A significant increase in H3K27ac was observed in basal-like cell lines after treatment with HDACi, but both tumor cell subtypes showed only a few differentially expressed genes. However, only the classical cell lines exhibited decreased cell proliferation and gemcitabine sensitivity. Unlike previous studies showing synergistic or additive antitumor effects of HDACi in combination with gemcitabine, the present study observed different responses for subtype-specific cell lines when using low-dose SAHA (11,13,40). The cellular subtype, drug dosage of the HDACi, as well as targeted HDAC classes, are essential to assess the functional and therapeutic outcome for HDACi. Although several approaches have investigated HDACi as a therapy option for pancreatic cancer, either as mono-therapy or in combination with chemotherapeutic drugs or targeted therapies (14,41), more systematic studies are needed. Further investigations focusing on a prior selection of patients that would benefit from epigenetic therapy are essential to target epigenetic modifications.
Supplementary Data
Availability of data and materials
The datasets generated and/or analyzed during the current study are available in the Gene Expression Omnibus repository, accession no. GSE235027.
Authors' contributions
QZ, SP, SB and IR designed the study and wrote the manuscript. QZ, SP, AMD, JW and IR designed the methodology. QZ, SP, AMD, NS, TS, JW, LF and MDSEL performed experiments and collected data. QZ, NS, TS, SB, JK, JM and UMM analyzed data. SB, JK, JM and UMM interpreted data, provided administrative, technical, or material support and revised the manuscript. QZ and IR confirm the authenticity of all raw data. All authors have read and approved the final manuscript.
Ethics approval and consent to participate
Not applicable.
Patient consent for publication
Not applicable.
Competing interests
The authors declare that they have no competing interests.
Abbreviations:
|
DEG
|
differentially expressed gene
|
|
EMT
|
epithelial-to-mesenchymal transition
|
|
HATi
|
histone acetyltransferase inhibitor
|
|
HDAC
|
histone deacetylase
|
|
SAHA
|
vorinostat
|
|
PDAC
|
pancreatic ductal adenocarcinoma
|
Acknowledgments
The authors would like to thank Mr Ahmed Alnatsha, Mr Prince Allawadhi and Mr Simon Gahr, Department of Medicine II, University Hospital, LMU Munich, Germany, for useful discussions and for excellent technical support. The authors would also like to thank Dr Helmut Blum, Dr. Stefan Krebs and Ms Marlies Fischaleck, Laboratory for Functional Genome Analysis, LMU Munich, Germany, for RNA-seq service.
Funding
The present study was supported in part by the Deutsche Forschungsgemeinschaft (grant no. RE 3754/3-1; project no. 451953106), Wilhelm Sander-Stiftung (grant no. 2019.083.1) and China Scholarship Council (grant no. 202108080083).
References
|
1
|
Connor AA and Gallinger S: Pancreatic cancer evolution and heterogeneity: Integrating omics and clinical data. Nat Rev Cancer. 22:131–142. 2022. View Article : Google Scholar
|
|
2
|
Regel I, Mayerle J and Mahajan UM: Current Strategies and future perspectives for precision medicine in pancreatic cancer. Cancers (Basel). 12:10242020. View Article : Google Scholar : PubMed/NCBI
|
|
3
|
Chan-Seng-Yue M, Kim JC, Wilson GW, Ng K, Figueroa EF, O'Kane GM, Connor AA, Denroche RE, Grant RC, McLeod J, et al: Transcription phenotypes of pancreatic cancer are driven by genomic events during tumor evolution. Nat Genet. 52:231–240. 2020. View Article : Google Scholar : PubMed/NCBI
|
|
4
|
Williams HL, Dias Costa A, Zhang J, Raghavan S, Winter PS, Kapner KS, Ginebaugh SP, Väyrynen SA, Väyrynen JP, Yuan C, et al: Spatially resolved single-cell assessment of pancreatic cancer expression subtypes reveals co-expressor phenotypes and extensive intratumoral heterogeneity. Cancer Res. 83:441–455. 2023. View Article : Google Scholar :
|
|
5
|
Bailey P, Chang DK, Nones K, Johns AL, Patch AM, Gingras MC, Miller DK, Christ AN, Bruxner TJ, Quinn MC, et al: Genomic analyses identify molecular subtypes of pancreatic cancer. Nature. 531:47–52. 2016. View Article : Google Scholar : PubMed/NCBI
|
|
6
|
Lomberk G, Blum Y, Nicolle R, Nair A, Gaonkar KS, Marisa L, Mathison A, Sun Z, Yan H, Elarouci N, et al: Distinct epigenetic landscapes underlie the pathobiology of pancreatic cancer subtypes. Nature communications. 9:19782018. View Article : Google Scholar : PubMed/NCBI
|
|
7
|
Shvedunova M and Akhtar A: Modulation of cellular processes by histone and non-histone protein acetylation. Nat Rev Mol Cell Biol. 23:329–349. 2022. View Article : Google Scholar : PubMed/NCBI
|
|
8
|
Aghdassi A, Sendler M, Guenther A, Mayerle J, Behn CO, Heidecke CD, Friess H, Büchler M, Evert M, Lerch MM and Weiss FU: Recruitment of histone deacetylases HDAC1 and HDAC2 by the transcriptional repressor ZEB1 downregulates E-cadherin expression in pancreatic cancer. Gut. 61:439–448. 2012. View Article : Google Scholar
|
|
9
|
von Burstin J, Eser S, Paul MC, Seidler B, Brandl M, Messer M, von Werder A, Schmidt A, Mages J, Pagel P, et al: E-cadherin regulates metastasis of pancreatic cancer in vivo and is suppressed by a SNAIL/HDAC1/HDAC2 repressor complex. Gastroenterology. 137:361–371. 371.e1–e5. 2009. View Article : Google Scholar : PubMed/NCBI
|
|
10
|
Roca MS, Moccia T, Iannelli F, Testa C, Vitagliano C, Minopoli M, Camerlingo R, De Riso G, De Cecio R, Bruzzese F, et al: HDAC class I inhibitor domatinostat sensitizes pancreatic cancer to chemotherapy by targeting cancer stem cell compartment via FOXM1 modulation. J Exp Clin Cancer Res. 41:832022. View Article : Google Scholar : PubMed/NCBI
|
|
11
|
Lee HS, Park SB, Kim SA, Kwon SK, Cha H, Lee DY, Ro S, Cho JM and Song SY: A novel HDAC inhibitor, CG200745, inhibits pancreatic cancer cell growth and overcomes gemcitabine resistance. Sci Rep. 7:416152017. View Article : Google Scholar : PubMed/NCBI
|
|
12
|
Edderkaoui M, Chheda C, Soufi B, Zayou F, Hu RW, Ramanujan VK, Pan X, Boros LG, Tajbakhsh J, Madhav A, et al: An inhibitor of GSK3B and HDACs kills pancreatic cancer cells and slows pancreatic tumor growth and metastasis in mice. Gastroenterology. 155:1985–1998.e5. 2018. View Article : Google Scholar : PubMed/NCBI
|
|
13
|
Cai MH, Xu XG, Yan SL, Sun Z, Ying Y, Wang BK and Tu YX: Depletion of HDAC1, 7 and 8 by histone deacetylase inhibition confers elimination of pancreatic cancer stem cells in combination with gemcitabine. Sci Rep. 8:16212018. View Article : Google Scholar : PubMed/NCBI
|
|
14
|
Hessmann E, Johnsen SA, Siveke JT and Ellenrieder V: Epigenetic treatment of pancreatic cancer: Is there a therapeutic perspective on the horizon? Gut. 66:168–179. 2017. View Article : Google Scholar
|
|
15
|
Diaferia GR, Balestrieri C, Prosperini E, Nicoli P, Spaggiari P, Zerbi A and Natoli G: Dissection of transcriptional and cisregulatory control of differentiation in human pancreatic cancer. EMBO J. 35:595–617. 2016. View Article : Google Scholar : PubMed/NCBI
|
|
16
|
Suarez-Arnedo A, Torres Figueroa F, Clavijo C, Arbeláez P, Cruz JC and Muñoz-Camargo C: An image J plugin for the high throughput image analysis of in vitro scratch wound healing assays. PLoS One. 15:e02325652020. View Article : Google Scholar : PubMed/NCBI
|
|
17
|
Pfaffl MW: A new mathematical model for relative quantification in real-time RT-PCR. Nucleic Acids Res. 29:e452001. View Article : Google Scholar : PubMed/NCBI
|
|
18
|
Kopylova E, Noé L and Touzet H: SortMeRNA: Fast and accurate filtering of ribosomal RNAs in metatranscriptomic data. Bioinformatics. 28:3211–3217. 2012. View Article : Google Scholar : PubMed/NCBI
|
|
19
|
Dobin A, Davis CA, Schlesinger F, Drenkow J, Zaleski C, Jha S, Batut P, Chaisson M and Gingeras TR: STAR: Ultrafast universal RNA-seq aligner. Bioinformatics. 29:15–21. 2013. View Article : Google Scholar
|
|
20
|
Love MI, Huber W and Anders S: Moderated estimation of fold change and dispersion for RNA-seq data with DESeq2. Genome Biol. 15:5502014. View Article : Google Scholar : PubMed/NCBI
|
|
21
|
Wu T, Hu E, Xu S, Chen M, Guo P, Dai Z, Feng T, Zhou L, Tang W, Zhan L, et al: clusterProfiler 4.0: A universal enrichment tool for interpreting omics data. Innovation (Camb). 2:1001412021.PubMed/NCBI
|
|
22
|
Yu G, Wang LG, Han Y and He QY: clusterProfiler: An R package for comparing biological themes among gene clusters. OMICS. 16:284–287. 2012. View Article : Google Scholar : PubMed/NCBI
|
|
23
|
Gröger CJ, Grubinger M, Waldhör T, Vierlinger K and Mikulits W: Meta-analysis of gene expression signatures defining the epithelial to mesenchymal transition during cancer progression. PLoS One. 7:e511362012. View Article : Google Scholar : PubMed/NCBI
|
|
24
|
Nicolle R, Gayet O, Duconseil P, Vanbrugghe C, Roques J, Bigonnet M, Blum Y, Elarouci N, Armenoult L, Ayadi M, et al: A transcriptomic signature to predict adjuvant gemcitabine sensitivity in pancreatic adenocarcinoma. Ann Oncol. 32:250–260. 2021. View Article : Google Scholar
|
|
25
|
Collisson EA, Sadanandam A, Olson P, Gibb WJ, Truitt M, Gu S, Cooc J, Weinkle J, Kim GE, Jakkula L, et al: Subtypes of pancreatic ductal adenocarcinoma and their differing responses to therapy. Nat Med. 17:500–503. 2011. View Article : Google Scholar : PubMed/NCBI
|
|
26
|
Fujisawa T and Filippakopoulos P: Functions of bromodomain-containing proteins and their roles in homeostasis and cancer. Nat Rev Mol Cell Biol. 18:246–262. 2017. View Article : Google Scholar : PubMed/NCBI
|
|
27
|
Maréchal R, Bachet JB, Mackey JR, Dalban C, Demetter P, Graham K, Couvelard A, Svrcek M, Bardier-Dupas A, Hammel P, et al: Levels of gemcitabine transport and metabolism proteins predict survival times of patients treated with gemcitabine for pancreatic adenocarcinoma. Gastroenterology. 143:664–674.e6. 2012. View Article : Google Scholar : PubMed/NCBI
|
|
28
|
Greenhalf W, Ghaneh P, Neoptolemos JP, Palmer DH, Cox TF, Lamb RF, Garner E, Campbell F, Mackey JR, Costello E, et al: Pancreatic cancer hENT1 expression and survival from gemcitabine in patients from the ESPAC-3 trial. J Natl Cancer Inst. 106:djt3472014. View Article : Google Scholar
|
|
29
|
Bird NTE, Elmasry M, Jones R, Psarelli E, Dodd J, Malik H, Greenhalf W, Kitteringham N, Ghaneh P, Neoptolemos JP and Palmer D: Immunohistochemical hENT1 expression as a prognostic biomarker in patients with resected pancreatic ductal adenocarcinoma undergoing adjuvant gemcitabine-based chemotherapy. Br J Surg. 104:328–336. 2017. View Article : Google Scholar : PubMed/NCBI
|
|
30
|
Fritsche P, Seidler B, Schüler S, Schnieke A, Göttlicher M, Schmid RM, Saur D and Schneider G: HDAC2 mediates therapeutic resistance of pancreatic cancer cells via the BH3-only protein NOXA. Gut. 58:1399–1409. 2009. View Article : Google Scholar : PubMed/NCBI
|
|
31
|
Lehmann A, Denkert C, Budczies J, Buckendahl AC, Darb-Esfahani S, Noske A, Müller BM, Bahra M, Neuhaus P, Dietel M, et al: High class I HDAC activity and expression are associated with RelA/p65 activation in pancreatic cancer in vitro and in vivo. BMC Cancer. 9:3952009. View Article : Google Scholar : PubMed/NCBI
|
|
32
|
Mees ST, Mardin WA, Wendel C, Baeumer N, Willscher E, Senninger N, Schleicher C, Colombo-Benkmann M and Haier J: EP300-a miRNA-regulated metastasis suppressor gene in ductal adenocarcinomas of the pancreas. Int J Cancer. 126:114–124. 2010. View Article : Google Scholar
|
|
33
|
Zhong Z, Harmston N, Wood KC, Madan B and Virshup DM: A p300/GATA6 axis determines differentiation and Wnt dependency in pancreatic cancer models. J Clin Invest. 132:e1563052022. View Article : Google Scholar : PubMed/NCBI
|
|
34
|
Ono H, Basson MD and Ito H: P300 inhibition enhances gemcitabine-induced apoptosis of pancreatic cancer. Oncotarget. 7:51301–51310. 2016. View Article : Google Scholar : PubMed/NCBI
|
|
35
|
Krauß L, Urban BC, Hastreiter S, Schneider C, Wenzel P, Hassan Z, Wirth M, Lankes K, Terrasi A, Klement C, et al: HDAC2 facilitates pancreatic cancer metastasis. Cancer Res. 82:695–707. 2022. View Article : Google Scholar
|
|
36
|
Silverman BR and Shi J: Alterations of epigenetic regulators in pancreatic cancer and their clinical implications. Int J Mol Sci. 17:21382016. View Article : Google Scholar : PubMed/NCBI
|
|
37
|
Raghavan S, Winter PS, Navia AW, Williams HL, DenAdel A, Lowder KE, Galvez-Reyes J, Kalekar RL, Mulugeta N, Kapner KS, et al: Microenvironment drives cell state, plasticity, and drug response in pancreatic cancer. Cell. 184:6119–6137.e26. 2021. View Article : Google Scholar : PubMed/NCBI
|
|
38
|
Neoptolemos JP, Kleeff J, Michl P, Costello E, Greenhalf W and Palmer DH: Therapeutic developments in pancreatic cancer: Current and future perspectives. Nat Rev Gastroenterol Hepatol. 15:333–348. 2018. View Article : Google Scholar : PubMed/NCBI
|
|
39
|
Ono H, Kato T, Murase Y, Nakamura Y, Ishikawa Y, Watanabe S, Akahoshi K, Ogura T, Ogawa K, Ban D, et al: C646 inhibits G2/M cell cycle-related proteins and potentiates anti-tumor effects in pancreatic cancer. Sci Rep. 11:100782021. View Article : Google Scholar : PubMed/NCBI
|
|
40
|
Maietta I, Martínez-Pérez A, Álvarez R, De Lera ÁR, González-Fernández Á and Simón-Vázquez R: Synergistic antitumoral effect of epigenetic inhibitors and gemcitabine in pancreatic cancer cells. Pharmaceuticals (Basel). 15:8242022. View Article : Google Scholar : PubMed/NCBI
|
|
41
|
Hamdan FH and Johnsen SA: Epigenetic targeting of aberrant transcriptional modulation in pancreatic cancer. Epigenomes. 2:82018. View Article : Google Scholar
|


