Introduction
Cancer (tumor malignant) cells can appear and expand
in several tissues as a result of genetic, epigenetic and
developmental aberrations of the physiological homeostatic cell
regulation (1). Such events can
lead to a malignancy that is characterized by lack of cell
differentiation and apoptosis, unlimited proliferation autonomy and
self-renewal, insensitivity to external regulatory stimuli,
angiogenesis and metastasis (2).
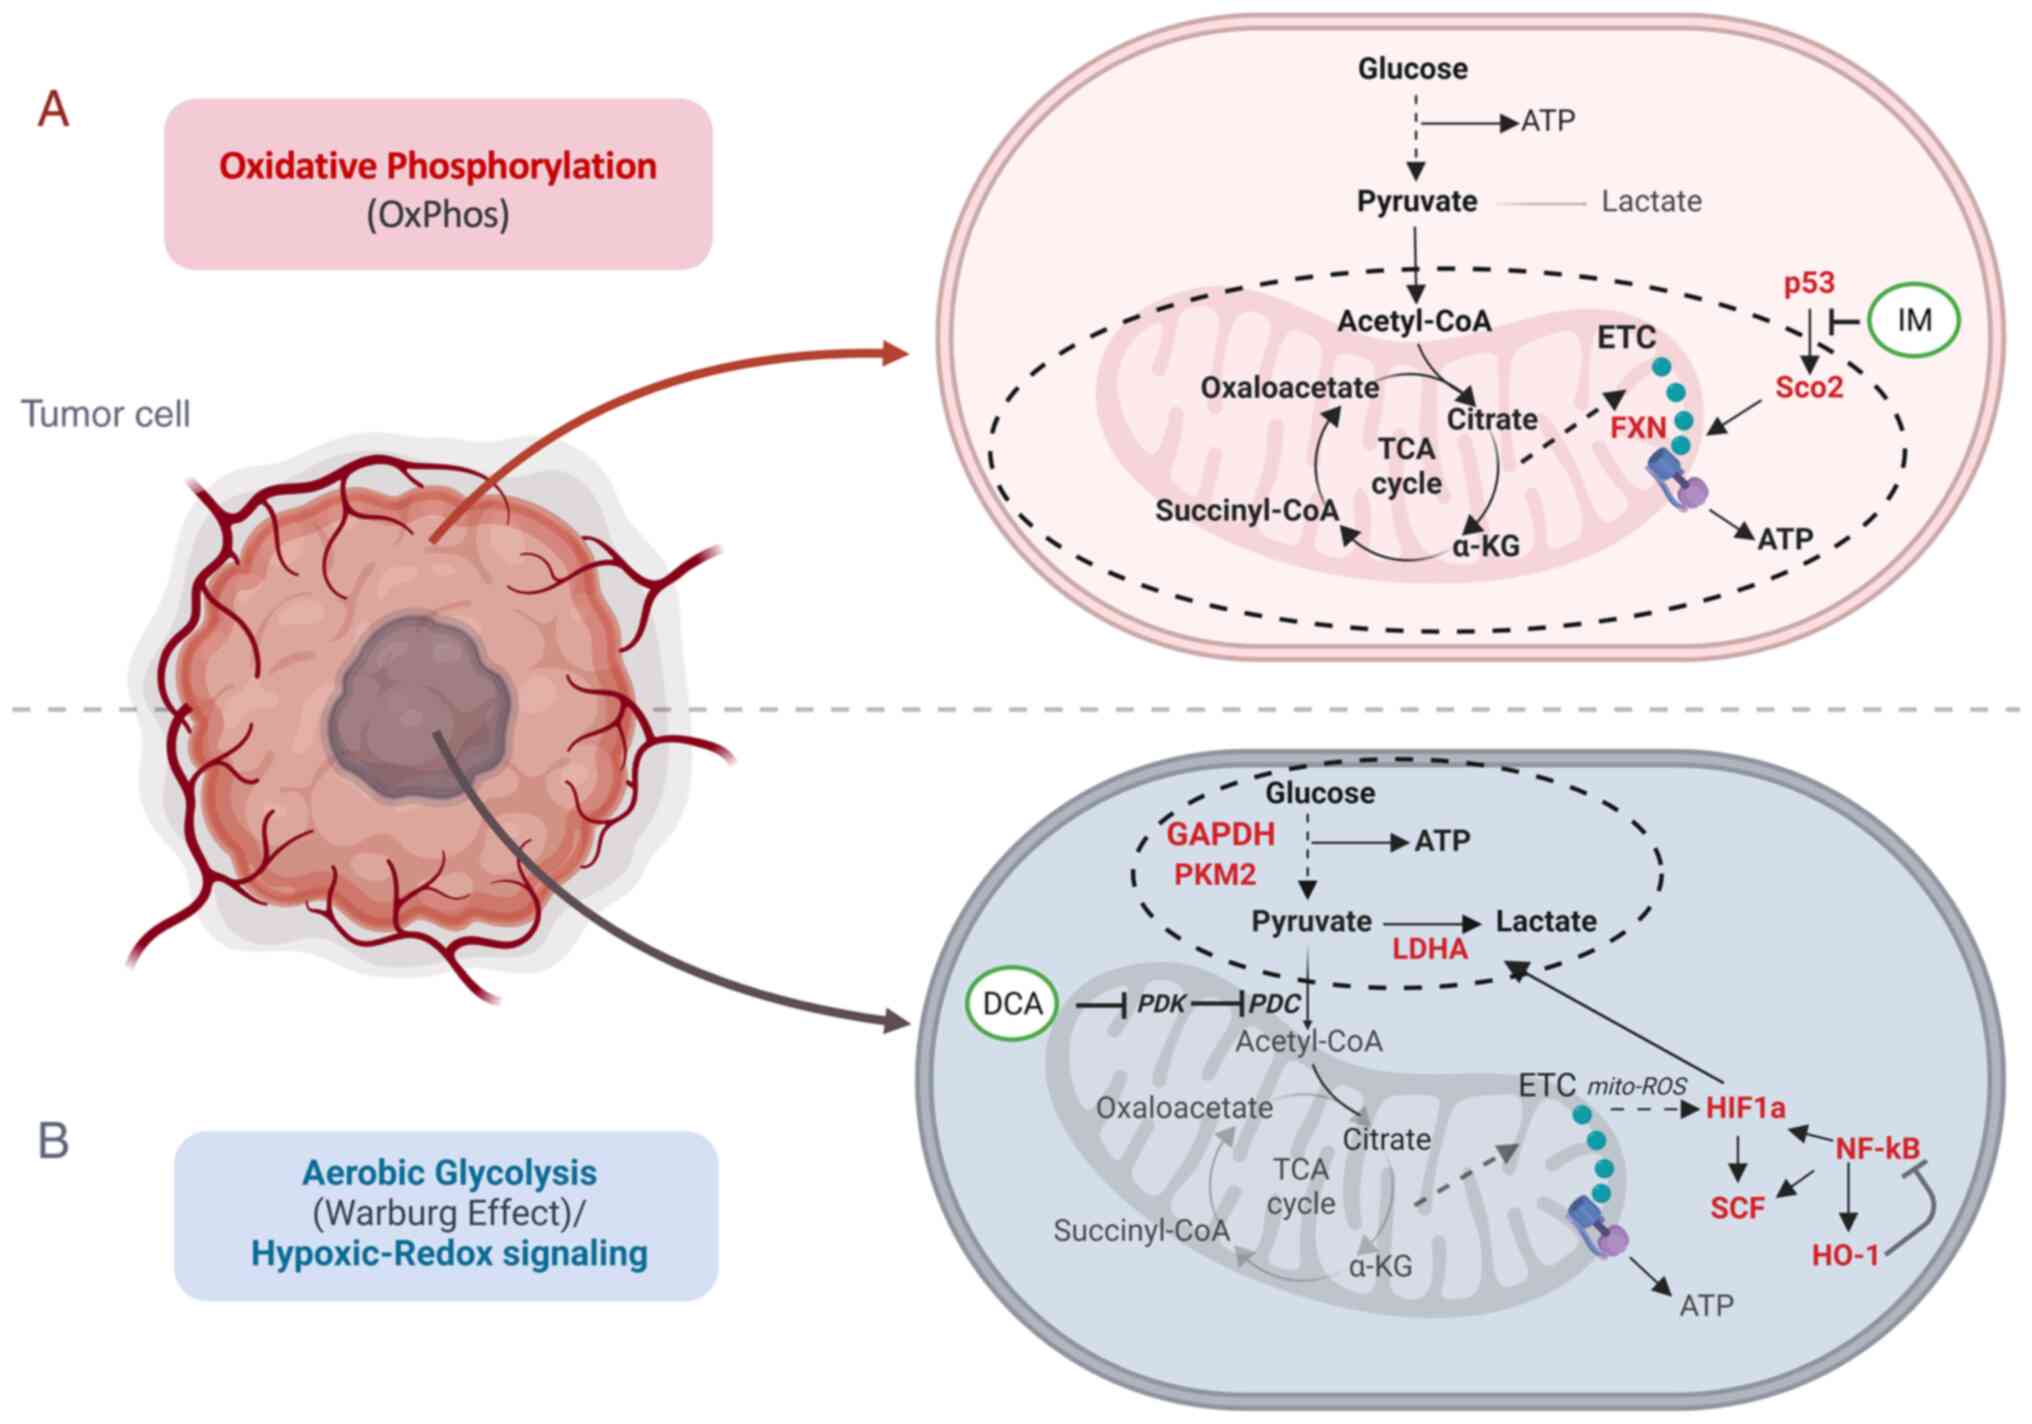
Moreover, cancer cells undergo severe mitochondrial bioenergetic
dysregulation (3-6) (Fig.
1). This dysfunction affects ATP production and increases the
formation of reactive oxygen species (ROS) that promote
mitochondrial oxidative stress and DNA damage (7) in leukemia (8) and other types of cancer.
ROS are mainly generated by complex I via the
NADH:NAD ratio in mitochondria (9). While normal cells produce energy
through the two major metabolic pathways [oxidative phosphorylation
(OxPhos) and glycolysis], several cancer cells exhibit the
well-discussed 'Warburg effect' (10,11), that characterizes chimeric energy
generation states that oscillate between OxPhos and aerobic
glycolysis, while accompanied by hypoxic-redox signaling (Fig. 1). In fact, while normal cells can
generate more than 30 molecules of ATP per molecule of glucose via
OxPhos, their cancer counterparts can produce 4 molecules of ATP,
resulting in a net gain of 2 molecules of ATP per molecule of
glucose consumed. In the same context, cancer cells tend to produce
lactate to a markedly greater extent as compared with normal cells
(12). This metabolic shift in
mitochondria, known otherwise also as 'metabolic reprogramming',
primes hypoxia and is likely related to alterations in the aberrant
TP53 gene that is found mutated in ~50% of the malignant
tumors (13).
As TP53 encodes a master transcription factor
that regulates, among others, the expression of the mitochondrial
protein for synthesis of cytochrome c oxidase 2 (SCO2) which is
involved in the transfer of copper into the cytochrome c oxidase
(COX) II subunit (14), mutations
of TP53 appear to directly influence the dynamics of SCO2 in
the holoenzyme complex IV biosynthesis and the assembly of COX in
the mitochondrial respiratory chain (15). Encoded mutations in TP53
frequently drive mitochondrial abnormalities in cancer cells
(16), while certain SCO2
mutations can lead to severe COX deficiency and contribute to
various grades of mitochondrial dysfunction (15,17,18).
In a previous study conducted by the authors
concerning human K-562 leukemia-based studies in 2014, it was
noticed that imatinib (IM) mesylate (Gleevec), a potent inhibitor
of the hybrid Bcr-Abl tyrosine phosphokinase activity, that is used
as an effective antineoplastic drug for the treatment of human
chronic myelogenous leukemia (CML) (19-23), downregulated the expression of the
SCO2 and frataxin (FXN) genes (24). The latter encodes two important
proteins involved in the heme-dependent cytochrome c oxidase
biosynthesis and assembly pathway (HDCBAP) of COX in the
mitochondria. This finding, along with the facts that IM has been
found to promote apoptosis via a ROS-dependent JNK-Bcl2 mediated
signaling pathway in melanoma cells (25) and that ROS activates the apoptosis
signaling (26), suggested that
IM probably affects the mitochondrial oxidative metabolism by ROS
as well (27).
Cancer cells exhibit hypoxic profiles through
metabolic changes (28) and
produce energy preferentially via aerobic glycolysis (4). On those grounds, it was investigated
whether co-treatment of cultured cancer cells with IM and
dichloroacetate (DCA), could induce an increased anti-proliferative
effect in the human K-562 leukemia and HCT-116 colorectal cell
lines. DCA is a potent blocker of glycolysis through the inhibition
of the pyruvate dehydrogenase (PDH) kinase (PDK) (29-31). DCA inhibits PDK and thus releases
PDH, the rate-limiting enzyme for glucose oxidation. PDH converts
the glycolysis-produced pyruvate that enters mitochondria to acetyl
coenzyme A (acetyl-CoA) that is consumed in the processes of
tricarboxylic acid cycle (TCA, also known as Krebs cycle) and
OxPhos, thereby increasing the influx of acetyl-CoA from glycolysis
into the TCA cycle. These two cell lines (K-562 and HCT-116)
represent model systems for CML and a solid tumor (colorectal
carcinoma), respectively, to examine the impact of: i)
Chemoresistance of erythroleukemia K-562 cells to IM, as well as
ii) the absence of full length p53 protein on the efficiency of the
IM and DCA combination chemotherapy in colorectal carcinoma
cells.
Thus, cultured cells of each cell line were
independently treated either with IM or DCA alone, or in
combination, and cell viability, inhibition of cell proliferation
and the levels of several other process biomarkers (Table I) which include: i) the SCO2 and
FXN proteins as markers of OxPhos (24,32), ii) the glycolytic mediators
glyceraldehyde-3-phosphate dehydrogenase (GAPDH) (33), pyruvate kinase M2 (PKM2) (34) as well as lactate dehydrogenase A
(LDHA), a key enzyme for the 'Warburg effect' and lactate
production (35-38), iii) the hypoxia dependent factors
hypoxia inducing factor-1a (HIF-1a) (39,40) and SCF (41,42) and iv) the Redox signaling
mediators heme oxygenase-1 (HO-1) (43,44) and NF-κB (45-47) were assessed.
 | Table IA total of 10 proteins assessed by
western blotting as biomarkers for oxidative phosphorylation,
glycolysis and hypoxia/oxidative stress in the human
erythroleukemic K-562 and colorectal HCT-116 cancer cells. A total
of 10 candidates of interest explored as potential biomarkers of
mitochondrial bioenergetics share physicochemical interactions by
STRING analysis. Prior to exploring the expression profiles of the
10 species selected as potential mitochondrial bioenergetics
biomarkers, STRING analysis was performed to investigate whether
they share physicochemical interactions as revealed in Fig. S5. |
Table I
A total of 10 proteins assessed by
western blotting as biomarkers for oxidative phosphorylation,
glycolysis and hypoxia/oxidative stress in the human
erythroleukemic K-562 and colorectal HCT-116 cancer cells. A total
of 10 candidates of interest explored as potential biomarkers of
mitochondrial bioenergetics share physicochemical interactions by
STRING analysis. Prior to exploring the expression profiles of the
10 species selected as potential mitochondrial bioenergetics
biomarkers, STRING analysis was performed to investigate whether
they share physicochemical interactions as revealed in Fig. S5.
| Cellular
process | Proteins |
|---|
| Oxidation
phosphorylation | SCO2, FXN |
| Glycolysis | GAPDH, PKM2,
LDHA |
| Hypoxia/Oxidative
stress | HIF-1a, SCF, NF-κB,
VEGF, HO-1 |
Moreover, the present study aimed to investigate the
impact of each treatment on the levels of ROS production in K-562
cells. Protein expression profiling analysis was performed by
western blotting (WB) for OxPhos, glycolysis and hypoxia/oxidative
stress related protein markers and ROS accumulation. Overall,
evidence that the targeting of mitochondrial dysfunction in
bioenergetics with IM and DCA can offer an alternative novel
therapeutic approach to eradicate cancer cells was provided. The
findings presented in the results Part I section were obtained from
studies with the K-562 and K-562R CML cells and in Part II with the
HCT-116 (+/+p53) and HCT-116 (−/−p53) colorectal carcinoma cells,
respectively.
Materials and methods
Cell culture and materials
Human Bcr(−) Abl(+) CML erythroleukemia K-562
(IM)-sensitive (48) and
IM-resistant K-562R [cat. no. CRL3344; American Type Culture
Collection] cells were seeded at 2-4×10⁵ cells/ml in
RPMI-1640 medium (Gibco; Thermo Fisher Scientific, Inc.). IM
resistance appears to be related to oxidative stress (49). Therefore, in order to maintain
kinase resistance to IM, the stock of cultured K-562R cells was
maintained in culture medium supplemented with 0.89 μM IM
[Imatinib mesylate (IM/Gleevec®)] was made available by
the Novartis International AG) and 10% glutamine (GlutaMAX™; Gibco;
Thermo Fisher Scientific, Inc.) (50). The human colon carcinoma HCT-116
(+/+p53) and HCT-116 (−/−p53) isogenic cell lines were kindly
donated by Professor Bert Vogelstein, M.D. (Johns Hopkins
University School of Medicine) (51). The latter carry both TP53
alleles disrupted. As described in the original publication, the
p53 gene was disrupted in HCT-116 cells by homologous
recombination. Two promoter-less targeting vectors, each containing
a geneticinor hygromycin-resistance gene in place of genomic p53
sequences, were transfected sequentially in HCT-116 cells to
disrupt the two p53 alleles. The targeting vectors used were
constructed so that the first codons of the drug resistance markers
replaced the first codon of the TP53 gene within exon 2.
Verification of the HCT-116 isogenic cell
lines status by PCR genotyping and WB
Prior to any assessments with the two HCT-116
cohorts, the TP53 gene status of the two HCT-116 cohorts was
validated by preparing total RNA from both populations for cDNA PCR
genotyping. Samples A and B were amplified from total RNA, 2.5
μg each, isolated from HCT-116 (+/+p53) and HCT-116 (−/−p53)
cells, using TRIsure (Bioline), according to the manufacturer's
protocol. cDNA was synthesized with the Superscript 1st strand
system for RT-PCR (Invitrogen; Thermo Fisher Scientific, Inc. Life
Technologies Inc.) and DreamTaq DNA Polymerase (Thermo Fisher
Scientific, Inc.) was employed for the PCR reaction, using two
different pairs of oligos (Fig.
S1A). The first set included the 31-nucleotide forward primer
(FP53B) annealing in exon 2 at position 15,957-15,987 bp that
begins with the first codon of the TP53 gene ATG: 5′-ATG GAG
GAG CCG CAG TCA GAT CCT AGC GTC G-3′ and the 36-nucleotide reverse
primer (BP53B), 5′-TCA GTC TGA GTC AGG CCC TTC TGT CTT GAA CAT
GAG-3′, annealing in exon 11 at position 22,907-22,942 bp (5′-CTC
ATG TTC AAG ACA GAA GGG CCT GAC TCA GAC TGA-3′). The expected PCR
product size for this set was 1,182 bp. The second set included the
20-nucleotide forward primer (p53-F1) annealing in exon 5 at
position 17,593-17,612 bp: 5′-TCA GCA TCT TAT CCG AGT GG-3′ and the
same reverse primer (BP53B) as aforementioned. The expected PCR
product size for this second set was 610 bp. The PCR reaction
conditions were as follows: 95°C for 2 min, 39 cycles of 95°C for 1
min, 61°C for 1 min and 72°C for 90 sec, followed by incubation at
72°C for 10 min. PCR products were analyzed via 0.5% agarose gel
electrophoresis in 1X TAE solution and ethidium bromide staining,
using 100 bp DNA molecular weight markers (NIPPON Genetics Europe
GmbH). As illustrated in Fig.
S1B, the HCT-116 (+/+p53) cells expressed, both a longer 1,182
bp (143-1,324) and a shorter 610 bp (715-1,324), TP53
transcript. By contrast, the HCT-116 (−/−p53) cells expressed only
the shorter 610 bp (715-1,324) TP53 transcript. The
expression of a truncated and shorter p53 by the HCT-116 (−/−p53)
cells was also validated at the protein level through WB in samples
of total cytoplasmic extract, derived from HCT-116 (+/+p53) and
HCT-116 (−/−p53) cells (Fig.
S1C). Due to the insertion of the transgenes within the first
codon of exon 2 of the TP53 gene, the HCT-116 (−/−p53) cells
cannot encode a full length p53 transcription factor with
functional regulatory properties as the wild-type analogue
(52). The proliferation kinetic
capacity of the HCT-116 (+/+ p53) and HCT-116 (−/−p53) cells was
additionally evaluated by seeding them at 1.5×10⁵
cells/ml (Fig. S2). HCT-116
(+/+p53) and/or HCT-116 (−/−p53) cells were cultured in McCoy's
medium (Gibco; Thermo Fisher Scientific, Inc.) and were harvested
at 3×10⁵ cells/ml for isolating the cytoplasmic fraction
and at a 3×10⁶ cells/ml density to isolate the
mitochondrial fraction.
Determination of cell proliferation, cell
viability and IC50 value
All cell cultures employed in the present study,
were incubated in media supplemented with 10% v/v FBS (Gibco;
Thermo Fisher Scientific, Inc.) and 1% v/v PS
(penicillin-streptomycin with amphotericin; Gibco; Thermo Fisher
Scientific, Inc.) at 37°C with 5% CO2 humidified
atmosphere (~95%). IM (Gleevec) was kindly donated by the Novartis
Pharma AG Oncology Group (Dr Paul Manley) to Professor Asterios S.
Tsiftsoglou. IM was dissolved in distilled water and added in
culture media at a concentration of 1-2 μM (just lower than
the Cmax of 2.7 μM achieved in CML patients
treated with 400 mg/day) (23).
DCA was purchased from Sigma-Aldrich; Merck KGaA (cat. no. D54702).
The stock solution was diluted in distilled water and added in
cultures at a final concentration of 4 mM. Cell proliferation of
untreated (control), IM-treated, DCA-treated and IM/DCA-treated
cultures was determined at various time intervals by measuring
their cell concentrations using a Neubauer hemocytometer under a
light microscope. Cell viability was similarly assessed by using a
trypan blue solution (0.4% w/v; Sigma-Aldrich; Merck KGaA)
exclusion assay approach (53).
This exclusion test gives a clear-cut kinetic profile on the
percentage (%) of dead and alive cells in a given culture at any
given moment. This information is critical to follow the kinetic
analysis of the accumulation of dead cells in each culture exposed
to any agent. The doubling time was estimated using the doubling
time cell calculator (http://www.doubling-time.com/compute_more.php). In
order to determine the corresponding IC50 value for each
compound, each cell line was treated separately with increasing
concentrations of IM or DCA for 24, 48 and 72 h. Detailed graphic
illustrations of the IC50 studies are included in
Figs. S3 and S4.
Isolation of cytoplasmic protein
lysates
Cell culture suspensions were used for total protein
isolation. Cells were incubated separately with either 1 or 2
μM IM, 4 mM DCA or in combination with these two agents for
72 h. Cell suspensions were harvested at a 60-80% confluency,
washed twice with cold PBS (1X), centrifuged at 1,100 × g and the
resulting pellets were lysed with RIPA buffer (1 M sodium
phosphate, 5 M NaCl, 10% SDS, 10% NP-40 and 1% deoxycholic acid
sodium salt, pH 7.2), supplemented with protease inhibitors
cocktail (1X) (Sigma-Aldrich; Merck KGaA). After centrifugation at
10,000 × g for 15 min at 4°C, all supernatants were collected,
aliquoted and stored at −20°C, as representative of the cellular
total protein content. Untreated cell cultures incubated without
any agent served as control experiments.
Subcellular fractionation and isolation
of mitochondria protein lysates
The mitochondrial fraction was isolated using a
mitochondria lysis buffer (10 mM Tris-HCl, 0.25 mM sucrose, 0.2 mM
EDTA, pH 7.8), supplemented with protease inhibitors cocktail (1X)
(Sigma-Aldrich; Merck KGaA). Lysed cells were centrifuged at 1,000
× g for 5 min at 4°C to pellet mitochondria and were deep frozen
for 30 min at −70°C. This step was repeated three times. Defrosted
samples were disrupted by repeatedly passages through a 21-gauge
needle and centrifuged at 1,000 × g for 10 min at 4°C to pellet
nuclei and cellular debris. Post-nuclear supernatant obtained was
then centrifuged at 10,000 × g for 15 min at 4°C to collect intact
mitochondria, which were resuspended in mitochondria storage buffer
(Qproteome Mitochondria Isolation Kit; cat. no. 37612; Qiagen GmbH)
for storage at −20°C and the analysis of mitochondrial proteins
(SCO2 and FXN) by WB (54).
Western blot analysis
All protein lysates obtained were quantified for
protein content using the Bradford reagent (Bio-Rad Laboratories,
Inc.) (55). Samples of 40 to 80
μg (micrograms) from each protein fraction were used for
further analysis. Protein samples were mixed with the appropriate
volume of loading buffer (1X), heated at 95°C for 5 min, run on a
12-15% acrylamide SDS-PAGE gel and then transferred to PVDF
membrane. To ensure that proteins were successfully transferred,
the PVDF membrane was stained with Ponceau S Staining Solution
(Sigma-Aldrich; Merck KGaA). All membranes were blocked with 5%
Non-fat milk in PBST buffer (PBS with 0.1% Tween® 20)
for 75 min at room temperature (RT) with gentle agitation and then
washed thoroughly with PBST. The primary antibodies were diluted in
3% BSA with PBST buffer or 2% Non-fat milk with PBST buffer. All
membranes were incubated with the primary antibodies for 75 min at
RT or overnight at 4°C. The incubated membranes were then washed
with 10 ml PBST for 15 min, followed by three more washes with 5 ml
PBST for 5 min. The primary antibodies were detected by staining
with secondary alkaline phosphatase (AP)-conjugated antibodies. The
secondary antibodies were diluted in 2% non-fat milk with PBST
buffer and staining was carried out for 75 min at RT followed by
similar washes as earlier. Prior to AP detection, each membrane was
washed with 10 ml of AP Buffer (100 mM Tris-HCl, 100 mM NaCl, 50 mM
MgCl2, pH 9.5), followed by three additional washes with
5 ml for 5 min. For AP visualization, each membrane was transferred
to 4 ml of AP Buffer containing BCIP (5-Bromo-4-Chloro-3-Indolyl
Phosphatase) (cat. no. A1117; BioChemica; AppliChem GmbH) and NBT
(Nitroblue Tetrazolium Chloride) (cat. no. 10008; Biotium, Inc.).
Detection was carried out at RT until the distinct bands
corresponding to the proteins of interest appeared. Immunoblotting
was conducted using the primary antibodies listed in Table SI. In order to ascertain equal
loading of the samples, membranes were also probed with a
monoclonal anti-α-tubulin antibody or a monoclonal anti-β-actin
antibody. Goat anti-rabbit IgG-AP (2:5,000; cat. no. AP132,
Sigma-Aldrich; Merck KGaA) and goat anti-mouse IgG-AP (1:4,000;
cat. no. sc-2008; Santa Cruz Biotechnology, Inc.) antibodies were
used as secondary antibodies and the signal intensities on the
membranes were assessed with BCIP/NBT staining. The protein
molecular weight markers used MWP02 and MWP03 (NIPPON Genetics
Europe GmbH) facilitated the molecular weight estimation. The ratio
of the intensity of each protein band detected in relation to the
corresponding intensity of either α-tubulin and/or β-actin proteins
band for each sample examined was calculated using the Image Studio
Lite 5.0 software (LI-COR Biosciences) and used for densitometry
analysis of the blots. The data are presented as fold difference to
control, using the GraphPad Prism 8.0.2 for Windows (GraphPad
Software; Dotmatics) for illustration purposes.
Measurement of total ROS content in K-562
cells by flow cytometry
Intracellular ROS were measured in K-562 and K-562R
cells by staining with the fluorogenic probe
2′,7′-dichlorofluorescein diacetate (DCFDA; cat no. D6883;
Sigma-Aldrich; Merck KGaA) followed by flow cytometry analysis
(56). Cultured cells were
incubated at 37°C, 5% CO2 for 72 h, either with 1 or 2
μM IM, or 4 mM DCA, or a combination of IM/DCA. All
incubated cells were harvested, diluted in PBS (1X) and
subsequently treated with 20 μM_DCFDA for 20 min at 37°C
without light. For ROS quantification the stained cells were
collected by centrifugation at 150 × g for 5 min in RT and
resuspended in 1 ml PBS. All cells were analyzed by flow cytometry
detecting the increase in fluorescence at 550 nm after sample
excitation at 485 nm on a CyFlow® Robby 8 Autoloading
Station flow cytometer (Sysmex Partec GmbH) and the data was
analyzed using the FlowJo_V10 software (BD Biosciences).
Network biology modelling
To uncover putative connections among the selected
molecules of interest and biological pathways, the Enrichr
Knowledge Graph web-based platform was used (https://enrichr-kg.dev.maayanlab.cloud/). A total of
five biological pathways were leveraged from the Gene Ontology
(https://geneontology.org/), Kyoto
Encyclopedia of Genes and Genomes (https://www.genome.jp/kegg/), Wikipathways 2021
(https://www.wikipathways.org/), Reactome
(https://reactome.org/) and DisGeNET (https://www.disgenet.org/) databases and a
protein-pathway bipartite graph was retrieved. Visualization of
this bipartite graph was accomplished through Cytoscape (https://cytoscape.org/). Furthermore, the STRING
platform (https://string-db.org/) was used to
uncover putative physicochemical protein-protein interactions among
the molecules of interest (combined score >0.4) (57).
Statistical analysis
All experiments were conducted at least in
triplicates (3x) and the statistical significance was assessed by
using GraphPad Prism 8.0.2 for Windows (GraphPad Software;
Dotmatics) or R programming language [version 3.2.2, R Core Team
(2021). R: A language and environment for statistical computing. R
Foundation for Statistical Computing (https://www.R-project.org/)]. All data are expressed
as the mean ± SD and were analyzed by Kruskal-Wallis test, paired
t-test (to assess if the differences between paired values are
consistent) and repeated ANOVA measurements. P<0.05 was
considered to indicate a statistically significant difference.
Results
Part I. Studies with K-562 and
IM-resistant K-562R chronic myeloid leukemia cells
IM and DCA inhibit cell proliferation
and promote cell death in both IM-sensitive K-562 and resistant
K-562R cell lines
Preliminary experiments using K-562 and K-562R
cultured cells were carried out to: i) Determine independently,
after a 72-h incubation, the IC50 values for IM and DCA
by applying increasing concentrations that ranged from μM to
mM, respectively; ii) assess the proliferation behavior and
kinetics of each cell line under treatment; and iii) determine the
proportion of dead cells accumulated in each treated culture. These
experiments revealed that the IC50 for IM was 0.3
μM for the K-562 cells and 6 μM (20-fold higher) for
K-562R cells, while the IC50 value for DCA was
calculated at 4 mM for both K-562 and K-562R cells (Fig. S3i-iv; Table SII). With respect to cell
proliferation, treatment with 1-2 μM IM markedly reduced
cell proliferation (~95%) in K-562 cells, but to a markedly less
extent in IM-resistant K-562R cells, as expected (Fig. 2A and B). DCA added at 4 mM caused
the same degree of proliferation inhibition in both cell types.
Co-treatment of IM with DCA also markedly reduced cell
proliferation by ~95% in the K-562 cells, but considerably less
(~50%) in the K-562R cells (Fig. 2A
and B). Regarding the ability of these agents to promote cell
death, IM alone induced >60% cell death in K-562 cells (Fig. 2C), but <20% in K-562R cells
(Fig. 2D). DCA, on the other
hand, when applied at 4 mM generated elimination in ~40% of K-562
cells (Fig. 2C) and in <20% of
IM-resistant K-562R cells (Fig.
2D). Co-exposure to IM/DCA induced cell death to >75% of
K-562 cells (Fig. 2C), but to
<30% of the K-562R cells (Fig.
2D). These data taken together indicated that treatment with
both agents is considerably potent as it significantly reduced cell
proliferation and induced cell death.
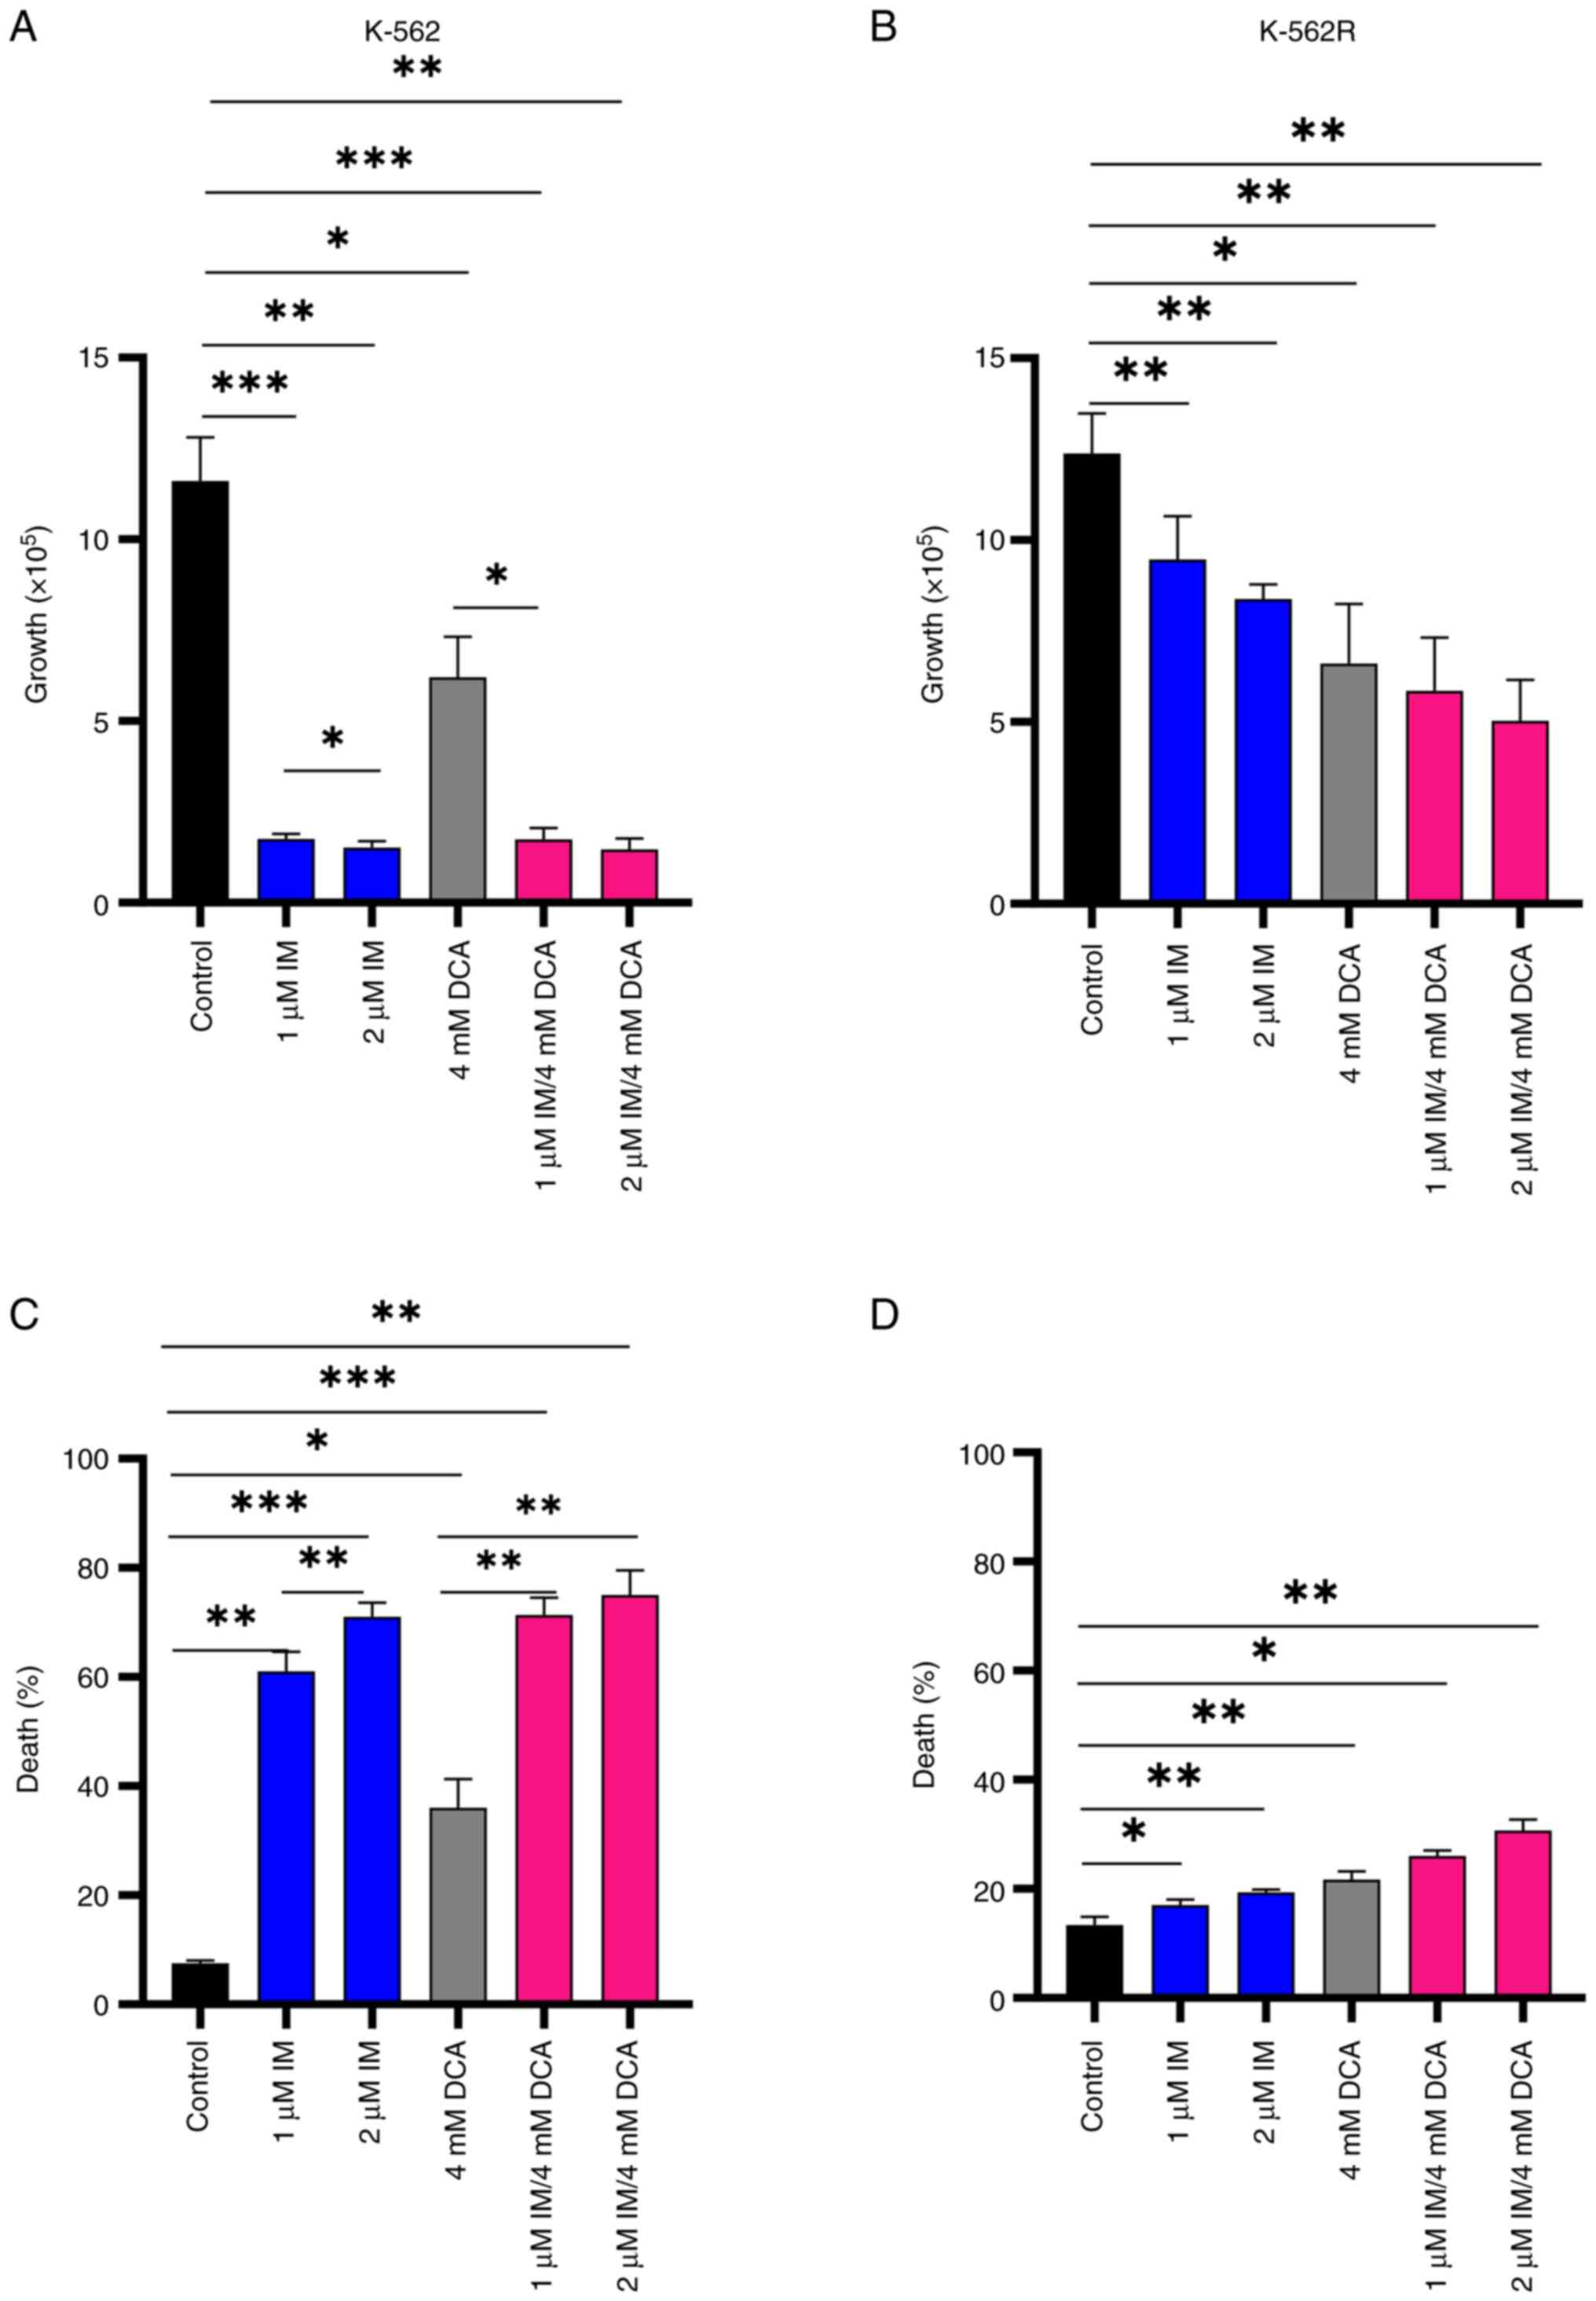 | Figure 2Cell proliferation and death in IM-,
DCA- or IM/DCA-treated K-562 and K-562R cell cultures. Cells were
seeded at 1×10⁵ cells/ml and left untreated or were
treated with 1 or 2 μM IM (blue bars), 4 mM DCA (gray bars),
or both IM/DCA (pink bars) for 72 h. (A and B) Cell proliferation
and (C and D) death were measured in each culture as described in
the materials and methods section. Each bar represents the mean
value of at least a triplicate of experiments. (A) K-562
proliferation: Control-1 μM IM, P=0.0006; control-2
μM, IM P=0.0043; control-DCA, P=0.0340; control-1 μM
IM/DCA, P=0.0006; control-2 μM IM/DCA, P=0.0045; 1 μM
IM-2 μM IM, P=0.0397; 1 μM IM/DCA-DCA, P=0.0146. (B)
K-562R proliferation: Control-1 μM IM, P=0.0089; control-2
μM IM, P=0.0047; control-DCA, P=0.0160; control-1 μM
IM/DCA, P=0.0071; control-2 μM IM/DCA, P=0.0032. (C) K-562
death: Control-1 μM IM, P=0.0018; control-2 μM IM,
P=0.0008; control-DCA, P=0.0134; control-1 μM IM/DCA,
P=0.0009; control-2 μM IM/DCA, P=0.0018; 1 μM IM-2
μM IM, P=0.0099; 1 μM IM/DCA-DCA, P= 0.0059; 2
μM IM/DCA-DCA, P= 0.0015). (D) K-562R death: Control-1
μM IM, P= 0.0315; control-2 μM IM, P= 0.0091;
control-DCA, P=0.0016; control-1 μM IM/DCA, P=0.0129;
control-2 μM IM/DCA, P=0.0134. *P≤0.05,
**P≤0.01 and ***P≤0.001. IM, imatinib; DCA,
dichloroacetate. |
IM and DCA disturb OxPhos mediators
SCO2 and FXN in opposing fashion depending on IM-resistance
A previous study by the authors (24) in which IM downregulates the
expression of SCO2 and FXN genes that represent
biomarkers of OxPhos, prompted the authors to investigate whether,
and to what extent, DCA alone or with IM can influence the
expression of these two genes. The present study revealed that IM,
either alone or with DCA, significantly suppressed the levels of
both SCO2 and FXN proteins, by >85-90%, while DCA alone had no
effect in suppressing the levels of both proteins in K-562 cells
(Fig. 3A and B). In the K-562R
cells, however, DCA was found to prime higher levels of SCO2 and
FXN expression by up to 4-fold as compared with K-562 cells,
presumably due to chemoresistance to IM. Finally, in the K-562R
cells, the combination of IM with DCA (IM/DCA) led to considerable
increases of SCO2 and FXN protein levels by 4 to 6-fold. In
conclusion, these findings confirmed that when added together,
IM/DCA, maintained the expression levels of OxPhos markers SCO2 and
FXN in K-562 cells, but this effect was diminished in the K-562R
cells as both were strongly upregulated.
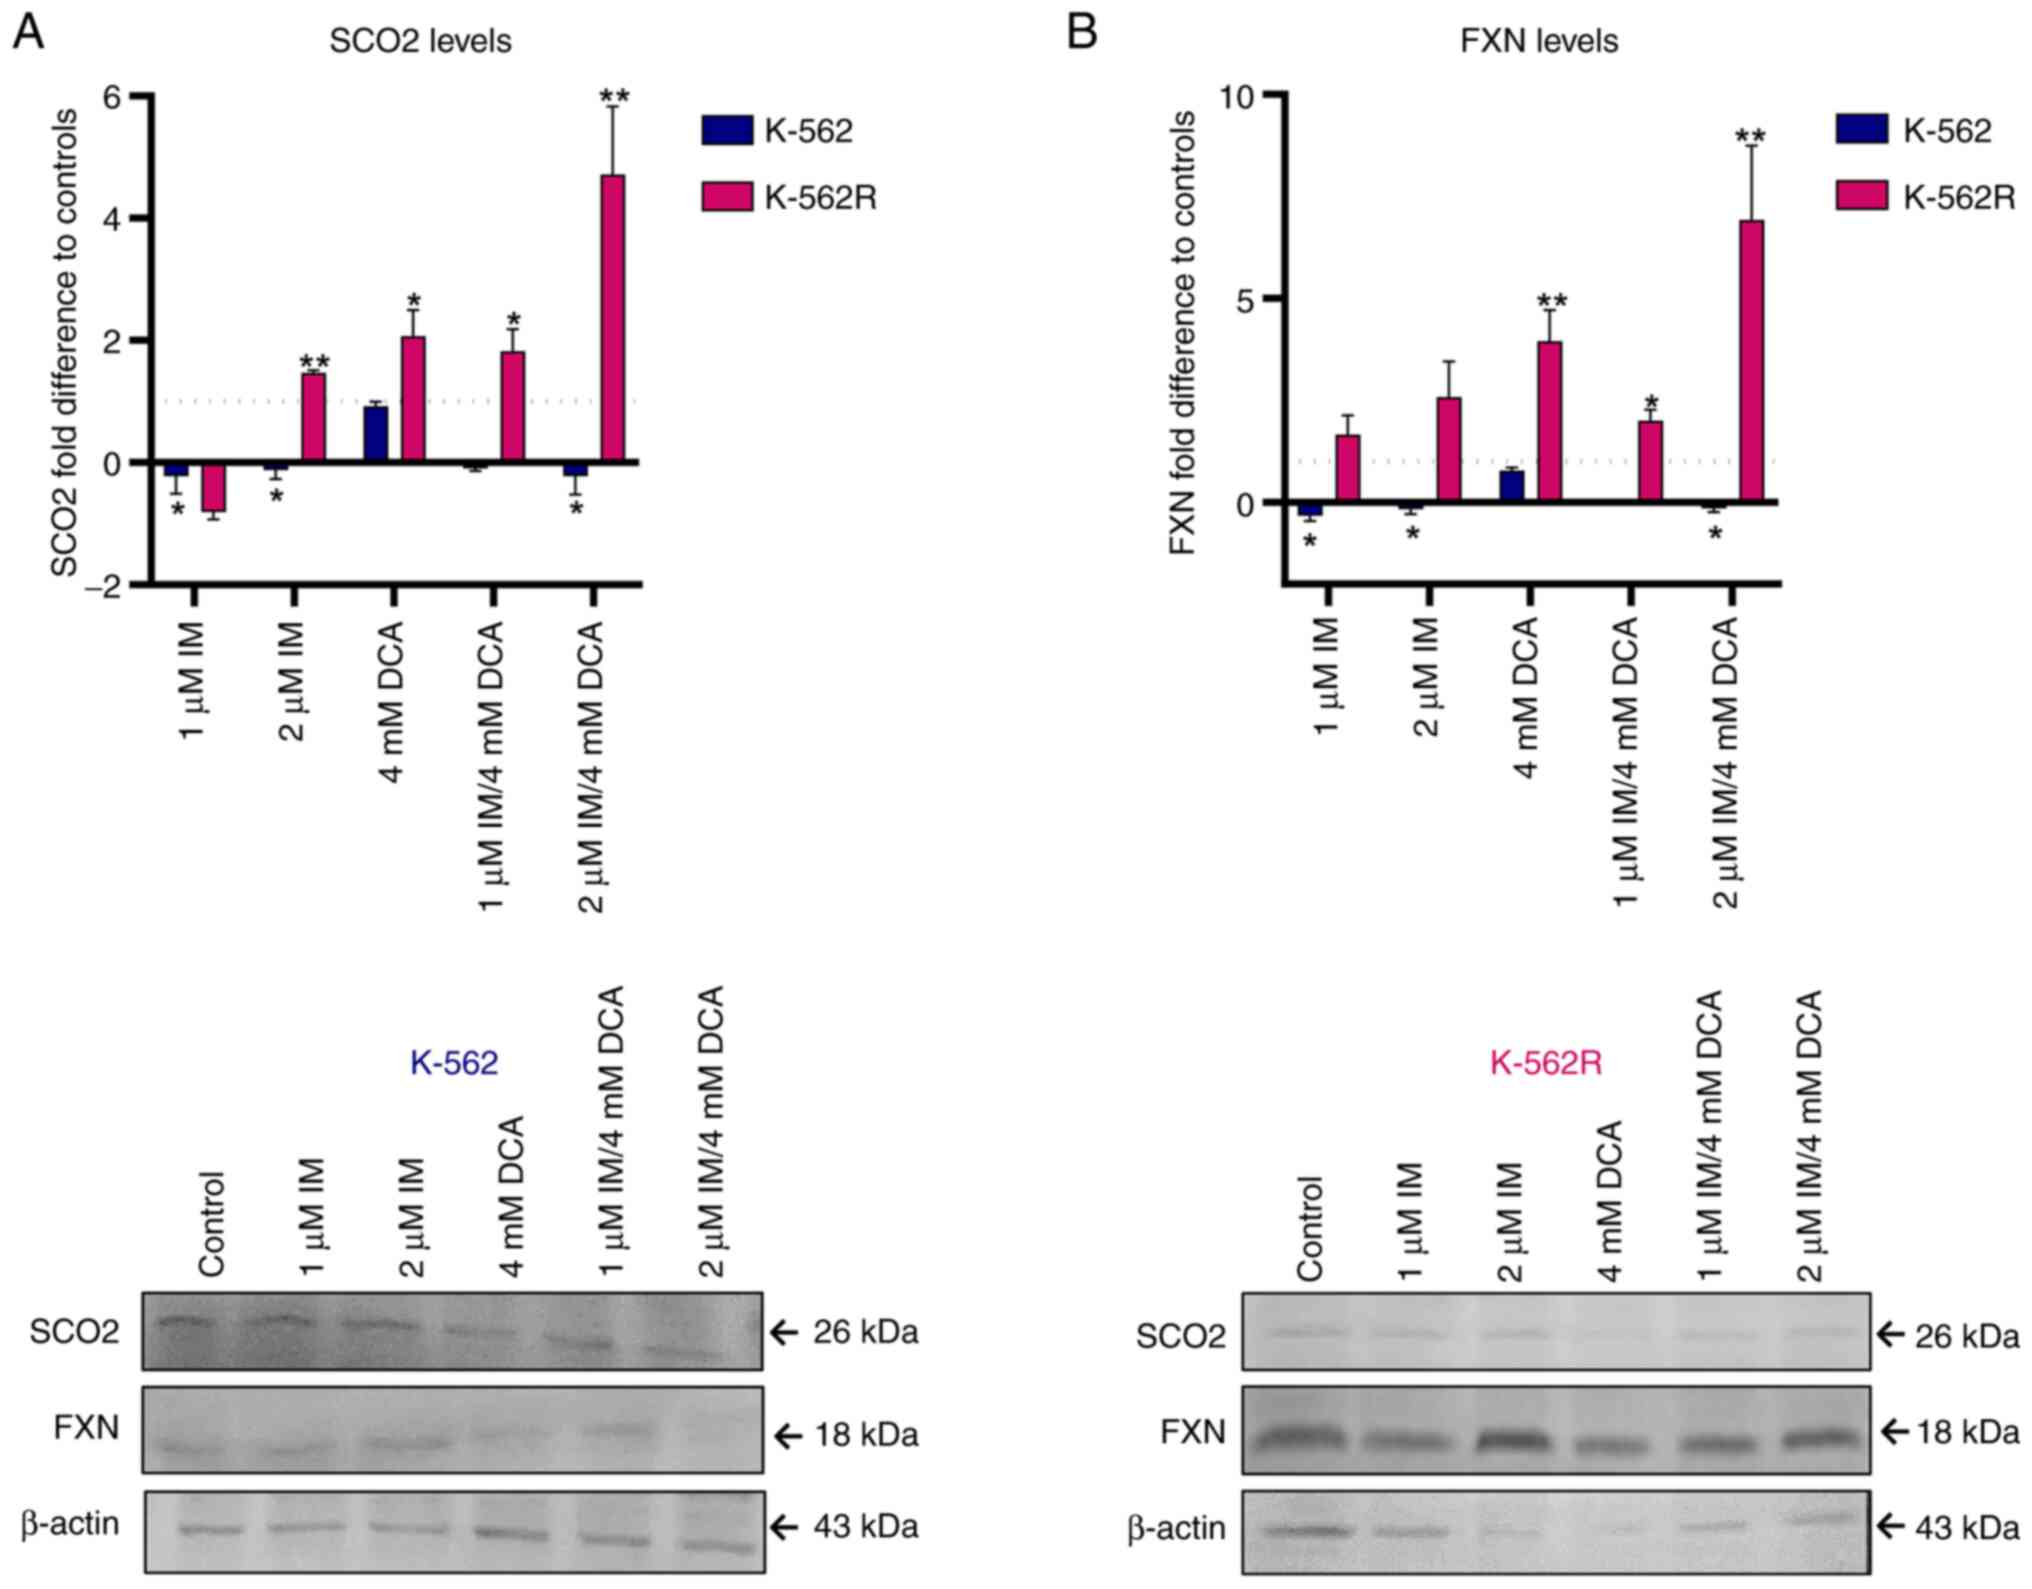 | Figure 3Exploration of the effects of IM, DCA
or both on the synthesis of SCO2 and FXN in K-562 and K-562R cells
by WB analysis and band densitometry. Cells in each culture were
seeded at 2-4×10⁵ cells/ml and treated with IM, DCA or
both agents for 72 h. Mitochondrial protein lysates from control
(untreated) and drug-treated K-562 (blue bars) and K-562R (pink
bars) cells were analyzed by WB analysis using 30 μg of
total lysate per lane and antibodies against the human SCO2 and FXN
proteins. β-actin was used as internal marker. The quantification
was based on band densitometry and normalization between the
proteins of interest and the house keeper marker assessed. The
levels shown represent mean values from at least triplicate
biological experiments. (A) SCO2: (K-562: Control-1 μM IM,
P=0.0393; control-2 μM IM, P=0.0165; control-1 μM
IM/DCA, P=0.0057; control-2 μM IM/DCA, P=0.0418); (K-562R:
Control-2 μM IM, P=0.0017; control-DCA, P=0.0306; control-1
μM IM/DCA, P=0.0400; control-2 μM IM/DCA, P=0.0094).
(B) FXN: (K-562: Control-1 μM IM, P=0.0280; control-2
μM IM, P=0.0201; control-1 μM IM/DCA, P=0.0055;
control-2 μM IM/DCA, P=0.0210); (K-562R: Control-DCA,
P=0.0060; control-1 μM IM/DCA, P=0.0136; control-2 μM
IM/DCA, P=0.0055). *P≤0.05 and **P≤0.01. IM,
imatinib; DCA, dichloroacetate; SCO2, synthesis of cytochrome c
oxidase 2; FXN, frataxin; WB, western blot. |
IM and DCA affect the levels of the
glycolytic biomarkers GAPDH, PKM2 and LDHA, but to a different
extent in the K-562 and K-562R leukemia cells
As demonstrated in Fig. 1, GAPDH, PKM2 and LDHA are three
functionally important protein biomarkers that are highly involved
in the glycolysis of cancer cells leading to the production of
lactate. As revealed in Fig. 4A-C
in the K-562 cells, IM alone or with DCA (IM/DCA) increased the
protein levels of LDHA and GAPDH by 2 to 4-fold, with marginal
effects on the levels of PKM2. In K-562R cells, however, when IM
was added at 2 μM, alone or in combination with DCA, led to
narrower increases of LDHA and GAPDH levels compared with K-562
cells. When IM was combined with DCA (IM/DCA), at 2 μM and 4
mM respectively, led to a moderate increase of PKM2 in K-562, but
to a greater increase in the K-562R. The different degrees of
inhibition of glycolytic markers observed between K-562 and K-562R
may be attributed to chemoresistance factors.
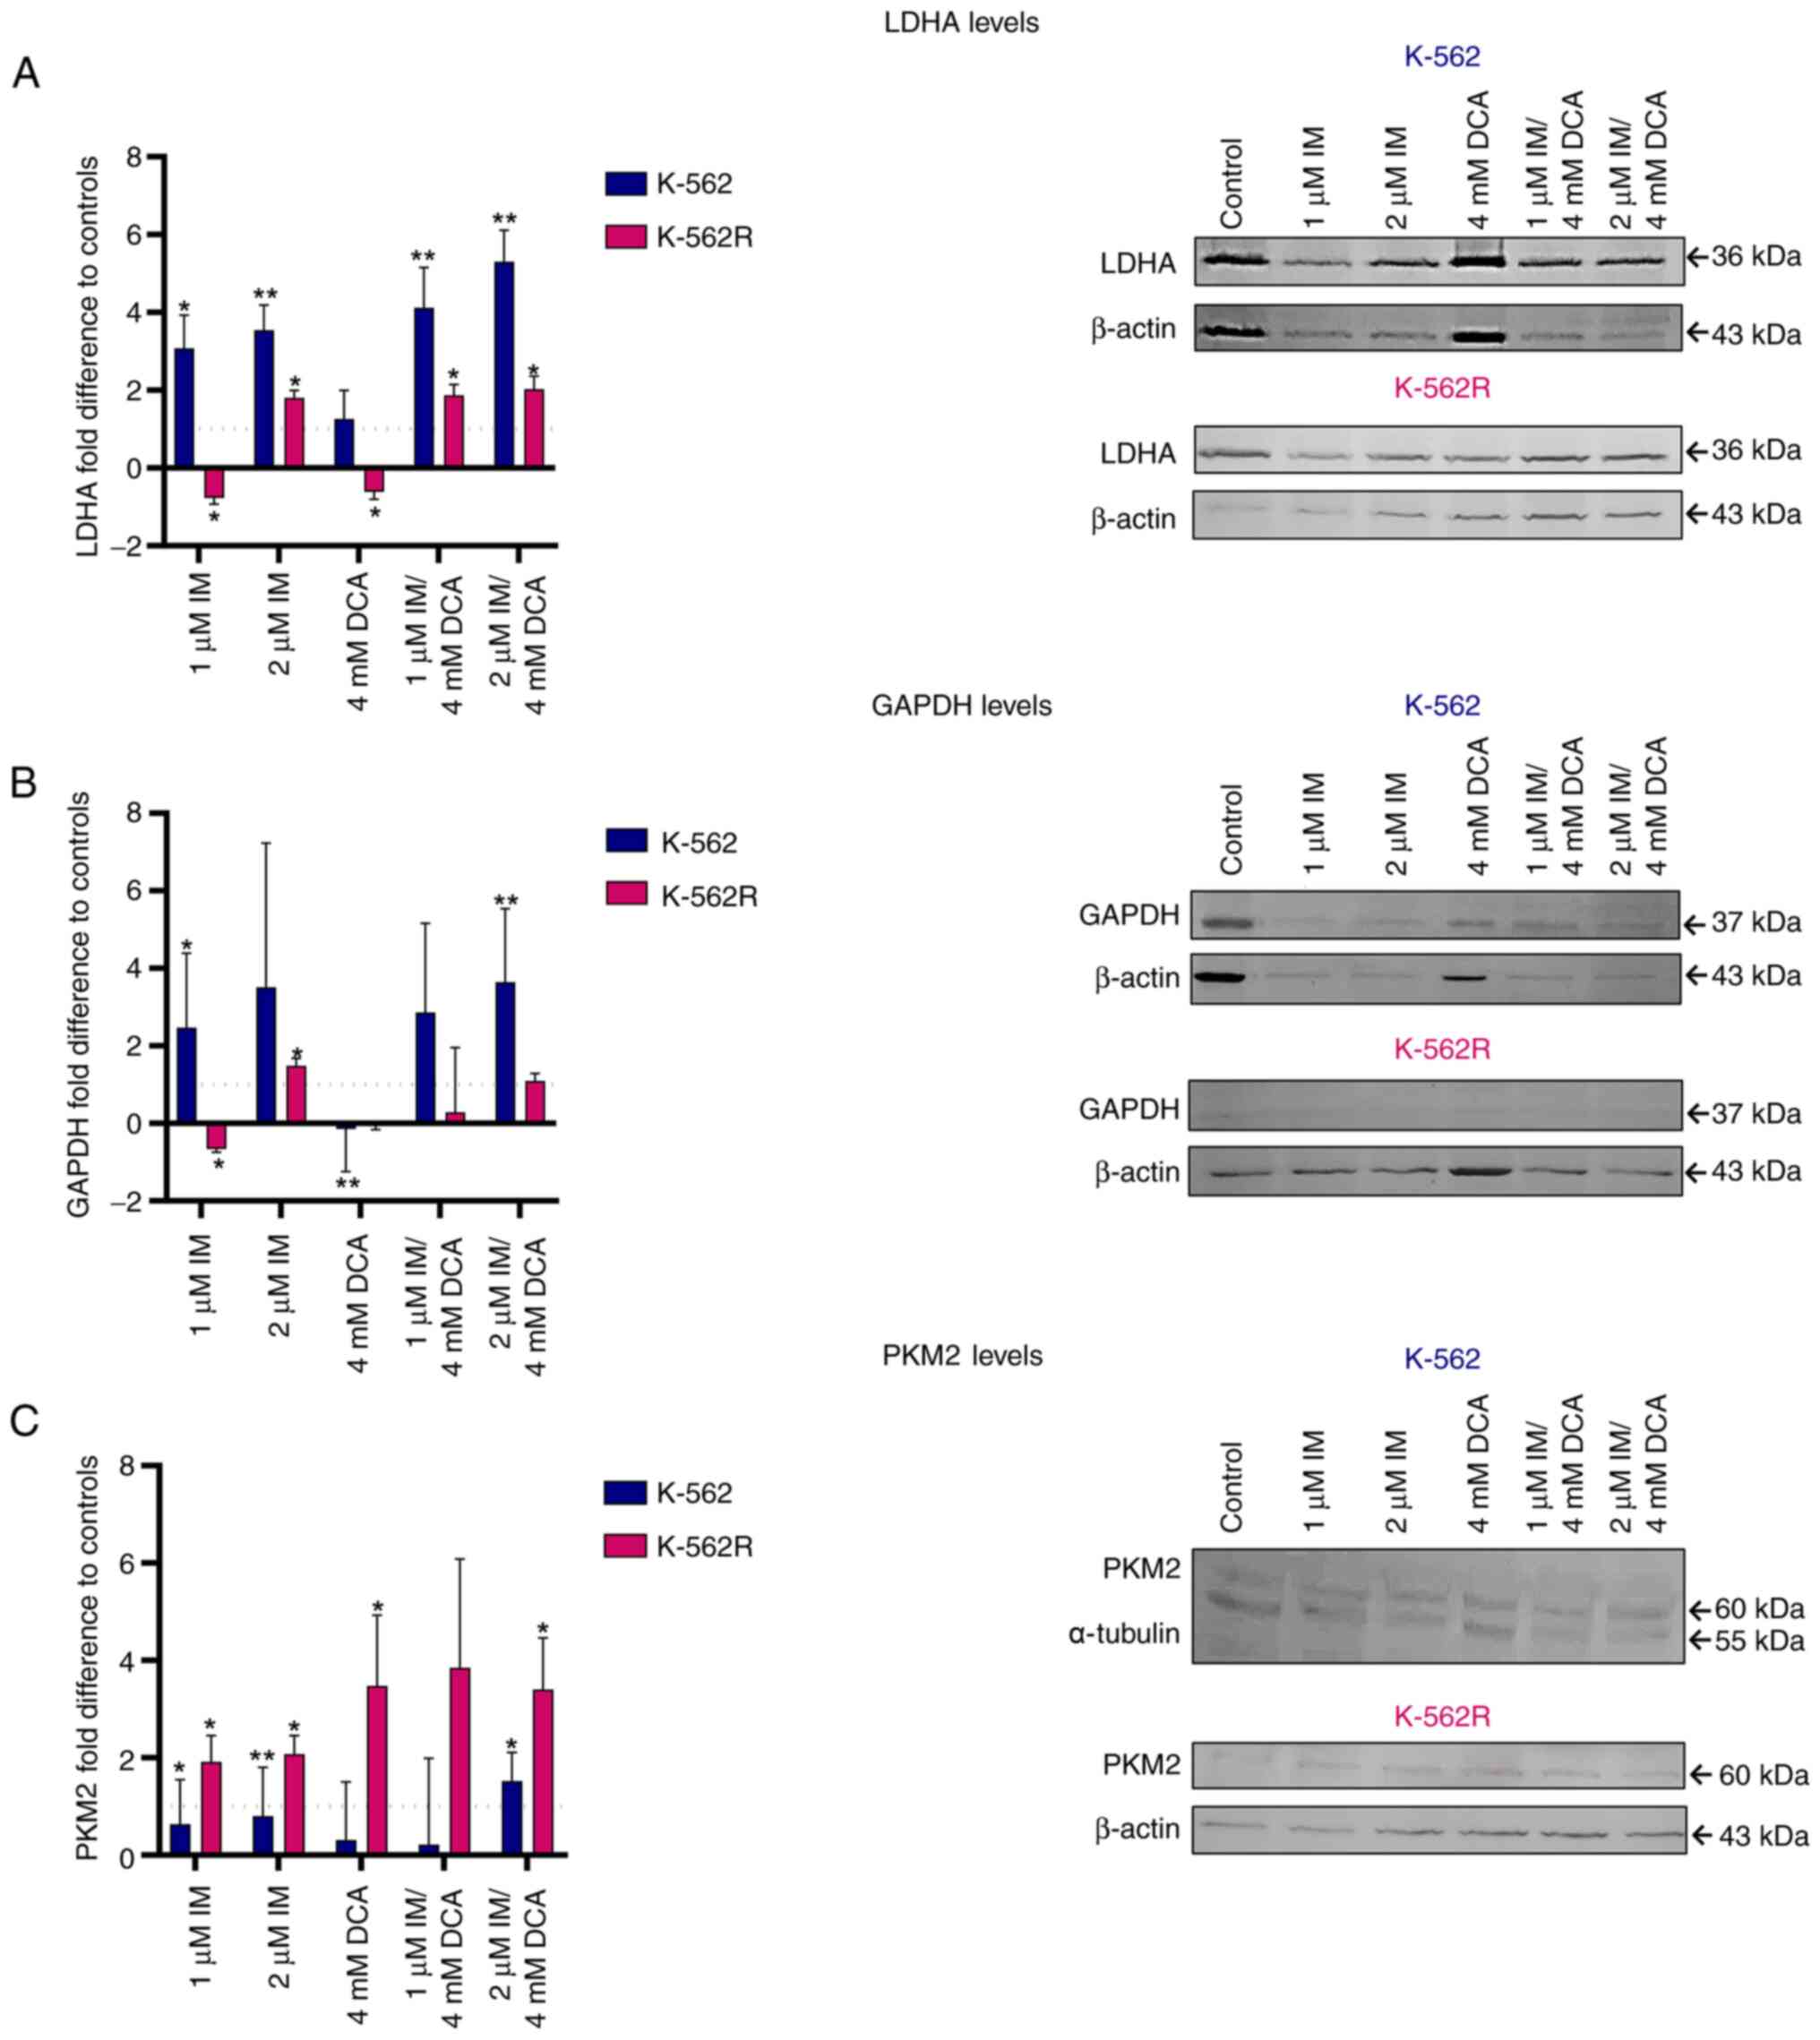 | Figure 4Assessment of the effects of IM, DCA
or both on the synthesis of LDHA, GAPDH and PKM2 in K-562 and
K-562R cells by WB analysis and band densitometry. Cells in each
culture were seeded at 2-4×10⁵ cells/ml and treated with
IM, DCA or both agents for 72 h. Control (untreated) and
drug-treated K-562 (blue bars) and K-562R (pink bars) cells were
assessed by WB analysis using 30 μg of total lysate per lane
and antibodies against the human LDHA, GAPDH and PKM2 proteins.
β-actin and α-tubulin were used as internal markers. The
quantification was based on band densitometry and normalization
between the proteins of interest and the house keeper marker
assessed. The levels shown represent mean values from at least
triplicate biological experiments. (A) LDHA: (K-562: Control-1
μM IM, P=0.0195; control-2 μM IM, P=0.0074; control-1
μM IM/DCA, P=0.0121; control-2 μM IM/DCA, P=0.0027);
(K-562R: Control-1 μM IM, P=0.0195; control-2 μM IM,
P=0.0361; control-DCA, P=0.0102; control-1 μM IM/DCA,
P=0.0171; control-2 μM IM/DCA, P=0.0186). (B) GAPDH: (K-562:
Control-1 μM IM, P=0.0170; control-2 μM IM/DCA,
P=0.0049); (K-562R: Control-1 μM IM, P=0.0170; control-2
μM IM, P=0.0218; control-DCA, P=0.0095). (C) PKM2: (K-562:
Control-1 μM IM, P=0.0282; control-2 μM IM, P=0.0092;
control-2 μM IM/DCA, P=0.0433); (K-562R: Control-1 μM
IM, P=0.0134; control-2 μM IM, P=0.0199; control-DCA,
P=0.0186; control-2 μM IM/DCA, P=0.0197)].
*P≤0.05 and **P≤0.01. IM, imatinib; DCA,
dichloroacetate; LDHA, lactate dehydrogenase A; GAPDH,
glyceraldehyde-3-phosphate dehydrogenase; PKM2, pyruvate kinase M2;
WB, western blot. |
Effects of IM and DCA on the levels of
hypoxic and oxidative stress response factors HIF-1a, NF-κB, SCF
and vascular endothelial growth factor (VEGF)
As it is known that the majority of tumor cells are
relatively hypoxic and undergo an oxidative stress response, the
K-562 and K-562R IM/DCA treated cultures were assessed for the
protein levels of transcription factors HIF-1a and NF-κB, as well
as for SCF and VEGF. The results are revealed in Fig. 5A-D. In K-562 cells, IM increased
HIF-1a protein levels by 5 to 10-fold. When both agents were used
(IM/DCA), they increased the level of HIF-1a by ~5-fold (Fig. 5A) in K-562 cells. When K-562R were
treated with IM alone or in combination with DCA (IM/DCA), similar,
but smaller (~2-fold) increases of HIF-1a were observed. DCA alone
increased HIF-1a by ~3-fold only in the K-562 cells. Concerning
NF-κB, IM alone, as well as in combination with DCA, exerted a very
mild decrease in K-562 protein levels (Fig. 5B). When the SCF protein levels
were examined in K-562 cells, IM alone or in combination with DCA
(IM/DCA), led to an increase of 2 to 4-fold (Fig. 5C). For the case of VEGF, IM and in
combination with DCA (IM/DCA) increased its protein levels in the
K-562 cells by 50 to 200-fold, while in the K-562R cells less than
2-fold. In conclusion, less extensive responses were recorded for
the three factors (HIF-1a, SCF and VEGF) in the K-562R treated
cells, as demonstrated in Fig. 5A, C
and D, respectively.
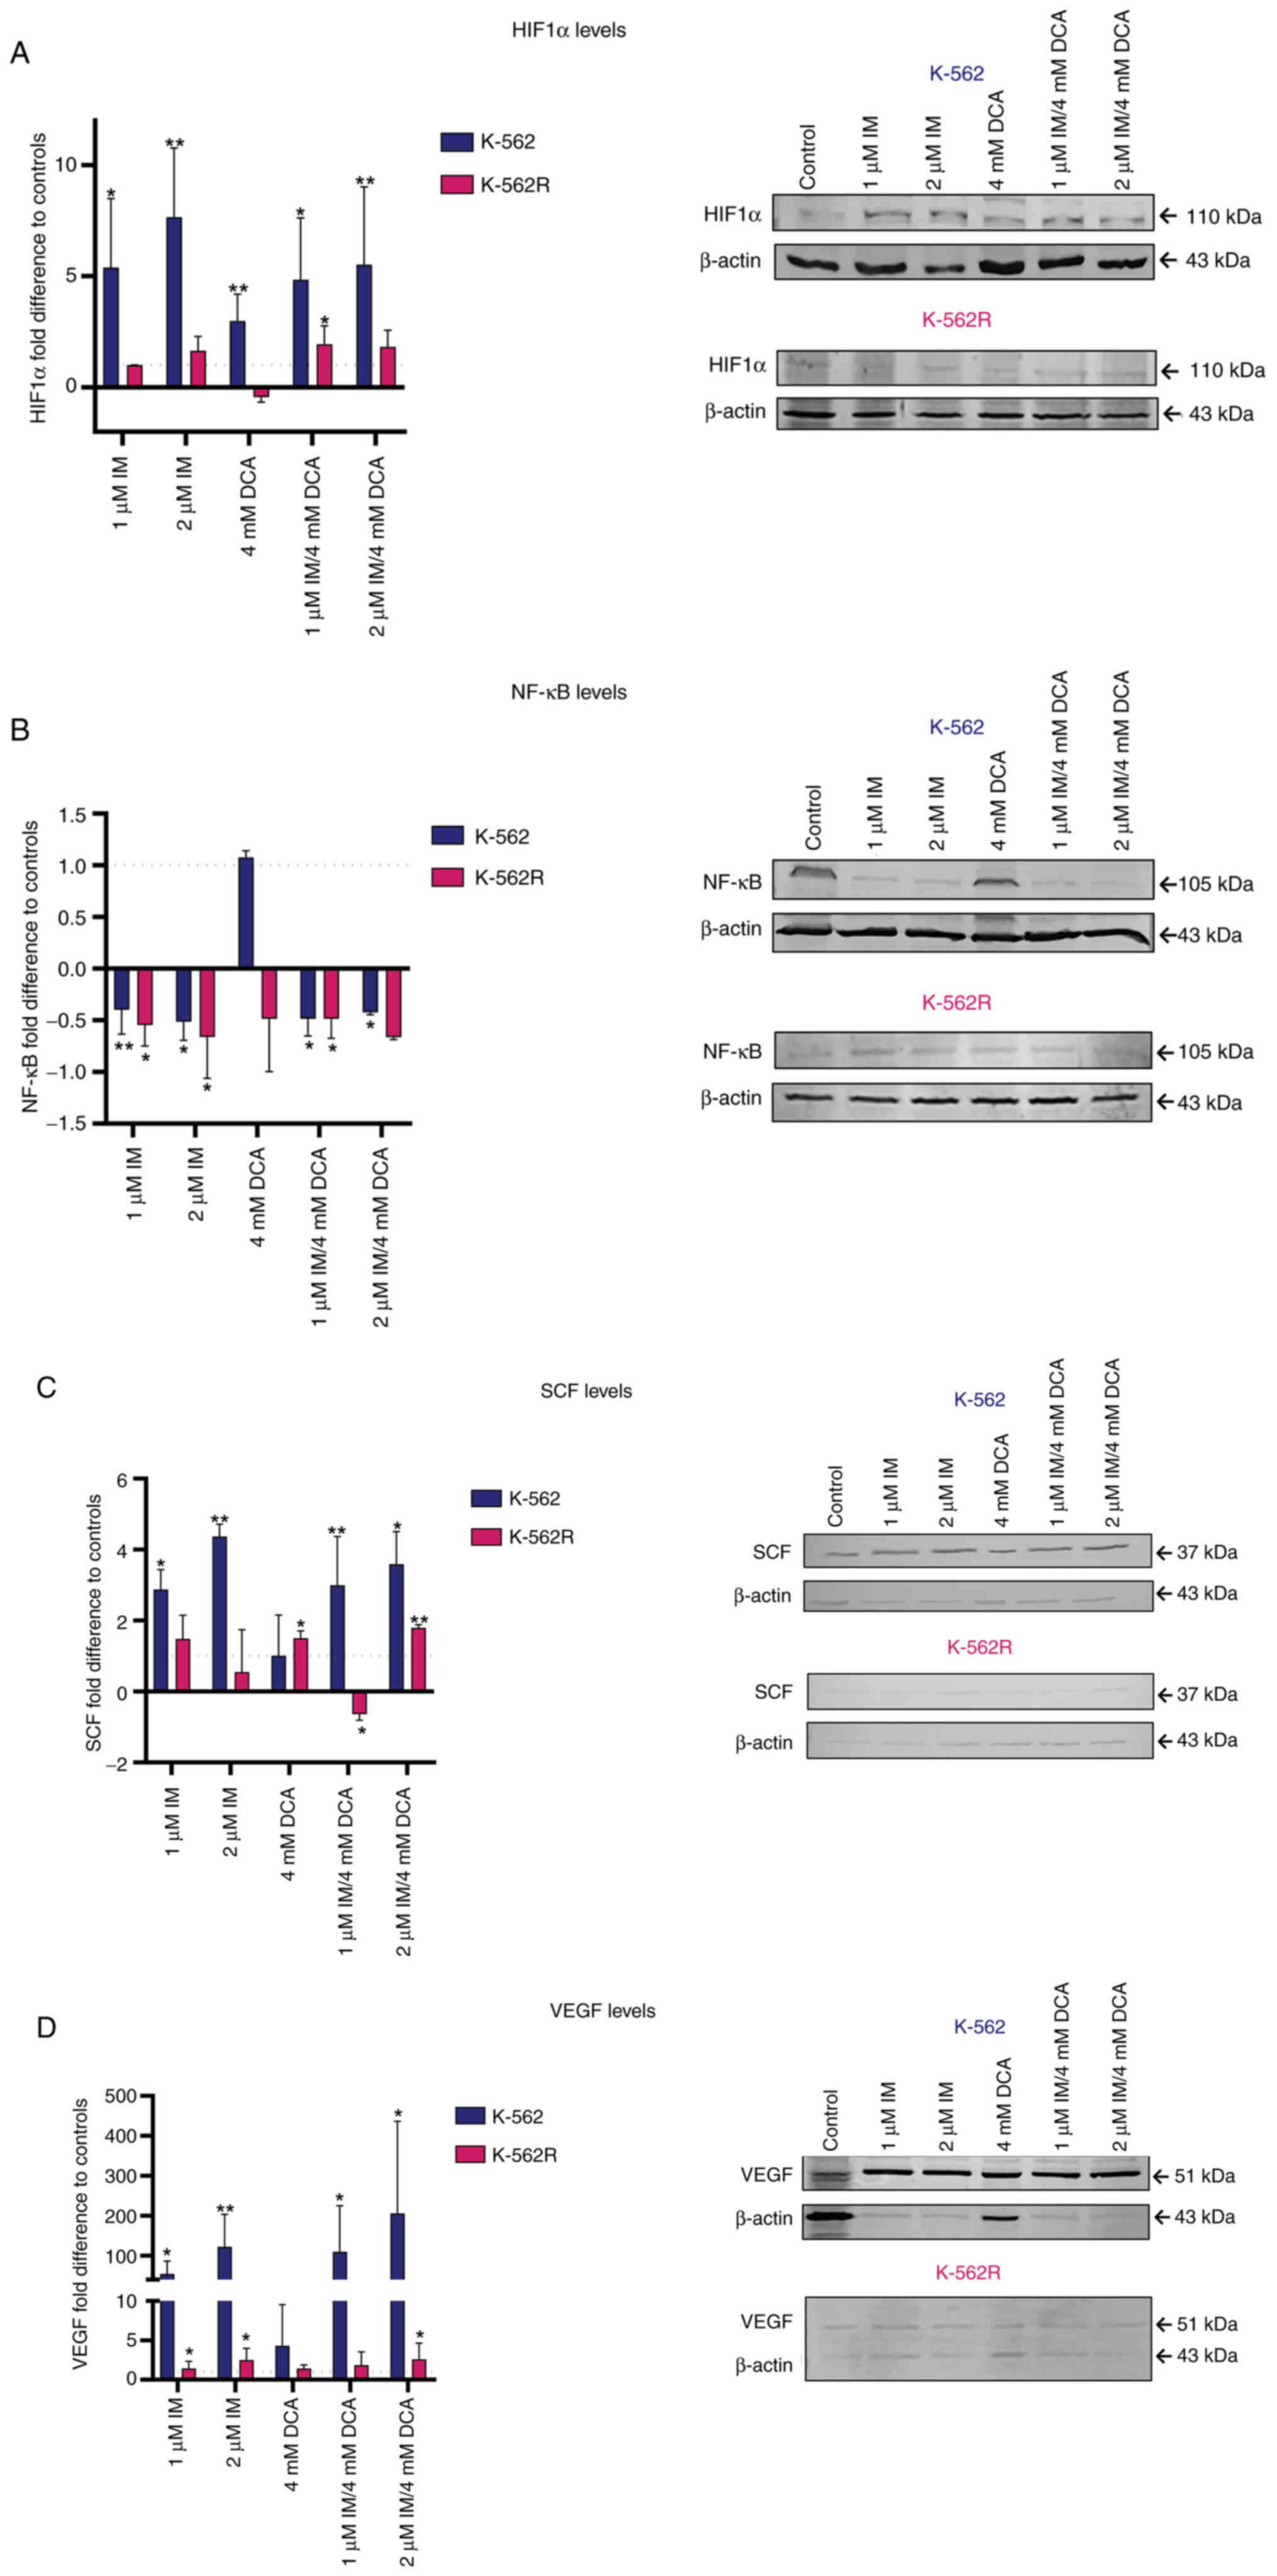 | Figure 5Illustration of the effects of IM,
DCA or both on the synthesis of HIF1a, NF-κB, SCF and VEGF in K-562
and K-562R cells by WB analysis and band densitometry. Cells in
each culture were seeded at 2-4×10⁵ cells/ml and treated
with IM, DCA or both agents for 72 h. Control (untreated) and
drug-treated K-562 (blue bars) and K-562R (pink bars) cells were
assessed by WB analysis using 30 μg of total lysate per lane
and antibodies against the human HIF1a, NF-κB, SCF and VEGF
proteins. β-actin was used as internal marker. The quantification
was based on band densitometry and normalization between the
proteins of interest and the house keeper marker assessed. The
levels shown represent mean values from at least triplicate
biological experiments. (A) HIF1a: (K-562: Control-1 μM IM,
P=0.0113; control-2 μM IM, P=0.0089; control-1 μM
IM/DCA, P=0.0150; control-2 μM IM/DCA, P=0.0098); (K-562R:
Control-1 μM IM/DCA, P=0.00372). (B) NF-κB: (K-562:
Control-1 μM IM, P=0.019; control-2 μM IM, P=0.0429;
control-1 μM IM/DCA, P=0.0170); (K-562R: Control-1 μM
IM, P=0.0113; control-2 μM IM, P=0.0089; control-1 μM
IM/DCA, P=0.0150; control-2 μM IM/DCA, P=0.0098). (C) SCF:
(K-562: Control-1 μM IM, P=0.0308; control-2 μM IM,
P=0.0010; control-1 μM IM/DCA, P=0.0032; control-1 μM
IM/DCA, P=0.0253; control-2 μM IM/DCA, P=0.0018); (K-562R:
Control-DCA, P=0.00345; control-2 μM IM/DCA, P=0.0098). (D)
VEGF: (K-562: Control-1 μM, IM P=0.0118; control-2 μM
IM, P=0.0056; control-1μM IM/DCA, P=0.0226; control-2
μM IM/DCA, P=0.0395); (K-562R: Control-1 μM IM,
P=0.0134; control-2 μM IM, P=0.0016; Control-2 μM
IM/DCA, P=0.0496). *P≤0.05 and **P≤0.01. IM,
imatinib; DCA, dichloroacetate; HIF-1a, hypoxia inducing factor-1a;
NF-κB, nuclear factor kappa-light-chain-enhancer of activated B
cells; SCF, stem cell factor; VEGF, vascular endothelial growth
factor; WB, western blot. |
IM suppresses the levels of ROS in
K-562 and K-562R cells, while DCA only in the non-resistant
cells
In order to detect and subsequently measure the
total content of ROS in K-562 and K-562R cells, it was explored
whether these cells contain detectable ROS and subsequently it was
examined whether IM, DCA or both agents affect their accumulation.
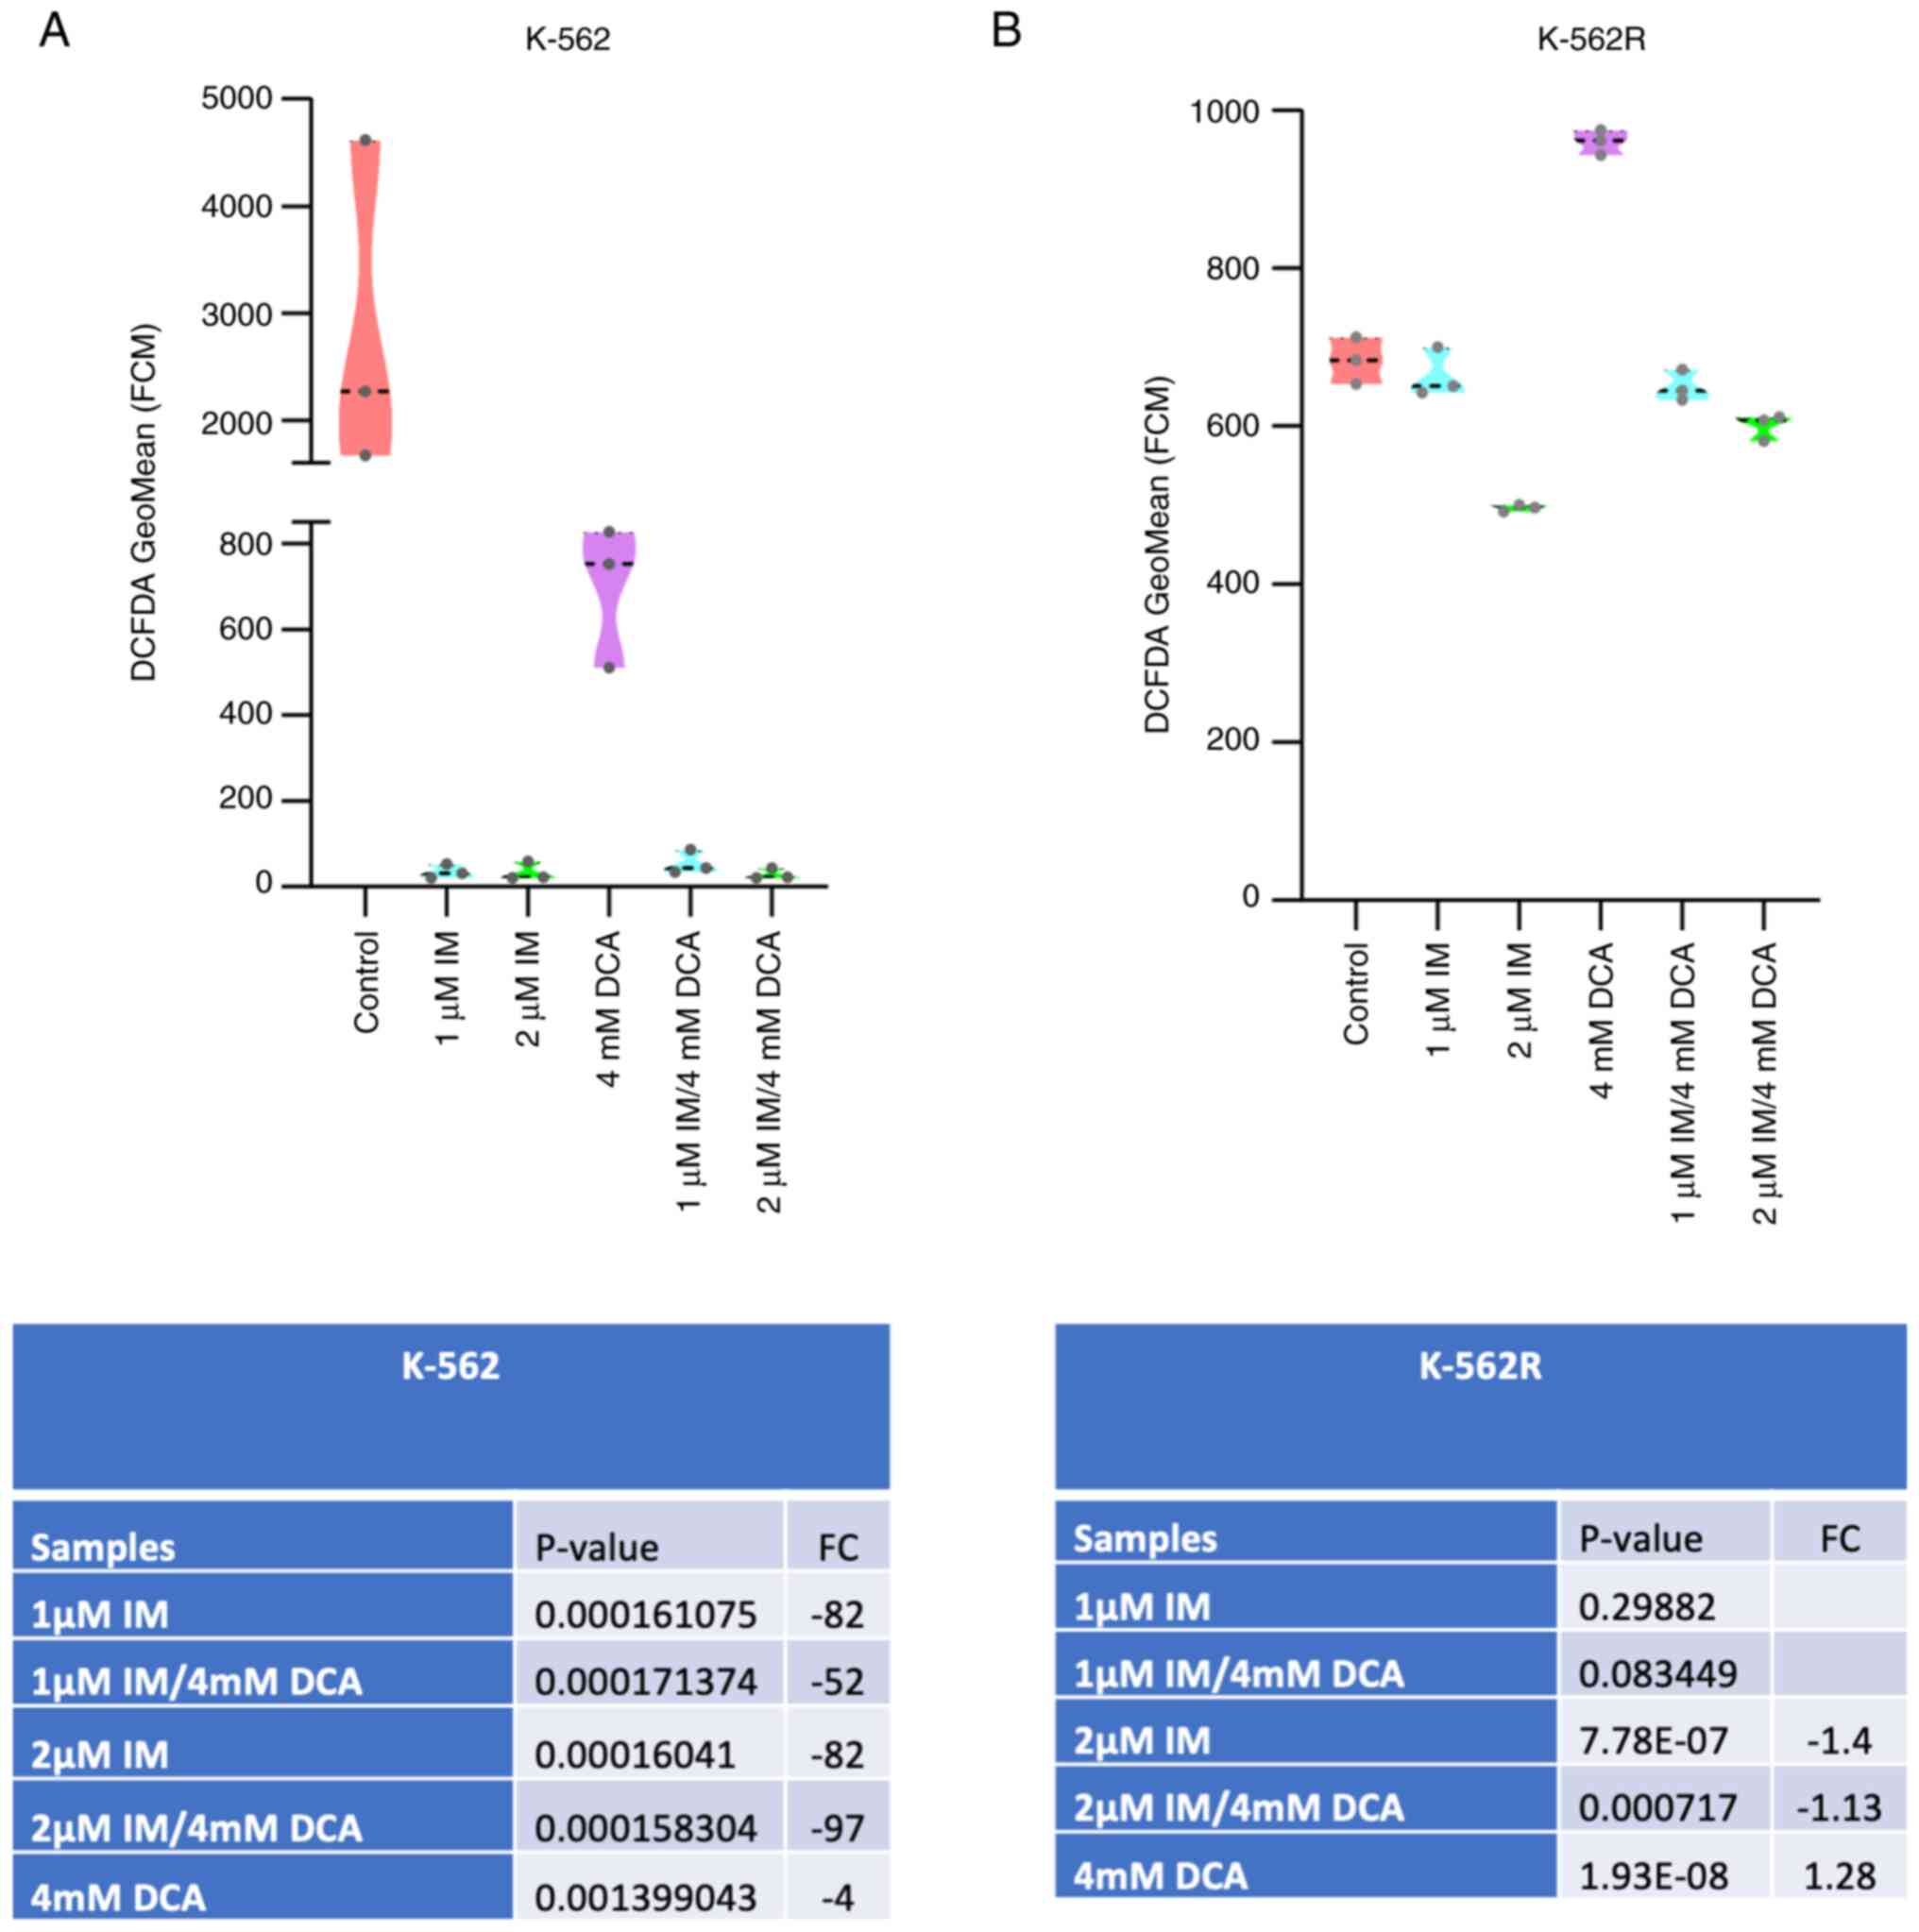
Flow cytometric analysis using DCFDA as fluorescent probe was
carried out. The results revealed that resting K-562 cells
contained a relatively high level of ROS as revealed in Fig. 6A and that treatment with IM, or IM
with DCA suppressed the levels of ROS to almost zero. In the K-562R
cells however, which contained comparatively less ROS compared with
the IM-sensitive K-562 cells, IM and the combination with DCA
suppressed ROS to a small extent and not in the same levels with
the K-562 cells (Figs. 6A and B;
S6A and B). Notably, it was
observed that treatment of the K-562R cells with DCA led to an
increase of ROS, while treatment of the K-562 cells with DCA
lowered, but did not flatten the levels of ROS (Figs. 6A and B; S6A and B). These data indicated that
the K-562 and K-562R cell states are metabolically differentially
tuned with higher levels of ROS in the K-562 cells. Challenging of
glycolysis in the K-562R cells with DCA appears to promote an
increase of ROS, probably as OxPhos is primed.
Part II. Studies with solid tumor
HCT-116 (+/+p53) and HCT-116 (−/−p53) colorectal carcinoma
cells
In the second part of the experiments, experiments
regarding colorectal carcinoma HCT-116 (+/+p53) and HCT-116
(−/−p53) cells were conducted. Prior to starting the present
comparative assessments, it was considered critical to confirm by
PCR that the HCT-116 (−/−p53) cells, which contain the disrupted
TP53 gene (51,58), are unable to produce the full
length p53 transcription factor that regulates several genes,
including SCO2. The presence of full length p53 protein in
cells is critical for the production of SCO2 protein, necessary for
the COX assembly and thus the overall functional performance of
OxPhos. In addition, p53 and p21 proteins are also required to
sustain growth arrest (51).
After confirming that targeting of exon 2 of the TP53 gene
leads to lack of a full length mature and functional p53 protein
acting as a transcriptional activator for the SCO2 and
FXN genes, as illustrated in Fig. S1, in vitro cell
pharmacological studies with the two adherent HCT-116 colorectal
carcinoma cell lines were carried out (Fig. S2). The doubling time of these
cells were estimated to be 28 h for HCT-116 (+/+p53) cells,
compared with 24 h for the HCT-116 (−/−p53) cells.
IM, DCA and their combination inhibit
cell proliferation and promote cell death in the HCT-116 (+/+p53)
and HCT-116 (−/−p53) cells
Preliminary experiments using HCT-116 (+/+p53) and
HCT-116 (−/−p53) cultured cells were carried out to: i) Determine
independently, after a 72-h incubation, the IC50 values
for IM and DCA by applying increasing concentrations that ranged
from μM to mM, respectively (Fig. S4i-iv; Table SII); ii) assess the proliferation
behavior and kinetics of each cell line under treatment; and iii)
determine the proportion of dead cells accumulated in each treated
culture. The effects on cell proliferation and death by treating
both HCT-116 cell lines with IM, DCA or IM/DCA are demonstrated in
Fig. 7A-D. While IM or DCA caused
moderate inhibition of cell proliferation, IM/DCA decreased cell
proliferation by >50-60% in either cell line (Fig. 7A and B). Cell death in both
HCT-116 cell lines increased after treatment with either agent
alone, and nearly doubled by the combination of IM and DCA
(Fig. 7C and D). This data
indicated that all treatments inhibited cell proliferation, while
cell death for both cell lines was significantly increased by the
co-treatment with IM and DCA, regardless of any marginal
differences observed between the two cell types (+/+p53) vs.
(−/−p53).
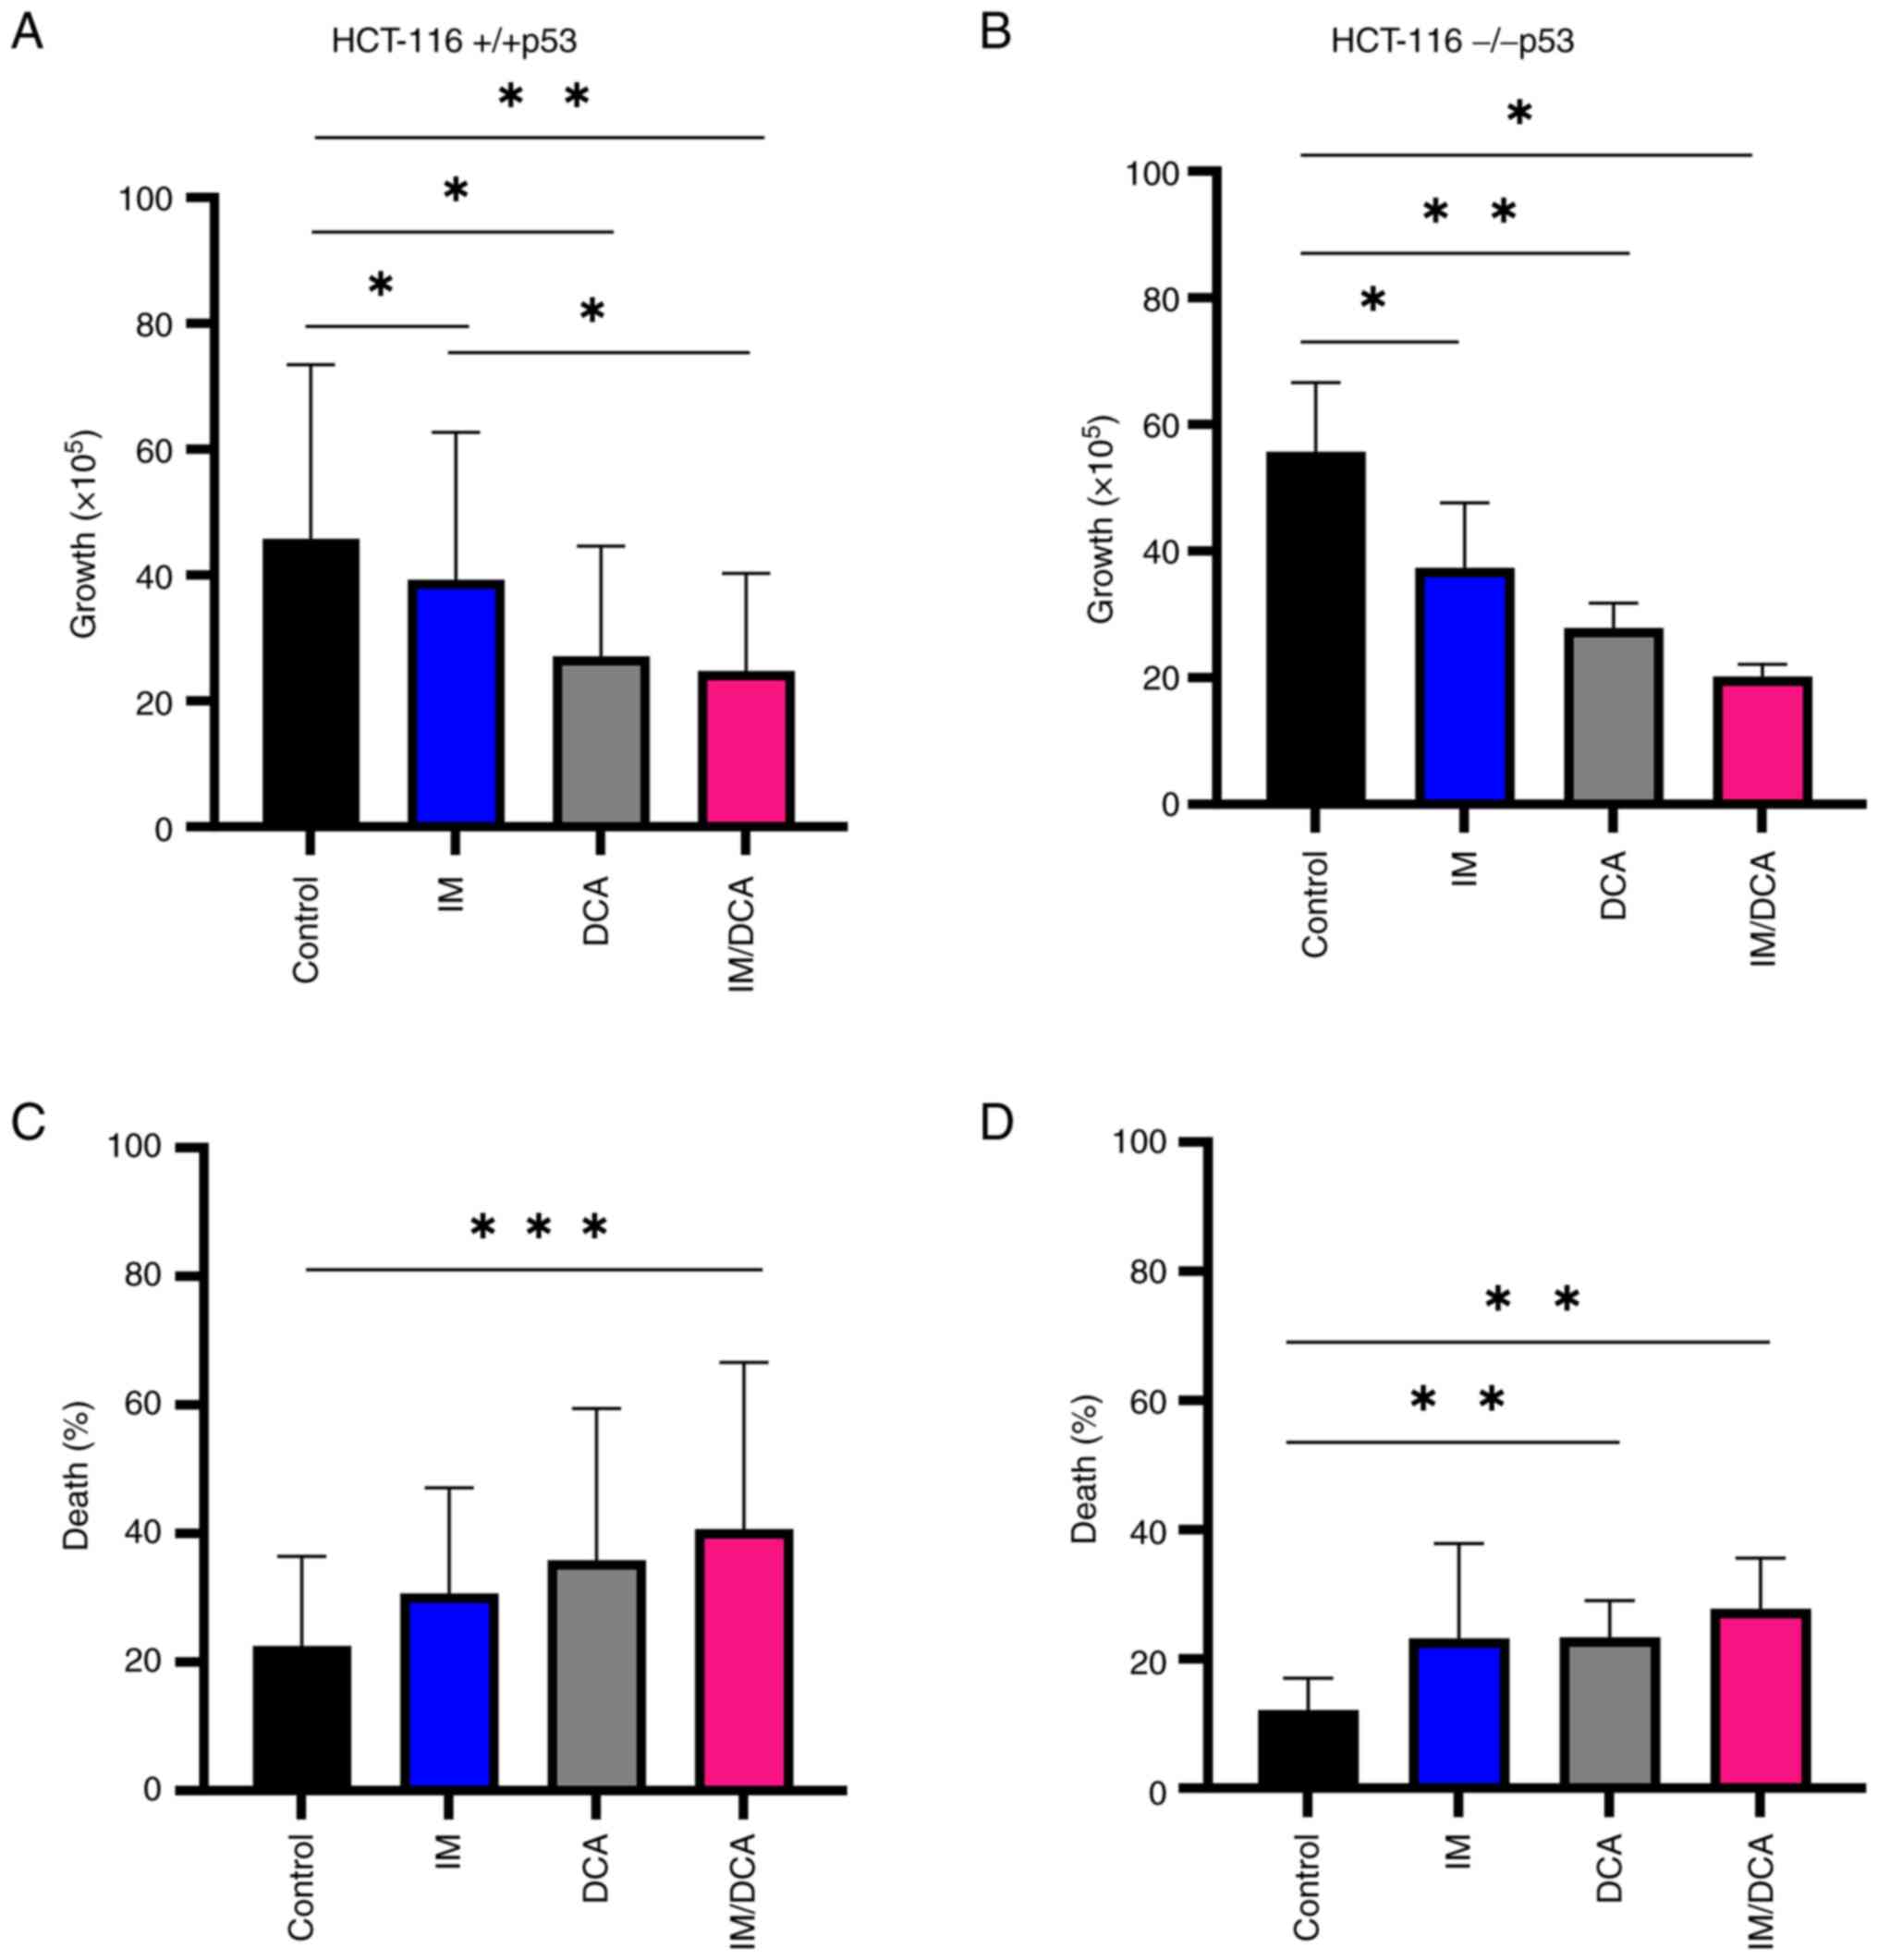 | Figure 7Cell proliferation and death in IM,
DCA or IM/DCA treated HCT-116 (+/+p53) and HCT-116 (−/−p53)
adherent cell cultures. Cells were seeded at 3×10⁵
cells/ml and left untreated or were treated with 2 μM IM
(blue bars), 4 mM DCA (gray bars), or both IM/DCA (2 μM + 4
mM) (pink bars) for 72 h. (A and B) Cell proliferation and (C and
D) death were measured in each culture as described in the
materials and methods section. Each bar represents the mean value
of at least a triplicate of experiments. (A) HCT-116 (+/+p53)
proliferation: Control-IM, P=0.0383; control-DCA, P=0.0314;
control-IM/DCA, P=0.0048; IM-IM/DCA, P=0.0151. (B) HCT-116 (−/−p53)
proliferation: Control-IM, P=0.0237; control-DCA, P=0.0085;
Control-IM/DCA, P=0.0166. (C) HCT-116 (+/+p53) death:
Control-IM/DCA, P=0.0004. (D) HCT-116 (−/−p53) death: (Control-DCA,
P=0.0042; control-IM/DCA, P=0.0042). *P≤0.05,
**P≤0.01 and ***P≤0.001. IM, imatinib; DCA,
dichloroacetate. |
IM, DCA and their combination affect
the levels of the OxPhos SCO2 and FXN proteins in the HCT-116
(−/−p53) cells
After both HCT-116 cell lines were treated with IM,
DCA or with a combinatorial treatment, the levels of SCO2 and FXN
were assessed by gel electrophoresis and WB. In HCT-116 (+/+p53)
cells, IM marginally decreased the levels of SCO2, while DCA as
well as IM/DCA increased SCO2 by ~2-fold (Fig. 8A). As DCA is an inhibitor of
glycolysis, an increase in the levels of SCO2 could be attributed
to the shifting of the metabolism of HCT-116 cells, which relies
primarily on glycolysis, towards OxPhos. In HCT-116 (−/−p53) cells,
however, IM decreased the level of SCO2 mildly and similar behavior
was observed by the IM/DCA co-treatment (Fig. 8A). Although DCA can inhibit
glycolysis, due to the lack of the full length functional p53
protein (due to the absence of exon 2), the SCO2 protein levels did
not change significantly. A similar analysis in the HCT-116
(+/+p53) cells demonstrated in Fig.
8B indicated that, similarly to SCO2, although IM decreased the
FXN levels, DCA and IM/DCA co-treatment increased the level of
frataxin considerably by almost ~4-fold for the case of the two
agents. This may also be due to the fact that the FXN gene
expression has been reported to be regulated by the transcription
factor of TP53 (59). The same approach however, for the
HCT-116 (−/−p53) cells, indicated that all IM and DCA treatments
led to slight reduction of FXN protein levels (Fig. 8B). As aforementioned for the case
of SCO2, this could be due to the lack of a full-length p53 protein
in the HCT-116 (−/−p53) cells.
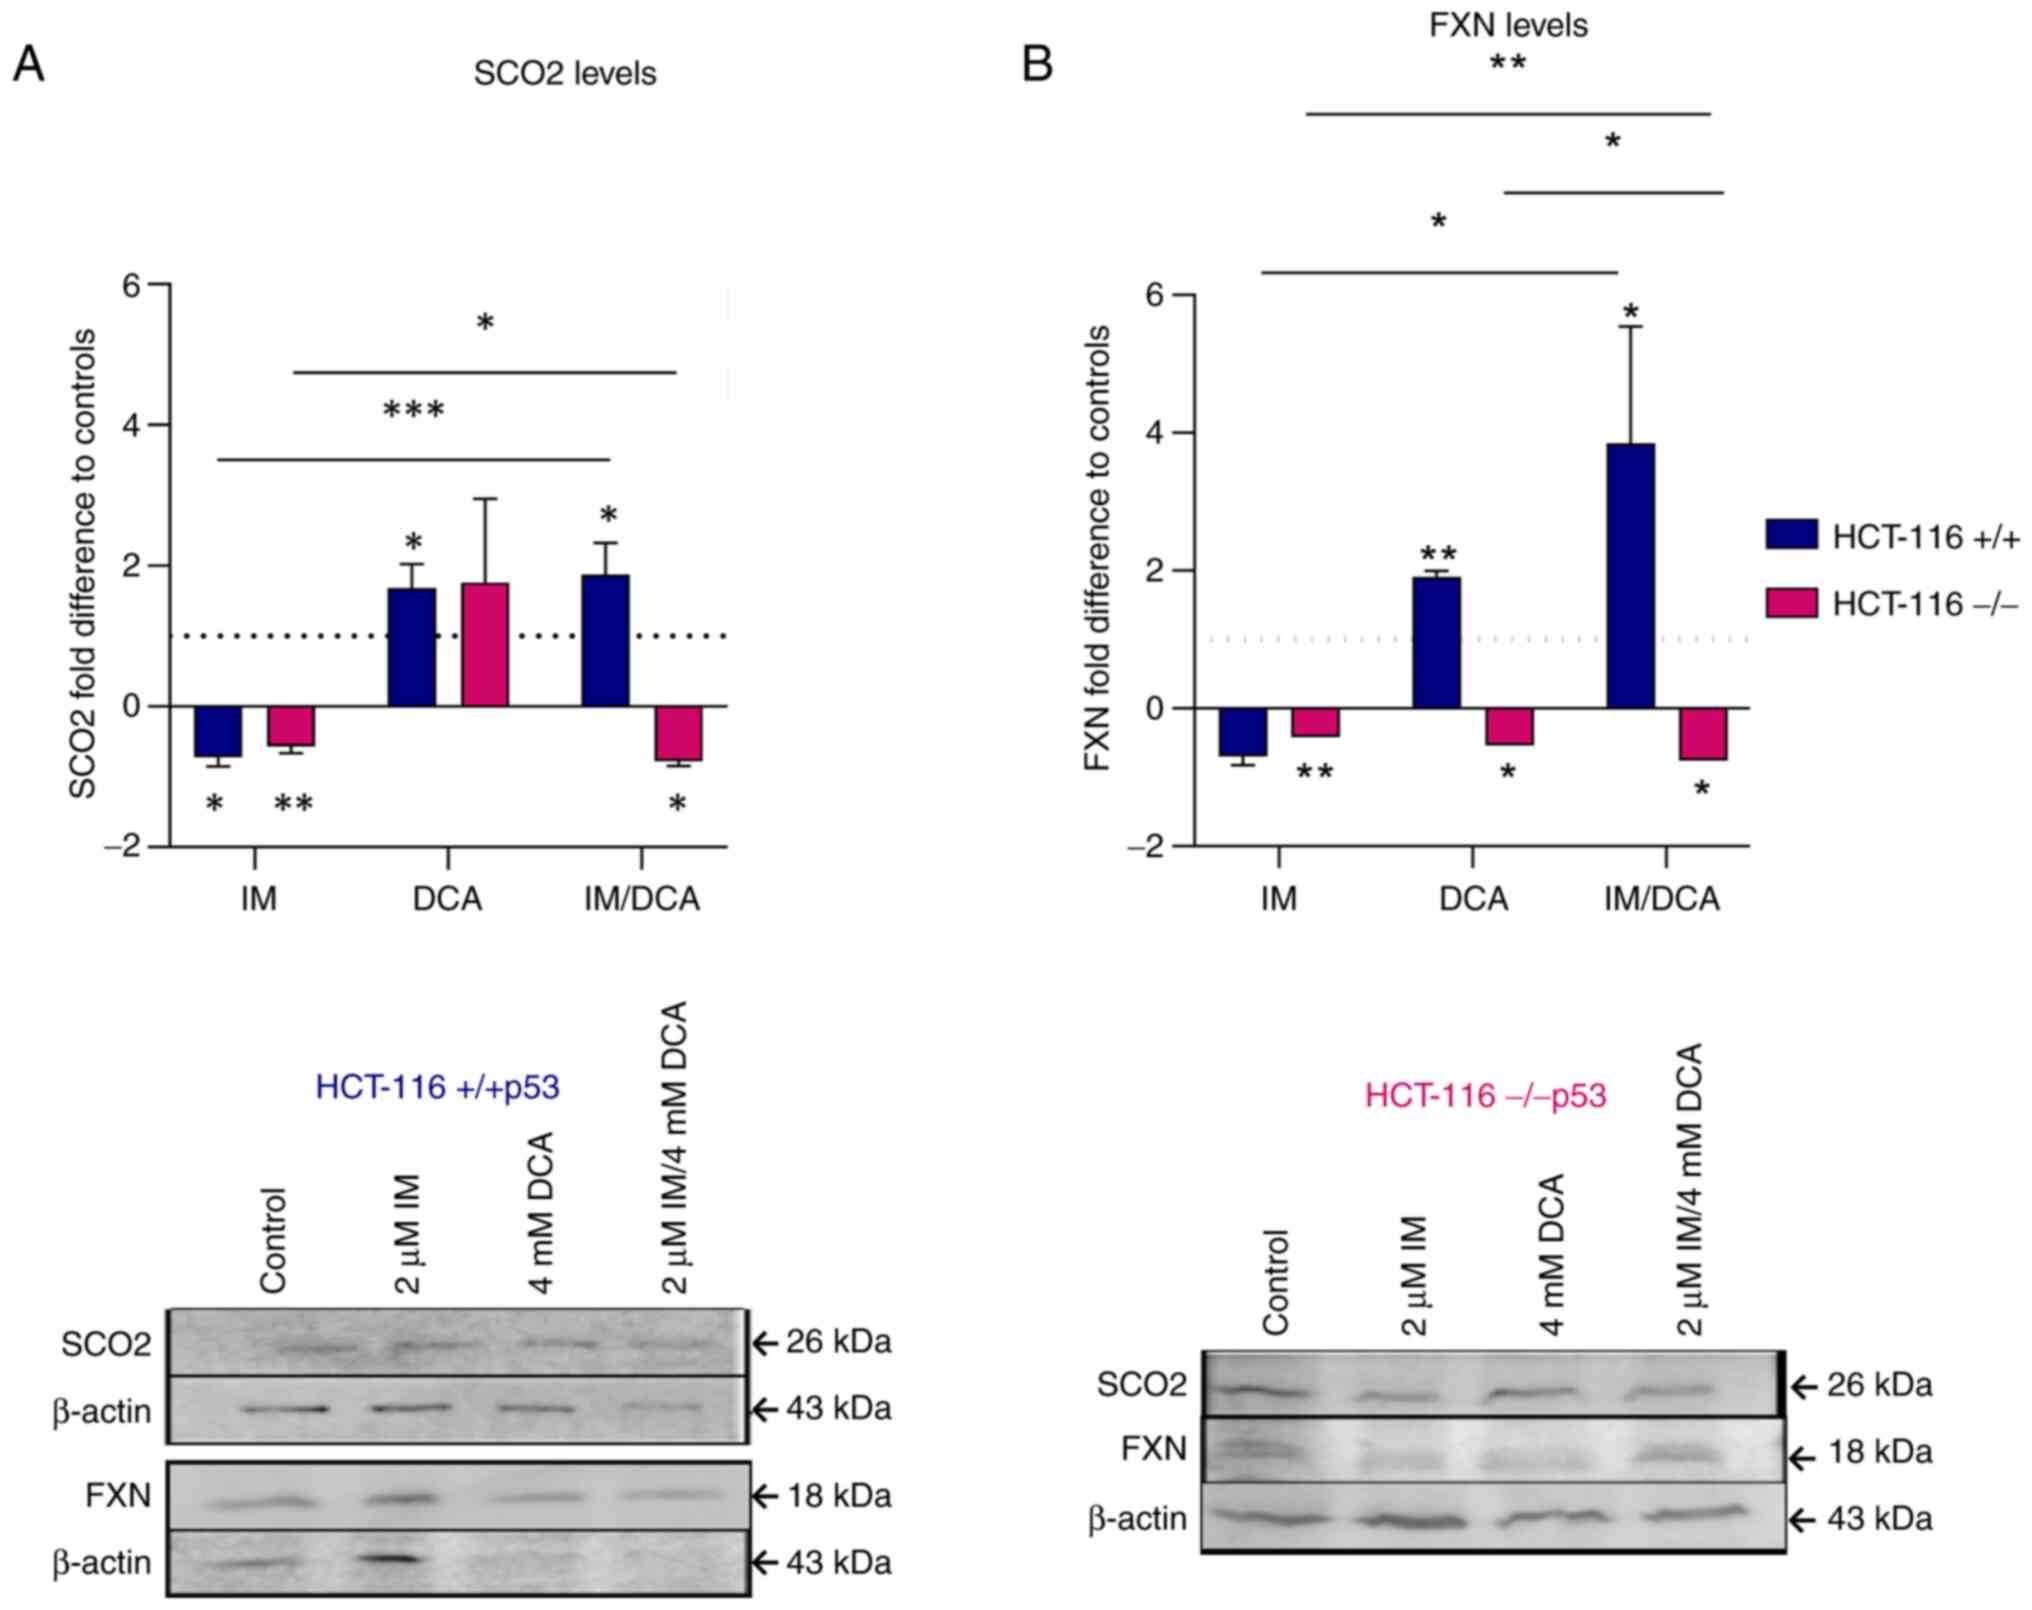 | Figure 8Exploration of the effects of IM, DCA
or both on the synthesis of SCO2 and FXN in HCT-116 (+/+p53) and
HCT-116 (−/−p53) cells by WB analysis and band densitometry. Cells
in each culture were seeded at 3×10⁵ cells/ml and
treated with 2 μM IM, 4 mM DCA or both IM/DCA (2 μM +
4 mM) for 72 h. Mitochondrial protein lysates from control
(untreated) and drug-treated HCT-116 (+/+p53) (blue bars) and
HCT-116 (−/−p53) (pink bars) cells were assessed by WB analysis
using 40 μg of total lysate per lane and antibodies against
the human SCO2 and FXN proteins. β-actin was used as internal
marker. The quantification was based on band densitometry and
normalization between the proteins of interest and the house keeper
marker assessed. The levels shown represent mean values from at
least triplicate biological experiments. (A) SCO2: [HCT-116
(+/+p53): Control-IM, P=0.0319; control-DCA, P=0.0119;
control-IM/DCA, P=0.0142; IM-IM/DCA, P=0.0001]; [HCT-116 (−/−p53):
Control-IM, P=0.0063; control-IM/DCA, P=0.0102; IM-IM/DCA,
P=0.0354]. (B) FXN: [HCT-116 (+/+p53): Control-DCA, P=0.0011;
control-IM/DCA, P=0.0365; IM-IM/DCA, P=0.0421]; [HCT-116 (−/−p53):
Control-IM, P=0.0016; control-DCA, P=0.0182; control-IM/DCA,
P=0.021; IM-IM/DCA, P=0.0087; DCA-IM/DCA, P=0.0439].
*P≤0.05, **P≤0.01 and ***P≤0.001.
IM, imatinib; DCA, dichloroacetate; SCO2, synthesis of cytochrome c
oxidase 2; FXN, frataxin; WB, western blot. |
Treatment of HCT-116 cell lines with
IM, DCA and their combination modulates the levels of glycolytic
biomarkers
Concerning the protein levels of LDHA in IM-, DCA-
or IM/DCA-treated HCT-116 (+/+p53) cells, an overall mild decrease
was observed. Interestingly, the treatment of the HCT-116 (−/−p53)
cells with DCA or IM/DCA increased the levels of LDHA by ~2-fold
(Fig. 9A). The absence of
full-length p53 protein appeared to play a crucial role in response
of HCT-116 (−/−p53) cells to DCA. According to literature, p53
negatively regulates LDHA expression by directly binding in its
promoter region (60).
Furthermore, the p53/LDHA axis negatively regulates aerobic
glycolysis and tumor progression in breast cancer expressing
wild-type p53 (60). The
treatment of all HCT-116 cells under study with IM, DCA or IM/DCA
led to broad and mild reduction of the GAPDH protein levels
(Fig. 9B). An increase of PKM2
was observed in the HCT-116 (+/+ p53) cells treated with IM, DCA or
in the combinatorial treatment. By contrast, the same treatments
induced very mild reductions of PKM2 in the HCT116 (−/−p53) cells
(Fig. 9C). In conclusion, IM and
DCA reduced the protein levels of LDHA and GAPDH in HCT-116
(+/+p53) cells, while in HCT-116 (−/−p53) cells DCA alone or in
combination with IM (IM/DCA) reversed this for LDHA. The lack of a
full length p53 in HCT-116 (−/−p53) cells cannot facilitate the
increase of PKM2 upon stimulation with IM and DCA.
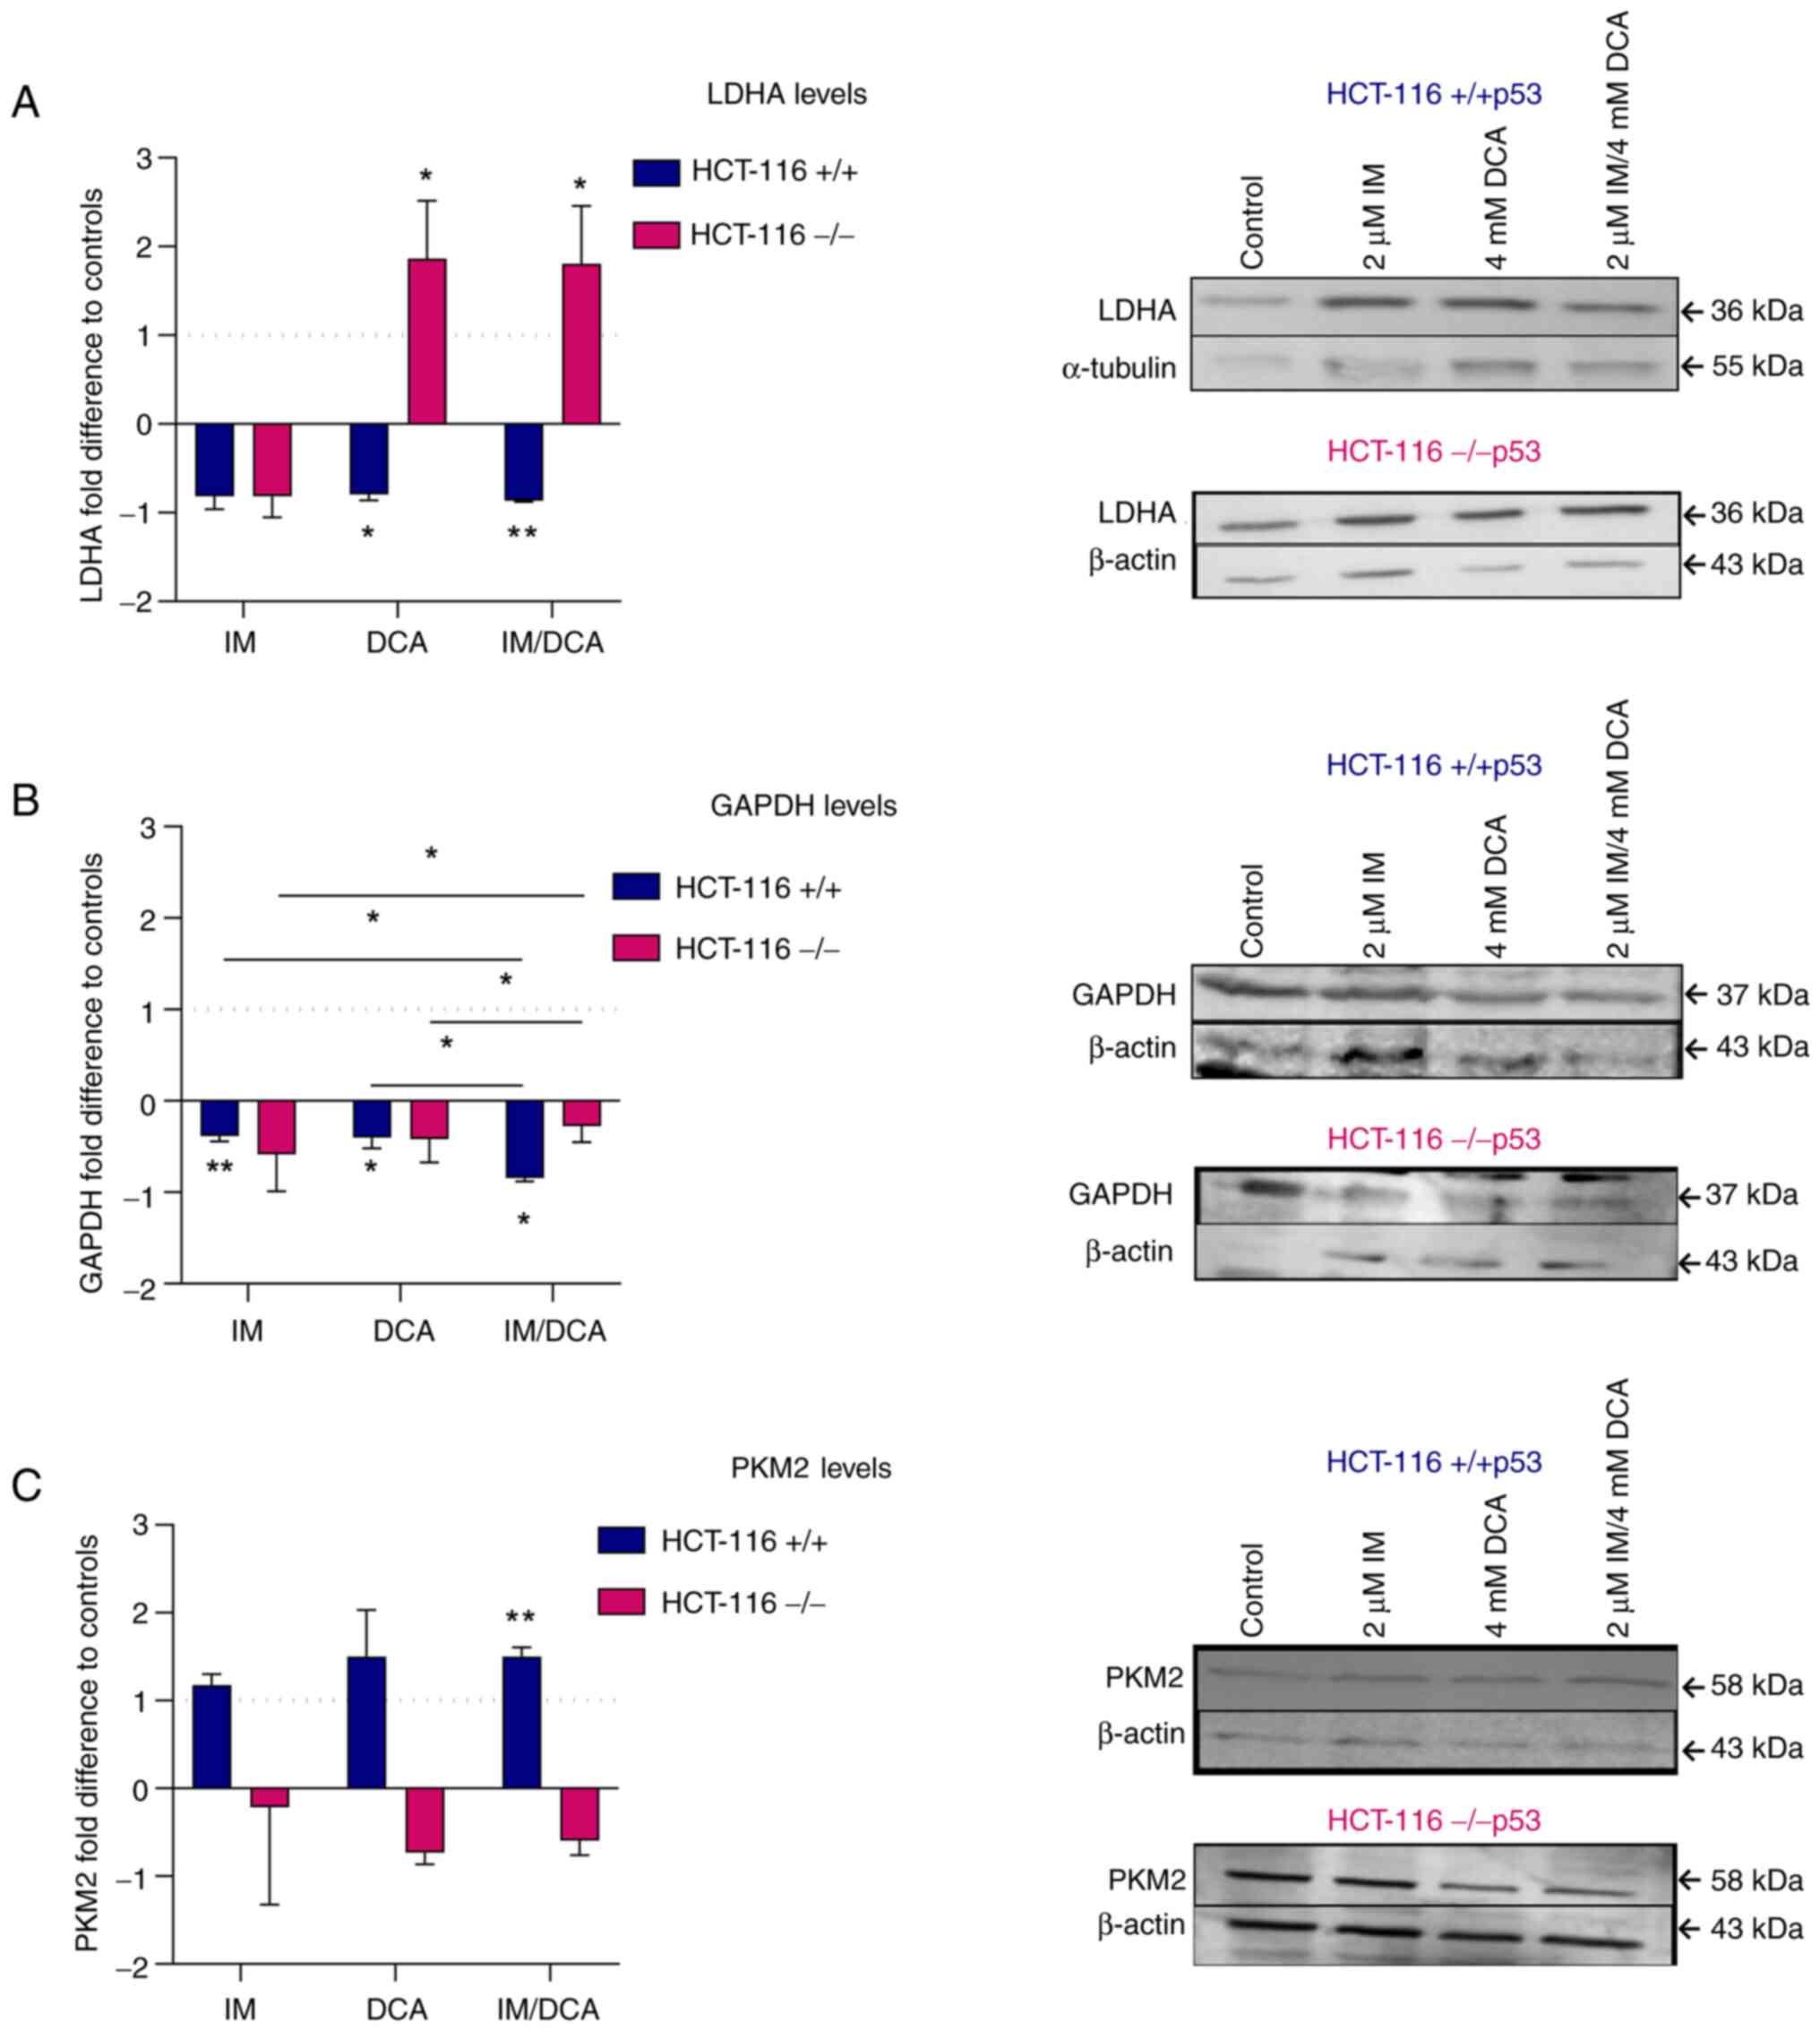 | Figure 9Examination of the effects of IM, DCA
or both on the synthesis of LDHA, GAPDH and PKM2 in HCT-116
(+/+p53) and HCT-116 (−/−p53) cells by WB analysis and band
densitometry. Cells in each culture were seeded at 3×10⁵
cells/ml and treated with 2 μM IM, 4 mM DCA or both IM/DCA
(2 μM + 4 mM) for 72 h. Control (untreated) and drug-treated
HCT-116 (+/+p53) (blue bars) and HCT-116 (−/−p53) (pink bars) cells
were assessed by WB analysis using 40 μg of total lysate per
lane and antibodies against the human LDHA, GAPDH and PKM2
proteins. β-actin and α-tubulin were used as internal markers. The
quantification was based on band densitometry and normalization
between the proteins of interest and the house keeper marker
assessed. The levels shown represent mean values from at least
triplicate biological experiments. (A) LDHA: [HCT-116 (+/+p53):
Control-DCA, P=0.043; control-IM/DCA, P=0.0058); HCT-116 (−/−p53):
Control-DCA, P=0.0457; control-IM/DCA, P=0.0433]. (B) GAPDH:
[HCT-116 (+/+p53): Control-IM, P=0.0094; control-DCA, P=0.0294;
control-IM/DCA, P=0.0225; IM-IM/DCA, P=0.0215; DCA-IM/DCA,
P=0.0312; HCT-116 (−/−p53) IM-IM/DCA, P=0.0475; DCA-IM/DCA,
P=0.0241] (C) PKM2: [HCT-116 (+/+p53): Control-IM/DCA, P=0.0498].
*P≤0.05 and **P≤0.01. IM, imatinib; DCA,
dichloroacetate; LDHA, lactate dehydrogenase A; GAPDH,
glyceraldehyde-3-phosphate dehydrogenase; PKM2, pyruvate kinase M2;
WB, western blot. |
Molecular effects of IM, DCA and their
combination on the levels of redox signaling mediators and
hypoxia-dependent factors in HCT-116 cells
When the levels of the HO-1 protein were measured,
it was noticed that treatment with IM decreased the expression
levels of HO-1 marginally in both HCT-116 (+/+p53) and HCT-116
(−/−p53) cells. By contrast, treatment with DCA alone, or in
combination with IM, increased the HO-1 levels in both cell types
in a similar way (~2-fold) (Fig.
10A). In patients with CML, IM reduced the protein levels of
NF-κB (61). In the present
study, both types of HCT-116 cells, treated with IM or IM with DCA
also demonstrated a mild decrease in the protein levels of NF-κB
protein levels, suggesting overall that the p53/NF-κB axis is not
significantly influenced by IM (Fig.
10B). On the other hand, treatment of both cell types with DCA
led to a mild increase of NF-κB. It was also observed that IM could
marginally decrease the protein levels of SCF in both HCT-116 cells
which is in agreement with the literature, as IM has been
identified to block the SCF/c-Kit pathway (42). Even in the absence of full-length
p53 protein, IM decreased the proteins levels of SCF in HCT-116
(−/−p53) cells, implicating that IM probably exerts its action
through a p53 independent pathway (Fig. 10C). DCA as well as the
combination of DCA with IM (IM/DCA) also mildly decreased the SCF
protein levels in HCT-116 cells (Fig. 10C).
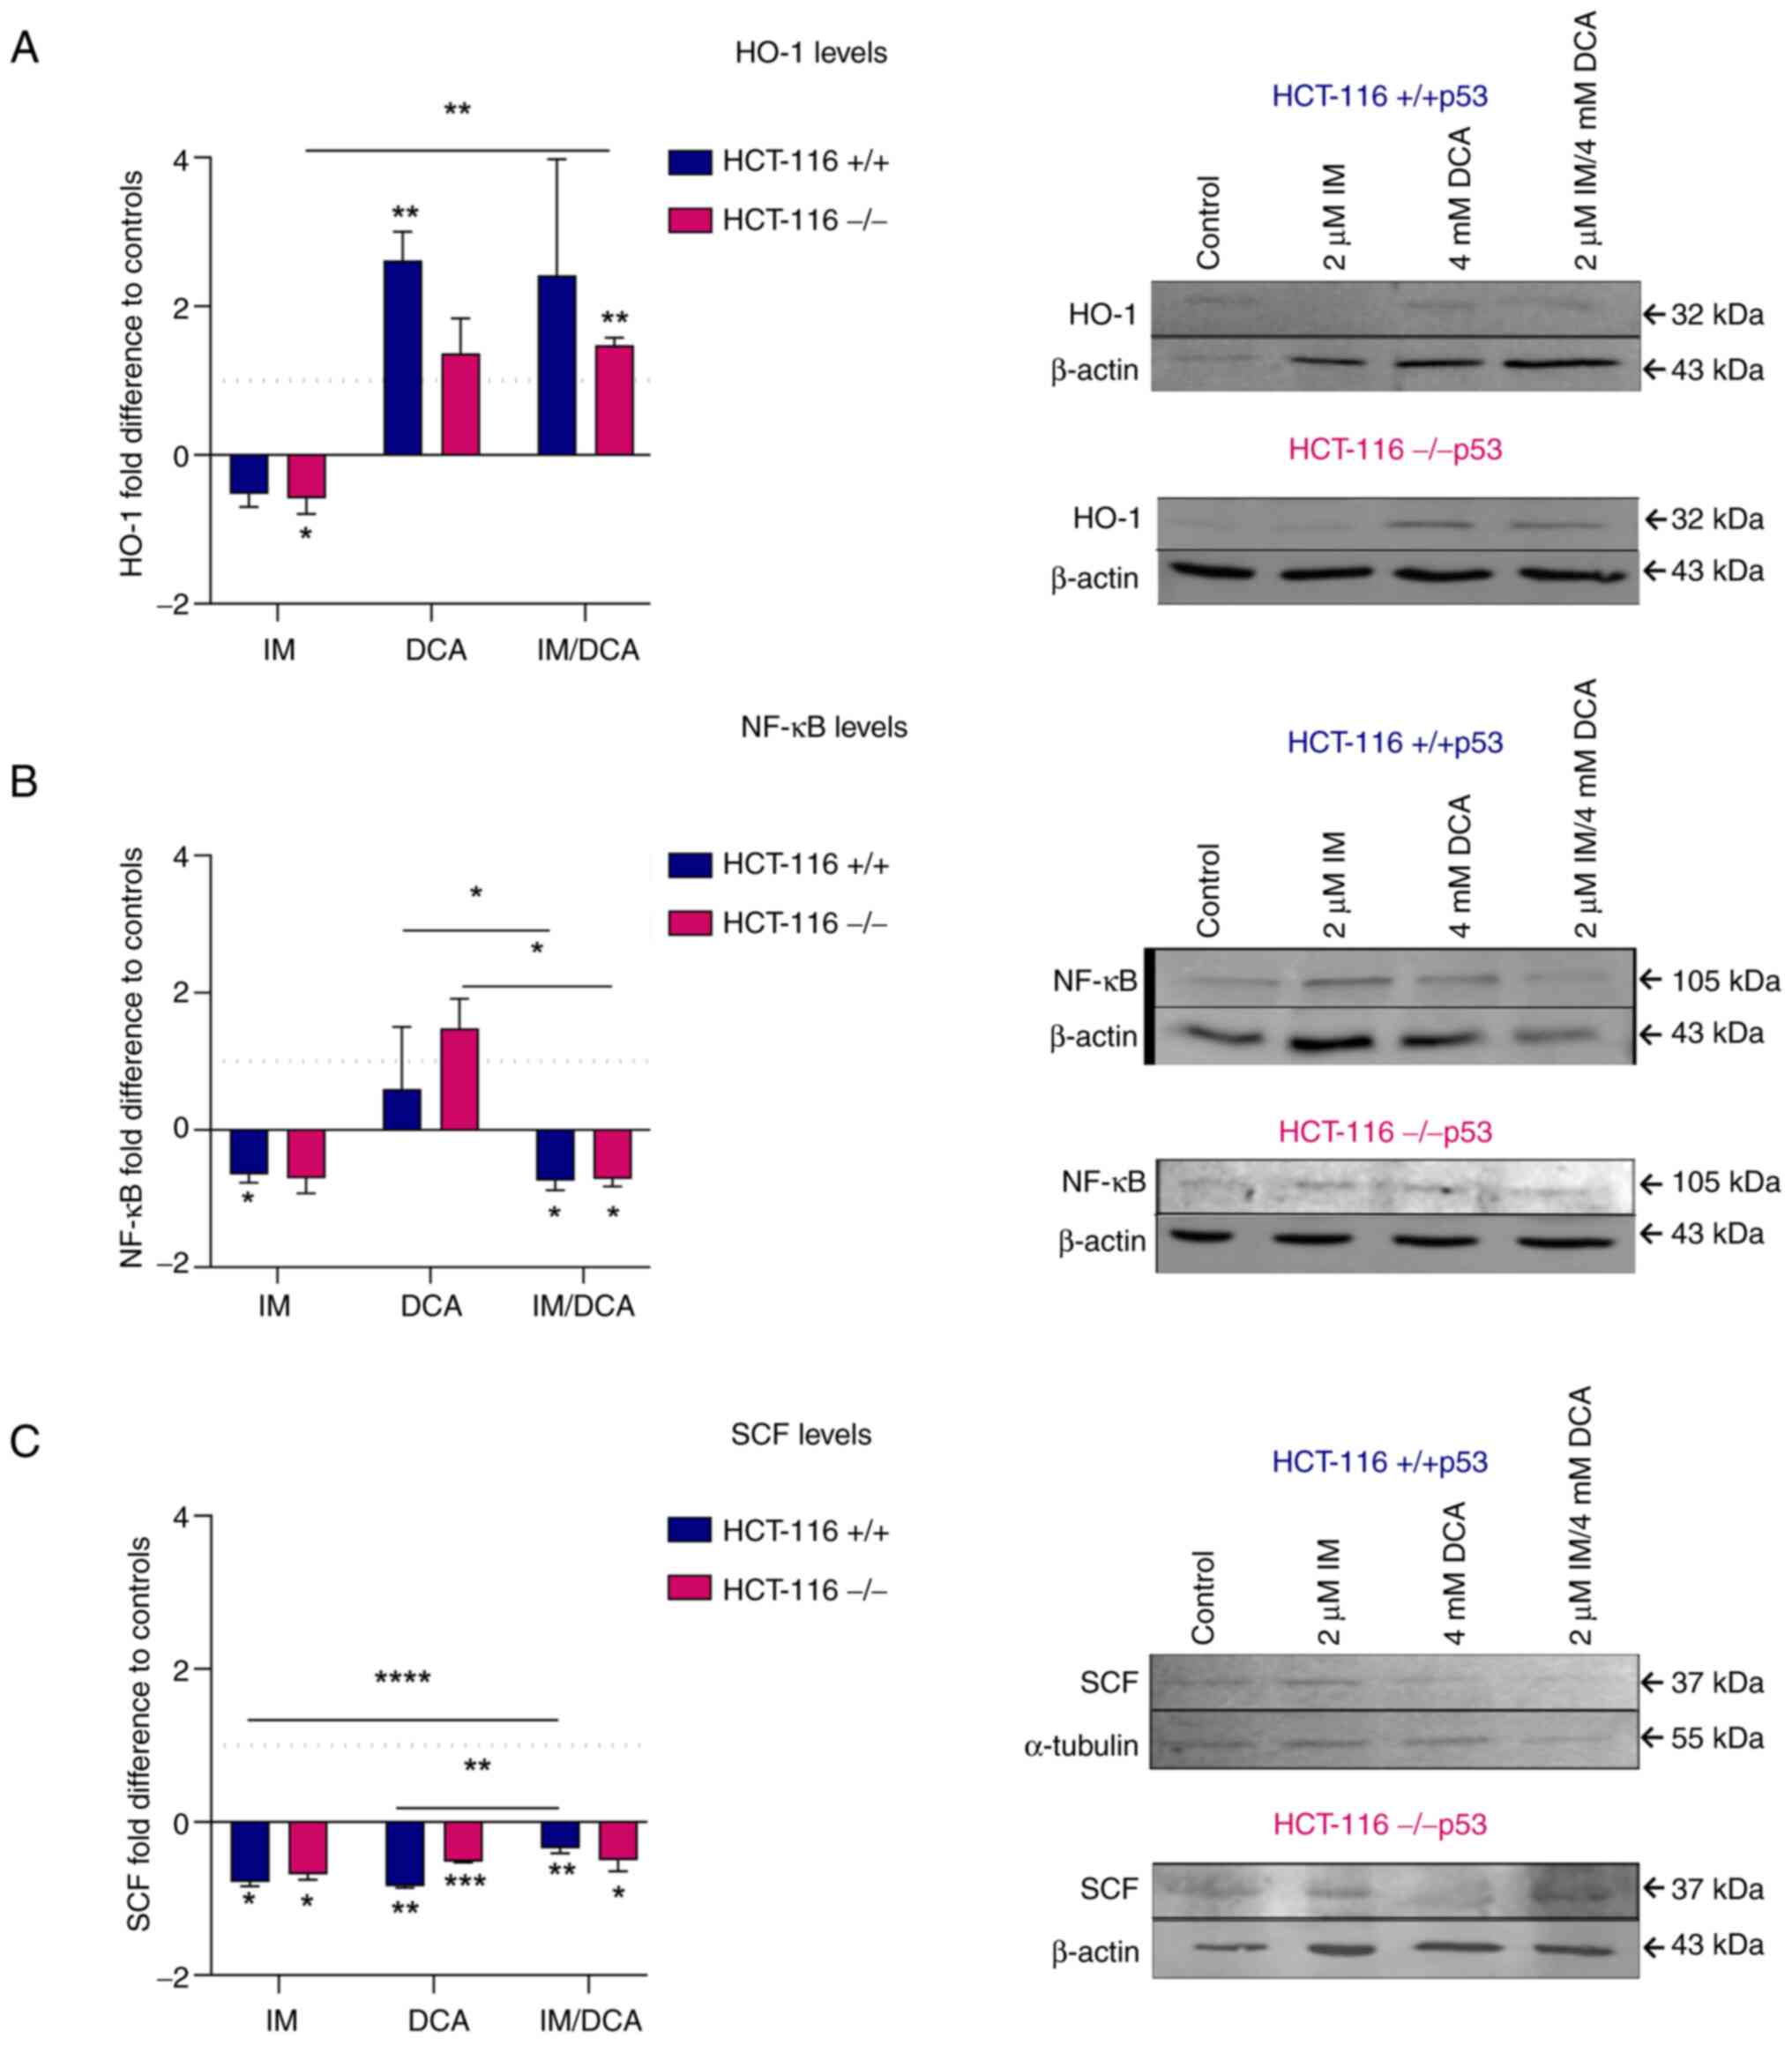 | Figure 10Illustration of the effects of IM,
DCA or both on the synthesis of HO-1, NF-κB and SCF in HCT-116
(+/+p53) and HCT-116 (−/−p53) cells by WB analysis and band
densitometry. Cells in each culture were seeded at 3×10⁵
cells/ml and treated with 2 μM IM, 4 mM DCA or both IM/DCA
(2 μM + 4 mM) for 72 h. Control (untreated) and drug-treated
HCT-116 (+/+p53) (blue bars) and HCT-116 (−/−p53) (pink bars) cells
were assessed by WB analysis using 40 μg of total lysate per
lane and antibodies against the human HO-1, NF-κB and SCF proteins.
β-actin and α-tubulin were used as internal markers. The
quantification was based on band densitometry and normalization
between the proteins of interest and the house keeper marker
assessed. The levels shown represent mean values from at least
triplicate biological experiments. (A) HO-1: [HCT-116 (+/+p53):
Control-DCA, P=0.0007; HCT-116 (−/−p53): Control-IM, P=0.0405;
control-IM/DCA, P=0.0012; IM-IM/DCA, P=0.0093] (B) NF-κB: [HCT-116
(+/+p53): Control-IM, P=0.0196; control-IM/DCA, P=0.0496;
DCA-IM/DCA, P=0.0349; HCT-116 (−/−p53): control-IM/DCA, P=0.0152;
DCA-IM/DCA, P=0.0355]. (C) SCF: [HCT-116 (+/+p53): Control-IM,
P=0.0274; control-DCA, P=0.0059; control-IM/DCA, P=0.0093;
IM-IM/DCA, P=0.0056; DCA-IM/DCA, P=0.0147; HCT-116 (−/−p53):
Control-IM, P=0.0289; Control-DCA, P=0.0002; control-IM/DCA,
P=0.0494]. *P≤0.05, **P≤0.01,
***P≤0.001 and ****P≤0.0001. IM, imatinib;
DCA, dichloroacetate; HO-1, heme oxygenase-1; NF-κB, nuclear factor
kappa-light-chain-enhancer of activated B cells; SCF, stem cell
factor; VEGF, vascular endothelial growth factor; WB, western
blot. |
Discussion
Tumor cells of diverse origins, such as the ones
derived from hematological malignancies (such as leukemias) and/or
solid tumors, exhibit imbalance in the dynamics of cellular
metabolism and mitochondrial bioenergetics. Evidence now exists to
indicate these cells have been retuned in the regulation thresholds
of OxPhos and aerobic glycolysis that vary extensively among
different types and populations of tumors (3,32).
A previous study by the authors (24) revealed that IM disrupts HDCBAP in
Bcr-Abl+ cells by downregulating the
expression of key genes. In this context, heme is essential for the
biogenesis and proper functioning of mitochondrial respiratory
chain complexes. Moreover, mitochondria and cancer are linked
through the generation of ROS (5,8),
while ROS are mediating mechanisms of action in targeted cancer
therapy strategies (62).
In the present study, the levels of OxPhos related
SCO2 and FXN proteins, as well as additional metabolic enzymes and
hypoxic factors involved in glycolysis and oxidative stress were
assessed and shown to share physicochemical interactions (Table I). The central aim of the present
study was to determine the effects of IM and DCA on mitochondrial
bioenergetics of two cancer cell lines. It is conceivable that all
these macromolecules interact within the mitochondrial bioenergetic
playground as demonstrated in Fig.
S5A and B.
Metabolic enzymes involved in glycolysis include
PKM2, GAPDH and LDHA. In addition, the hypoxic tumor cells often
express relatively high levels of HIF-1a, SCF, HO-1 and NF-κB.
Taken together, these aspects indicated that transitioning of
mitochondrial bioenergetics occurs within the frame of the 'Warburg
effect' as discussed in the introduction (Fig. 1A and B). That is a transitional
shift from OxPhos to glycolysis. Unfortunately, to date, the
precise molecular mechanisms involved in this metabolic
reprogramming have not been fully explored (3).
Earlier attempts to exploit the unique nature of the
hypoxic microenvironment in tumor cells via the intracellular
bio-activation of a new class of 'bioreductive alkylating agents'
as potent chemotherapeutics, led to the development of cytotoxic
antineoplastic agents by Sartorelli and his colleagues (63,64). More recently, Li et al
(65) also insisted in targeting
hypoxia with hypoxia-activated prodrugs. Thus, during the
alternative approach to tackle this metabolic imbalance in
mitochondrial cancer bioenergetics, the observations of the authors
that IM downregulates remarkably the expression of both SCO2
and FXN genes were expanded. The former is involved in the
biogenesis of COX, while the latter in the assembly of Fe/S
clusters of the mitochondrial respiratory chain (66,67), both associated with COX deficiency
(24). As proposed by Michelakis
et al (31), DCA was
utilized as a potential metabolic-targeting therapy for cancer
capable of blocking the lactate production at the last steps of
glycolysis. Thus, it was investigated whether these two agents, IM
and DCA, which block OxPhos and glycolysis, respectively, can
exhibit antineoplastic activity guiding cancer cells to death.
According to the data presented with K-562, IM
provoked extensive cell death, as expected, since IM is a selective
drug of choice for CML, that also downregulates SCO2 and FXN in a
dose-dependent manner. The concentration of IM used in these
experiments was 1-2 μM, as it corresponds to the therapeutic
concentration used for CML (19,24) and revealed to be safe for
patients. IM reduced the levels of both mitochondrial proteins,
SCO2 and FXN in a dose-dependent fashion. Thus, IM blocked the
OxPhos, in agreement with the previous results (24). Moreover, IM increased the protein
levels of two glycolytic enzymes, GAPDH and LDHA, without having a
significant effect on the glycolytic enzyme PKM2. An increase in
the protein levels of HIF-1α, SCF and VEGF (at a markedly higher
level) was also observed following treatment with IM.
DCA neither caused any substantial change in the
levels of SCO2 and FXN, nor promoted any substantial alteration in
GAPDH levels, as expected, as DCA inhibits the generation of lactic
acid in the last step of glycolysis, directing pyruvate to OxPhos.
Co-treatment of K-562 cells with IM and DCA increased the
proportion of dead cells, even though slightly affected the levels
of hypoxic markers HIF-1a, SCF, NF-κB and VEGF. Based on these
findings, it can be inferred that in K-562 cells, it is likely that
the effect of IM exceeded the one of DCA and combination treatment
made these cells more sensitive to IM treatment and more
susceptible to cell death. Furthermore, as these two agents target
distinct cellular processes, OxPhos and glycolysis, the suppressive
effects of the combination treatment on cell proliferation were
considered as a cooperative effect.
It is well known that a significant percentage
(10-20%) of patients with CML develop resistance to IM
(Gleevec®) after administration for a certain time
(68). For this reason, the
effects of IM and DCA in the IM-chemoresistant K-562R cell line
were investigated (resistant to IM as maintained with continuous
presence of IM at 0.89 μM). IM-treated K-562R demonstrated a
lower inhibition of cell proliferation, while in the presence of
DCA only cell death increased. Co-treatment with both IM and DCA
led to a higher percentage of cell death in K-562R cells.
Contrary to what was reported for K-562 cells, the
IM-resistant K-562R cells exhibited a significant increase of SCO2,
while FXN was moderately increased. These results suggested that
IM-driven adaptation processes in K-562R cells increase the protein
expression of a certain OxPhos component or components. Moreover,
the flow cytometric analysis (Fig.
6) revealed that K-562 cells have considerably high levels of
ROS and treatment with either IM, DCA or both agents markedly
decreased them. K-562R cells, however, have been revealed to
contain a relatively lower load of ROS, while their treatment with
DCA increased ROS (Fig. 6B). As
DCA alone or in combination with IM increased in the K-562R the
levels of the two SCO2 and FXN mitochondrial proteins, it appeared
that the DCA reversed the phenotype of resistance concerning energy
production, thus promoting OxPhos. It may be possible that the
increased ROS is a result from this metabolic shift towards OxPhos.
Overall, K-562R exhibited milder bioener- getic changes after
exposure to IM and DCA compared with the IM-sensitive K-562 cells.
This could reflect a more tightly regulated redox status due to the
onset of pharmacological resistance in the former CML cell
line.
Regarding the glycolytic molecules studied in the
K-562 lines, the expression levels of GAPDH decreased after DCA
administration, as expected, while in the presence of the
co-treatment, the levels of LDHA increased. Due to the interaction
of HIF-1a (39) with VEGF and
SCF, an increase in their levels was also observed, but to a
markedly lower extent in the K-562R, and only after administration
of DCA or IM/DCA. Finally, the expression protein levels of NF-κB,
as in the K-562 cells, exhibited a decrease. In conclusion, in both
K-562 and K-562R cells, the co-treatment of IM and DCA led to
increased cytotoxicity, probably by interfering with the metabolic
pathways of OxPhos and glycolysis. Notably, IM/DCA treatments
revealed that only K-562R had the capacity to increase glycolytic
(for example, LDHA) and OxPhos components (SCO2 and FXN) in
parallel. This pattern could represent metabolomic and bioenergetic
manifestations of drug resistance, similarly to what has been
observed in other malignancies (69). Such findings could be valuable,
especially in the therapeutics of patients with CML that develop
resistance to IM.
With respect to the treatments of the HCT-116 cell
lines, it was observed that IM reduced substantially the OxPhos
biomarkers SCO2 and FXN in both HCT-116 cell lines. SCO2 and FXN
are transcriptional targets of p53 (13). In HCT-116 (−/−p53) there is a
deletion of p53 exon 2 (51,58), which is in accordance with the
findings of the present study for the gene expression and protein
levels, as demonstrated in Fig.
S1. Treatment of HCT-116 (+/+p53) with DCA increased the SCO2
levels. Based on the study of Allende-Vega et al (70) in 2015, HCT-116 (+/+p53) cells
treated with 10 mM DCA for 24 h exhibited an increase in p53. In a
similar way, DCA caused an increase in FXN protein expression
levels in HCT-116 (+/+p53) cells. This result reinforced the
observation that the FXN gene is also a transcriptional
target of p53 and an increase in p53 protein levels could be
associated also with an increase in the corresponding FXN levels
(59,71,72). On the other hand, IM/DCA in
HCT-116 (−/−p53) cells decreased both the SCO2 and FXN protein
levels, possibly due to the absence of full length TP53
protein.
IM as well as DCA reduced the GAPDH protein levels
in all HCT-116 cells, indicating that these agents interfere with
glucose metabolism, either as inhibitor of OxPhos or glycolysis,
respectively. In HCT-116 (+/+p53) cells, DCA reduced LDHA protein
levels, in agreement with the literature (28), while in HCT-116 (−/−p53) cells
this effect was reversed. It appears that in the absence of
full-length p53 protein that promotes OxPhos, DCA leads to an
increase in LDHA protein.
DCA inhibits the pyruvate dehydrogenase (PDH)
kinase (PDK) and thus releases PDH, the rate-limiting enzyme of
glucose oxidation. Considering that the HCT-116 (−/−p53) cells are
more likely to be glycolytic, the lack of full-length p53 protein
affected the effectiveness of IM and DCA, since these cells were
revealed to be less susceptible compared with HCT-116 (+/+p53)
cells as previously proposed (58). The upregulation of LDHA induced by
DCA in these conditions may be part of a feedback response
mechanism to support energy production under anaerobic conditions
and convert the generated pyruvate to lactate that may also
contribute to the acidification of the hypoxic tumor cell
microenvironment. This could reflect an adaptive metabolic profile
capability of the solid tumor cells that may function as a defense
mechanism.
IM caused a decrease in SCF levels in HCT-116
(+/+p53) cells, also in agreement with the previous results that IM
blocks the SCF/c-Kit pathway (42). Moreover, DCA caused a decrease in
SCF protein in both HCT-116 cell lines, although to a smaller
extend in the HCT-116 (−/−p53) cells. IM also caused a decrease in
the NF-κB protein, as this has been reported in patients with CML
(61). In all HCT-116 cells, IM
decreased SCF protein expression levels suggesting that in relation
with SCF, IM probably exerts its action independently of the p53
transcriptional control.
IM also decreased the HO-1 protein levels in all
HCT-116 cells. Although the inter-relationship of HO-1 with p53 is
not fully understood, it was previously suggested that p53, either
induces HO-1 gene expression (downstream induction) or that
HO-1 is actually upstream of the TP53 gene (44). Based on the results obtained from
the two cell lines, it appears that the absence of full-length p53
protein does not affect the effect of IM on HO-1.
The findings of the present study revealed that the
HCT-116 cell lines suffered cell death induced by the coordinated
action of both agents, although to a different extent. In
comparison with the K-562 cells (Fig.
2), the HCT-116 cells were found to be less susceptible to the
simultaneous targeting of OxPhos and glycolysis with IM and DCA,
respectively (Fig. 7). These
findings provide an alternative chemotherapeutic approach based on
the metabolic peculiarities of various tumors (3). Since metabolic reprogramming has
been recognized as an emerging hallmark of cancer, DCA, an
inhibitor of glycolysis (that exhibits a relatively safe and
effective pharmacokinetic profile) can be combined with other
potent chemotherapeutic agents (29,73,74). This development has attracted a
lot of attention in numerous basic and clinical investigations of
tumor therapy due to its capacity to intervene in metabolic
reprogramming. A recent study described a variety of methods that
can be applied to investigate the mitochondrial structure and
function in cancer cells, within tissue cultures as well as in
animal models (75). As an
expansion of the studies conducted by the authors, a future
metabolic flux analysis, could provide valuable mechanistic
insights.
The results highlighted that the combination of IM
with DCA is effective as a combination therapy in limiting the
expansion of the two malignant cell lines examined by disrupting
their bioenergetic dynamics. As these agents target the
dysregulated metabolic pathways of malignant cells, these findings
may have a potential clinical value for use along with other
existing antineoplastic agent schemes approved for different types
of cancers. These findings need further investigation at the
preclinical stage by utilizing murine models with transplantable
tumors.
In the present study, DCA was combined for the
first time with IM. The findings of the present study indicated
that this combination is quite potent in eradicating human leukemic
cells more extensively as compared with the more robust human solid
colorectal cancer cells. Differences recorded in the extent of cell
death between these two types of cancer cells may be attributed to
different threshold dynamics between OxPhos and (aerobic)
glycolysis in each cancer population. Such chimeric states shape
the ground for pharmacological combinations against exploitable
joint targets in advanced cancer chemotherapy protocols.
Supplementary Data
Availability of data and materials
All data generated or analyzed during this study
are included in this published article.
Authors' contributions
MGK contributed to investigation, methodology,
validation, data curation, formal analysis, visualization and
writing of the K-562 cell lines work. AAL contributed to
investigation, methodology, validation, data curation, formal
analysis, visualization and writing of the HCT-116 cell lines work.
GIG contributed to flow cytometry data curation, visualization of
network models and review. SAT contributed to analysis and data
interpretation, data curation, writing and editing. ANM contributed
to methodology and data curation. ISP contributed to
conceptualization, review and editing. ISV contributed to resources
and conceptualization. LCP contributed to main conceptualization,
project supervision and administration, data analysis and curation,
resources, writing, review and editing, AST contributed to
conceptualization, data analysis and interpretation, writing,
review and editing. MGK, AAL and LCP confirm the authenticity of
all the raw data. All authors read and approved the final version
of the manuscript.
Ethics approval and consent to
participate
Not applicable.
Patient consent for publication
Not applicable.
Competing interests
The authors declare that they have no competing
interests.
Abbreviations:
|
acetyl-CoA
|
acetyl coenzyme A
|
|
AP
|
alkaline phosphatase
|
|
CML
|
chronic myeloid leukemia
|
|
COX
|
cytochrome c oxidase
|
|
DCA
|
dichloroacetate
|
|
DCFDA
|
2′,7′-dichlorofluorescein
diacetate
|
|
HDCBAP
|
heme dependent cytochrome c oxidase
biosynthesis and assembly pathway
|
|
HIF-1a
|
hypoxia inducing factor-1a
|
|
HO-1
|
heme oxygenase-1
|
|
FXN
|
frataxin
|
|
GAPDH
|
glyceraldehyde-3-phosphate
dehydrogenase
|
|
IM
|
imatinib
|
|
LDHA
|
lactate dehydrogenase A
|
|
OxPhos
|
oxidative phosphorylation
|
|
p53
|
p53 transcriptional regulator
|
|
PDC
|
pyruvate dehydrogenase complex
|
|
PDK
|
pyruvate dehydrogenase kinase
|
|
PKM2
|
pyruvate kinase M2
|
|
ROS
|
reactive oxygen species
|
|
SCO2
|
synthesis of cytochrome c oxidase
2
|
|
SCF
|
stem cell factor
|
|
VEGF
|
vascular endothelial growth
factor
|
|
WB
|
western blotting
|
Acknowledgments
The study involving the K-562 cell lines has been
submitted to the Department of Biochemistry and Biotechnology,
University of Thessaly, Larissa, Greece, for awarding the degree
Master of Sciences to Maria Kakafika. The work involving the
HCT-116 cell lines has been submitted to the School of Pharmacy,
Faculty of Health Sciences of the Aristotle University of
Thessaloniki, Thessaloniki, Greece, for awarding the degree Master
of Sciences to Areti Lyta. The authors would like to thank
Professor Bert Vogelstein (Johns Hopkins Medical School, Baltimore,
USA) for his kind donation of the HCT-116 (+/+p53) and HCT-116
(−/−p53) cells and Professor Diamanto Lazari (School of Pharmacy,
Faculty of Health Sciences, Aristotle University of Thessaloniki,
Thessaloniki, Greece) for her kind donation of the K-562R
IM-chemoresistant cell line. Moreover, the authors would like to
thank Dr Marina Gerousi (Institute of Applied Biosciences, Centre
for Research and Technology Hellas, Thessaloniki, Greece) for her
technical expertise with the flow cytometric analysis.
Funding
The present study was supported by internal departmental
university funds from the Department of Biochemistry and
Biotechnology of the University of Thessaly, Larissa, Greece and
the School of Pharmacy of the Aristotle University of Thessaloniki,
Thessaloniki, Greece, allocated to the Laboratory of Pharmacology
for M.Sc., graduate studies.
References
|
1
|
Hanahan D and Weinberg RA: The hallmarks
of cancer. Cell. 100:57–70. 2000. View Article : Google Scholar : PubMed/NCBI
|
|
2
|
Hanahan D and Weinberg RA: Hallmarks of
cancer: The next generation. Cell. 144:646–674. 2011. View Article : Google Scholar : PubMed/NCBI
|
|
3
|
Bartman CR, Weilandt DR, Shen Y, Lee WD,
Han Y, TeSlaa T, Jankowski CSR, Samarah L, Park NR, da Silva-Diz V,
et al: Slow TCA flux and ATP production in primary solid tumours
but not metastases. Nature. 614:349–357. 2023. View Article : Google Scholar : PubMed/NCBI
|
|
4
|
Schwartz L, Supuran CT and Alfarouk KO:
The warburg effect and the hallmarks of cancer. Anticancer Agents
Med Chem. 17:164–170. 2017. View Article : Google Scholar
|
|
5
|
Alam MM, Lal S, FitzGerald KE and Zhang L:
A holistic view of cancer bioenergetics: Mitochondrial function and
respiration play fundamental roles in the development and
progression of diverse tumors. Clin Transl Med. 5:32016. View Article : Google Scholar : PubMed/NCBI
|
|
6
|
Bernard G, Bellance N, James D, Parrone P,
Fernandez H, Letellier T and Rossignol R: Mitochondrial
bioenergetics and structural network organization. J Cell Sci.
120:838–848. 2007. View Article : Google Scholar
|
|
7
|
Blasiak J, Hoser G, Bialkowska-Warzecha J,
Pawlowska E and Skorski T: Reactive oxygen species and
mitochondrial DNA damage and repair in BCR-ABL1 cells resistant to
imatinib. Biores Open Access. 4:334–342. 2015. View Article : Google Scholar : PubMed/NCBI
|
|
8
|
Prieto-Bermejo R, Romo-González M,
Pérez-Fernández A, Ijurko C and Hernández-Hernández Á: Reactive
oxygen species in haematopoiesis: Leukaemic cells take a walk on
the wild side. J Exp Clin Cancer Res. 37:1–18. 2018. View Article : Google Scholar
|
|
9
|
Murphy MP: How mitochondria produce
reactive oxygen species. Biochem J. 417:1–13. 2009. View Article : Google Scholar
|
|
10
|
Warburg O: On respiratory impairment in
cancer cells. Science. 124:269–270. 1956. View Article : Google Scholar : PubMed/NCBI
|
|
11
|
Warburg O: The metabolism of carcinoma
cells. J Cancer Res. 9:148–163. 1925. View Article : Google Scholar
|
|
12
|
Heiden MGV, Cantley LC and Thompson CB:
Understanding the warburg effect: The metabolic requirements of
cell proliferation. Science. 324:1029–1033. 2009. View Article : Google Scholar
|
|
13
|
Matoba S, Kang JG, Patino WD, Wragg A,
Boehm M, Gavrilova O, Hurley PJ, Bunz F and Hwang PM: p53 regulates
mitochondrial respiration. Science. 312:1650–1653. 2006. View Article : Google Scholar : PubMed/NCBI
|
|
14
|
Kamp WM, Wang PY and Hwang PM: TP53
mutation, mitochondria and cancer. Curr Opin Genet Dev. 38:16–22.
2016. View Article : Google Scholar : PubMed/NCBI
|
|
15
|
Papadopoulou LC, Sue MC, Davidson MM,
Tanji K, Nishino I, Sadlock JE, Krishna S, Walker W, Selby J,
Glerum DM, et al: Fatal infantile cardioencephalomyopathy with COX
deficiency and mutations in SCO2, a COX assembly gene. Nat Genet.
23:333–337. 1999. View
Article : Google Scholar : PubMed/NCBI
|
|
16
|
Blandino G, Valenti F, Sacconi A and Di
Agostino S: Wild type- and mutant p53 proteins in mitochondrial
dysfunction: Emerging insights in cancer disease. Semin Cell Dev
Biol. 98:105–117. 2020. View Article : Google Scholar
|
|
17
|
Miliotou AN, Foltopoulou PF,
Ingendoh-Tsakmakidis A, Tsiftsoglou AS, Vizirianakis IS, Pappas IS
and Papadopoulou LC: Protein transduction Domain-mediated delivery
of recombinant proteins and in vitro transcribed mRNAs for protein
replacement therapy of human severe genetic mitochondrial
disorders: The case of Sco2 deficiency. Pharmaceutics. 15:2862023.
View Article : Google Scholar : PubMed/NCBI
|
|
18
|
Chadha R, Shah R and Mani S: Analysis of
reported SCO2 gene mutations affecting cytochrome c oxidase
activity in various diseases. Bioinformation. 10:329–333. 2014.
View Article : Google Scholar : PubMed/NCBI
|
|
19
|
Arora B, Gota V, Menon H, Sengar M, Nair
R, Patial P and Banavali SD: Therapeutic drug monitoring for
imatinib: Current status and Indian experience. Indian J Med
Paediatr Oncol. 34:224–228. 2013. View Article : Google Scholar
|
|
20
|
Soverini S, Martinelli G, Lacobucci I and
Baccarani M: Imatinib mesylate for the treatment of chronic myeloid
leukemia. Expert Rev Anticancer Ther. 8:853–864. 2008. View Article : Google Scholar : PubMed/NCBI
|
|
21
|
Ramirez P and DiPersio JF: Therapy options
in imatinib failures. Oncologist. 13:424–434. 2008. View Article : Google Scholar : PubMed/NCBI
|
|
22
|
Maekawa T, Ashihara E and Kimura S: The
Bcr-Abl tyrosine kinase inhibitor imatinib and promising new agents
against Philadelphia chromosome-positive leukemias. Int J Clin
Oncol. 12:327–340. 2007. View Article : Google Scholar : PubMed/NCBI
|
|
23
|
Deininger M, Buchdunger E and Druker BJ:
The development of imatinib as a therapeutic agent for chronic
myeloid leukemia. Blood. 105:2640–2653. 2005. View Article : Google Scholar
|
|
24
|
Papadopoulou LC, Kyriazou AV, Bonovolias
ID and Tsiftsoglou AS: Imatinib inhibits the expression of SCO2 and
FRATAXIN genes that encode mitochondrial proteins in human Bcr-Abl+
leukemia cells. Blood Cells Mol Dis. 53:84–90. 2014. View Article : Google Scholar : PubMed/NCBI
|
|
25
|
Chang SP, Shen SC, Lee WR, Yang LL and
Chen YC: Imatinib mesylate induction of ROS-dependent apoptosis in
melanoma B16F0 cells. J Dermatol Sci. 62:183–191. 2011. View Article : Google Scholar : PubMed/NCBI
|
|
26
|
Redza-Dutordoir M and Averill-Bates DA:
Activation of apoptosis signalling pathways by reactive oxygen
species. Biochim Biophys Acta. 1863:2977–2992. 2016. View Article : Google Scholar : PubMed/NCBI
|
|
27
|
Perillo B, Di Donato M, Pezone A, Di Zazzo
E, Giovannelli P, Galasso G, Castoria G and Migliaccio A: ROS in
cancer therapy: the bright side of the moon. Exp Mol Med.
52:192–203. 2020. View Article : Google Scholar : PubMed/NCBI
|
|
28
|
Kon S, Ishibashi K, Katoh H, Kitamoto S,
Shirai T, Tanaka S, Kajita M, Ishikawa S, Yamauchi H and Yako Y:
Cell competition with normal epithelial cells promotes apical
extrusion of transformed cells through metabolic changes. Nat Cell
Biol. 19:530–541. 2017. View Article : Google Scholar : PubMed/NCBI
|
|
29
|
Tataranni T and Piccoli C: Dichloroacetate
(DCA) and cancer: An overview towards clinical applications. Oxid
Med Cell Longev. 2019:82010792019. View Article : Google Scholar : PubMed/NCBI
|
|
30
|
Delaney LM, Ho N, Morrison J, Farias NR,
Mosser DD and Coomber BL: Dichloroacetate affects proliferation but
not survival of human colorectal cancer cells. Apoptosis. 20:63–74.
2015. View Article : Google Scholar
|
|
31
|
Michelakis ED, Webster L and Mackey JR:
Dichloroacetate (DCA) as a potential metabolic-targeting therapy
for cancer. Br J Cancer. 99:989–994. 2008. View Article : Google Scholar : PubMed/NCBI
|
|
32
|
Castro I, Sampaio-Marques B and Ludovico
P: Targeting metabolic reprogramming in acute myeloid leukemia.
Cells. 8:9672019. View Article : Google Scholar : PubMed/NCBI
|
|
33
|
Zhang JY, Zhang F, Hong CQ, Giuliano AE,
Cui XJ, Zhou GJ, Zhang GJ and Cui YK: Critical protein GAPDH and
its regulatory mechanisms in cancer cells. Cancer Biol Med.
12:10–22. 2015.PubMed/NCBI
|
|
34
|
Gupta V and Bamezai RNK: Human pyruvate
kinase M2: A multifunctional protein. Protein Sci. 19:2031–2044.
2010. View Article : Google Scholar : PubMed/NCBI
|
|
35
|
Pouysségur J and Ždralević M: Reply to
beltinger: Double genetic disruption of lactate dehydrogenases A
and B is required to ablate the 'Warburg effect' restricting tumor
growth to oxidative metabolism. J Biol Chem. 294:672019. View Article : Google Scholar
|
|
36
|
Beltinger C: LDHA and LDHB are dispensable
for aerobic glycolysis in neuroblastoma cells while promoting their
aggressiveness. J Biol Chem. 294:662019. View Article : Google Scholar : PubMed/NCBI
|
|
37
|
Ždralević M, Brand A, Di Ianni L, Dettmer
K, Reinders J, Singer K, Peter K, Schnell A, Bruss C, Decking SM,
et al: Double genetic disruption of lactate dehydrogenases A and B
is required to ablate the 'Warburg effect' restricting tumor growth
to oxidative metabolism. J Biol Chem. 293:15947–15961. 2018.
View Article : Google Scholar
|
|
38
|
Valvona CJ, Fillmore HL, Nunn PB and
Pilkington GJ: The regulation and function of lactate dehydrogenase
A: Therapeutic potential in brain tumor. Brain Pathol. 26:3–17.
2016. View Article : Google Scholar
|
|
39
|
Missiaen R, Lesner NP and Simon MC: HIF: A
master regulator of nutrient availability and metabolic cross-talk
in the tumor microenvironment. EMBO J. 42:e1120672023. View Article : Google Scholar : PubMed/NCBI
|
|
40
|
Stubbs M and Griffiths JR: The altered
metabolism of tumors: HIF-1 and its role in the Warburg effect. Adv
Enzyme Regul. 50:44–55. 2010. View Article : Google Scholar
|
|
41
|
Gavriilidis GI, Ntoufa S, Papakostantinou
N, Kotta K, Koletsa T, Chartomatsidou E, Moysiadis T, Stavroyianni
N, Anagnostopoulos A, Papadaki E, et al: Stem cell factor is
implicated in microenvironmental interactions and cellular dynamics
of chronic lymphocytic leukemia. Haematologica. 106:692–700. 2021.
View Article : Google Scholar :
|
|
42
|
Eberle F, Leinberger FH, Saulich MF,
Seeger W, Engenhart-Cabillic R, Hänze J, Hattar K, Dikomey E and
Subtil FSB: In cancer cell lines inhibition of SCF/c-Kit pathway
leads to radiosensitization only when SCF is strongly
over-expressed. Clin Transl Radiat Oncol. 2:69–75. 2017.PubMed/NCBI
|
|
43
|
Chiang SK, Chen SE and Chang LC: The role
of HO-1 and its crosstalk with oxidative stress in cancer cell
survival. Cells. 10:24012021. View Article : Google Scholar : PubMed/NCBI
|
|
44
|
Andrés NC, Fermento ME, Gandini NA, Romero
AL, Ferro A, Donna LG, Curino AC and Facchinetti MM: Heme
oxygenase-1 has antitumoral effects in colorectal cancer:
Involvement of p53. Exp Mol Pathol. 97:321–331. 2014. View Article : Google Scholar : PubMed/NCBI
|
|
45
|
Lingappan K: NF-κB in oxidative stress.
Curr Opin Toxicol. 7:81–86. 2018. View Article : Google Scholar : PubMed/NCBI
|
|
46
|
Johnson RF and Perkins ND: Nuclear
factor-κB, p53, and mitochondria: Regulation of cellular metabolism
and the Warburg effect. Trends Biochem Sci. 37:317–324. 2012.
View Article : Google Scholar : PubMed/NCBI
|
|
47
|
Mauro C, Leow SC, Anso E, Rocha S,
Thotakura AK, Tornatore L, Moretti M, De Smaele E, Beg AA,
Tergaonkar V, et al: NF-κB controls energy homeostasis and
metabolic adaptation by upregulating mitochondrial respiration. Nat
Cell Biol. 13:1272–1279. 2011. View Article : Google Scholar : PubMed/NCBI
|
|
48
|
Lozzio BB and Lozzio CB: Properties and
usefulness of the original K-562 human myelogenous leukemia cell
line. Leuk Res. 3:363–370. 1979. View Article : Google Scholar : PubMed/NCBI
|
|
49
|
Głowacki S, Synowiec E, Szwed M, Toma M,
Skorski T and Śliwiński T: Relationship between oxidative stress
and imatinib resistance in model chronic myeloid leukemia cells.
Biomolecules. 11:6102021. View Article : Google Scholar :
|
|
50
|
Lee F, Fandi A and Voi M: Overcoming
kinase resistance in chronic myeloid leukemia. Int J Biochem Cell
Biol. 40:334–343. 2008. View Article : Google Scholar : PubMed/NCBI
|
|
51
|
Bunz F, Dutriaux A, Lengauer C, Waldman T,
Zhou S, Brown JP, Sedivy JM, Kinzler KW and Vogelstein B:
Requirement for p53 and p21 to sustain G2 arrest after DNA damage.
Science. 282:1497–1501. 1998. View Article : Google Scholar : PubMed/NCBI
|
|
52
|
Bourdon JC: p53 and its isoforms in
cancer. Br J Cancer. 97:277–282. 2007. View Article : Google Scholar : PubMed/NCBI
|
|
53
|
Georgiou-Siafis SK and Tsiftsoglou AS:
Activation of KEAP1/NRF2 stress signaling involved in the molecular
basis of hemin-induced cytotoxicity in human pro-erythroid K562
cells. Biochem Pharmacol. 175:1139002020. View Article : Google Scholar : PubMed/NCBI
|
|
54
|
Foltopoulou PF, Tsiftsoglou AS, Bonovolias
ID, Ingendoh AT and Papadopoulou LC: Intracellular delivery of full
length recombinant human mitochondrial L-Sco2 protein into the
mitochondria of permanent cell lines and SCO2 deficient patient's
primary cells. Biochim Biophys Acta. 1802:497–508. 2010. View Article : Google Scholar : PubMed/NCBI
|
|
55
|
Bradford M: A rapid and sensitive method
for the quantitation of microgram quantities of protein utilizing
the principle of Protein-dye binding. Anal Biochem. 72:248–254.
1976. View Article : Google Scholar : PubMed/NCBI
|
|
56
|
Eruslanov E and Kusmartsev S:
Identification of ROS using oxidized DCFDA and flow-cytometry.
Methods Mol Biol. 594:57–72. 2010. View Article : Google Scholar : PubMed/NCBI
|
|
57
|
Szklarczyk D, Gable AL, Nastou KC, Lyon D,
Kirsch R, Pyysalo S, Doncheva NT, Legeay M, Fang T, Bork P, et al:
The STRING database in 2021: Customizable protein-protein networks,
and functional characterization of user-uploaded gene/measurement
sets. Nucleic Acids Res. 49:108002021. View Article : Google Scholar
|
|
58
|
Bunz F, Hwang PM, Torrance C, Waldman T,
Zhang Y, Dillehay L, Williams J, Lengauer C, Kinzler KW and
Vogelstein B: Disruption of p53 in human cancer cells alters the
responses to therapeutic agents. J Clin Invest. 104:263–269. 1999.
View Article : Google Scholar : PubMed/NCBI
|
|
59
|
Shimizu R, Lan NN, Tai TT, Adachi Y,
Kawazoe A, Mu A and Taketani S: P53 directly regulates the
transcription of the human frataxin gene and its lack of regulation
in tumor cells decreases the utilization of mitochondrial iron.
Gene. 551:79–85. 2014. View Article : Google Scholar : PubMed/NCBI
|
|
60
|
Zhou Y, Niu W, Luo Y, Li H, Xie Y, Wang H,
Liu Y, Fan S, Li Z, Xiong W, et al: p53/Lactate dehydrogenase A
axis negatively regulates aerobic glycolysis and tumor progression
in breast cancer expressing wild-type p53. Cancer Sci. 110:939–949.
2019. View Article : Google Scholar : PubMed/NCBI
|
|
61
|
Ciarcia R, Vitiello MT, Galdiero M,
Pacilio C, Iovane V, d'Angelo D, Pagnini D, Caparrotti G, Conti D,
Tomei V, et al: Imatinib treatment inhibit IL-6, IL-8, NF-KB and
AP-1 production and modulate intracellular calcium in CML patients.
J Cell Physiol. 227:2798–2803. 2012. View Article : Google Scholar
|
|
62
|
Teppo HR, Soini Y and Karihtala P:
Reactive oxygen Species-mediated mechanisms of action of targeted
cancer therapy. Oxid Med Cell Longev. 2017:14852832017. View Article : Google Scholar : PubMed/NCBI
|
|
63
|
Rockwell S, Sartorelli AC, Tomasz M and
Kennedy KA: Cellular pharmacology of quinone bioreductive
alkylating agents. Cancer Metastasis Rev. 12:165–176. 1993.
View Article : Google Scholar : PubMed/NCBI
|
|
64
|
Kennedy KA, Teicher BA, Rockwell S and
Sartorelli AC: The hypoxic tumor cell: A target for selective
cancer chemotherapy. Biochem Pharmacol. 29:1–8. 1980. View Article : Google Scholar : PubMed/NCBI
|
|
65
|
Li Y, Zhao L and Li XF: Targeting Hypoxia:
Hypoxia-activated prodrugs in cancer therapy. Front Oncol.
11:29202021.
|
|
66
|
Patraa S and Barondeaua DP: Mechanism of
activation of the human cysteine desulfurase complex by frataxin.
Proc Natl Acad Sci USA. 116:19421–19430. 2019. View Article : Google Scholar
|
|
67
|
Parent A, Elduque X, Cornu D, Belot L, Le
Caer JP, Grandas A, Toledano MB and D'Autréaux B: Mammalian
frataxin directly enhances sulfur transfer of NFS1 persulfide to
both ISCU and free thiols. Nat Commun. 6:56862015. View Article : Google Scholar : PubMed/NCBI
|
|
68
|
Grosso S, Puissant A, Dufies M, Colosetti
P, Jacquel A, Lebrigand K, Barbry P, Deckert M, Cassuto JP, Mari B
and Auberger P: Gene expression profiling of imatinib and
PD166326-resistant CML cell lines identifies Fyn as a gene
associated withresistance to BCR-ABL inhibitors. Mol Cancer Ther.
8:1924–1933. 2009. View Article : Google Scholar : PubMed/NCBI
|
|
69
|
Bosc C, Selak MA and Sarry JE: Resistance
is futile: Targeting mitochondrial energetics and metabolism to
overcome drug resistance in cancer treatment. Cell Metab.
26:705–707. 2017. View Article : Google Scholar : PubMed/NCBI
|
|
70
|
Allende-Vega N, Krzywi nska E, Orecchioni
S, Lopez-Royuela N, Reggiani F, Talarico G, Rossi JF, Rossignol R,
Hicheri Y, Cartron G, et al: The presence of wild type p53 in
hematological cancers improves the efficacy of combinational
therapy targeting metabolism. Oncotarget. 6:19228–19245. 2015.
View Article : Google Scholar : PubMed/NCBI
|
|
71
|
Maio N, Jain A and Rouault TA: Mammalian
iron-sulfur cluster biogenesis: Recent insights into the roles of
frataxin, acyl carrier protein and ATPase-mediated transfer to
recipient proteins. Curr Opin Chem Biol. 55:34–44. 2020. View Article : Google Scholar : PubMed/NCBI
|
|
72
|
Sawamoto M, Imai T, Umeda M, Fukuda K,
Kataoka T and Taketani S: The p53-dependent expression of frataxin
controls 5-aminolevulinic acid-induced accumulation of
protoporphyrin IX and photo-damage in cancerous cells. Photochem
Photobiol. 89:163–172. 2013. View Article : Google Scholar
|
|
73
|
Parczyk J, Ruhnau J, Pelz C, Schilling M,
Wu H, Piaskowski NN, Eickholt B, Kühn H, Danker K and Klein A:
Dichloroacetate and PX-478 exhibit strong synergistic effects in a
various number of cancer cell lines. BMC Cancer. 21:4812021.
View Article : Google Scholar : PubMed/NCBI
|
|
74
|
Sanchez WY, McGee SL, Connor T, Mottram B,
Wilkinson A, Whitehead JP, Vuckovic S and Catley L: Dichloroacetate
inhibits aerobic glycolysis in multiple myeloma cells and increases
sensitivity to bortezomib. Br J Cancer. 108:1624–1633. 2013.
View Article : Google Scholar : PubMed/NCBI
|
|
75
|
Rickard BP, Overchuk M, Chappell VA, Kemal
Ruhi M, Sinawang PD, Nguyen Hoang TT, Akin D, Demirci U, Franco W,
Fenton SE, et al: Methods to evaluate changes in mitochondrial
structure and function in cancer. Cancers (Basel). 15:25642023.
View Article : Google Scholar : PubMed/NCBI
|