Introduction
Liver cancer, the third leading cause of
cancer-associated death worldwide (1), with an estimated 865,269 new liver
cancer cases and 757,948 related deaths occurring worldwide in
2022, poses a significant public health challenge, especially in
China, where the 5-year survival rate was 12.1% from 1990 to 2021
(2). By 2040, liver cancer may
result in ~1.3 million fatalities worldwide (3,4).
The pathogenesis of liver cancer is associated with chronic
hepatitis infection, fatty liver disease, cirrhosis, long-term
exposure to carcinogens, such as aflatoxin, and excessive alcohol
consumption (5). Despite
advancements in the prevention, detection and treatment of liver
cancer, the majority of patients are diagnosed at advanced stages
of the disease (2). Treatment is
further hindered by challenges such as drug resistance and high
recurrence rates.
Sorafenib, the US Food and Drug
Administration-sanctioned multi-kinase inhibitor, is the sole
first-line systemic therapy for liver cancer. However, its
therapeutic efficacy remains limited (6). The SHARP trial (trial no.
NCT00105443) demonstrated that sorafenib could extend overall
survival by 2.8 months (7). In
addition, the majority of patients do not experience long-term
benefits due to the early onset of resistance to sorafenib. It has
also been reported that ~30% of patients benefit from sorafenib,
and resistance typically develops within 6 months (8). The mechanisms underlying sorafenib
resistance remain poorly understood. Given the limited efficacy of
the current treatment strategies, identifying novel therapeutic
targets and resolving sorafenib resistance are key for advancing
liver cancer therapy.
The direct effect of sorafenib on liver cancer cells
stems from ferroptosis induction rather than cell apoptosis
(9,10). Ferroptosis represents a form of
iron-dependent programmed cell death, which is triggered by lethal
lipid peroxidation (11,12). The morphological hallmarks of
ferroptosis include diminished mitochondrial cristae and atrophy
(11). Both iron chelators and
lipophilic antioxidants impede ferroptosis. Sensitivity to
ferroptosis can be augmented by excessive iron influx, either via
the interaction between transferrin and transferrin receptor or via
enhanced free iron availability resulting from selective ferritin
degradation, also known as ferritinophagy. Furthermore, impairments
in phospholipid peroxidases, particularly glutathione peroxidase 4
(GPX4) and the upstream cystine transporter solute carrier family 7
member 11 (SLC7A11), promote susceptibility to uncontrolled lipid
peroxidation and ferroptosis (13). As a result, depleted glutathione
(GSH) fails to protect cells from oxidative stress and lipid
peroxidation. Therefore, the accumulation of free iron and lipid
peroxidation are hallmarks of ferroptosis. Sorafenib could directly
inhibit SLC7A11, thereby inhibiting GSH biosynthesis (8). Therefore, targeting ferroptosis may
offer a promising therapeutic strategy to overcome sorafenib
resistance.
Mitochondria exert pleiotropic functions in normal
physiology, including energy conversion, regulation of apoptosis,
biosynthetic metabolism and cellular proliferation (14,15). They also serve a key role in
stress sensing, environmental adaptation and tumorigenesis
(16). Additionally, mitochondria
are associated with tumor development, progression and resistance
to therapy via generating reactive oxygen species (ROS), thus
inducing genomic instability and modulating gene expression and
signaling pathways (17-21). Alterations in mitochondrial DNA
(mtDNA) are associated with cell and metabolic consequences and
have been implicated in the diagnosis, prognosis and treatment of
several types of tumors (22).
Single-strand DNA-binding protein 1 (SSBP1), a homologue of
Escherichia coli SSB, serves key roles in mtDNA metabolism
and mtDNA replication via binding to single-stranded DNA (23,24). A study demonstrated that following
DNA damage, SSBP1 promptly localizes to double-strand DNA breaks
(DSBs) and is involved in DSB homology-directed repair (25). The aberrant expression of SSBP1 is
associated with several pathological conditions, including organ
dysfunction, neurodegenerative disease and cancer (26,27). Another study also showed that
SSBP1 knockout suppresses tumor cell proliferation, thus suggesting
that SSBP1 may serve as a potential therapeutic target for
glioblastoma (28). However, the
role of SSBP1 in liver cancer initiation, progression and sorafenib
resistance remains poorly understood. Therefore, the present study
aimed to investigate the effects of SSBP1 on mitochondrial
function, cell proliferation, migration and ferroptosis, as well as
the association between SSBP1 expression, sorafenib resistance and
patient prognosis. The present study aimed to determine whether
SSBP1 modulates sorafenib sensitivity via ROS-mediated ferroptosis
pathways, to identify a potential therapeutic target to overcome
drug resistance and improve patient outcomes.
Materials and methods
Animals
A total of six male C57BL/6J mice (age, 8-10 weeks;
weight, 20-25 g) were purchased from Beijing Vital River Laboratory
Animal Technology Co., Ltd. All animal experiments were performed
according to international guidelines and approved by the Animal
Care and Use Committee of Tianjin Medical University (approval no.
TMUaMEC2024050; Tianjin, China). Animals were maintained under
specific-pathogen-free conditions (21-23°C; humidity, 60-65%;
light/dark cycle, 12:12 h; free access to food/water). A
diethylnitrosamine (DEN)-induced liver cancer mouse model was
established as previously described (29). Briefly, 2-week-old C57BL/6J mice
(weight, 8-12 g) were intraperitoneally administered 25 mg/kg body
weight DEN (cat. no. W610685; Energy Chemical) (Fig. S1A). When they reached 4 weeks of
age, mice were treated with weekly intraperitoneal injection of
CCl4 (5 ml/kg body weight, at a concentration of 10% in
olive oil) for a total of 20 times. Mice were monitored daily for
signs of distress and weighed three times/week. Abdominal
distension was assessed by palpation twice/week. Behavioral
parameters, including feeding efficiency and locomotor activity,
were recorded daily. At 24 weeks, all mice were euthanized via
inhalational exposure to CO2 (40% chamber volume/min) in
a sealed chamber, followed by confirmation of death through absence
of cardiac and respiratory function for 5 min. The humane endpoints
were defined as follows: i) Tumor volume >2×10³
mm3; ii) tumor diameter >20 mm; iii) rapid or
continuous body weight loss >20% within 72 h; iv) tumor
ulceration or necrosis leading to skin rupture or persistent
exudation for >48 h and v) abdominal distension or ascites
burden >10% of body weight, exhibiting an appearance analogous
to that of a pregnant mouse compared with age-matched control mice.
Liver tissue samples were collected following euthanasia. Cancer
and adjacent paracancerous tissues were dissected, with the normal
adjacent tissues sampled at a distance of ≥0.5 cm from the tumor
margin to ensure clear distinction. All tissue samples were
immediately snap-frozen in liquid nitrogen (−196°C) for subsequent
analyses.
Cells and transfection
Hep3B, HepG2, Huh7, Hepa1-6 and 293T cells were
obtained from the American Type Culture Collection. The cells were
cultured in DMEM (cat. no. MA0212; Dalian Meilun Biology Technology
Co., Ltd.) supplemented with 10% fetal bovine serum (FBS; cat. no.
MN012103; Mengma (Tianjin) Biotechnology Co., Ltd.) and 1%
antibiotics at 37°C under a 5% CO2 atmosphere. A total
of 20 μg lentiCRISPRv2 (cat. no. 52961; Addgene, Inc.)
served as the core plasmid for constructing knockout-SSBP1 (for
both mouse and human sources), and H128
pLenti-EF1α-EGFP-3FLAG-PGK-Puro (HeYuan Biotechnology Co., Ltd.)
for SSBP1 overexpression. Additionally, packaging plasmids (5
μg pMD2.G and 15 μg psPAX2, second-generation
lentiviral packaging plasmids) were purchased from Addgene, Inc.
The plasmids [sg-SSBP1 (sg, single-guide RNA),
5′-CACCGCAAGTGACTACCTGTAATAC-3′; sg-Ssbp1 (sg, single-guide RNA),
5′-CACCGGATAGTGAAGTATACCAAAT-3′; SSBP1-Flag, forward,
5′-CCGGAATTCATGTTTCGAAGACCTGTATTAC-3′ and reverse,
5′-CCTGGATCCTTCCTCTTTGCTGTCTG-3′] or control plasmids, along with
packaging plasmids, were co-transfected into 293T cells
(5×10⁵ cells/well) of a 6 well plate using
polyethyleneimine (cat. no. 408727; Sigma-Aldrich). The
transfection was performed according to the manufacturer's protocol
at 37°C for 6-8 h. medium was replaced with DMEM containing 10% FBS
(cat. no. MN012103; Mengma (Tianjin) Biotechnology Co., Ltd.).
Following incubation at 37°C for 24 and 48 h, viral particles were
collected and filtered through a 0.45 μm filter. After
filtration, centrifugation was performed at 4°C for 2 h at 60,000 ×
g. At one day before infection, Hep3B, HepG2, Huh7, Hepa1-6 cells
were passaged into 6 well plates, and infection was performed when
the cell confluency reached 70%. Before infection, fresh complete
medium was added, 10-20 μl viral solution was introduced,
the plate was shaken to mix evenly and then incubated at 37°C.
After 8 h, the medium was replaced with fresh complete medium. At
48 h later, puromycin (2 μg/ml) was added for selection.
Following viral infection, Hep3B, HepG2, Huh7 and Hepa1-6 cells
were maintained in medium containing 2 μg/ml puromycin (cat.
no. P8230; Beijing Solarbio Science & Technology Co., Ltd.) to
establish stable cell lines with SSBP1 knockout and SSBP1
overexpression. The successful establishment of the aforementioned
cell lines was verified by western blotting.
Drugs
Sorafenib (cat. no. S1040; Selleck Chemicals) was
dissolved in DMSO to a final concentration of 10 mM/ml. Hep3B cells
were seeded in 6-well plates at a density of 1×10⁵
cells/well and treated with 8 μM sorafenib for 12 h at
37°C.
Datasets and analysis
The Cancer Genome Atlas Liver Hepatocellular
Carcinoma (TCGA-LIHC) data-sets were retrieved from the National
Cancer Institute (NCI) Genomic Data Commons (30) (portal.gdc.cancer.gov/projects/TCGA-LIHC, accession
no. phs000178), while the mitochondrial localization gene set was
sourced from MitoCarta3.0 (31)
(https://www.broadinstitute.org/mitocarta/mitocarta30-inventory-mammalian-mitochondrial-proteins-and-pathways).
Differentially expressed genes (DEGs), were identified using R
language (32) (version 3.6.2;
http://www.r-project.org/) with the criteria of
|log2 fold change (log2FC)|>1.0 (corresponding to a more than
2-fold absolute change in expression) and adjusted P-value <0.05
(to control for false discovery rate in multiple testing), and
analyzed with the Metascape online tool (33) (Metascape 3.5; https://metascape.org/gp/index.html#/main/step1).
GSE14520 (34) (https://www.ncbi.nlm.nih.gov/geo/query/acc.cgi?acc=GSE14520),
GSE101685 (35) (https://www.ncbi.nlm.nih.gov/geo/query/acc.cgi?acc=GSE101685),
GSE151412 (36) (https://www.ncbi.nlm.nih.gov/geo/query/acc.cgi?acc=GSE151412)
and GSE62813 (37) (ncbi.nlm.nih.gov/geo/query/acc.cgi?acc=GSE62813)
datasets were downloaded from National Center for Biotechnology
Information (NCBI) Gene Expression Omnibus (GEO) profiles (38) (https://www.ncbi.nlm.nih.gov/geo/), and the relative
mRNA expression levels of SSBP1 and POLG (DNA polymerase gamma)
within these cohorts were analyzed. The expression patterns of
SSBP1 across TCGA in cancer were analyzed using the TIMER2.0
(39) (http://timer.cistrome.org/) and UALCAN (40) (https://ualcan.path.uab.edu/) analysis tools. The
effects of SSBP1 on the survival of patients with liver cancer and
those undergoing treatment with sorafenib were evaluated using the
Kaplan Meier Plotter online survival analysis tool (41) (https://kmplot.com/analysis/).
Reverse transcription-quantitative
(RT-qPCR)
Total RNA was extracted from tumor tissue or cells
using the TransZol Up RNA isolation reagent (cat. no. ET111-01-V2;
TransGen Biotech Co., Ltd.) and reverse-transcribed into cDNA with
the TransScriptII First Strand cDNA Synthesis SuperMix (cat. no.
11120ES60; Shanghai Yeasen Biotechnology Co., Ltd.), according to
the manufacturer's instructions. qPCR analysis was performed using
the SYBR Green PCR Mix (cat. no. 11200ES; Shanghai Yeasen
Biotechnology Co., Ltd.) and targeted gene-specific primers
(Table SI). The thermocycling
conditions were as follows: Initial denaturation at 95°C for 30
sec, followed by 40 cycles at 95°C for 10 sec, 60°C for 10 sec, and
60°C for 30 sec. The relative mRNA expression levels were
calculated using the ΔΔCq method (42), while β-actin served as an internal
control. All primers were designed by NCBI and were synthesized by
Genewiz, Inc.
To measure the copy number of mtDNA, genomic DNA
extracted from liver cancer tissue or cells was quantified using
qPCR. The primer sequences used are presented in Table SII.
Western blot analysis
Western blot analysis was performed as previously
described (43). Briefly, total
protein was extracted from tumor tissue and cells using RIPA lysis
buffer (cat. no. WB3100; NCM Biotech; www.). The protein
concentration was determined using a BCA kit (cat. no. CW0014S;
Jiangsu CoWin Biotech Co., Ltd.) and equal amounts of protein (50
μg/lane) were separated by 10% SDS-PAGE, followed by
electrotransferring onto a PVDF membrane (MilliporeSigma).
Following blocking with 10% skimmed milk powder solution for 2 h at
room temperature, the PVDF membrane was incubated with primary
antibodies against SSBP1 (anti-rabbit; cat. no. 12212-1-AP),
voltage-dependent anion channel (VDAC; anti-rabbit; cat. no.
10866-1-AP; both 1:1,000; both Proteintech Group, Inc.), Flag
(anti-mouse; cat. no. F1804; Merck KGaA; 1:10,000), translocase of
the outer mitochondrial membrane 20 (TOM20; anti-rabbit; cat. no.
A19403; 1:5,000), glutathione peroxidase 4 (GPX4; anti-rabbit; cat.
no. A11243), SLC7A11 (anti-rabbit; cat. no. A13685; both 1:1,000),
and β-actin (anti-rabbit; cat. no. AC026; 1:100,000; all from
ABclonal Biotech Co., Ltd.) at 4°C overnight. Following washing
with PBST (containing 0.1% Tween-20) three times (5 min each), the
membrane was incubated with the corresponding Peroxidase
AffiniPure™ Goat Anti-Mouse (cat. no. 115-035-003) and anti-Rabbit
IgG (H+L; cat. no. 111-035-003; both 1:10,000; both Jackson
ImmunoResearch Laboratories, Inc.) secondary antibodies at room
temperature for 1.5 h. The membrane was washed with PBST three
times and the immunoreactive signals were detected using the ECL
Western Blotting Detection Reagent (cat. no. CW0049M; Jiangsu CoWin
Biotech Co., Ltd.). The protein bands were scanned using the
MiniChemi 610 chemiluminescence imaging system (SinSage Technology,
Co., Ltd.) and relative intensity was semi-quantified by ImageJ
software (ImageJ 2.0; National Institutes of Health). β-actin
served as an endogenous control.
Cell viability assay
Cell viability was assessed using MTT reagent (cat.
no. M8180; Beijing Solarbio Science & Technology Co., Ltd.), as
previously described (44).
Briefly, liver cancer cells were plated into 96 well plates at a
density of 3×10³ cells/well and incubated either in the
presence or absence of sorafenib (8 μM). Following
incubation at 37°C for 24, 48, and 72 h, respectively the culture
medium was replaced with 100 μl MTT reagent (0.5 mg/ml),
followed by incubation for 4 h at 37°C. Then, the purple formazan
was dissolved in dimethyl sulfoxide (DMSO). Absorbance at a
wavelength of 490 nm was measured using a microplate reader
(45).
Colony formation assay
Liver cancer cells were seeded into 6-well plates at
a density of 1×10³ cells/well in the presence or absence
of sorafenib (2.5 μM) at 37°C for ~2 weeks. Cells were
washed with PBS, fixed with 4% paraformaldehyde for 20 min, and
stained with 0.1% crystal violet solution (cat. no. G1064; Beijing
Solarbio Science & Technology Co., Ltd.) for 30 min, both at
room temperature. The colonies (>50 cells) were counted using
ImageJ software (ImageJ 2.0; National Institutes of Health) and
images were captured under a light microscope (magnification,
×40).
Transwell assay
The migration of liver cancer cells were assessed
using 24 well Transwell chambers. The upper and lower culture
compartments were separated by polycarbonate membranes with 8
μm pores (Corning, Inc.). The bottom chamber was filled with
DMEM (cat. no. MA0212; Dalian Meilun Biology Technology Co., Ltd.)
supplemented with 20% FBS (cat. no. MN012103; Mengma (Tianjin)
Biotechnology Co., Ltd.) as a chemoattractant. A total of
5×10⁴ cells in serum-free DMEM (were seeded into the
upper chamber and incubated at 37°C for 48 h in a humidified
incubator with 5% CO2. The cells that migrated to the
underside of the membrane were stained with 0.1% crystal violet
solution (cat. no. G1064; Beijing Solarbio Science & Technology
Co., Ltd.) for 15 min at room temperature and images were captured
under a light microscope (magnification, ×40).
Wound healing assay
Liver cancer cells (Hep3B and Hepa1-6 cells) were
cultured in a 6 well plate until ~100% confluence and a scratch was
made. Following washing with PBS to remove detached cells, cells
were then cultured under serum-free conditions for 24 h. Images
were captured under a light microscope at 0 and 24 h to record the
changes in wound width (magnification, ×40). Wound distance was
expressed as ratio to the initial distance at 0 h.
Immunofluorescence staining
Mitochondrial morphology was evaluated using the
MitoTracker®-Red kit (cat. no. C1035; Beyotime Institute
of Biotechnology), according to the manufacturer's instructions.
Briefly, liver cancer cells cultured in cell chambers at 37°C were
treated in the presence or absence of sorafenib (8 μM, 12 h
at 37°C). Following washing with PBS, cells were incubated in
serum-free DMEM (cat. no. MA0212; Dalian Meilun Biology Technology
Co., Ltd.) supplemented with Mito-Tracker Red CMXRos (1:1,000) for
30 min at 37°C. After washing with PBS, 1 ml serum-free medium was
added to the cell chamber. A total of ≥8 randomly selected
fields/sample were observed under a laser confocal scanning
microscope (LSM-800; Carl Zeiss AG).
Mitochondrial mass determination
Following treatment with sorafenib (8 μM, 12
h at 37°C), cells were harvested and centrifuged at 300 × g for 5
min at room temperature. Following washing with PBS three times,
cells were incubated with the MitoTracker®-Red probe for
30 min at 37°C. Cells were washed three times with PBS and analyzed
using a 579 nm channel flow cytometer (BD FACSVerse; BD
Biosciences). Data analysis was performed using FlowJo software
(version 10.8.1; Tree Star, Inc.).
ROS analysis
ROS levels were measured using a DCFH-DA assay (cat.
no. S0035S; Beyotime Institute of Biotechnology), according to the
manufacturer's instructions. Liver cancer cells were seeded into 6
well plates at a density of 1×10⁵ cells per well and
treated in the presence or absence of sorafenib (8 μM) at
37°C for 12 h. Cells were washed with PBS three times and the
fluorescence intensity was measured using a microplate reader, as
previously described (44). A
total of 1×10⁴ cells/sample were analyzed on a BD
FACSVerse flow cytometer (BD Biosciences) using an argon-ion laser
(15 mW) and an incident beam at 488 nm. Data analysis was performed
using FlowJo software (version 10.8.1; Tree Star, Inc.).
JC-1 assay
Mitochondrial membrane potential (MMP) was measured
using a JC-1 assay kit (cat. no. C2003S; Beyotime Institute of
Biotechnology), according to the manufacturer's instructions. Hep3B
cells were collected following centrifugation at 600 × g for 4 min
at room temperature and washed twice with PBS. Cells were incubated
with the JC-1 dye in the dark at 37°C for 20 min. Following gently
washing with PBS twice, the cells were analyzed using a BD
FACSVerse flow cytometer (BD Biosciences) to detect aggregates and
monomers. Data analysis was performed using FlowJo software
(version 10.8.1; Tree Star, Inc.). MMP was calculated as the ratio
of the fluorescence intensity of aggregates to that of
monomers.
Cell death assay
Following centrifugation at 600 × g for 5 min at
room temperature, 5×10⁵ Hep3B cells were collected and
washed twice with PBS. The cells were re-suspended in PBS and
stained with propidium iodide and Annexin (cat. no. C1067S;
Beyotime Institute of Biotechnology) in the dark for 20 min. Cells
were washed with PBS and 1×10⁴ cells/sample were
analyzed on a BD FACSVerse flow cytometer (BD Biosciences) equipped
with a 15 mW argon-ion laser and an incident beam at 488 nm. Data
analysis was performed using FlowJo software (version 10.8.1; Tree
Star, Inc.). Cell death was calculated as the percentage of cells
positive for propidium iodide fluorescence (46).
Detection of lipid peroxidation
C11-BODIPY581/591 (5 μM; cat. no.
D3861; Thermo Fisher Scientific, Inc.) was used to measure lipid
ROS levels. Hep3B cells seeded into glass-bottom cell culture
dishes at a density of 2×10⁵ cells/ml, were treated with
sorafenib (8 μM, 12 h at 37°C) and incubated with
C11-BODIPY581/591 for 30 min at room temperature.
Following washing with PBS three times, ≥50 cells/group were
observed under a confocal microscope (Carl Zeiss AG) and the
fluorescence intensity was measured using ImageJ software (ImageJ
2.0; National Institutes of Health). FITC/PE ratio was used to
determine lipid oxidation, and the mean ratio of each group was
normalized to that of the control.
Statistical analysis
All statistical analyses were performed with SPSS
software (version 26.0; IBM Corp.). All data are expressed as the
mean ± SD, and all experiments were repeated at least three times.
Unpaired two-tailed Student's t-test was used for comparisons
between two groups when data passed normality and equal variance
test; otherwise, the Mann-Whitney test was used. For data that were
normally distributed containing >2 groups, one-way ANOVA was
used followed by Tukey's comparison post hoc test. P<0.05 was
considered to indicate a statistically significant difference.
Results
High SSBP1 expression is associated with
the progression and poor prognosis of liver cancer
Among all mitochondrial-localized genes, 225 DEGs
were identified between liver cancer and normal tissue, including
85 up and 170 downregulated genes (Fig. 1A). To determine the main functions
of DEGs, the Metascape online tool was utilized. The analysis
revealed that the DEGs were primarily enriched in 'mitochondrion
organization' (Fig. 1B). Among 17
genes involved in mitochondrial biogenesis, eight genes, namely
ALAS1, SIRT3, TFAM, TFB2M, SSBP1, CYCS, POLRMT and POLG, were
significantly associated with liver cancer phenotypes within the
TCGA-LIHC datasets (data not shown). A DEN-induced liver cancer
mouse model was established and RT-qPCR showed that only SSBP1 and
POLG2 were upregulated, while ALAS1 was significantly downregulated
in tumors cells (Fig. 1C).
However, in the GEO datasets, the expression of SSBP1, but not
POLG, was markedly increased in liver cancer tissues compared with
adjacent non-cancerous tissue (Fig.
1D). SSBP1 was upregulated in numerous types of cancer tissues
compared with normal tissue (Fig.
S1B and C), thus suggesting that SSBP1 could serve a key role
in cancer, particularly in liver cancer (Fig. 1E). Kaplan-Meier survival analysis
revealed that high SSBP1 expression was associated with poor
prognosis in liver cancer (Fig.
1F). Collectively, SSBP1 may be a potential biomarker for the
diagnosis and prognosis of liver cancer.
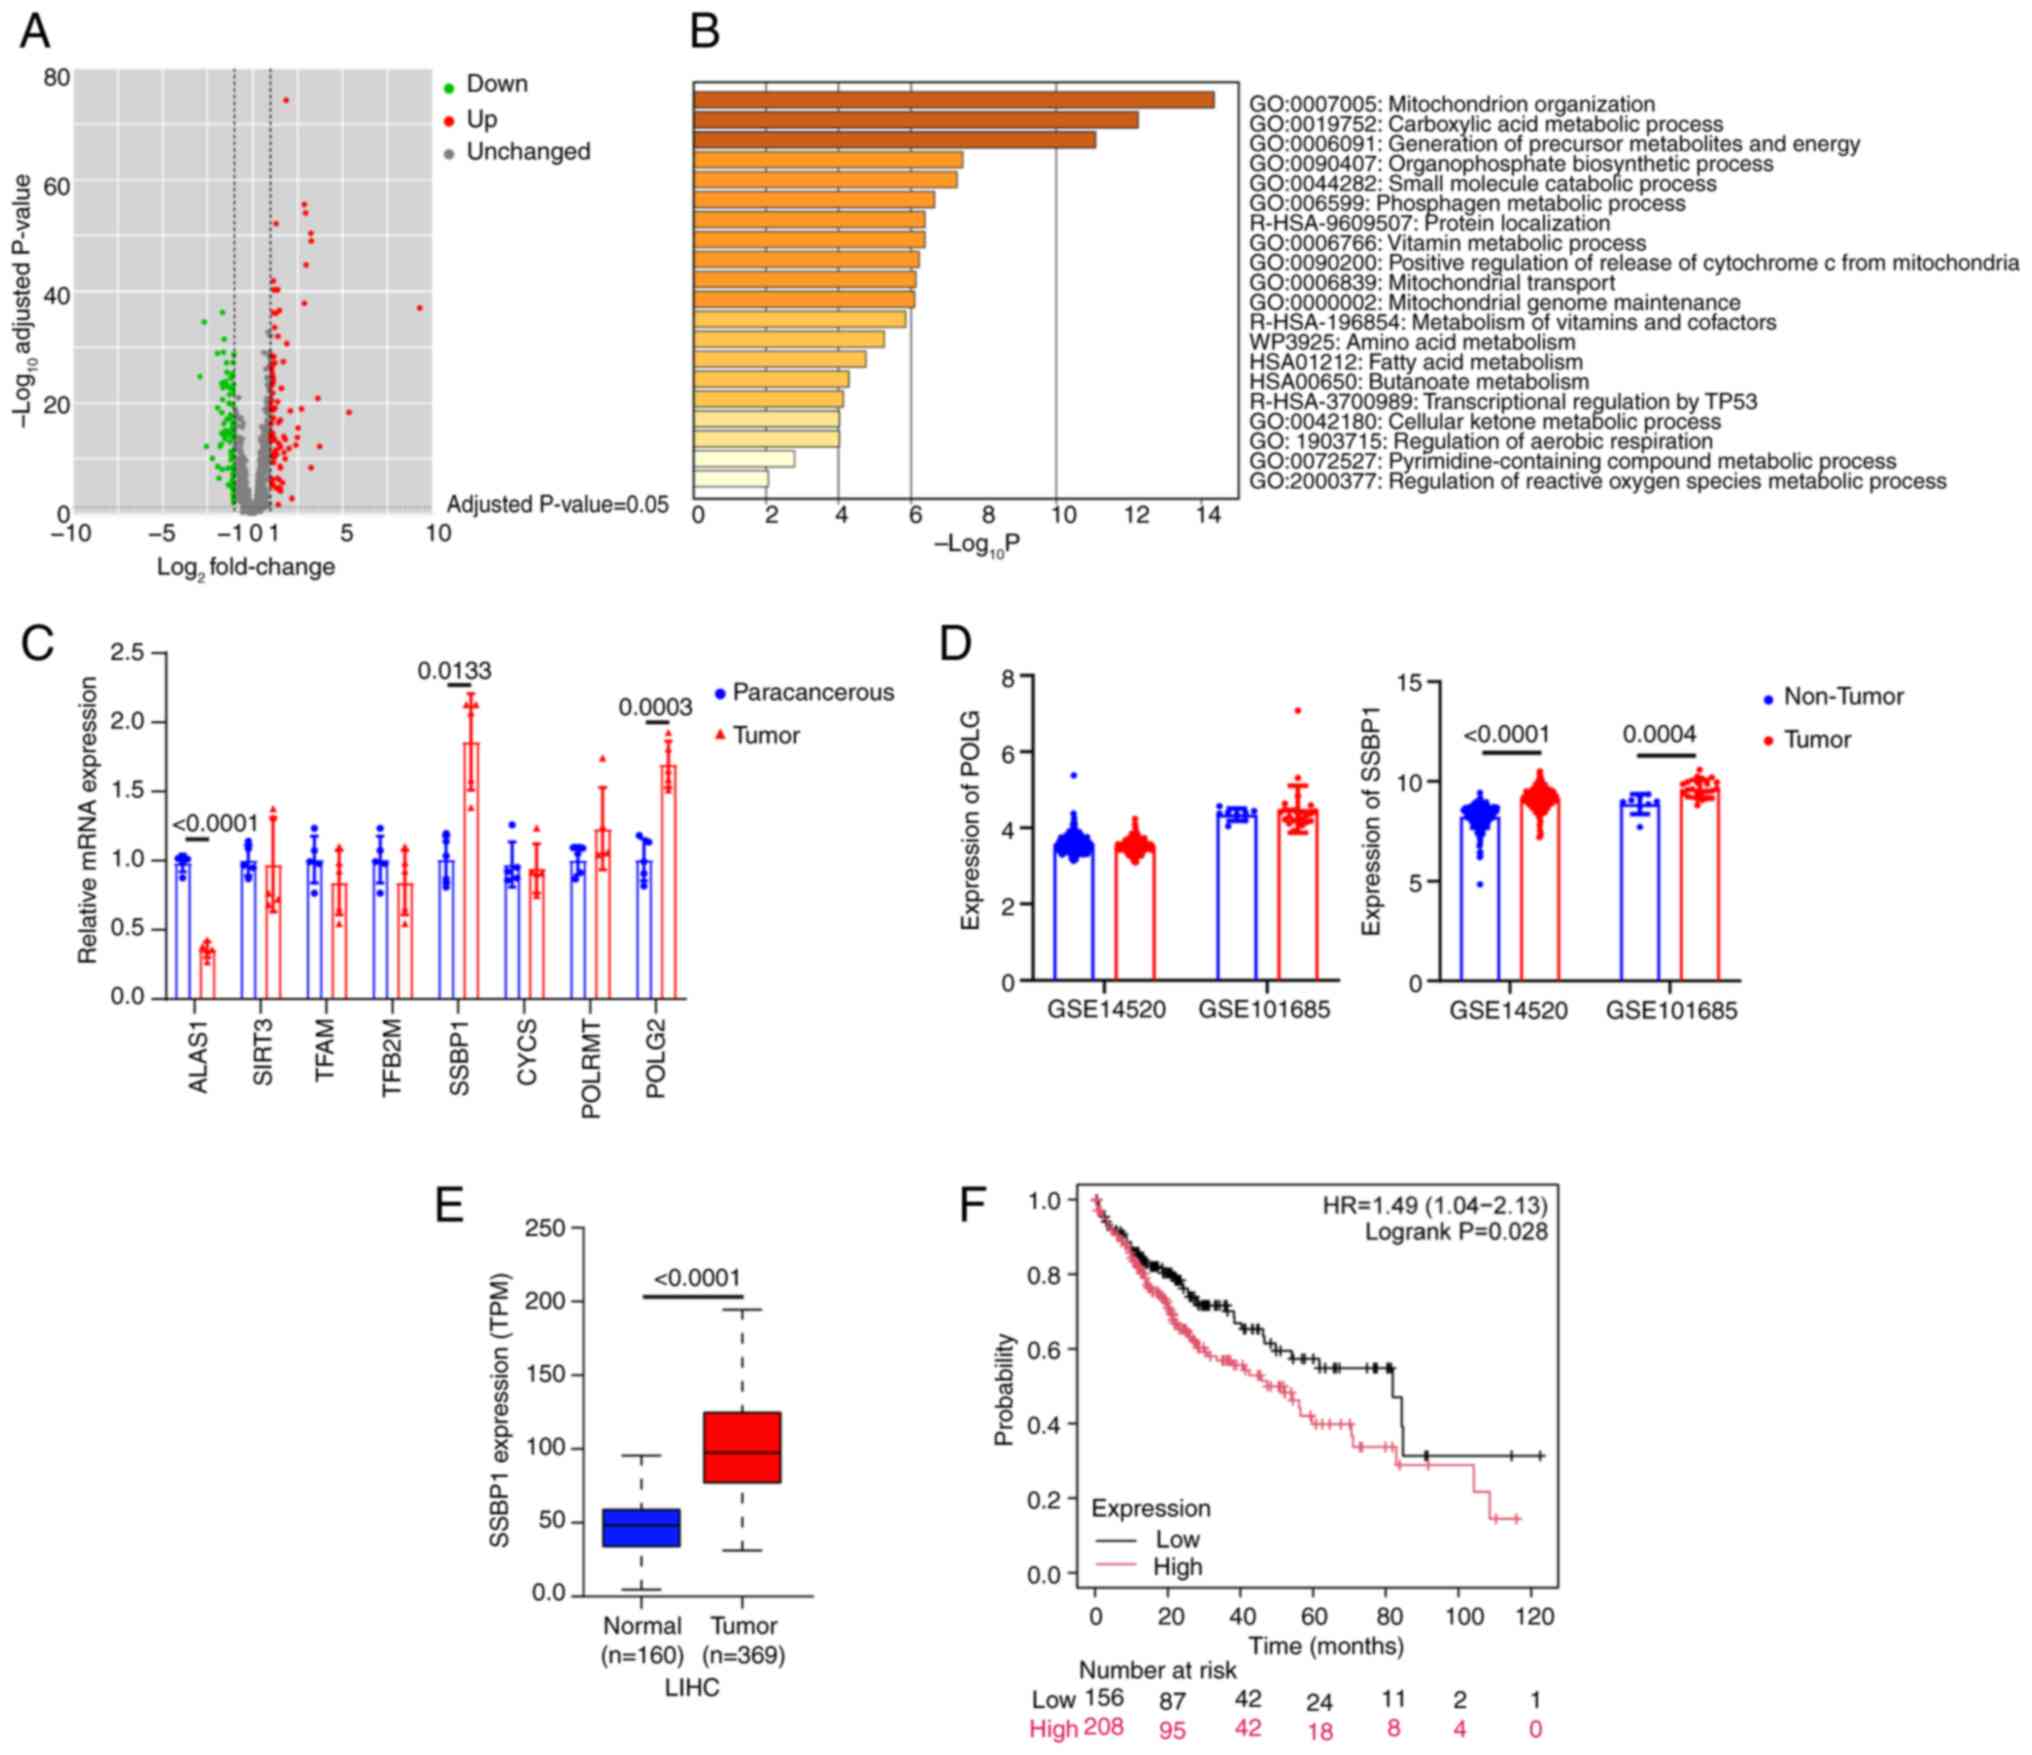 | Figure 1Integrated analysis of the expression
of SSBP1 in liver cancer. (A) Distribution of differential gene
expression levels after mapping mitochondrial-located genes
(MitoCarta3.0 list) onto the TCGA-LIHC dataset. (B) Enrichment
analysis using the R language. The gene sets ranking at the top
were predominantly implicated in mitochondrial organization and
biogenesis. (C) mRNA levels of mitochondrial biogenesis genes
(including ALAS1, SIRT3, TFAM, TFB2M, SSBP1, CYCS, POLRMT and POLG)
in liver cancer and paracancerous tissue (n=5). (D) Expression
profiles of POLG and SSBP1 in patients with liver cancer and
corresponding controls derived from the GSE14520 (tumor, n=225;
non-tumor, n=220) and GSE101685 datasets. (tumor, n=24; non-tumor,
n=8). (E) Transcriptional expression levels of SSBP1 in the
TCGA-LIHC dataset. (F) Association between SSBP1 expression and the
prognosis of liver cancer in the overall population (n=364) using
the Kaplan Meier Plotter online survival analysis tool. SSBP1,
single-stranded DNA binding protein 1; TCGA-LIHC, The Cancer Genome
Atlas liver hepatocellular carcinoma; ALAS1, aminolevulinic acid
synthase 1; SIRT3, sirtuin 3; TFAM, transcription factor A,
mitochondrial; TFB2M, transcription factor B2, mitochondrial; CYCS,
cytochrome c, somatic; POLRMT, RNA polymerase mitochondrial; POLG,
DNA polymerase γ; TPM, transcripts per million. |
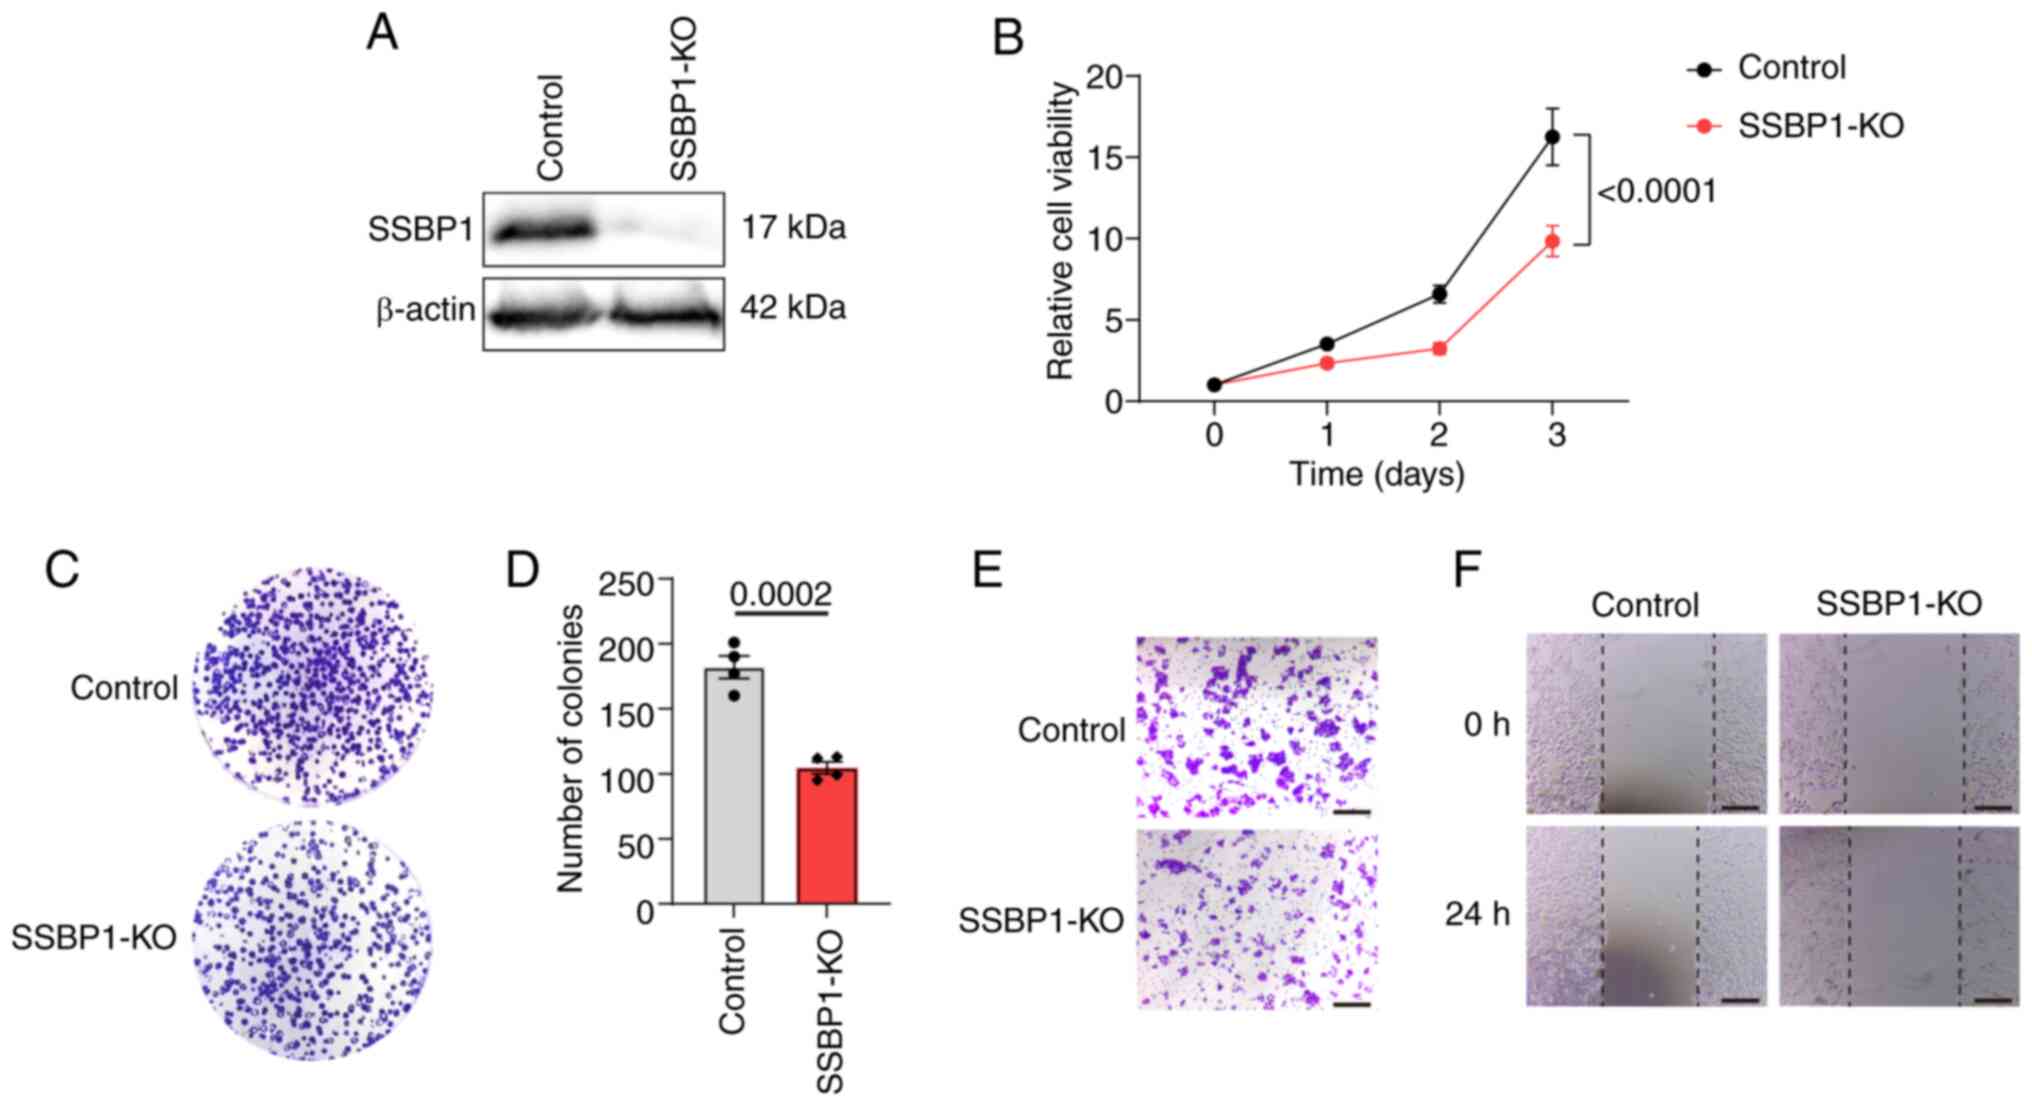
SSBP1 knockout inhibits liver cancer cell
proliferation and migration capacity
To investigate the effect of SSBP1 on the growth and
tumorigenesis of liver cancer, SSBP1 was knocked out using
independent lentiviral sgRNA. Western blot analysis demonstrated
that SSBP1 was successfully knocked out in the liver cancer cell
lines (Figs. 2A and S2A, G and J). MTT assay was employed to
monitor cell proliferation at 24 h intervals. Proliferation
capacity of SSBP1-knockout Hep3B cells was notably decreased
(Fig. 2B). Similarly, the number
of colonies formed by SSBP1-knockout Hep3B cells was significantly
decreased compared with control cells, consistent with the reduced
proliferation capacity observed in the MTT assay (Fig. 2C and D). To explore the effect of
SSBP1 on liver cancer cell migration, a Transwell assay was
performed. The loss of SSBP1 markedly decreased the migration of
Hep3B cells compared with the control group (Fig. 2E). Additionally, wound healing
assay was utilized to assess the migration ability of
SSBP1-knockout Hep3B cells. SSBP1 knockout significantly impaired
the motility of Hep3B cells compared with the control (Fig. 2F). The same results were observed
in Hepa1-6 (Fig. S2B-F), HepG2
(Fig. S2H and I) and Huh7 cells
(Fig. S2K and L).
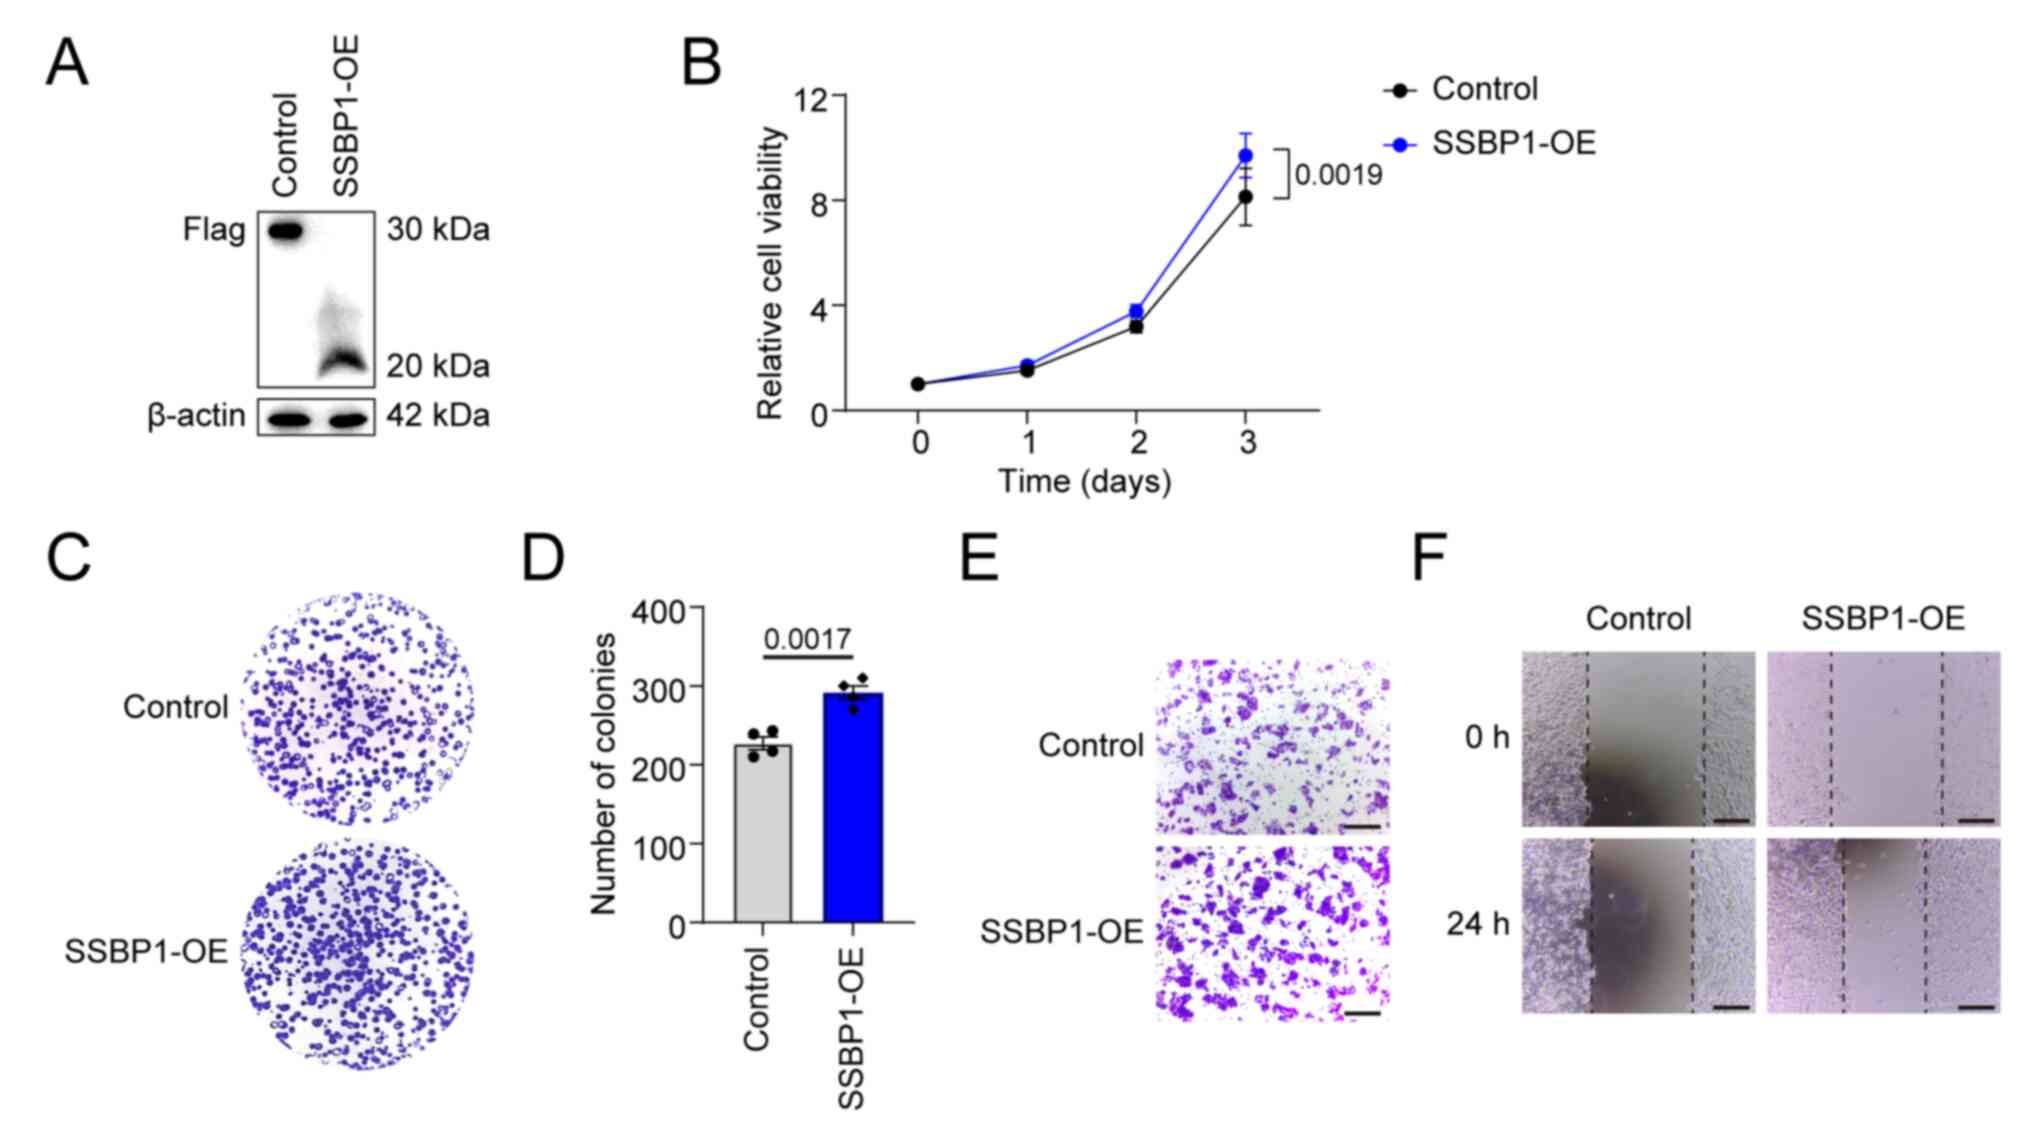
SSBP1 overexpression promotes liver
cancer cell proliferation and migration capacity
As previously described, SSBP1 upregulation is
associated with most types of cancers (28). Therefore, the role of SSBP1 in
promoting liver cancer growth was investigated. Flag-tagged SSBP1
was overexpressed in liver cancer cell lines using a lentiviral
system and SSBP1 overexpression was validated using western blot
analysis (Figs. 3A and S3A). Compared with the control, the
proliferative capacity of SSBP1-overexpressing Hep3B cells was
significantly enhanced (Fig. 3B).
SSBP1 overexpression promoted the colony formation capacity of
Hep3B cells (Fig. 3C and D).
Transwell migration and wound healing assays demonstrated that
SSBP1 overexpression enhanced the migration potential of liver
cancer cells (Fig. 3E and F). The
same results were also obtained in HepG2 cells (Fig. S3B and C).
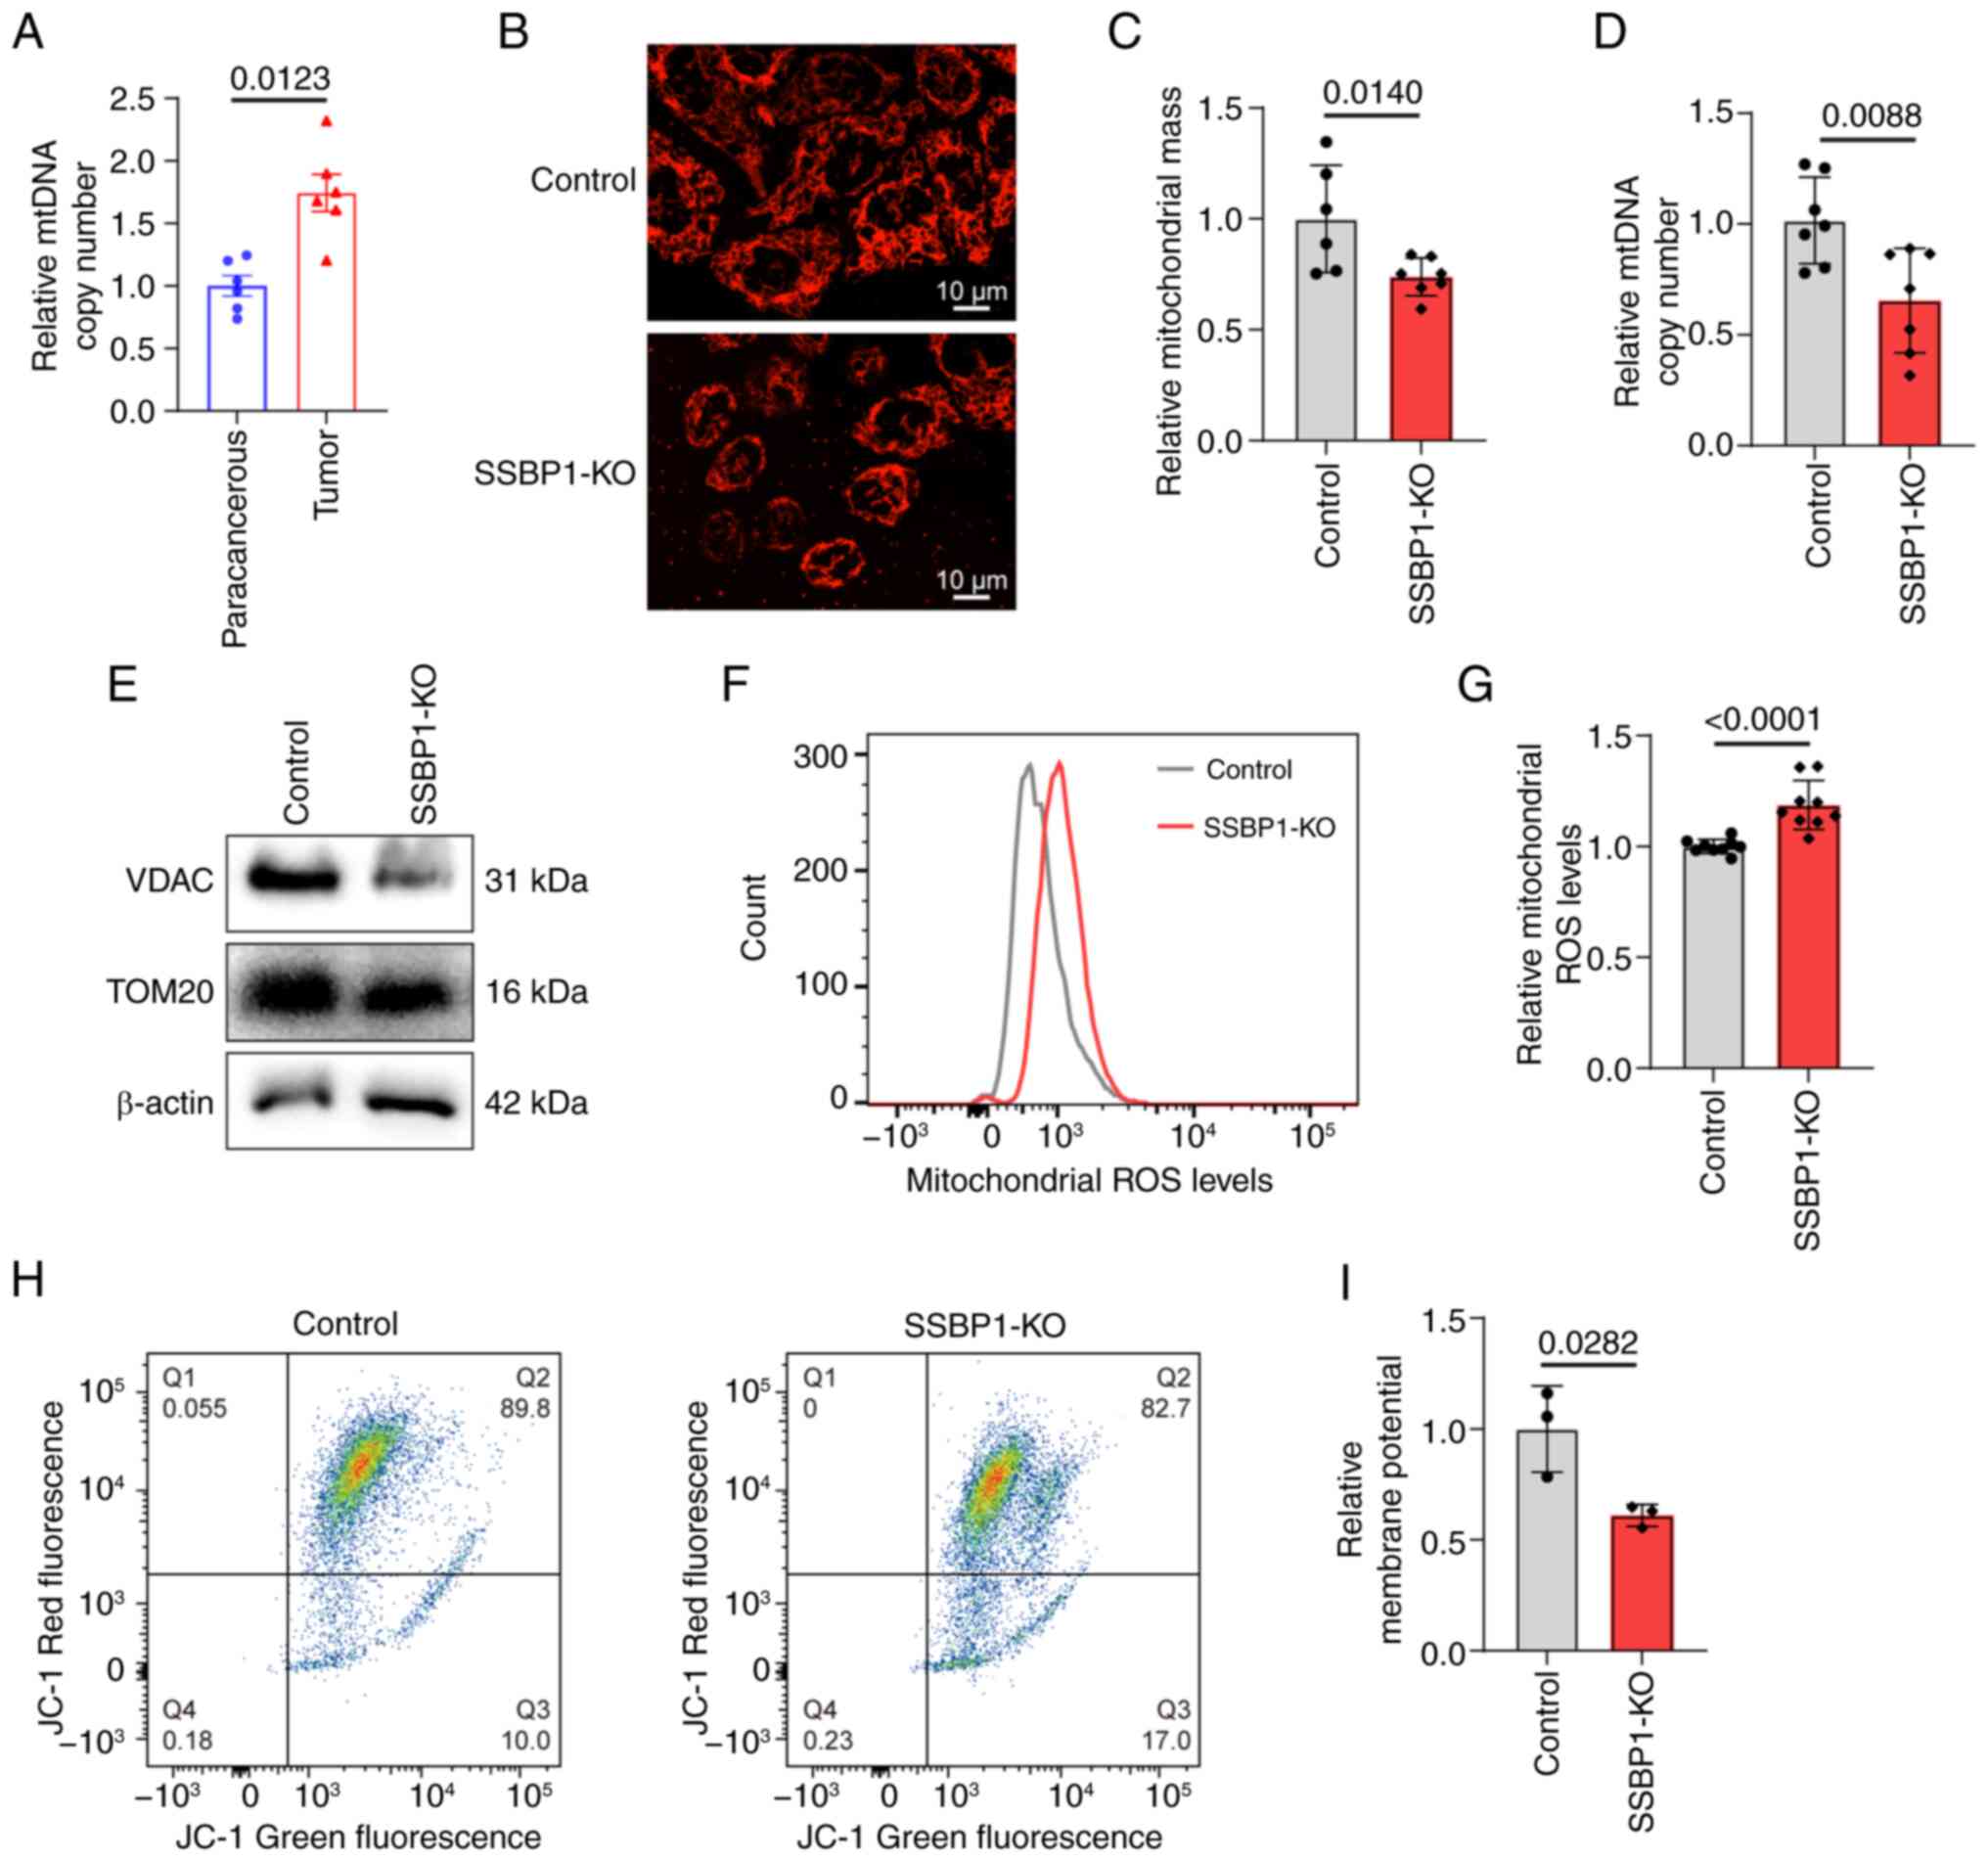
SSBP1 knockout inhibits mitochondrial
function
SSBP1 is a key mitochondrial protein; its abnormal
regulation affects mtDNA content, eventually leading to alterations
in mitochondrial function (27).
mtDNA copy number was elevated in liver cancer tissue (Fig. 4A). Concurrently, SSBP1
knockout in liver cancer cells decreased the number of mitochondria
while increasing their migration towards the nucleus (Fig. 4B and C). Additionally, the mtDNA
copy number was decreased (Fig.
4D). Western blot analysis indicated that SSBP1 knockout
diminished the expression of mitochondria-related proteins
(Fig. 4E). As mitochondria serve
as the primary source of cellular ROS generation (47), the accumulation of mitochondrial
ROS in Hep3B cells was evaluated. A significant increase in
mitochondrial ROS accumulation and a marked decrease in MMP were
observed in SSBP1-deficient cells (Fig. 4F-I). These results suggested that
SSBP1 knockout promoted mitochondrial damage in liver cancer
cells.
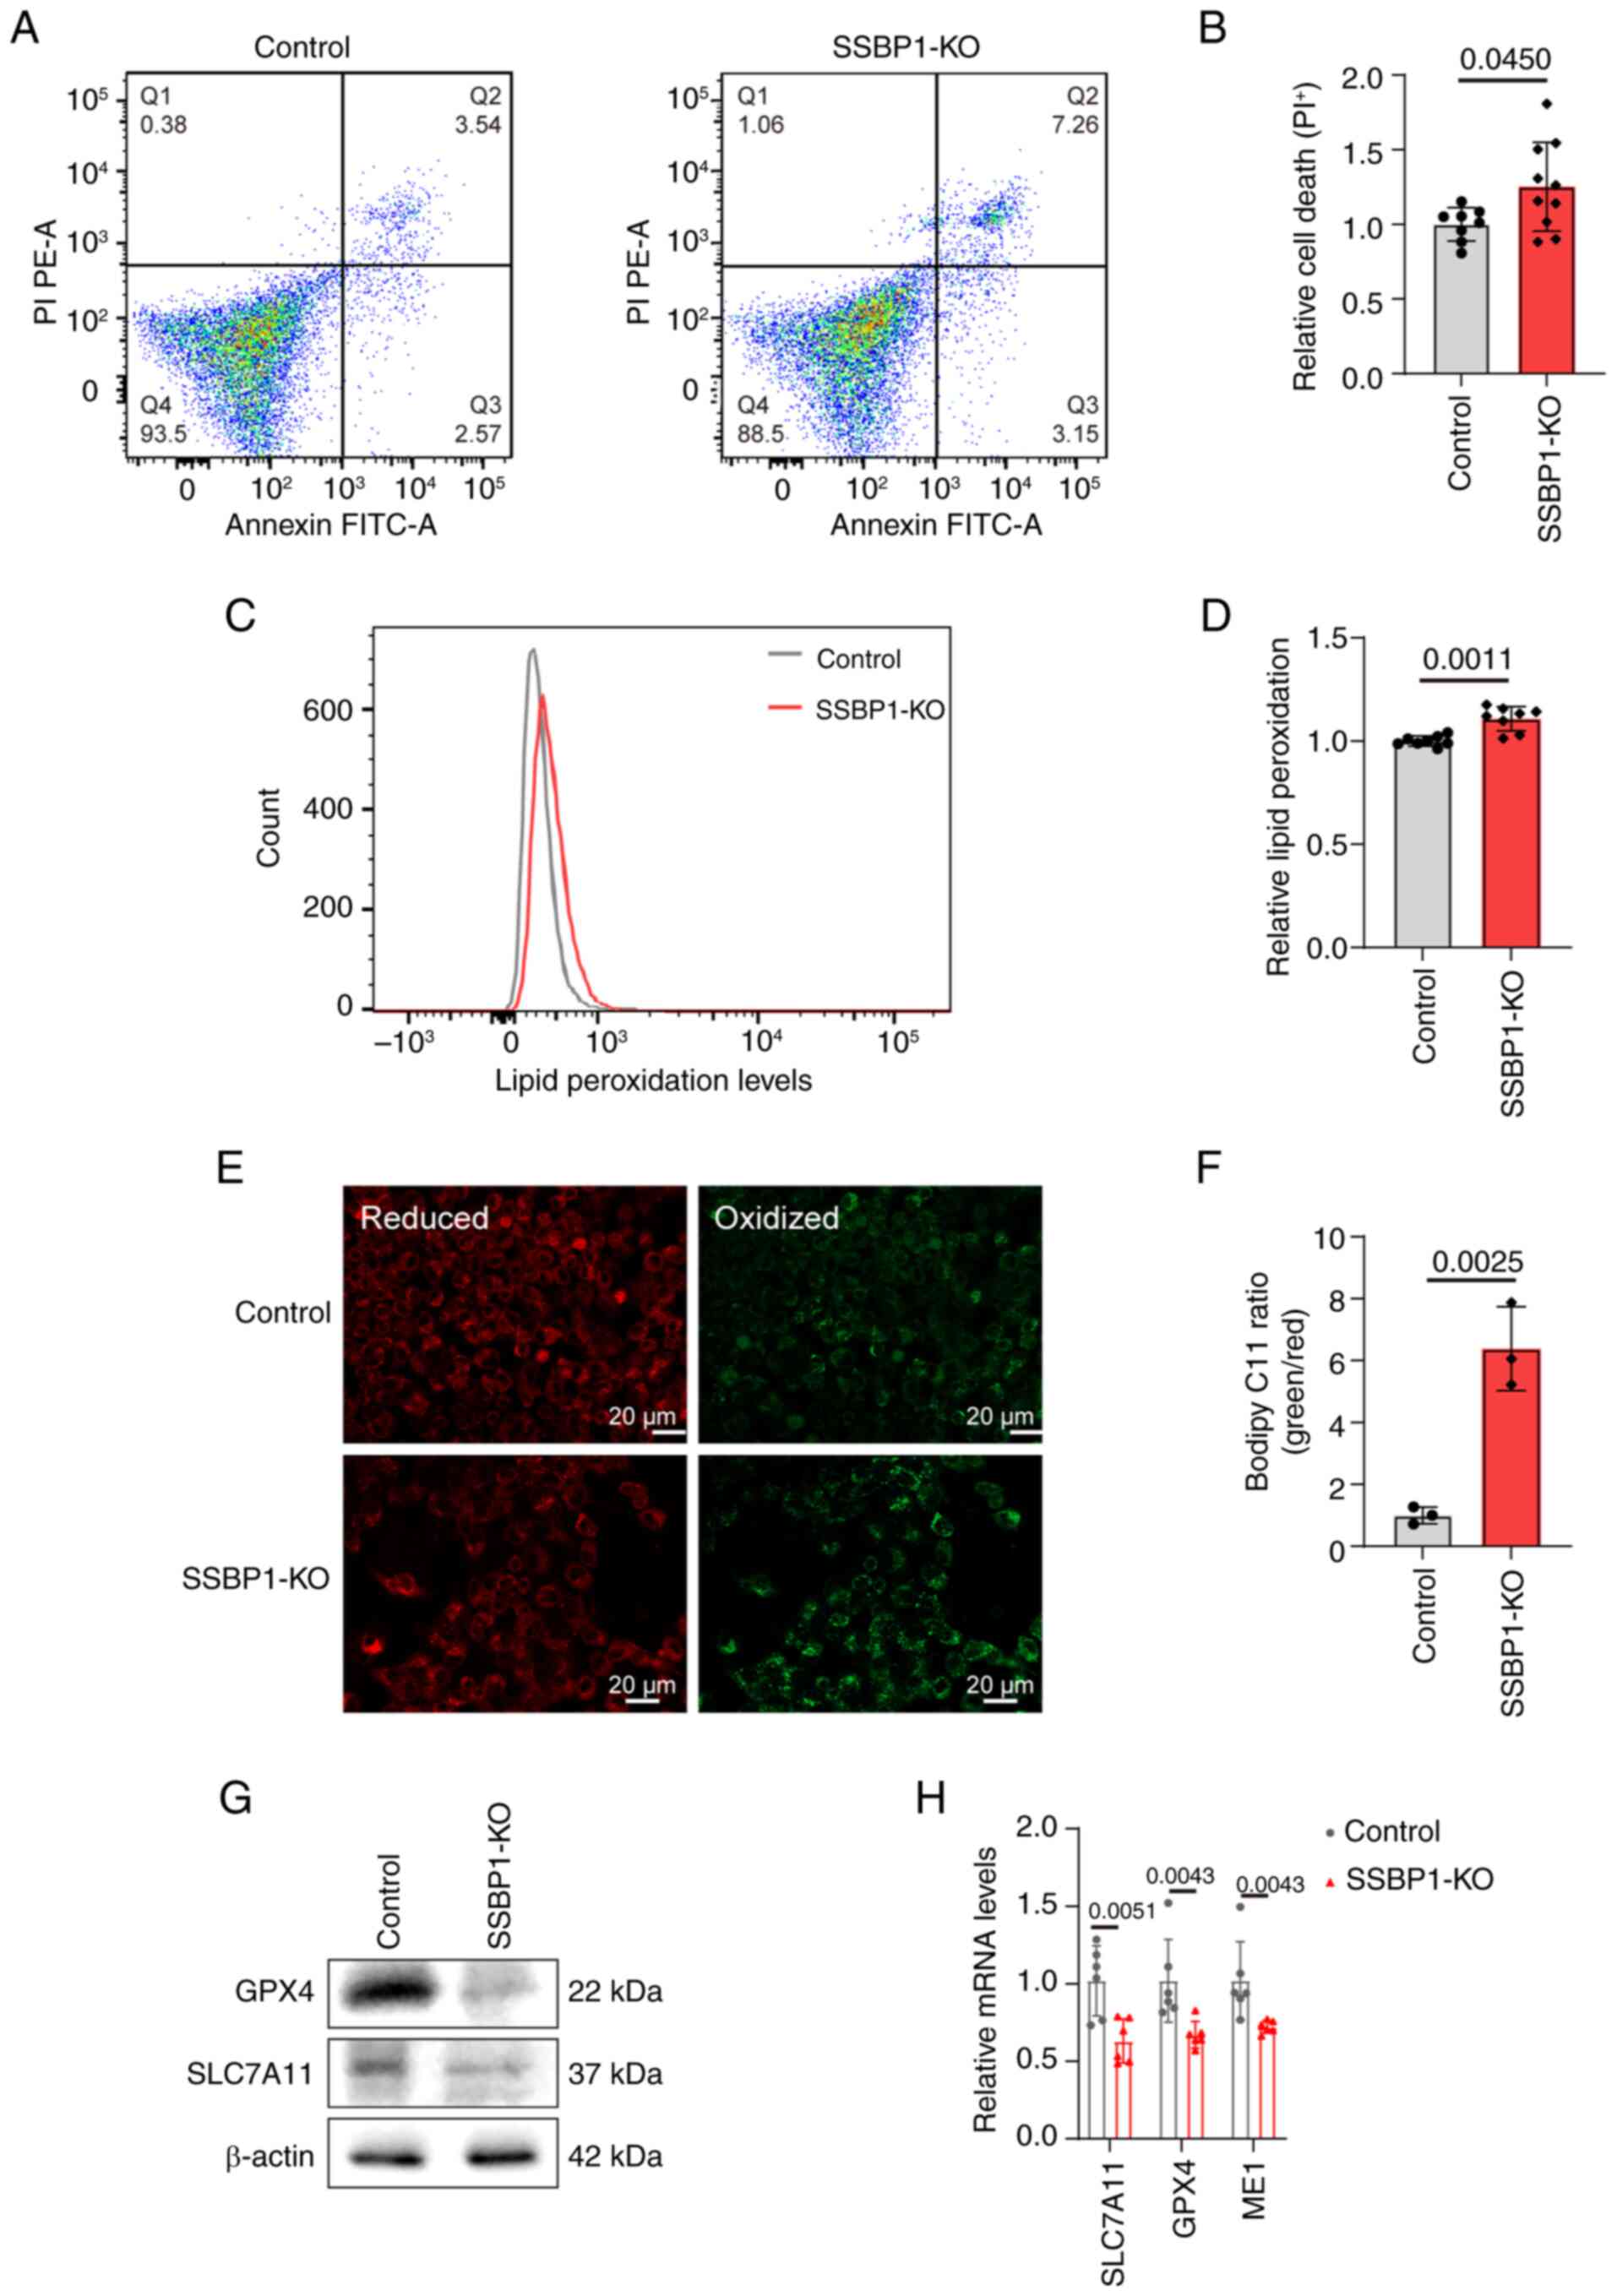
SSBP1 knockout triggers ferroptosis in
liver cancer cells
As aforementioned, the relative cell viability was
significantly decreased by SSBP1 deficiency. Therefore, the present
study aimed to investigate whether, in addition to impaired
proliferation, cell death also occurred. Flow cytometry showed that
SSBP1 deletion significantly increased the percentage of dead cells
compared with control cells (Fig.
5A-B). Among the various types of cell death, ferroptosis is
involved in the genesis and progression of liver cancer, with
mitochondria, where SSBP1 is located and which are crucial
energy-supplying organelles, serving a key role in this process
(27-29,44,48). Therefore, C11-BODIPY fluorescence
staining was employed to determine the extent of ferroptosis, and
the results revealed an increase in lipid peroxidation in
SSBP1-knockout Hep3B cells, confirming enhanced ferroptosis
(Fig. 5C-F). Consistently,
quantitative analysis showed that antioxidant genes (e.g., GPX4,
SLC7A11) were downregulated at both protein and mRNA levels in
SSBP1-deficient cells (Fig. 5G and
H), demonstrating that SSBP1 regulates liver cancer progression
via modulating ferroptosis. The same results were also observed in
HepG2 (Fig. S4A and B) and
Hepa1-6 cells (Fig. S4C).
SSBP1 knockout enhances the sensitivity
of liver cancer cells to sorafenib
Based on the dual role of sorafenib as both a tumor
suppressor and inducer of ferroptosis in liver cancer (8), the present study explored the effect
of SSBP1 on sorafenib treatment. GEO datasets showed that when
liver cancer cells were treated with sorafenib, the expression of
SSBP1 notably decreased (Fig.
S5A), whereas SSBP1 was upregulated in sorafenib-resistant
cells compared with sorafenib-sensitive cells (Fig. S5B). In addition, high SSBP1
expression was associated with poor prognosis in sorafenib-treated
liver cancer (Fig. S5C).
Therefore, Hep3B cells were treated with sorafenib, and western
blot analysis showed that SSBP1 was markedly downregulated in these
cells (Fig. 6A). SSBP1 knockout
enhanced sorafenib-induced inhibition of clonogenicity and growth
inhibition (Fig. 6B-D).
Subsequently, the effect of SSBP1 deficiency on sorafenib treatment
in liver cancer was assessed. Following SSBP1 knockout, the mtDNA
copy number and mitochondrial mass of liver cancer cells were
markedly decreased following treatment with sorafenib (Fig. 6E-G). In addition, MitoTracker
staining indicated that mitochondrial fragmentation was enhanced
and mitochondria migrated closer to the nuclear periphery in
SSBP1-knockout liver cancer cells (Fig. 6E). Furthermore, treatment of
SSBP1-knockout liver cancer cells with sorafenib enhanced
intracellular ROS levels (Fig. 6H and
I) and decreased MMP compared with the control group (Fig. 6J and K). Lipid peroxidation levels
were markedly elevated, and the protein and mRNA expression of
ferroptosis-associated genes was reduced in Hep3B cells treated
with sorafenib (Fig. 6A and L-N).
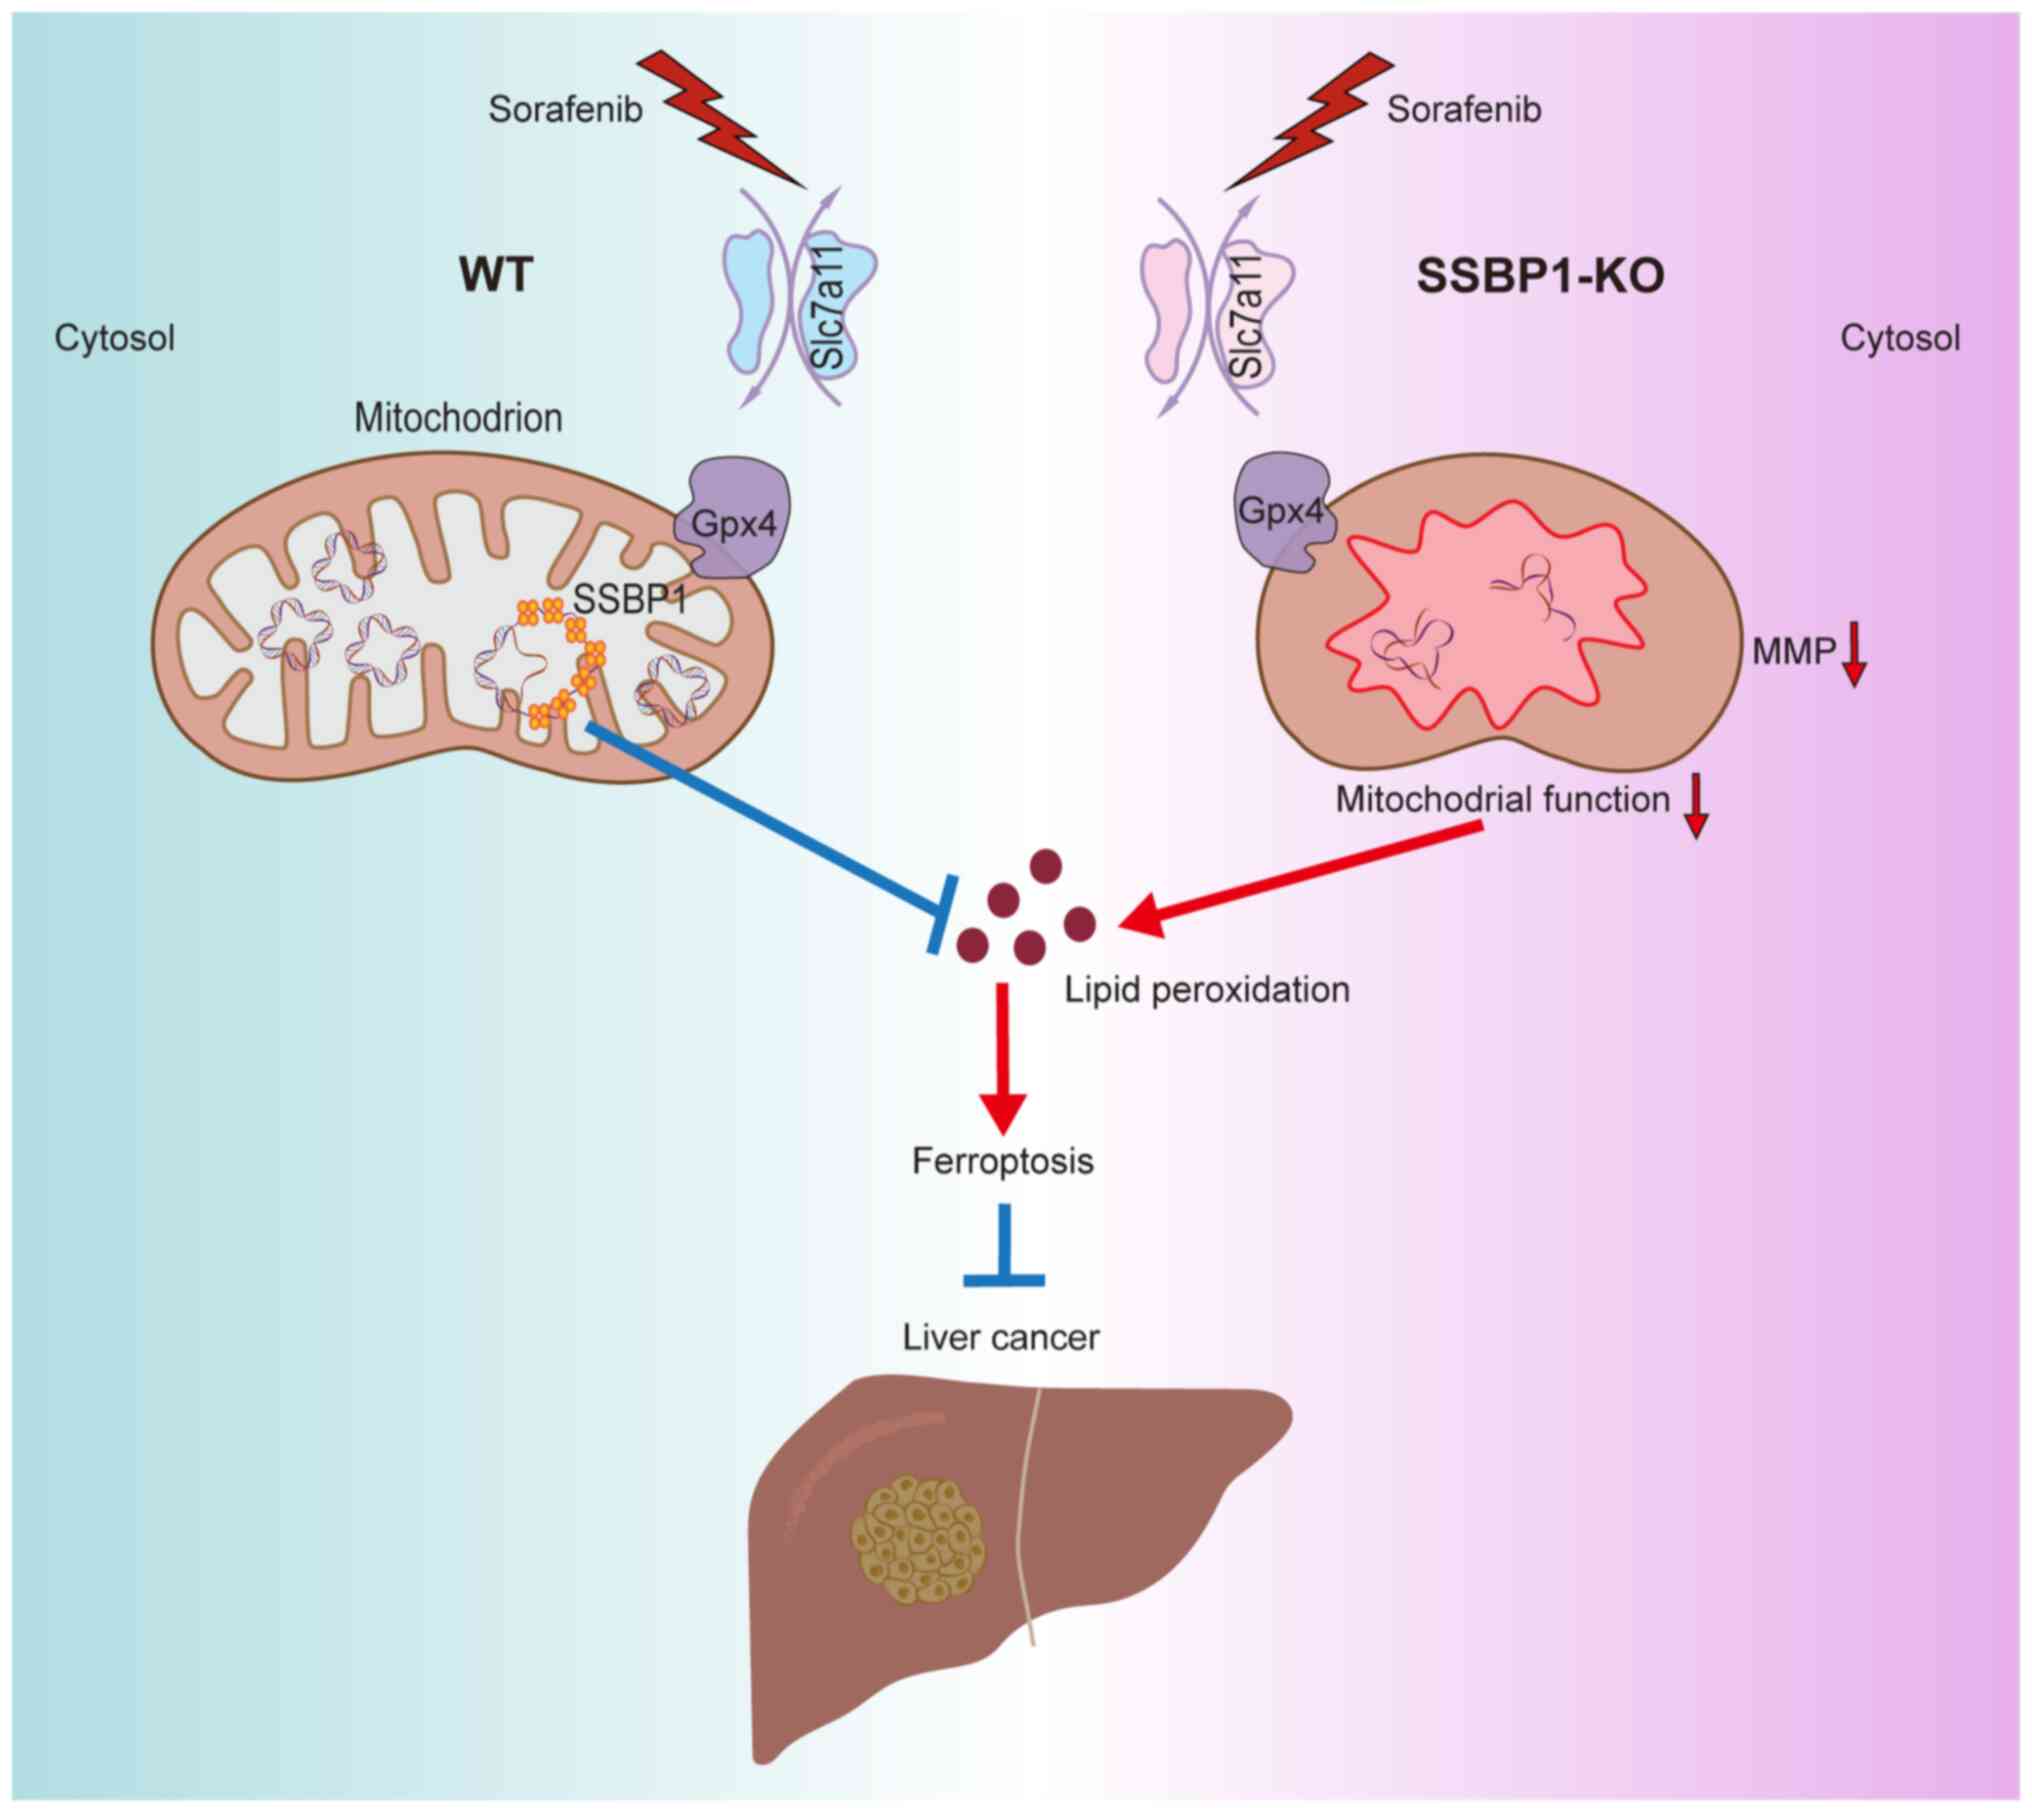
In summary, SSBP1 deficiency enhanced the sensitivity of liver
cancer cells to sorafenib and may serve as a novel target for
overcoming sorafenib resistance (Fig.
7).
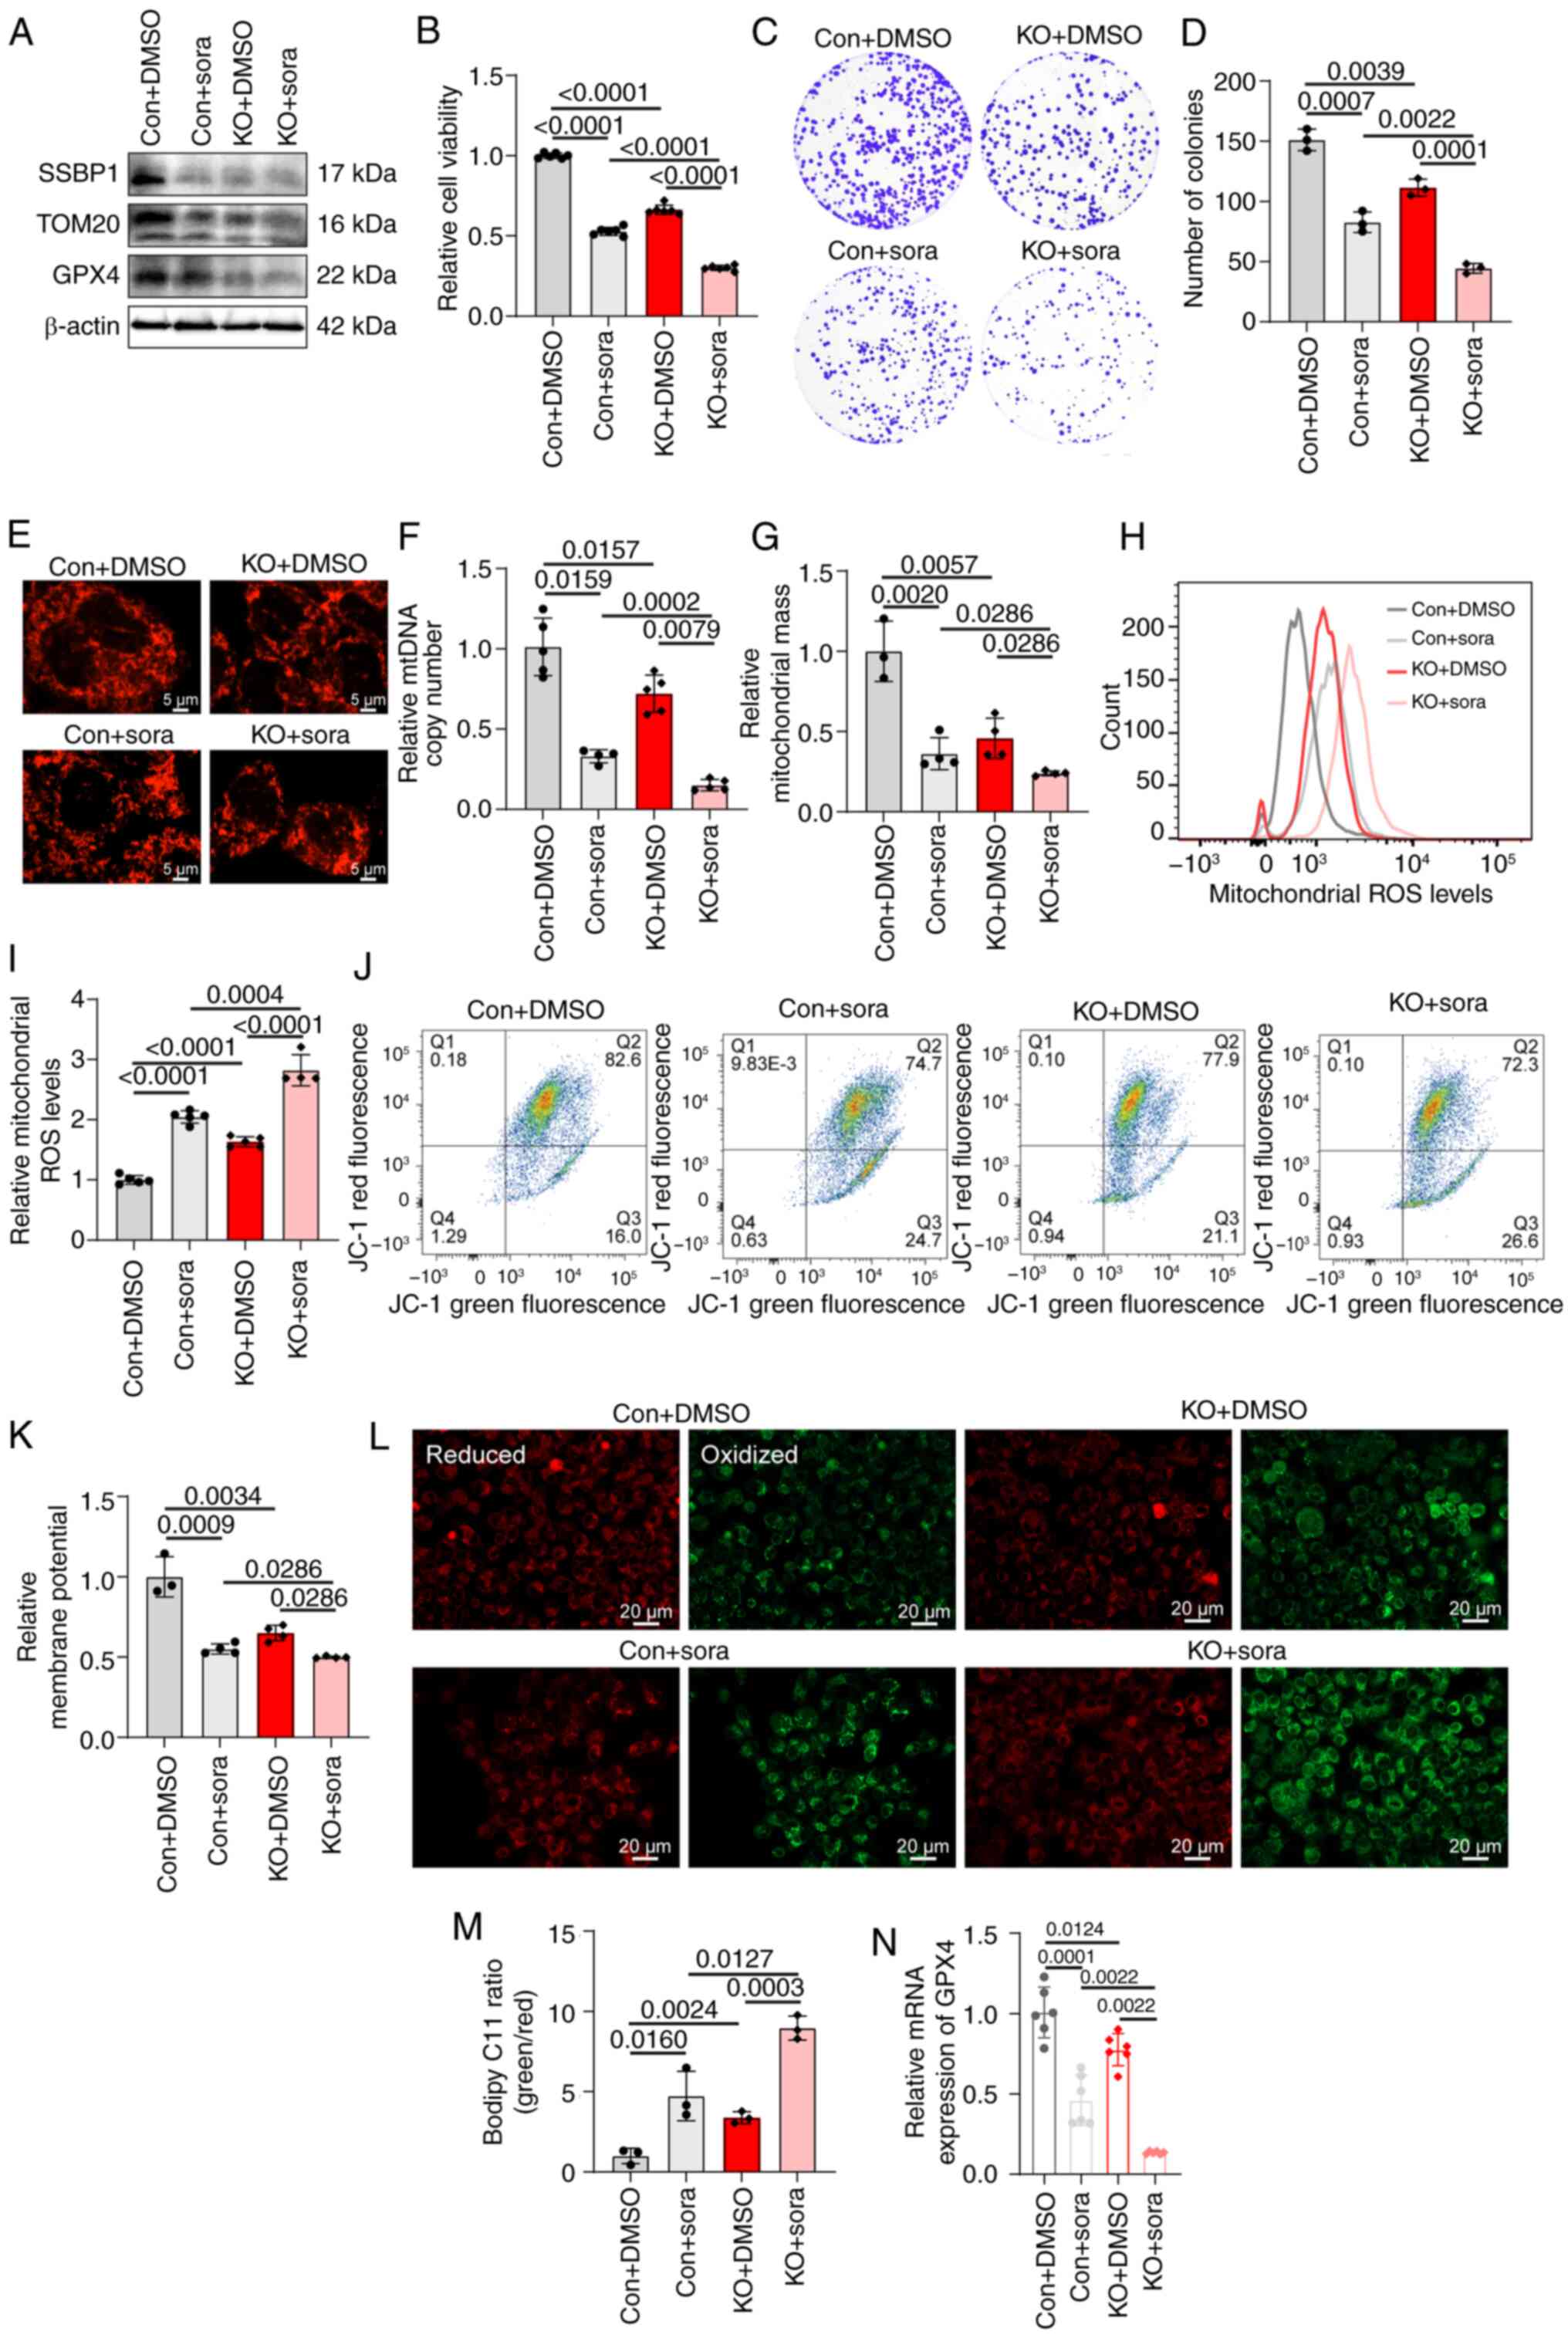 | Figure 6SSBP1 deficiency enhances the effect
of sora treatment. (A) Expression of SSBP1, TOM20 and GPX4 in Con
and SSBP1-KO Hep3B cells with or without sora treatment. (B) MTT
assay showed the relative viability of Con and SSBP1-KO Hep3B cells
with or without sora treatment (n=6). (C) Representative colony
formation assay showing proliferation capacity of Hep3B cells with
SSBP1 KO in the presence or absence of sora treatment. (D) Colony
formation capacity (n=3). (E) Immunofluorescence was performed to
detect the mitochondrial morphology in Hep3B cells following SSBP1
KO in the presence or absence of sora. Scale bar, 5 μm.
Magnification, ×630. (F) qPCR was used to analyze the mtDNA copy
number of Con and SSBP1-KO Hep3B cells with or without sora
treatment (n=4-5). Flow cytometry was employed to analyze (G)
mitochondrial mass (n=3-4) and (H) ROS levels (n=4-5) of Con and
SSBP1-KO Hep3B cells with or without sora treatment. (I) ROS levels
in Con and SSBP1-KO Hep3B cells with or without sora (n=4-5). (J)
Flow cytometry was performed to analyze (K) MMP of Control and
SSBP1-KO Hep3B cells with or without sora (n=3-4). (L) Fluorescence
images of C11-BODIPY-stained Hep3B cells. (M) Relative fluorescence
intensity was quantified by ImageJ software (n=3). Scale bar, 20
μm. Magnification, ×200. (N) mRNA expression of
ferroptosis-associated gene GPX4 in Con and SSBP1-KO Hep3B cells in
the presence or absence of sora (n=6). TOM20, translocase of the
outer mitochondrial membrane 20; GPX4, glutathione peroxidase 4;
SSBP1-KO, SSBP1 (single-stranded DNA binding protein 1) knockout;
mtDNA, mitochondrial DNA; Con, control; sora, sorafenib. |
Discussion
Liver cancer poses a notable clinical challenge due
to the lack of early pathological indicators, which complicates
diagnosis (49). This, combined
with limited treatment options, contributes to high morbidity and
mortality rates (1-4). Furthermore, the efficacy of the
currently available treatment strategies remains unsatisfactory
(49). Therefore, the
identification of novel targets and biomarkers to improve the
clinical prognosis of patients with liver cancer is key. In the
present study, SSBP1 was identified as a promising therapeutic
target for liver cancer. SSBP1 was significantly upregulated in
tumor compared with adjacent healthy liver tissue. Analysis of TCGA
data revealed that patients with liver cancer with high SSBP1
expression displayed reduced overall survival. SSBP1, a
single-stranded DNA-binding protein, serves a key role in several
cellular processes including nuclear DNA replication, repair,
recombination, and mitochondrial genome maintenance. In cancer, its
expression and activity are typically altered, thus affecting tumor
cell proliferation and metastasis (24,25,28). Previous studies demonstrated that
SSBP1 is highly expressed in certain types of cancer (such as lung
adenocarcinoma) and involved in tumor occurrence and development
(49-52). However, the role of SSBP1 in liver
cancer remains unclear. Ohmori et al (53) cloned the single-stranded
DNA-binding protein in 1996, highlighting its key role in the
maximal expression of the thyroid-stimulating hormone (TSH)
receptor and TSH-induced negative regulation, thus suggesting that
SSBP1 serves a potential role in cellular signaling regulation.
However, its function in liver cancer remains to be explored. The
present results showed that SSBP1 was highly expressed in tumor
compared with adjacent healthy liver tissues. TCGA dataset revealed
that patients with liver cancer highly expressing SSBP1 had
decreased overall survival, which was consistent with the research
findings of Yang et al (54) in lung adenocarcinoma. These
findings indicated that high SSBP1 expression may serve as a
potential indicator of poor prognosis. In terms of cell functions,
the results demonstrated that SSBP1 deficiency suppressed the
proliferation and migration of liver cancer cells, while SSBP1
overexpression displayed the opposite effects. These findings were
consistent with the known proliferative and metastasis-promoting
effects of SSBP1 on other types of cancer, which were verified in
liver cancer cell lines (28).
As a key regulator of the mitochondrial genome,
SSBP1 serves a role in maintaining mitochondrial function,
modulating metabolism and responding to DNA damage (55-57). Additionally, SSBP1 is involved in
the mitochondrial unfolded protein response (58). Comparative mitochondrial proteomic
analysis of patients with liver cancer provides insights for
exploring mitochondria-associated protein alterations in liver
cancer (59). A previous study
revealed that SSBP1 downregulation decreases mtDNA content and
perturbs mitochondrial energy function in glioblastoma cells
(43). In line with these
findings, elevated mtDNA copy number was recorded in liver cancer
tissue with high SSBP1 expression. In addition, SSBP1 knockout in
liver cancer cells decreased mitochondrial number, mtDNA copy
number and the levels of mitochondrial proteins, and increased
migration to the nucleus. Additionally, SSBP1-deficient cells
exhibited increased mitochondrial ROS levels and decreased MMP,
indicating mitochondrial damage. The aforementioned findings
aligned with those of previous studies supporting the role of SSBP1
in maintaining mitochondrial function and further highlighted the
role of SSBP1 in regulating mitochondrial function in liver cancer
cells (27,28). Mitochondria are considered the
primary source of intracellular ROS and serve a crucial role in
governing ferroptosis (44). To
investigate the potential association between SSBP1 and
ferroptosis, ferroptosis was assessed utilizing C11-BODIPY
fluorescence staining and by detecting the expression of
ferroptosis-related genes in liver cancer cells. Notably,
ferroptosis was significantly induced in liver cancer cells
following SSBP1 knockout. This finding was consistent with those of
previous studies indicating that SSBP1 regulates ferroptosis via
p53 signaling in glomerular podocyte injury (45,60). Overall, the aforementioned
findings demonstrate the mechanism underlying the effects of SSBP1
on regulating ferroptosis in liver cancer.
Inducing tumor cell death via pharmacological,
genetic and other interventional modalities is a fundamental
strategy for treating cancer (61). Numerous types of cell death have
been identified, including apoptosis, necrosis, autophagy and
ferroptosis (62). Ferroptosis is
characterized by uncontrolled lipid peroxidation. Therefore,
ferroptosis is considered a novel tumor-suppression mechanism
(63-65). As the liver is susceptible to
oxidative damage, ferroptosis has garnered increasing attention
within the realm of liver disease, particularly liver cancer
(44,48). Previous studies have primarily
focused on sorafenib-induced ferroptosis and its potential targets
both in vivo and/or in vitro (66-68). Although sorafenib is a
multi-kinase inhibitor that is considered the first-line systemic
therapy for patients with advanced liver cancer, drug resistance
can hamper its broad application (9). Therefore, it has been hypothesized
that genes that inhibit ferroptosis contribute to sorafenib
resistance (69). The present
study revealed that SSBP1 knockout markedly enhanced liver cancer
cell ferroptosis and concurrently inhibited cell proliferation when
combined with sorafenib treatment. In addition, mitochondrial
dysfunction and increased ROS levels induced by SSBP1 knockout may
collectively contribute to sorafenib-induced ferroptosis in liver
cancer. This implied that SSBP1 regulates ferroptosis sensitivity
through multiple pathways. On one hand, the burst of mitochondrial
ROS may directly initiate lipid peroxidation chain reactions. On
the other hand, mitochondrial dysfunction may promote the release
of mtDNA, thus activating the cGAS (cyclic GMP-AMP synthase)/STING
pathway and facilitating ferroptosis in liver cancer cells
(70). SSBP1 forms a complex with
heat shock factor 1 that translocates into the nucleus to regulate
mitochondrial protein import (71). Therefore, SSBP1 knockout could
disrupt the mitochondrial localization of GPX4, thus impairing GSH
redox cycling, a key antioxidant defense mechanism against lipid
peroxidation, and enhancing ferroptosis. Overall, the
aforementioned findings underscore the key role of SSBP1 in
modulating cell survival and response to therapy, underlining its
potential as a target for developing more effective treatment
strategies for liver cancer.
While the present study demonstrates that SSBP1
influences sorafenib efficacy via ferroptosis, it did not include
liver cancer specimens, and further studies are needed to
investigate the role of SSBP1 in other signaling pathways, which
may reveal broader therapeutic implications.
Overall, the mechanism by which SSBP1 regulates
tumor cell proliferation and sorafenib resistance in liver cancer
was elucidated. SSBP1 promoted the malignant progression of liver
cancer via suppressing ferroptosis. The present data provided novel
insights into the critical role of SSBP1 as a potential target for
liver cancer therapy.
Supplementary Data
Availability of data and materials
The data generated in the present study may be
requested from the corresponding author.
Authors' contributions
ZW and LZ conceived the study. SL, XY and HG
performed the experiments, analyzed data and wrote and revised the
manuscript. XH, DW, QZ, JX, JZ and LZ analyzed and interpreted
data. All authors have read and approved the final manuscript. SL,
LZ and ZW take responsibility for the integrity of data analysis.
ZW and LZ confirm the authenticity of all the raw data.
Ethics approval and consent to
participate
The animal experiments were approved by the Animal
Care and Use Committee of Tianjin Medical University (approval no.
TMUaMEC2024050; Tianjin, China).
Patient consent for publication
Not applicable.
Competing interests
The authors declare that they have no competing
interests.
Acknowledgements
Not applicable.
Funding
The present study was supported by the Scientific Research
Program of Tianjin Education Commission (Natural Science; grant no.
2023KJ037).
References
|
1
|
Bray F, Laversanne M, Sung H, Ferlay J,
Siegel RL, Soerjomataram I and Jemal A: Global cancer statistics
2022: GLOBOCAN estimates of incidence and mortality worldwide for
36 cancers in 185 countries. CA Cancer J Clin. 74:229–263.
2024.PubMed/NCBI
|
|
2
|
Li M, He H, Zhao X, Guan M, Khattab N,
Elshishiney G, You H and Hu Y: Trends in burden of liver cancer and
underlying etiologies in China, 1990-2021. Lancet Regional
Health-Western Pacific. 55:1013852025. View Article : Google Scholar
|
|
3
|
Rumgay H, Arnold M, Ferlay J, Lesi O,
Cabasag CJ, Vignat J, Laversanne M, McGlynn KA and Soerjomataram I:
Global burden of primary liver cancer in 2020 and predictions to
2040. J Hepatol. 77:1598–1606. 2022. View Article : Google Scholar : PubMed/NCBI
|
|
4
|
Villanueva A: Hepatocellular carcinoma. N
Engl J Med. 380:1450–1462. 2019. View Article : Google Scholar : PubMed/NCBI
|
|
5
|
Singal AG, Kanwal F and Llovet JM: Global
trends in hepatocellular carcinoma epidemiology: Implications for
screening, prevention and therapy. Nat Rev Clin Oncol. 20:864–884.
2023. View Article : Google Scholar : PubMed/NCBI
|
|
6
|
Zhang H, Zhang W, Jiang L and Chen Y:
Recent advances in systemic therapy for hepatocellular carcinoma.
Biomark Res. 10:32022. View Article : Google Scholar : PubMed/NCBI
|
|
7
|
Llovet JM, Ricci S, Mazzaferro V, Hilgard
P, Gane E, Blanc JF, de Oliveira AC, Santoro A, Raoul JL, Forner A,
et al: Sorafenib in advanced hepatocellular carcinoma. N Engl J
Med. 359:378–390. 2008. View Article : Google Scholar : PubMed/NCBI
|
|
8
|
Guo L, Hu C, Yao M and Han G: Mechanism of
sorafenib resistance associated with ferroptosis in HCC. Front
Pharmacol. 14:12074962023. View Article : Google Scholar : PubMed/NCBI
|
|
9
|
Dixon SJ, Patel DN, Welsch M, Skouta R,
Lee ED, Hayano M, Thomas AG, Gleason CE, Tatonetti NP, Slusher BS,
et al: Pharmacological inhibition of cystine-glutamate exchange
induces endoplasmic reticulum stress and ferroptosis. eLife.
3:e025232014. View Article : Google Scholar : PubMed/NCBI
|
|
10
|
Jurisic V, Bumbasirevic V, Konjevic G,
Djuricic B and Spuzic I: TNF-alpha induces changes in LDH isotype
profile following triggering of apoptosis in PBL of non-Hodgkin's
lymphomas. Ann Hematol. 83:84–91. 2004. View Article : Google Scholar
|
|
11
|
Dixon SJ, Lemberg KM, Lamprecht MR, Skouta
R, Zaitsev EM, Gleason CE, Patel DN, Bauer AJ, Cantley AM, Yang WS,
et al: Ferroptosis: An iron-dependent form of nonapoptotic cell
death. Cell. 149:1060–1072. 2012. View Article : Google Scholar : PubMed/NCBI
|
|
12
|
Stockwell BR, Friedmann Angeli JP, Bayir
H, Bush AI, Conrad M, Dixon SJ, Fulda S, Gascon S, Hatzios SK,
Kagan VE, et al: Ferroptosis: A regulated cell death nexus linking
metabolism, redox biology, and disease. Cell. 171:273–285. 2017.
View Article : Google Scholar : PubMed/NCBI
|
|
13
|
Zhou Q, Meng Y, Li D, Yao L, Le J, Liu Y,
Sun Y, Zeng F, Chen X and Deng G: Ferroptosis in cancer: From
molecular mechanisms to therapeutic strategies. Signal Transduct
Target Ther. 9:552024. View Article : Google Scholar : PubMed/NCBI
|
|
14
|
Fulda S, Galluzzi L and Kroemer G:
Targeting mitochondria for cancer therapy. Nat Rev Drug Discov.
9:447–464. 2010. View Article : Google Scholar : PubMed/NCBI
|
|
15
|
Wallace DC: Mitochondria and cancer. Nat
Rev Cancer. 12:685–698. 2012. View Article : Google Scholar : PubMed/NCBI
|
|
16
|
Eckl EM, Ziegemann O, Krumwiede L, Fessler
E and Jae LT: Sensing, signaling and surviving mitochondrial
stress. Cell Mol Life Sci. 78:5925–5951. 2021. View Article : Google Scholar : PubMed/NCBI
|
|
17
|
Kasahara A and Scorrano L: Mitochondria:
From cell death executioners to regulators of cell differentiation.
Trends Cell Biol. 24:761–770. 2014. View Article : Google Scholar : PubMed/NCBI
|
|
18
|
Senft D and Ronai ZA: Regulators of
mitochondrial dynamics in cancer. Curr Opin Cell Biol. 39:43–52.
2016. View Article : Google Scholar : PubMed/NCBI
|
|
19
|
Kashatus JA, Nascimento A, Myers LJ, Sher
A, Byrne FL, Hoehn KL, Counter CM and Kashatus DF: Erk2
phosphorylation of Drp1 promotes mitochondrial fission and
MAPK-driven tumor growth. Mol Cell. 57:537–551. 2015. View Article : Google Scholar : PubMed/NCBI
|
|
20
|
Bianchi NO, Bianchi MS and Richard SM:
Mitochondrial genome instability in human cancers. Mutat Res.
488:9–23. 2001. View Article : Google Scholar : PubMed/NCBI
|
|
21
|
Yang Y, Karakhanova S, Hartwig W, D'Haese
JG, Philippov PP, Werner J and Bazhin AV: Mitochondria and
mitochondrial ROS in cancer: Novel targets for anticancer therapy.
J Cell Physiol. 231:2570–2581. 2016. View Article : Google Scholar : PubMed/NCBI
|
|
22
|
Leao Barros MB, Pinheiro DDR and Borges
BDN: Mitochondrial DNA Alterations in Glioblastoma (GBM). Int J Mol
Sci. 22:58552021. View Article : Google Scholar : PubMed/NCBI
|
|
23
|
Arakaki N, Nishihama T, Kohda A, Owaki H,
Kuramoto Y, Abe R, Kita T, Suenaga M, Himeda T, Kuwajima M, et al:
Regulation of mitochondrial morphology and cell survival by
Mitogenin I and mitochondrial single-stranded DNA binding protein.
Biochim Biophys Acta. 1760:1364–1372. 2006. View Article : Google Scholar : PubMed/NCBI
|
|
24
|
Oliveira MT and Kaguni LS: Functional
roles of the N- and C-terminal regions of the human mitochondrial
single-stranded DNA-binding protein. PLoS One. 5:e153792010.
View Article : Google Scholar : PubMed/NCBI
|
|
25
|
Li Y, Bolderson E, Kumar R, Muniandy PA,
Xue Y, Richard DJ, Seidman M, Pandita TK, Khanna KK and Wang W:
HSSB1 and hSSB2 form similar multiprotein complexes that
participate in DNA damage response. J Biol Chem. 284:23525–23531.
2009. View Article : Google Scholar : PubMed/NCBI
|
|
26
|
Zelinger L and Swaroop A: SSBP1 faux pas
in mitonuclear tango causes optic neuropathy. J Clin Invest.
130:62–64. 2020. View Article : Google Scholar :
|
|
27
|
Wang Y, Hu L, Zhang X, Zhao H, Xu H, Wei
Y, Jiang H, Xie C, Zhou Y and Zhou F: Downregulation of
mitochondrial single stranded DNA binding protein (SSBP1) induces
mitochondrial dysfunction and increases the radiosensitivity in
Non-small cell lung cancer cells. J Cancer. 8:1400–1409. 2017.
View Article : Google Scholar : PubMed/NCBI
|
|
28
|
Su J and Li Y, Liu Q, Peng G, Qin C and Li
Y: Identification of SSBP1 as a ferroptosis-related biomarker of
glioblastoma based on a novel mitochondria-related gene risk model
and in vitro experiments. J Transl Med. 20:4402022. View Article : Google Scholar : PubMed/NCBI
|
|
29
|
Zhang T, Cui Y, Wu Y, Meng J, Han L, Zhang
J, Zhang C, Yang C, Chen L, Bai X, et al: Mitochondrial GCN5L1
regulates glutaminase acetylation and hepatocellular carcinoma.
Clin Transl Med. 12:e8522022. View Article : Google Scholar : PubMed/NCBI
|
|
30
|
Cancer Genome Atlas Research Network:
Electronic address: wheeler@bcm.edu; Cancer Genome Atlas Research
Network: Comprehensive and integrative genomic characterization of
hepatocellular carcinoma. Cell. 169:1327–1341.23. 2017. View Article : Google Scholar
|
|
31
|
Rath S, Sharma R, Gupta R, Ast T, Chan C,
Durham TJ, Goodman RP, Grabarek Z, Haas ME, Hung WHW, et al:
MitoCarta3.0: An updated mitochondrial proteome now with
sub-organelle localization and pathway annotations. Nucleic Acids
Res. 49:D1541–D1547. 2021. View Article : Google Scholar :
|
|
32
|
Zhou X, Liu C, Zeng H, Wu D and Liu L:
Identification of a thirteen-gene signature predicting overall
survival for hepatocellular carcinoma. Biosci Rep.
41:BSR202028702021. View Article : Google Scholar : PubMed/NCBI
|
|
33
|
Zhou Y, Zhou B, Pache L, Chang M,
Khodabakhshi AH, Tanaseichuk O, Benner C and Chanda SK: Metascape
provides a biologist-oriented resource for the analysis of
systems-level datasets. Nat Commun. 10:15232019. View Article : Google Scholar : PubMed/NCBI
|
|
34
|
Roessler S, Jia HL, Budhu A, Forgues M, Ye
QH, Lee JS, Thorgeirsson SS, Sun Z, Tang ZY, Qin LX, et al: A
unique metastasis gene signature enables prediction of tumor
relapse in early-stage hepatocellular carcinoma patients. Cancer
Res. 70:10202–10212. 2010. View Article : Google Scholar : PubMed/NCBI
|
|
35
|
Sun Q, Liu P, Long B, Zhu Y and Liu T:
Screening of significant biomarkers with poor prognosis in
hepatocellular carcinoma via bioinformatics analysis. Medicine
(Baltimore). 99:e217022020. View Article : Google Scholar : PubMed/NCBI
|
|
36
|
Vazquez Salgado AM, Preziosi ME, Yin D,
Holczbauer A, Zahm AM, Erez N, Kieckhaefer J, Ackerman D, Gade TP,
Kaestner KH, et al: In vivo screen identifies liver X receptor
alpha agonism potentiates sorafenib killing of hepatocellular
carcinoma. Gastro Hep Adv. 1:905–908. 2022. View Article : Google Scholar : PubMed/NCBI
|
|
37
|
van Malenstein H, Dekervel J, Verslype C,
Van Cutsem E, Windmolders P, Nevens F and van Pelt J: Long-term
exposure to sorafenib of liver cancer cells induces resistance with
epithelial-to-mesenchymal transition, increased invasion and risk
of rebound growth. Cancer Lett. 329:74–83. 2013. View Article : Google Scholar
|
|
38
|
Barrett T, Wilhite SE, Ledoux P,
Evangelista C, Kim IF, Tomashevsky M, Marshall KA, Phillippy KH,
Sherman PM, Holko M, et al: NCBI GEO: Archive for functional
genomics data sets-update. Nucleic Acids Res. 41:D991–D995. 2013.
View Article : Google Scholar
|
|
39
|
Li T, Fu J, Zeng Z, Cohen D, Li J, Chen Q,
Li B and Liu XS: TIMER2.0 for analysis of tumor-infiltrating immune
cells. Nucleic Acids Res. 48:W509–W514. 2020. View Article : Google Scholar : PubMed/NCBI
|
|
40
|
Chandrashekar DS, Bashel B, Balasubramanya
SAH, Creighton CJ, Ponce-Rodriguez I, Chakravarthi B and Varambally
S: UALCAN: A portal for facilitating tumor subgroup gene expression
and survival analyses. Neoplasia. 19:649–658. 2017. View Article : Google Scholar : PubMed/NCBI
|
|
41
|
Gyorffy B: Integrated analysis of public
datasets for the discovery and validation of survival-associated
genes in solid tumors. Innovation (Camb). 5:1006252024.PubMed/NCBI
|
|
42
|
Livak KJ and Schmittgen TD: Analysis of
relative gene expression data using real-time quantitative PCR and
the 2(−Delta Delta C(T)) method. Methods. 25:402–408. 2001.
View Article : Google Scholar
|
|
43
|
Radenkovic S, Konjevic G, Gavrilovic D,
Stojanovic-Rundic S, Plesinac-Karapandzic V, Stevanovic P and
Jurisic V: pSTAT3 expression associated with survival and
mammographic density of breast cancer patients. Pathol Res Pract.
215:366–372. 2019. View Article : Google Scholar : PubMed/NCBI
|
|
44
|
Hu X, Zhang P, Li S, Zhang J, Wang D, Wang
Z, Zhu L and Wang L: Mitochondrial GCN5L1 acts as a novel regulator
for iron homeostasis to promote sorafenib sensitivity in
hepatocellular carcinoma. J Transl Med. 22:5932024. View Article : Google Scholar : PubMed/NCBI
|
|
45
|
Scherbakov AM, Vorontsova SK, Khamidullina
AI, Mrdjanovic J, Andreeva OE, Bogdanov FB, Salnikova DI, Jurisic
V, Zavarzin IV and Shirinian VZ: Novel pentacyclic derivatives and
benzylidenes of the progesterone series cause anti-estrogenic and
antiproliferative effects and induce apoptosis in breast cancer
cells. Invest New Drugs. 41:142–152. 2023. View Article : Google Scholar : PubMed/NCBI
|
|
46
|
Radenkovic N, Milutinovic M, Nikodijevic
D, Jovankic J and Jurisic V: Sample preparation of adherent cell
lines for flow cytometry: Protocol optimization-our experience with
SW-480 colorectal cancer cell line. Indian J Clin Biochem.
40:74–79. 2025. View Article : Google Scholar
|
|
47
|
Hernansanz-Agustin P and Enriquez JA:
Generation of reactive oxygen species by mitochondria. Antioxidants
(Basel). 10:4152021. View Article : Google Scholar : PubMed/NCBI
|
|
48
|
Sun K, Zhi Y, Ren W, Li S, Zhou X, Gao L
and Zhi K: The mitochondrial regulation in ferroptosis signaling
pathway and its potential strategies for cancer. Biomed
Pharmacother. 169:1158922023. View Article : Google Scholar : PubMed/NCBI
|
|
49
|
Llovet JM, Kelley RK, Villanueva A, Singal
AG, Pikarsky E, Roayaie S, Lencioni R, Koike K, Zucman-Rossi J and
Finn RS: Hepatocellular carcinoma. Nat Rev Dis Primers. 7:62021.
View Article : Google Scholar : PubMed/NCBI
|
|
50
|
Huang J and Xie ZF: Identification of
SSBP1 as a prognostic marker in human lung adenocarcinoma using
bioinformatics approaches. Math Biosci Eng. 19:3022–3035. 2022.
View Article : Google Scholar : PubMed/NCBI
|
|
51
|
Li Q, Qu F, Li R, He X, Zhai Y, Chen W and
Zheng Y: A functional polymorphism of SSBP1 gene predicts prognosis
and response to chemotherapy in resected gastric cancer patients.
Oncotarget. 8:110861–110876. 2017. View Article : Google Scholar
|
|
52
|
Xu S, Feng Z, Zhang M, Wu Y, Sang Y, Xu H,
Lv X, Hu K, Cao J, Zhang R, et al: hSSB1 binds and protects p21
from ubiquitin-mediated degradation and positively correlates with
p21 in human hepatocellular carcinomas. Oncogene. 30:2219–2229.
2011. View Article : Google Scholar : PubMed/NCBI
|
|
53
|
Ohmori M, Ohta M, Shimura H, Shimurat Y,
Suzuki K and Kohn LD: Cloning of the single strand DNA-binding
protein important for maximal expression and thyrotropin
(TSH)-induced negative regulation of the TSH receptor. Mol
Endocrinol. 10:1407–1424. 1996.PubMed/NCBI
|
|
54
|
Yang X, Ma B, Liu Y, Zhou J, Guo J, Peng
Y, Bai Y, Wu J and Hu D: SSBP1 positively regulates RRM2, affecting
epithelial mesenchymal transition and cell cycle arrest in human
lung adenocarcinoma cells. Cell Signal. 127:1115522025. View Article : Google Scholar
|
|
55
|
Morin JA, Cerron F, Jarillo J,
Beltran-Heredia E, Ciesielski GL, Arias-Gonzalez JR, Kaguni LS, Cao
FJ and Ibarra B: DNA synthesis determines the binding mode of the
human mitochondrial single-stranded DNA-binding protein. Nucleic
Acids Res. 45:7237–7248. 2017. View Article : Google Scholar : PubMed/NCBI
|
|
56
|
Richard DJ, Bolderson E, Cubeddu L,
Wadsworth RI, Savage K, Sharma GG, Nicolette ML, Tsvetanov S,
McIlwraith MJ, Pandita RK, et al: Single-stranded DNA-binding
protein hSSB1 is critical for genomic stability. Nature.
453:677–681. 2008. View Article : Google Scholar : PubMed/NCBI
|
|
57
|
Sykora P, Kanno S, Akbari M, Kulikowicz T,
Baptiste BA, Leandro GS, Lu H, Tian J, May A, Becker KA, et al: DNA
Polymerase beta participates in mitochondrial DNA repair. Mol Cell
Biol. 37:e00237–17. 2017. View Article : Google Scholar : PubMed/NCBI
|
|
58
|
Zhang S, Guo H, Wang H, Liu X, Wang M, Liu
X, Fan Y and Tan K: A novel mitochondrial unfolded protein
response-related risk signature to predict prognosis, immunotherapy
and sorafenib sensitivity in hepatocellular carcinoma. Apoptosis.
29:768–784. 2024. View Article : Google Scholar : PubMed/NCBI
|
|
59
|
Ye Y, Huang A, Huang C, Liu J, Wang B, Lin
K, Chen Q, Zeng Y, Chen H, Tao X, et al: Comparative mitochondrial
proteomic analysis of hepatocellular carcinoma from patients.
Proteomics Clin Appl. 7:403–415. 2013. View Article : Google Scholar : PubMed/NCBI
|
|
60
|
Wu WY, Wang ZX, Li TS, Ding XQ, Liu ZH,
Yang J, Fang L and Kong LD: SSBP1 drives high fructose-induced
glomerular podocyte ferroptosis via activating DNA-PK/p53 pathway.
Redox Biol. 52:1023032022. View Article : Google Scholar : PubMed/NCBI
|
|
61
|
Jurisic V, Bogdanovic G, Srdic T, Jakimov
D, Mrdjanovic J, Baltic M and Baltic VV: Modulation of TNF-alpha
activity in tumor PC cells using anti-CD45 and anti-CD95 monoclonal
antibodies. Cancer Lett. 214:55–61. 2004. View Article : Google Scholar : PubMed/NCBI
|
|
62
|
Tang D, Kang R, Berghe TV, Vandenabeele P
and Kroemer G: The molecular machinery of regulated cell death.
Cell Res. 29:347–364. 2019. View Article : Google Scholar : PubMed/NCBI
|
|
63
|
Li D, Wang Y, Dong C, Chen T, Dong A, Ren
J, Li W, Shu G, Yang J, Shen W, et al: CST1 inhibits ferroptosis
and promotes gastric cancer metastasis by regulating GPX4 protein
stability via OTUB1. Oncogene. 42:83–98. 2023. View Article : Google Scholar :
|
|
64
|
Li H, Yu K, Hu H, Zhang X, Zeng S, Li J,
Dong X, Deng X, Zhang J and Zhang Y: METTL17 coordinates
ferroptosis and tumorigenesis by regulating mitochondrial
translation in colorectal cancer. Redox Biol. 71:1030872024.
View Article : Google Scholar : PubMed/NCBI
|
|
65
|
Yuan S, Xi S, Weng H, Guo MM, Zhang JH, Yu
ZP, Zhang H, Yu Z, Xing Z, Liu MY, et al: YTHDC1 as a tumor
progression suppressor through modulating FSP1-dependent
ferroptosis suppression in lung cancer. Cell Death Differ.
30:2477–2490. 2023. View Article : Google Scholar : PubMed/NCBI
|
|
66
|
Lachaier E, Louandre C, Godin C, Saidak Z,
Baert M, Diouf M, Chauffert B and Galmiche A: Sorafenib induces
ferroptosis in human cancer cell lines originating from different
solid tumors. Anticancer Res. 34:6417–6422. 2014.PubMed/NCBI
|
|
67
|
Li Y, Xia J, Shao F, Zhou Y, Yu J, Wu H,
Du J and Ren X: Sorafenib induces mitochondrial dysfunction and
exhibits synergistic effect with cysteine depletion by promoting
HCC cells ferroptosis. Biochem Biophys Res Commun. 534:877–884.
2021. View Article : Google Scholar
|
|
68
|
Louandre C, Marcq I, Bouhlal H, Lachaier
E, Godin C, Saidak Z, Francois C, Chatelain D, Debuysscher V,
Barbare JC, et al: The retinoblastoma (Rb) protein regulates
ferroptosis induced by sorafenib in human hepatocellular carcinoma
cells. Cancer Lett. 356:971–977. 2015. View Article : Google Scholar
|
|
69
|
Guo M, Chen S, Sun J, Xu R, Qi Z, Li J,
Zhou L, Fang Y, Liu T and Xia J: PIP5K1A suppresses ferroptosis and
induces sorafenib resistance by stabilizing NRF2 in hepatocellular
carcinoma. Adv Sci (Weinh). e043722025. View Article : Google Scholar : Epub ahead of
print. View Article : Google Scholar : PubMed/NCBI
|
|
70
|
Zhao X, Yu M, Zhao Y, Zheng Y, Meng L, Du
K, Xie Z, Lv H, Zhang W, Liu J, et al: Circulating cell-free mtDNA
release is associated with the activation of cGAS-STING pathway and
inflammation in mitochondrial diseases. J Neurol. 269:4985–4996.
2022. View Article : Google Scholar : PubMed/NCBI
|
|
71
|
Tan K, Fujimoto M, Takii R, Takaki E,
Hayashida N and Nakai A: Mitochondrial SSBP1 protects cells from
proteotoxic stresses by potentiating stress-induced HSF1
transcriptional activity. Nat Commun. 6:65802015. View Article : Google Scholar : PubMed/NCBI
|